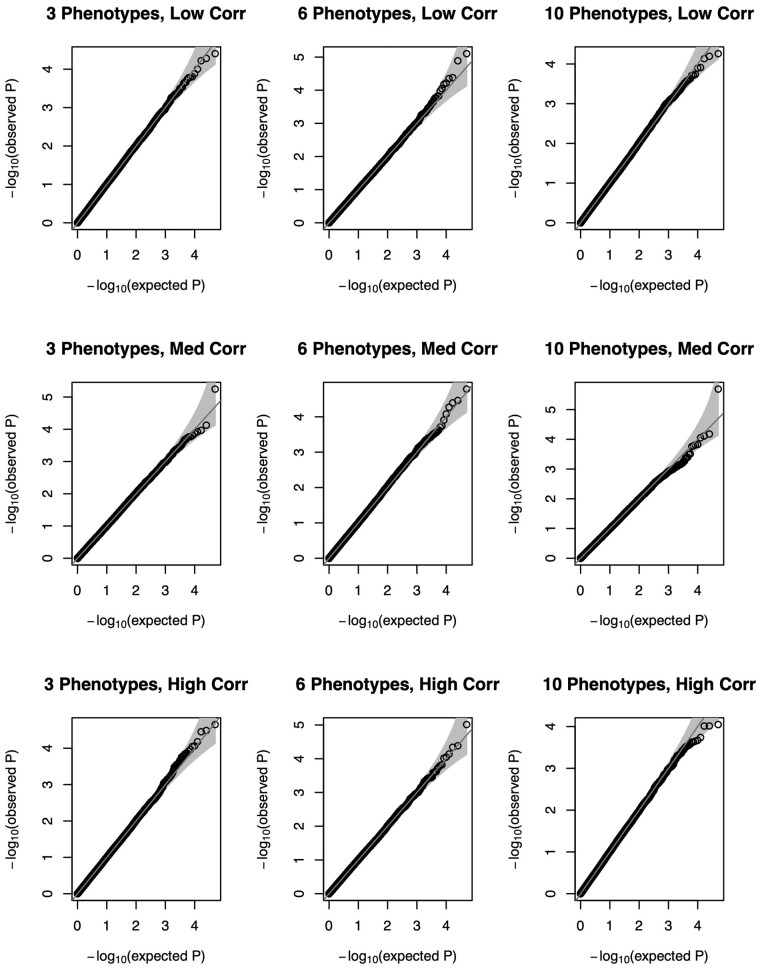
Figure 1.
QQ plots of P-values for proposed parent-of-origin effect test under the null hypothesis using a series of 50 000 simulations of 5000 individuals using 3 (left column), 6 (middle column), or 10 (right column) continuous normal phenotypes. MAF is assumed to be 0.25. Horizontal panels depict level of pairwise-trait correlation (low, medium, high). QQ, quantile–quantile; MAF, minor allele frequency.

