

Abstract
The use of probiotics by cancer patients is increasing, including among those undergoing immune checkpoint inhibitor treatment (ICI). Here, we elucidate a critical microbial-host crosstalk between probiotic-released aryl hydrocarbon receptor (AhR) agonist, indole-3-aldehyde (I3A), and CD8 T cells within the tumor microenvironment that potently enhances antitumor immunity and facilitates ICI in preclinical melanoma. Our study reveals that probiotic Lactobacillus reuteri (Lr) translocates to, colonizes, and persists within melanoma, where via its released dietary tryptophan catabolite I3A, it locally promotes interferon-γ-producing CD8 T cells, thereby bolstering ICI. Moreover, Lr-secreted I3A was both necessary and sufficient to drive antitumor immunity, and loss of AhR signaling within CD8 T cells abrogated Lr’s antitumor effects. Further, a tryptophan-enriched diet potentiated both Lr- and ICI-induced antitumor immunity, dependent on CD8 T cell AhR signaling. Finally, we provide evidence for a potential role of I3A in promoting ICI efficacy and survival in advanced melanoma patients.
Keywords: melanoma, immune checkpoint inhibitor, aryl hydrocarbon receptor, Lactobacillus reuteri, indole-3-aldehyde, tryptophan, microbial AhR ligands, tumor microbiome, microbial-host crosstalk
Graphical Abstract

In Brief
Lactobacillus reuteri bacteria can migrate into a melanoma tumor where they release a metabolite that enhances antitumor immune responses and improves the efficacy of immune checkpoint inhibitor treatment.
Reinvigorating antitumor immunity by immune checkpoint inhibitor treatment (ICI) is a core component of cancer therapy that has shown unprecedented efficacy in a fraction of cancer patients1–4. While the blockade of inhibitory T cell receptors, such as programmed cell death-1 (PD-1) or its ligand PD-L1, unleashes antitumor T cell responses5,6 and displays potent clinical efficacy, only 40% of melanoma patients respond to treatment7. Therefore, approaches that further potentiate antitumor immunity are needed to boost ICI efficacy. Endogenous factors, such as tumor antigen presentation8, tumor mutational burden9, and exogenous factors including microbiome composition10–16 and probiotic consumption17 modulate ICI efficacy. Cancer patients are increasingly interested in using probiotics to augment health18: a recent report found almost half of its cohort of advanced melanoma patients initiating cancer immunotherapy treatment self-administered probiotics17. Interestingly, while several studies report a beneficial role of probiotic Bifidobacterium in promoting ICI therapy10,13, a recent study found probiotic Bifidobacterium and Lactobacillus rhamnosus to restrain ICI efficacy in preclinical melanoma17. Thus, the impact of probiotics on ICI responsiveness in cancer patients, as well as the mechanisms that drive these effects, remain poorly understood.
In this study, we sought to test whether some of the most frequently used probiotics impact tumor outgrowth in preclinical melanoma. Furthermore, we explored the host-microbial crosstalk that enables the most potent tumor-suppressing strain to increase ICI efficacy and interrogated the clinical relevance of our findings in a cohort of advanced melanoma patients.
Lactobacillus reuteri induces antitumor immunity and promotes ICI in preclinical melanoma
We used a preclinical melanoma model to test the antitumor potential of four frequently used probiotic bacteria Bifidobacterium longum (Bl), Lactobacillus reuteri (Lr), Lactobacillus johnsonii (Lj) and Escherichia coli (Ec)19. Given antibiotic (ABX) treatment negatively impacts responses to cancer immunotherapy11,12,16,20 and probiotics are typically supplemented daily19, we treated non-ABX-treated specific pathogen–free (SPF) mice with selected bacterial taxa via daily oral gavage. We found daily oral administration of Bl, Ec, or Lr starting one day post B16-F0 tumor cell engraftment efficiently restrained melanoma growth (Figures 1A and B) and increased survival (Figure 1C) in C57BL/6 wild type (WT) mice relative to vehicle control. Interestingly, Lj failed to mediate tumor suppression, indicating the ability of commensals to suppress tumor growth is species specific. The tumor suppressive effect of Bl is in line with findings by others10. Intriguingly, Lr induced significant tumor suppression relative to both Bl and Ec. Hypothesizing that the underlying mechanisms by which these phylogenetically different probiotic bacteria promote tumor suppression are distinct, we set out to explore the mechanism of how Lr, the gut commensal and probiotic with the most potent tumor suppressive ability in our model, restrains melanoma outgrowth.
Figure 1. Lr potentiates ICI efficacy in melanoma via inducing IFNγ-producing CD8 T (Tc1) cells.
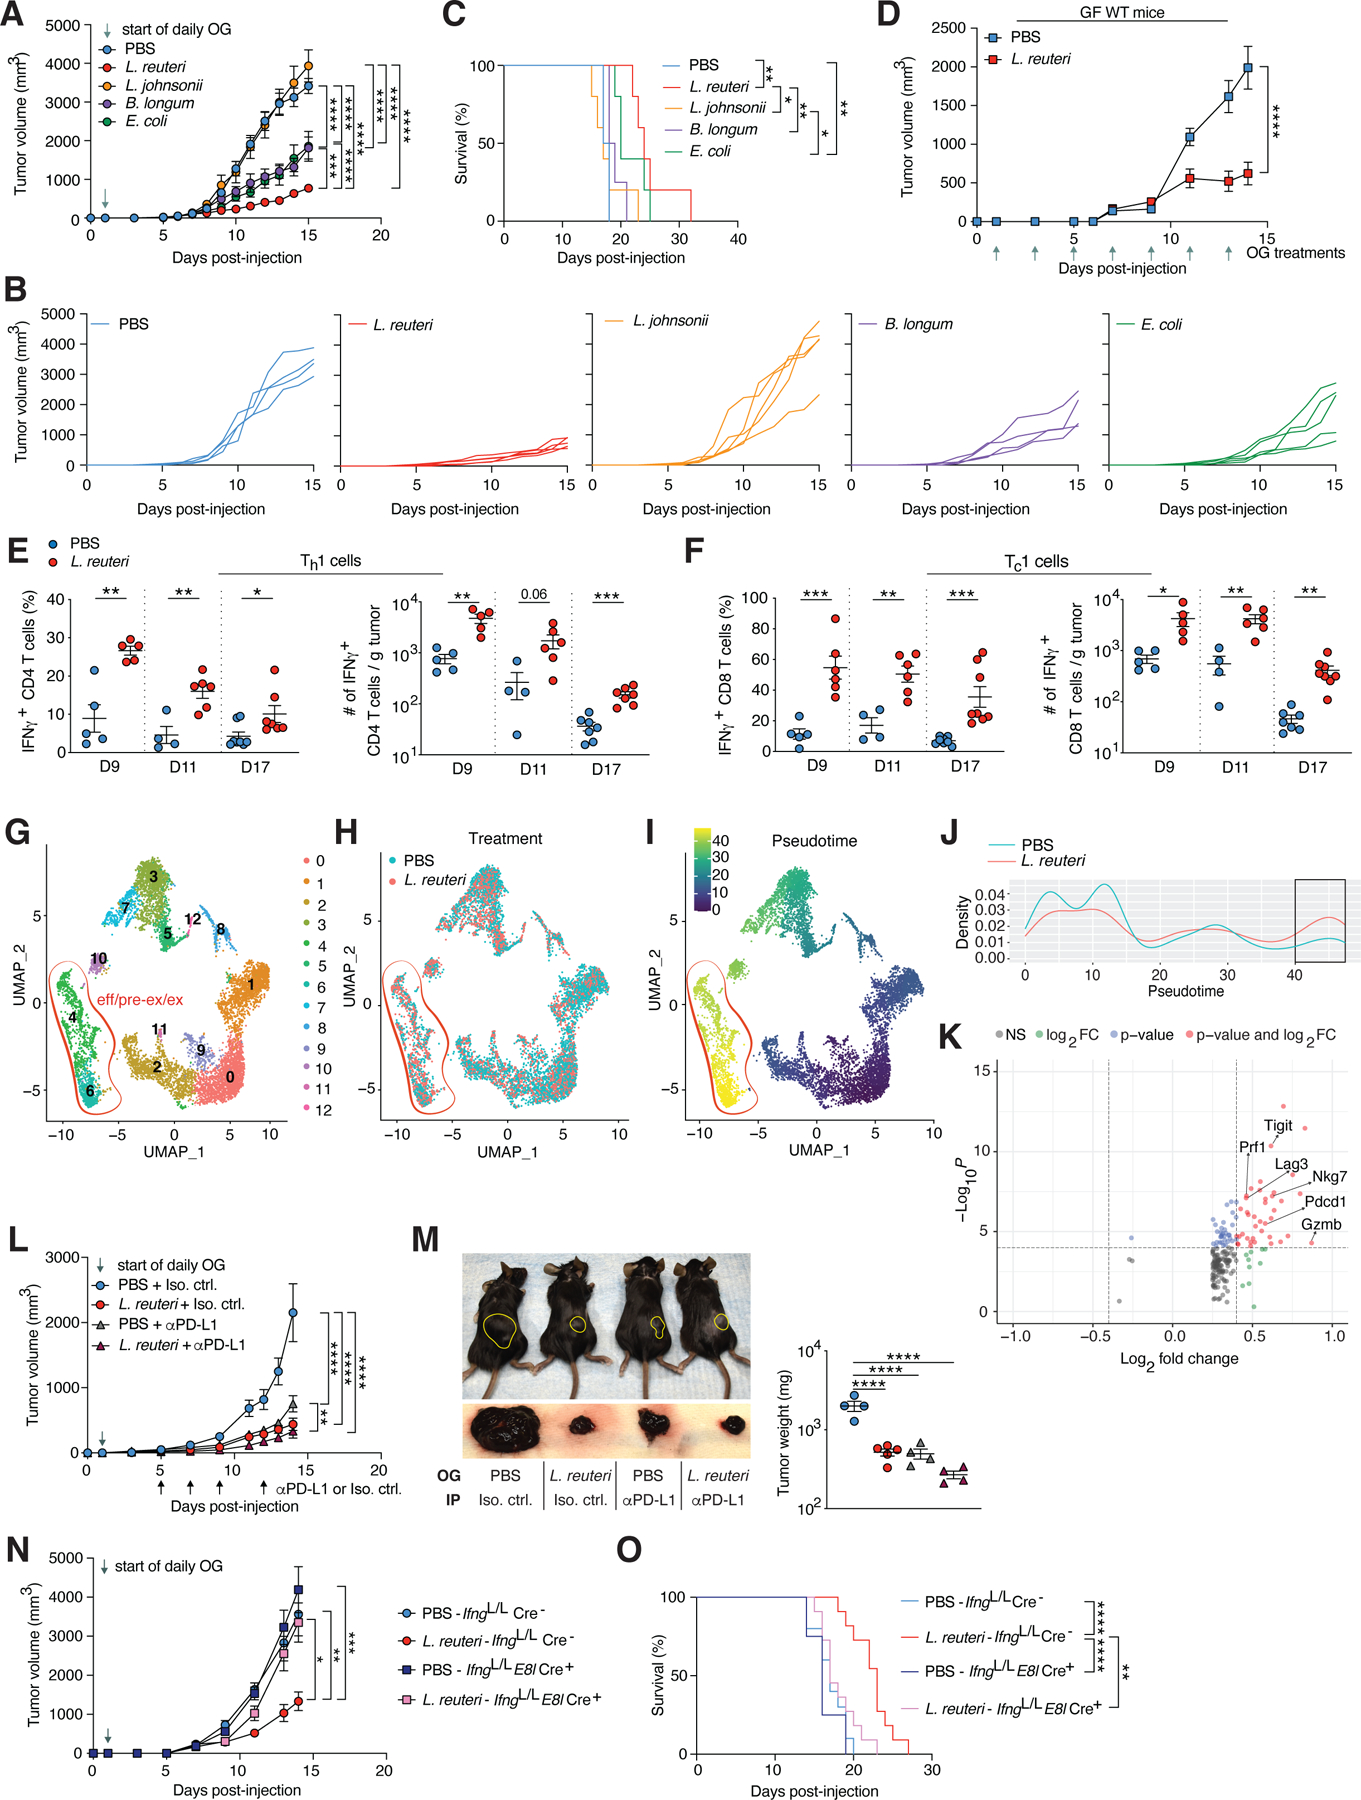
(A-C) B16-F0-tumor-bearing wild type (WT) mice administered daily oral gavage (OG) of Lr, Lji, Bl, Ec, or vehicle control (PBS), starting one day (D1) post tumor cell engraftment (pTCE) (n = 4–5 mice/group). (A) Tumor growth. (B) Individual tumor growth. (C) Survival. (D) Tumor growth of germ-free (GF) mice orally administered Lr or PBS every other day starting D1 pTCE (n = 4 mice/group). (E and F) Percentage (left) and total cells/gram (g) tumor tissue (right) of IFNγ+ CD4 T cells (Th1 cells) (E) and IFNγ+ CD8 T cells (Tc1 cells) (F) within the tumor microenvironment (TME) of mice orally administered Lr or PBS; see schematic in Figure S2A (n = 5–8 mice/group). (G-K) Single-cell RNA-sequencing analysis of TME TCRβ+ CD8 T cells on D15 from mice orally administered Lr or PBS daily starting D1 pTCE (n=4 mice/group). Red outlines in (G, H, and I) outline effector/pre-exhausted/exhausted CD8 T cell clusters 4 and 6. (G) Unsupervised hierarchical clustering and uniform manifold approximation and projection (UMAP). (H) Distribution of cells by treatment group. (I) Trajectory analysis showing overall pseudotime plot. (J) Quantification of pseudotime plot comparison by treatment group. Black rectangle outlines the eff/pre-ex/ex CD8 T cell cluster from (I). (K) Differential gene expression analysis by negbinom testing, representative effector and exhaustion markers indicated; FC, fold change. (L and M) B16-F0-tumor-bearing mice treated with Lr or PBS and αPD-L1 or isotype control (Iso. ctrl.) as indicated (n = 4–5 mice/group). (L) Tumor growth. (M) (Left) representative mouse images (top) and their respective tumors (bottom); (right) tumor weights on D14. Yellow outline designates tumors. (N and O) B16-F0-tumor-bearing mice orally administered Lr or PBS as indicated (n = 8–11 mice/group). (N) Tumor growth. (O) Survival. See also Figures S1–S4. (A, D, L, and N) represent mean ± SEM analyzed by two-way analysis of variance (ANOVA) with Sidak’s correction for multiple comparisons. (C and O) represent survival curves analyzed by log-rank test. (E and F) represent individual mice analyzed by unpaired t-test for each day. Mean ± SEM shown. (M) represents individual mice analyzed by one-way ANOVA with Sidak’s correction for multiple comparisons. Mean ± SEM shown. *P < 0.05, **P < 0.01, ***P < 0.001, ****P < 0.0001.
Implying therapeutic Lr treatment effectively restrains tumor growth, we found oral administration of Lr was capable of significantly suppressing tumor outgrowth and prolonging survival in mice post palpable tumor establishment (Figures S1A and S1B). In line with the finding that Lr colonized the small intestine of a healthy human cohort administered probiotic Lr21, daily oral administration of Lr led to a significant increase in the relative abundance within the small intestine, but neither the cecum nor colon (Figure S1C). Given Lr treatment-induced gut dysbiosis could play a role in our model, we performed 16S rRNA sequencing analysis of small intestinal and cecal DNA derived from PBS and Lr gavaged tumor-bearing mice. Lr gavage induced a significant expansion of Lactobacilli in the small intestine (Figures S1D–S1G), yet failed to substantially affect the overall composition of the intestinal microbiome (Figures S1H–S1K). Concordantly, we found Lr suppressed melanoma growth independent of a pre-established microbiome in germ-free melanoma-bearing mice (Figure 1D).
We next assessed the systemic immunoregulatory consequences of Lr administration throughout tumor development via profiling the immune response at an early (day 9 (D9) post tumor cell engraftment (pTCE)), intermediate (D11 pTCE), and late (D17 pTCE) timepoint via flow cytometry (Figure S2A). We found at all timepoints assessed, Lr treatment skews the tumor microenvironment (TME) towards an antitumorigenic, immunostimulatory environment, characterized by an expansion of interferon-γ (IFNγ)-producing CD4 Th1 and CD8 Tc1 cells (Figures 1E and 1F) that actively proliferate, evidenced by their Ki67 expression (Figures S2B and S2C). Furthermore, tumor-infiltrating Th1 and Tc1 cells of Lr-treated mice demonstrated a significant increase in cytotoxic Granzyme B (GzmB) production (Figures S2D and S2E). Interestingly, Lr treatment failed to impact the frequency of Foxp3+ regulatory T cells (Tregs) (Figure S2F), yet led to an expansion of IFNγ+ Tregs at D17 pTCE (Figure S2G). Notably, Lr treatment was insufficient to promote effector T cell function within the spleen (Figures S2H–S2M) or small intestinal lamina propria (Figures S2N and S2O), which lies adjacent to its natural niche, indicating Lr mediates effector T cell responses selectively within the TME.
While Lr treatment affected the frequency and/or absolute number of certain innate immune cells (Figures S3A–S3F), these changes were inconsistent, and most importantly insufficient to induce tumor suppression in the absence of adaptive immunity (Figure S3G). Furthermore, in vivo depletion studies revealed that CD8, but not CD4, T cells are required for Lr-mediated tumor suppression (Figure S3H). Additionally, adoptive transfer of TCRβ+ CD8 T cells into Rag−/− mice sufficiently rescued Lr-mediated tumor suppression and prolonged survival, confirming CD8 T cells as a necessary driver (Figures S3I and S3J).
To fully characterize the impact of Lr on tumor-infiltrating CD8 T cells, we performed single-cell RNA-sequencing analysis of CD8 T cells derived from the TME. Unsupervised clustering identified 13 distinct CD8 T cell clusters, including naïve (clusters 0 and 1), memory (clusters 3, 8, and 12) and proliferating, cytotoxic, pre-exhausted/exhausted effector (predominately clusters 4 and 6) subsets (Figures 1G and S4A, Table S1, Table S2). Pseudotemporal and differential gene expression analysis22 confirmed Lr treatment skews the cell distribution towards a cytotoxic effector profile (Figures 1H–1K, S4B, Table S2). The finding that Lr treatment led to a significant enrichment in the expression of inhibitory T cell receptors Tigit, Pdcd1, and Lag3 in tumor-infiltrating CD8 T cells (Figure 1K), in concert with the observation that human melanoma-infiltrating PD1-expressing CD8 T cells are positive predictive biomarkers for αPD1 therapy23, prompted us to assess the role of Lr in potentiating ICI. Indeed, mice who received combinatorial treatment with Lr and αPD-L1 showed significantly improved tumor control (Figures 1L and 1M) and the most pronounced TME Tc1 response (Figure S4C). This additive effect was also seen in the delayed Lr treatment therapeutic model (Figure S4D), confirming Lr’s ability to potentiate ICI. Importantly, combinatorial treatment with Lr and α-CTLA-4 also resulted in an additive effect, suggesting Lr may facilitate responses to various ICIs (Figure S4E).
The finding that Lr induces an expansion of Tc1 cells, in conjunction with the key role of Tc1 cells in ICI, prompted us to test the requirement of IFNγ-producing CD8 T cells in Lr-mediated antitumor immunity. Indeed, Lr failed to suppress tumor growth or increase survival in IfngL/L E8I Cre+ mice (Figures 1N and 1O), demonstrating Tc1 cells are required in our model. Collectively, these results demonstrate that Lr is effective in enhancing both spontaneous and ICI-mediated antitumor immunity in a Tc1-dependent manner.
Viable Lr within the tumor is necessary and sufficient to mediate antitumor effects
Accumulating evidence suggests the presence of a tumor microbiome in gut-distal cancers24–27, and live bacteria have been recovered from breast26,28 and pancreatic patient tumors24,25. However, whether intratumoral bacteria are passive inhabitants or active participants that impact tumor development is an intriguing emerging question. To this end, we used a targeted approach of culturing tumor homogenate in Lactobacilli-selective medium and detected viable Lr in all tumors of mice administered Lr (Figures 2A, 2B, and S5A), as well as Lj in a PBS treated mouse (Figure S5A).
Figure 2. Intratumoral Lr is necessary and sufficient to promote antitumor immunity in melanoma.

(A and B) B16-F0-tumor-bearing mice orally administered Lr or PBS for four consecutive days starting on D8. Tumors harvested on D15. (n = 5 mice/group). (A) Representative images of tumor cultures. (B) Quantification of viable Lr within TME (see Fig. S5A). (C) Profile of live bacterial species recovered from tumors of mice treated as in (A). (D) Oligotype clustering of Lr colonies derived from tumor isolates of PBS- or Lr-treated mice. Data are representative of two independent experiments; positive control (white +) derived from the Lr WT strain used for OG. (E and F) B16-F0-tumor-bearing mice IT injected with Lr or peptone-tryptone-tryptophan media (PTT) as indicated (n = 5 mice/group). (E) Tumor growth. (F) Percentage of TME Tc1 cells on D14. (G) Survival of B16-F0-tumor-bearing mice treated with IT injections (Lr or PTT) every 3 days starting D10 (n = 5 mice/group). (H and J) B16-F0-tumor-bearing mice orally administered Lr or PBS and IT injected with ampicillin (AMP) or vancomycin (VAN) as indicated (n = 5 mice/group). ABX, antibiotics. (H) Tumor growth. (I) Survival. (J) Quantification of viable Lr within the TME. (K and L) B16-F0-tumor-bearing GF mice orally administered Lr or PBS and IT injected with AMP, VAN, or vehicle control (PBS) as indicated (n = 4 mice/group). (K) Quantification of viable Lr within the TME. (L) Tumor growth. See also Figure S5. (E, H, and L) represent mean ± SEM analyzed by two-way ANOVA with Sidak’s correction for multiple comparisons. (F) represents individual mice analyzed by unpaired t-test. Mean ± SEM shown. (G and I) represent survival curves analyzed by log-rank test. *P < 0.05, **P < 0.01, ***P < 0.001, ****P < 0.0001.
To profile how Lr affects the composition of the tumor microbiome, we deployed a broad-spectrum culturomics approach, using broths and agars of diverse nutrient composition under aerobic/anaerobic culture conditions, enabling recovery of various bacteria. While we detected a diverse array of viable bacteria within tumors of control mice (Figure 2C), tumors of Lr-treated mice displayed substantially reduced microbial diversity driven by an enrichment of Lr (Figure 2C). Oligotyping of translocated Lr revealed tumor cultivated colonies isolated from Lr-treated mice displayed high similarity to the exogenously administered Lr WT strain, unlike Lr isolates from PBS treated mice, which likely represent endogenous strains (Figure 2D). These observations confirm exogenous Lr gavage drives translocation and dominates the tumor microbiome.
Prompted to better understand how Lr translocates to gut-distal melanoma, we found Lr translocation to the TME to be independent of the microbiome (Figure S5B), and found, in line with findings by us29,30 and others31,32, Lr translocates under both GF and SPF conditions to systemic tissues including liver, spleen, and mesenteric lymph nodes (mLN), implying Lr translocates via vascular and lymphatic routes (Figure S5C). Intriguingly, we found that neither tumor formation (Figure S5D) nor Lr treatment in the context of tumor formation elevate intestinal permeability during early (D9), intermediate (D11) and late (D14) stages of tumor formation (Figure S5E). Accordingly, jejunal and colonic gene expression of key epithelial, vascular and lymphatic barrier genes remained grossly unaffected (Figure S5F), indicating Lr treatment fails to impair intestinal barrier integrity. Demonstrating that bacterial translocation to the TME is not unique to Lr, yet is not universal among all commensals, we detected translocated orally administered probiotic Ec (Figure S5G), but not probiotic Bl, (Figure S5H) within tumors.
In summary, these findings confirm the mechanism by which Lr translocates to gut-distal tumors is not taxonomically restricted and is independent of an established microbiome, tumor formation, and gut barrier dysfunction.
Interested in whether Lr persists within the TME, we intratumorally injected a single dose of Lr and analyzed its TME abundance during tumor progression. While we found Lr did not expand, Lr colonization within the TME was persistent, as viable Lr was cultured from tumors up to 15 days post Lr injection (Figure S5I). Of note, the density of Lr/mg tumor did not increase as tumor size progressed (Figure S5J). These findings imply that the TME provides a sustainable niche for Lr.
Demonstrating Lr within the tumor is sufficient to promote antitumor immunity, Lr intratumoral injections into established tumors significantly suppressed tumor outgrowth, enhanced Tc1 frequencies within the tumor, and prolonged survival (Figures 2E–2G). Given these observations and that Lr is naturally present within the intestine of WT mice ((Figure S1C–S1G) and30), we assessed the requirement of intratumoral Lr in our model. To do so, we used antibiotics ampicillin (AMP) and vancomycin (VAN), found to effectively33–35 or ineffectively deplete Lr34, respectively, which we confirmed in vitro (Figure S5K). Once tumors reached ~200 mm3, mice received oral administration of Lr or PBS in combination with intratumoral injections of VAN or AMP (Figure S5L). Interestingly, in stark contrast to Lr-treated mice receiving VAN intratumoral injections, Lr-treated mice receiving AMP intratumoral injections failed to show significant tumor suppression or benefit on survival (Figures 2H and 2I). Notably, AMP treatment led to a ~3-log decrease of viable Lr within tumors when compared to VAN injected tumors (Figure 2J) but failed to majorly affect the small intestinal relative abundance of Lr or overall fecal bacterial load (Figures S5M and S5N). Given AMP globally depletes Lactobacilli, we repeated the experiment under gnotobiotic conditions where again intratumoral injections of AMP, but not VAN, reduced intratumoral Lr (Figure 2K), but failed to affect small intestinal Lr abundance (Figure S5O). Most importantly, only AMP intratumoral injections mitigated the tumor-suppressive effects of Lr treatment in germ-free mice (Figure 2L), confirming Lr within the TME is required. Further, we demonstrate that the presence of Lr at systemic sites is insufficient to restrain tumor outgrowth (Figure S5P).
Taken together, these data demonstrate that intratumoral Lr is sufficient and required to promote antitumor Tc1 immunity, suppress tumor outgrowth, and increase survival in preclinical melanoma.
Lr-released tryptophan catabolite, indole-3-aldehyde, is required and sufficient to promote antitumor immunity
We next sought to determine the mechanistic basis of how Lr drives tumor suppression. To this end, we interrogated whether Lr-mediated tumor suppression is melanoma-model specific. Interestingly, Lr treatment of mice bearing ICI-resistant YUMM1.7 melanoma36, MC38-adenocarcinoma or MMTV-PyMT breast cancer led to significantly delayed tumor outgrowth (Figures 3A–3C). Suggesting translocation to gut-distal tumors is not limited to B16 melanoma, viable Lr was detected in YUMM1.7, MC38, and MMTV-PyMT tumors (Figures 3A–3C). Next, we investigated whether physical components of Lr are sufficient to mitigate B16 melanoma outgrowth. In contrast to mice treated with viable Lr, neither oral administration nor direct intratumoral injections of heat-killed Lr were sufficient to suppress tumor growth or prolong survival (Figures 3D–3G), pointing towards an antitumor mechanism that occurs in a tumor- and Lr-antigen-independent fashion, likely dependent on Lr’s metabolic activity.
Figure 3: Lr-mediated tumor suppression occurs in a tumor- and Lr-antigen-independent fashion.

(A - C) Tumor growth (left) and detection of viable Lr within TME (right) of mice orally administered Lr or PBS as indicated (n = 5 mice/group). (A) YUMM1.7 melanoma-bearers. (B) MC38-adenocarcinoma-bearers. (C) MMTV-PyMT breast cancer-bearers. (D and E) B16-F0-tumor-bearing mice orally administered viable or heat-killed (HK) Lr or PBS as indicated (n = 5 mice/group). (D) Tumor growth. (E) Survival. (F and G) B16-F0-tumor-bearing mice IT injected with viable or HK Lr or PTT as indicated (n = 5 mice/group). (F) Tumor growth. (G) Survival. (A, B, C, D, and F) represent mean ± SEM analyzed by two-way ANOVA with Sidak’s correction for multiple comparisons. (E and G) represent survival curves analyzed by log-rank test. *P < 0.05, **P < 0.01, ***P < 0.001, ****P < 0.0001.
Lr has been shown to release several immunomodulatory metabolites including the indole-derivative indole-3-aldehyde (I3A), which has demonstrated T cell immunomodulatory properties through activation of the aryl hydrocarbon receptor (AhR), a ubiquitously expressed transcription factor37. To this end, we set out to interrogate whether I3A released by Lr plays a key role in Lr-induced Tc1-mediated antitumor immunity using a genetically modified Lr strain that lacks the aromatic amino acid aminotransferase class I/II gene (Lr ΔArAT), abrogating its ability to catabolize dietary tryptophan (Trp) into I3A37,38 (Figures S6A–S6C). Strikingly, we found that oral administration of Lr ΔArAT, in stark contrast to Lr WT, failed to suppress tumor growth, increase survival, or trigger potent antitumor Tc1 immunity (Figures 4A–4C). Through culturing tumors from mice treated with Lr WT or ΔArAT combined with strain-specific PCR of tumor isolates, we found both Lr strains to be present and viable at similar levels (Figures 4D and S6D), indicating the failure of Lr ΔArAT to induce tumor suppression or Tc1 expansion was not due to an inability to translocate to the tumor. Accordingly, sub-culturing tumor-derived Lr isolates in Trp-enriched media confirmed translocated Lr WT, but not ΔArAT, catabolized Trp into AhR ligands ex vivo (Figure S6E). This coincided with a significant increase in AhR activity and abundance of I3A in the tumor homogenate of Lr WT treated mice compared to both Lr ΔArAT- and control-treated mice (Figures 4E and 4F), suggesting Lr WT releases AhR agonist I3A within the tumor. Furthermore, while Lj, a phylogenetically related strain to Lr which naturally lacks the ability to produce I3A38, efficiently colonized the small intestine and translocated to the TME (Figures S6F and S6G), it failed to suppress tumor growth (Figures 1A–1C), confirming the critical role of I3A in our model.
Figure 4. Lr-derived I3A is required and sufficient to induce Tc1 cell effector function and restrain tumor outgrowth.

(A-F) B16-F0-tumor-bearing mice orally administered Lr WT, Lr ΔArAT, or PBS as indicated. (A) Tumor growth (n = 11–12 mice/group). (B) Survival (n = 5 mice/group). (C) Percentage of TME Tc1 cells on D17 (n = 11–12 mice/group). (D) Quantification of Lr within TME of mice from (B). (E) Quantification of AhR activity within tumor homogenates (n= 6–8 mice/group). (F) I3A quantification within TME. (G and H) B16-F0-tumor-bearing mice orally administered I3A (20 mg/kg body weight (b.w.) or 40 mg/kg b.w.) or vehicle control (corn oil) as indicated (n = 5 mice/group). (G) Tumor growth. (H) Survival. (I) Percentage of TME Tc1 cells on D13 of mice orally administered I3A or corn oil daily starting D9 (n = 4–5 mice/group). (J and K) B16-F0-tumor-bearing mice treated with I3A or corn oil and αPD-L1 or Iso. ctrl. as indicated (n = 5 mice/group). (J) Tumor growth. (K) Tumor weights on D14. See also Figure S6. (A, G, and J) represent mean ± SEM analyzed by two-way ANOVA with Sidak’s correction for multiple comparisons. (B and H) represent survival curves analyzed by log-rank test. (C, E, F, and K) represent individual mice analyzed by one-way ANOVA with Sidak’s correction for multiple comparisons. Mean ± SEM shown. (I) represents individual mice analyzed by unpaired t-test. Mean ± SEM shown. *P < 0.05, **P < 0.01, ***P < 0.001, ****P < 0.0001.
Upon establishing requirement of I3A in Lr-mediated tumor suppression, we next assessed whether I3A alone is sufficient to induce an antitumor response. Indeed, I3A oral administration suppressed tumor growth and increased survival in a dose-dependent manner (Figures 4G and 4H). Further, we found I3A was sufficient to significantly elevate Tc1 abundance and effector function in the TME (Figures 4I and S6H). I3A intratumoral injections also led to significant tumor suppression and increased survival in a dose-dependent manner (Figures S6I and S6J), indicating I3A can suppress tumor growth from directly within the TME. Prompted to assess the ability of I3A to potentiate ICI, we found combinatorial treatment with I3A and αPD-L1 led to significant decrease in tumor growth compared to αPD-L1 alone (Figure 4J), and only mice receiving combinatorial treatment showed a significant decrease in tumor weight relative to control mice (Figure 4K).
Taken together, our data reveal that Lr-derived I3A is required and sufficient to promote antitumor Tc1 immunity and melanoma suppression, and further potentiates ICI.
I3A mediates antitumor immunity via activation of the AhR within CD8 T cells
AhR activation has been demonstrated to play a critical role in skewing CD4 T cell differentiation towards Th17 or Treg cell linage in a ligand-dependent fashion39,40. However, the impact of microbial AhR ligands on Tc1 function remains undefined. Upon establishing the requirement of AhR activity in our model (Figure S6K), we sought to determine whether Lr-released AhR agonist I3A acts directly on CD8 T cells to promote IFNγ production. Through culturing splenic naïve CD8 T cells, activated with αCD3 and αCD28, with supernatant derived from Lr WT or ΔArAT, which activates or fails to activate AhR, respectively (Figure S6L), we observed that Lr WT-, but not ΔArAT-, derived supernatant induced IFNγ production (Figure 5A), indicating Lr-released I3A acts directly on CD8 T cells to promote Tc1 function.
Figure 5. Lr-derived I3A induces Tc1 cell immunity in a CD8 T cell-intrinsic and AhR-dependent manner in vitro and in vivo.

(A) IFNγ production by naïve CD8 T cells stimulated with αCD3/αCD28 ± Lr WT or ΔArAT supernatant, or PTT control (n = 3 mice/group). (B) Transcription factor enrichment analysis of DEGs between CD8 T cells treated with I3A vs. I3A + AhR inhibitor (from 29 , Table S3, and Methods). (C) Representative histogram of mean fluorescent intensity (MFI) (left) and quantification (right) of CREB phosphorylation of CD8 T cells stimulated with αCD3/αCD28, ± I3A, and ± AhR Inhibitor. (D) CD8 T cell gene expression relative to Gapdh following stimulation with αCD3/αCD28 ± I3A and ± AhR Inhibitor. (E) Percentage of CD8 T cells treated as in (C) expressing IFNγ. (F-H) Ahr−/− CD8 T cells stimulated with αCD3/αCD28 ± I3A (F) Representative histogram of MFI (left) and quantification (right) of CREB phosphorylation. (G) Gene expression relative to Gapdh. (H) Percentage of cells expressing IFNγ. (I and J) B16-F0-tumor-bearing mice orally administered Lr or PBS as indicated (n = 6–9 mice/group). (I) Tumor growth. (J) Survival. (K and L) B16-F0-tumor-bearing mice orally administered I3A (40 mg/kg b.w.) or vehicle control (corn oil) as indicated (n = 5–7 mice/group). (K) Tumor growth. (L) Survival. (M) Percentage of TME Tc1 cells on D12 of mice orally administered 40 mg/kg b.w. I3A or corn oil starting on D8. Dotted line represents mean percentage of corn oil-treated Ahrf/f Cre− mice (n = 5–8 mice/group). See also Figure S6. (A) represents 3 independent samples per group analyzed by one-way ANOVA with Sidak’s correction for multiple comparisons. Mean ± SEM shown. (C and E) represent 5 independent samples per group analyzed by RM one-way ANOVA with Sidak’s correction for multiple comparisons. (D) represents 4–5 independent samples per group analyzed by one-way ANOVA with Sidak’s correction for multiple comparisons. Median, upper and lower quartiles shown. (F and H) represent 4–5 independent samples per group analyzed by paired t-test. (G) represents 5 independent samples per group analyzed by unpaired t-test. Median, upper and lower quartiles shown. (I and K) represent mean ± SEM analyzed by two-way ANOVA with Sidak’s correction for multiple comparisons. (J and L) represent survival curves analyzed by log-rank test. (M) represents individual mice analyzed by one-way ANOVA with Sidak’s correction for multiple comparisons. Mean ± SEM shown. *P < 0.05, **P < 0.01, ***P < 0.001, ****P < 0.0001; ns, not significant.
These findings prompted us to further characterize the impact of I3A on CD8 T cells. We recently demonstrated Lr-derived I3A substantially promotes Tc1 differentiation, amplified by the absence of Tet methylcytosine dioxygenase 2 (Tet2)29. Intriguingly, transcription factor enrichment analysis using recently generated global transcriptomic profiles of ex vivo αCD3 and αCD28-activated WT naïve CD8 T cells in the presence or absence of I3A and AhR inhibitor CH22319129 revealed an AhR-dependent enrichment of genes harboring transcription factor binding sites for cAMP response element-binding protein 1 (Crebp1) (Figure 5B), a member of the CREB family41. CREB, an essential transcriptional enhancer of key type 1 effector genes such as IFNγ42–45, requires phosphorylation at serine 133 (Ser133) for activation and CREB-mediated transcription41. Strikingly, we found I3A stimulation of CD8 T cells leads to a significant increase in phosphorylation of CREB (pCREB) at Ser133 (Figure 5C). Accordingly, we demonstrate I3A induces a significant upregulation of the key Tc1 transcription factor Blimp1 (Figure 5D), which is required to promote cytotoxic effector function of CD8 T cells46,47, in addition to the critical Tc1 effector gene Ifng (Figure 5D). Furthermore, we found the presence of I3A during Tc1 differentiation significantly promotes the ability of CD8 T cells to produce IFNγ (Figure 5E). Indicating that I3A promotes Tc1 differentiation in a AhR-dependent manner, we found the AhR antagonist CH223191 to potently suppress I3A-induced Tc1 fate (Figures 5C–5E). In line with this observation, I3A failed to induce pCREB as well as Tc1 transcription and effector function in AhR deficient CD8 T cells (Figures 5F–5H). Of note, AhR sufficient and deficient CD8 T cells activated with αCD3 and αCD28 showed comparable IFNγ production capabilities (Figure S6M), implying the absence of AhR signaling does not cause global inability of IFNγ production, but rather a selective inability of CD8 T cells to produce enhanced IFNγ upon I3A stimulation.
Finally, to test the requirement of AhR activation within CD8 T cells in Lr-mediated antitumor immunity in vivo, we generated mice with a specific deletion of AhR in CD8 T cells (Ahrf/f CD8 Cre+). Strikingly, we found both Lr- and I3A-mediated tumor suppression and survival benefit to be abrogated in Ahrf/f CD8 Cre+ mice (Figures 5I–5L), revealing Lr-released I3A-mediated tumor suppression is dependent on CD8 T cell-intrinsic AhR activation. Concordantly, I3A treatment failed to induce a robust Tc1 response in Ahrf/f CD8 Cre+ mice (Figure 5M). Remarkably, we show that both Lr-derived I3A and AhR expression within CD8 T cells are required for Lr-mediated tumor suppression in YUMM1.7 tumor-bearing mice (Figure S6N), implying Lr’s ability to suppress tumor outgrowth via I3A-mediated activation of AhR within CD8 T cells is not tumor model-specific.
A recent study showed Trp-derived microbial metabolites can activate AhR in myeloid cells to suppress antitumor immunity in a murine pancreatic cancer model48. In stark contrast to mice that lack AhR within CD8 T cells, we show that absence of AhR in myeloid (Ahrf/f LysM Cre+) or dendritic cells (Ahrf/f CD11c Cre+ mice) fails to impact tumor outgrowth in our model (Figures S6O and S6P).
Taken together, these results demonstrate Lr-derived I3A promotes Tc1 differentiation and effector function in a CD8 T cell-intrinsic, AhR-dependent manner.
Tryptophan-enriched diet facilitates ICI
Given Lr catabolizes dietary Trp into AhR ligand I3A38, we assessed whether dietary Trp levels affect Lr-mediated antitumor responses. To this end, mice were placed on either Trp-enriched or Trp-depleted diets four weeks prior to tumor cell implantation and stayed on their respective diets for the entirety of the experiment (Figure S7A). While a Trp-low (0.19%) diet did not fully abrogate Lr’s ability to suppress tumor growth, mice that received Lr on a Trp-high (1.19%) diet showed significant tumor suppression and increased survival relative to mice who received Lr on a Trp-low diet (Figures 6A–6C), indicating a Trp-enriched diet potentiates Lr-mediated tumor suppression. Interestingly, we observed a Trp-high diet alone was sufficient to restrain melanoma growth and prolong survival relative to mice fed a Trp-low diet (Figures 6A–6C). Further, we found the observed antitumor effect of both a Trp-high diet alone and combinatorial Trp-high and Lr treatment significantly correlated with increased TME AhR activity (Figures 6D and 6E), suggesting a Trp-enriched diet promotes antitumor responses by increasing AhR activity within the TME. In line with this hypothesis, a Trp-enriched diet led to a significant increase in tumor-intrinsic I3A in the context of Lr treatment (Figure 6F). Notably, intratumoral I3A directly correlated with decreased tumor weight (Figure S7B).
Figure 6. Dietary tryptophan restrains tumor growth and facilitates ICI via activation of AhR within CD8 T cells.

(A-F) B16-F0-tumor-bearing mice placed on a low-tryptophan (Trp) diet (Trp LD) or high-Trp diet (Trp HD), prior to TCE and orally administered Lr or PBS as indicated. (A) Tumor growth (n = 8–9 mice/group). (B) Tumor weight on D17 (n = 4 mice/group). (C) Survival (n = 4–5 mice/group). (D) Tumor-intrinsic AhR activity of mice from (B). (E) AhR activity from (D) versus respective tumor weight from (B) of Trp HD mice. (F) Quantification of I3A in tumors from (A). (G and H) B16-F0-tumor-bearing mice placed on a Trp LD or HD prior to TCE (n = 12–20 mice/group). (G) Tumor growth. (H) Survival. (I and J) B16-F0-tumor-bearing mice placed on Trp LD or HD prior to TCE and treated IP with αPD-L1 or Iso. ctrl. as indicated (n = 4–5 mice/group). (I) Tumor growth. (J) Tumor weights on D14. See also Figure S7. (A, G and I) represent mean ± SEM analyzed by two-way ANOVA with Sidak’s correction for multiple comparisons. (C and H) represent survival curves analyzed by log-rank test. (B, D, F, and J) represent individual mice analyzed by one-way ANOVA with Sidak’s correction for multiple comparisons. Mean ± SEM shown. (E) represents individual mice analyzed by nonparametric Spearman correlation. *P < 0.05, **P < 0.01, ***P < 0.001, ****P < 0.0001.
Given the antitumor effects of a Trp-enriched diet correlated with increased TME AhR activity, we assessed the role of AhR signaling and CD8 T cell intrinsic AhR activity and found both to be required for Trp-diet mediated tumor suppression (Figures S7C, S7D, 6G, and 6H). Furthermore, we found a Trp-enriched diet alone significantly potentiates αPD-L1 efficacy (Figures 6I and 6J).
Given we and others showed Lr oral administration and elevated dietary Trp promote autoimmune-like disease in preclinical models29,31,34, we assessed whether these treatments induce an increase in systemic non-organ specific anti-nuclear antibodies (ANA). We found oral gavage of Lr and elevated dietary Trp failed to induce ANAs (Figures S7E–S7G), implying prolonged exposure to an enriched Trp diet or Lr gavage fails to induce systemic autoimmunity in our model.
The finding that a Trp-enriched diet is sufficient to mediate antitumor responses in the presence of a complex microbiome suggests other Trp-catabolizing bacteria, besides Lr, potentially contribute to antitumor immunity. In line with this hypothesis, the ability to catabolize dietary Trp into AhR ligands is not limited to Lr but extends to other commensal bacteria, including Ec49 (Figure S7H), which we found to potently suppress melanoma outgrowth (Figures 1A and 1B). To interrogate whether probiotic Ec restrains tumor growth via a mechanism similar to Lr, we first addressed the requirement of its metabolic activity. While heat-killed Ec suppressed tumor growth relative to vehicle control, viable Ec displayed significant tumor suppression relative to heat-killed Ec, indicating its metabolic activity contributes to Ec-mediated antitumor effects (Figure S7I). Interestingly, we found Ec treatment led to both an expansion of Tc1 cells and an increase in AhR activity within the TME (Figures S7J and S7K). In addition, TME AhR activity significantly correlated with antitumor Tc1 immunity (Figure S7L), suggesting that, in part, Ec may promote antitumor responses by increasing AhR activity within the TME. We confirmed that while Ec produces AhR ligands (Figure S7H), Ec does not produce I3A (Figure S7M), implying additional microbial-derived AhR ligands may drive Tc1 immunity. Of note, we found Bl, which suppressed tumor growth (Figures 1A and 1B), failed to translocate to the TME (Figure S5H), induce AhR activation (Figure S7H), produce I3A (Figure S7M), or require its metabolic activity for tumor suppression (Figure S7N and S7O). These findings are in line with our original hypothesis that the underlying mechanisms by which phylogenetically different probiotic bacteria promote tumor suppression may be distinct.
Taken together, we found a Trp-enriched diet potentiates the antitumor effect of Lr, and in the presence of a complex-microbiota, a Trp-enriched diet alone suppresses tumor growth and enhances ICI.
Evidence for a role of I3A in promoting ICI responses and survival in advanced melanoma patients
To directly investigate a potential role of I3A in influencing ICI efficacy in human melanoma, we performed targeted mass spectrometry to determine baseline I3A sera levels of advanced, stage IV melanoma patients (n = 42) that either responded (n = 19) or failed to respond (n = 23) to combinatorial IFNα and αPD1 immunotherapy, based on RECIST v1.1 criteria50. Strikingly, exogenous I3A abundance in patient sera was significantly elevated in ICI responders compared to non-responders (Figure 7A). To further interrogate the clinical significance of this finding, we assessed the impact of systemic I3A levels on progression-free survival (PFS) and overall survival. By stratifying patients by high (>70th percentile) and low (<30th percentile) sera I3A levels, we identified that patients with high systemic I3A at baseline exhibited significantly prolonged PFS and overall survival in contrast to patients with low I3A levels (Figures 7B and 7C).
Figure 7. Elevated systemic I3A abundance is associated with ICI-response in clinical melanoma.

(A-F) Serum metabolite assessment of advanced melanoma patients prior to αPD-1 and IFNα50 treatment start; NR, non-responder; R, responder. (A) I3A sera quantification. (B and C) Kaplan-Meier progression-free survival (PFS) curve (B) and overall survival curve (C) of patients stratified by I3A levels (n=12 patients/group). (D) Kyn sera quantification. (E and F) Kaplan-Meier progression-free survival (PFS) curve (E) and overall survival curve (F) of patients stratified by Kyn levels (n=12 patients/group). (G) B16-F0 tumor growth of mice IT injected with 200 μg/mL I3A, KYN, FICZ or vehicle control (10% Tween 20) as indicated (n = 5 mice/group). See also Figure S7. (A and D) represent individual patients analyzed by unpaired t-test. Violin plot showing median and upper and lower quartiles. (B, C, E, and F) represent survival curves analyzed by log-rank test. (G) represents mean ± SEM analyzed by two-way ANOVA with Sidak’s correction for multiple comparisons. *P < 0.05, ****P < 0.0001; ns, not significant.
Anthranilate, a downstream product in the Trp/kynurenine (Kyn) pathway51, has been associated with poor prognosis in several diseases including non-small cell lung and gastric cancer52,53. We failed to observe differences in sera anthranilate levels in responders versus non-responders (Figure S7P), and stratification of patients by high or low systemic anthranilate levels prior to treatment failed to reveal a difference in progression-free or overall survival (Figure S7Q and S7R).
As increased serum levels of endogenous AhR ligand Kyn have been found in advanced melanoma patients and have been associated with poor prognosis54,55, we were prompted to assess Kyn sera abundance in our cohort. In stark contrast to I3A, ICI responders and non-responders displayed similar baseline systemic abundance of Kyn (Figure 7D), and further, no statistical differences in PFS or overall survival were found when patients were stratified by high and low Kyn serum levels (Figures 7E and 7F). These findings prompted us to assess the impact of Kyn in our model, where we found Kyn intratumoral injections fail to restrain tumor growth in melanoma-bearing mice (Figure 7G), indicating tumor suppression via activation of the AhR is ligand-dependent. Interested to assess whether our observed antitumor phenotype is limited to I3A and/or indole-derived AhR ligands, we tested the ability of 6-formylindolo (3.2b) carbazole (FICZ), a potent exogenous, non-microbial-derived activator of the AhR, to suppress tumor growth. Indeed, we found intratumoral injections of FICZ to be sufficient to mediate tumor suppression (Figure 7G), and further, found oral administration of FICZ to potentiate αPD-L1 treatment, indicating that while our observed phenotype is ligand-dependent, it is not restricted to I3A (Figures S7S and S7T).
Taken together, these findings imply that the microbial AhR ligand I3A plays a potential role in promoting ICI responses in melanoma patients, contributing to prolonged PFS and overall survival.
Discussion
Collectively, our findings elucidate a critical microbial-host crosstalk within the TME that drives spontaneous antitumor immunity and facilitates ICI in preclinical melanoma. More specifically, we show Lr translocates to, colonizes, and persists within tumors where it locally promotes antitumor Tc1 immunity via its released AhR agonist and dietary Trp catabolite, I3A. We uncovered Lr-derived I3A directly acts through CD8 T cell-specific AhR signaling to promote IFNγ-production and found I3A is sufficient and required to enhance ICI. Additionally, we revealed that a Trp-enriched diet is sufficient to facilitate ICI and that the antitumor effects of a Trp-enriched diet required AhR activity within CD8 T cells. Finally, we uncovered a potential role of I3A in promoting ICI responses and survival in advanced melanoma patients.
Our findings that Ec induces both Tc1 expansion and increased AhR activity within the TME suggest the mechanism by which CD8 T cell-intrinsic AhR activation leads to antitumor immunity may extend to various AhR ligand-releasing bacteria, and additional studies are needed to address the conservation of this mechanism. Given Lactobacillus and Ec are overabundant in ICI responder melanoma patient feces13,14,17,56–58, future studies are needed to assess whether we have unraveled a unifying antitumor mechanism across several ICI-response-associated taxa.
The observation that Lr-derived I3A-induced Tc1 immunity is restricted to the TME suggests the local environment plays an important role in the response of tumor-infiltrating CD8 T cells to I3A. We hypothesize that TME-specific epigenetic changes or TME-specific metabolites modulate the sensitivity of tumor-infiltrating CD8 T cells to exogenous I3A or other Tc1 cell promoting factors. In line with this hypothesis, we recently showed the absence of the epigenetic regulator Tet2 within CD8 T cells renders them more sensitive to I3A and exogenous IFNγ29; however, future studies are warranted to test this hypothesis.
The finding that Lr treatment promoted expression of homing genes Ccl5 and Ccl4 in CD8 T cells suggests that in addition to the I3A-induced expansion of Tc1 cells, Lr may additionally facilitate the recruitment of Tc1 cells into the TME. This additional mechanistic possibility by which Lr promotes increased TME Tc1 cells will be interrogated in future studies.
The microbiome has been described to majorly impact tumor immunity and response to ICI10–17, but despite recent identification of gut-distal tumor microbiomes26–28, whether translocated bacteria impact on tumor immunity or ICI from directly within the tumor remained unknown. Here we show a probiotic bacterium (Lr) translocates to gut-distal melanoma, and we reveal its viability within the tumor is required to promote antitumor immunity.
Despite the observation that the endogenous AhR ligand Kyn displays pro-cancerogenic properties in a model of pre-clinical melanoma59, clinical trials to block endogenous AhR signaling (e.g. IDO blockers) failed to provide protection from melanoma progression60. These findings, in concert with our work, suggest the role of AhR activation in tumor progression is ligand-specific, and future studies will be needed to distinguish the roles of exogenous (microbial and non-microbial) versus endogenous ligand activation of the AhR within CD8 T cells in influencing tumor immunity.
A recent report found microbial AhR ligands to display pro-tumorigenic effects in a murine pancreatic cancer model via activation of the AhR in myeloid cells48. This finding, together with our study, implies the impact of the AhR in cancer is context- and cancer-type-dependent, stressing the importance of studying the role of microbial metabolite mediated AhR activation in various cancer models.
We29 and others31,34 uncovered that Lr and elevated dietary Trp aggravates autoimmune responses in preclinical models. Given ICIs can induce autoimmune responses61, it is possible that ICI-induced autoimmune events may be further aggravated by Lr intake and/or increased dietary Trp in genetically predisposed individuals. Thus, in future clinical studies this possible confounding factor needs to be considered and should be investigated further preclinically.
Our study has translational potential given (i) Lr is one of the most widely used probiotics that is naturally present in the human intestine62, (ii) we used a human-isolated Lr strain and (iii) we uncovered a potential role of I3A in promoting ICI responses in melanoma patients. The role of I3A as a biomarker for ICI sensitivity requires further investigation in human melanoma patients, and future studies are needed to address the role of I3A in patients suffering from other ICI-resistant cancers.
Our study will motivate a new line of investigations as it provides a rational mechanistic basis to design novel dietary and probiotic combinatorial therapeutic strategies to determine the clinical antitumor effect of microbial AhR ligands, such as I3A, in ICI-resistant cancer patients.
Limitations of the study
There are several limitations to our study. There is a possibility that Lr administration-induced microbiome dysbiosis additionally impacts our model. The mechanisms of how Lr translocates to the TME, Lr-derived I3A promotes Tc1 immunity exclusively within the TME, and Trp-enriched diet induces antitumor immunity remain incompletely addressed and should be the focus of future studies. While we demonstrate that Lr is viable within the TME, the precise location of Lr within the TME remains undefined. In addition, it is undefined whether the presence and abundance of Lr is controlled by the immune or stromal components in the TME. We uncovered I3A alone to be sufficient to promote tumor suppression, prolong survival, facilitate ICI, and promote antitumor Tc1 immunity in vivo and in vitro; however, additional Lr AhR agonists may contribute to the antitumor effect uncovered in our model.
STAR * METHODS
RESOURCE AVAILABILITY
Lead contact
Further information and requests for resources and reagents should be directed to and will be fulfilled by the lead contact, Marlies Meisel (marlies@pitt.edu).
Materials availability
Mouse lines generated in this study are available from the lead contact upon request.
Data and code availability
Raw and processed 16S rRNA-Seq data are available via the NCBI Sequence Read Archive (PRJNA925499). Raw and processed single cell RNA-seq data of tumor-infiltrating CD8 T cells are available at Gene Expression Omnibus (GSE225496). Remaining data needed to support the conclusion of this manuscript are included in the main text and supplementary materials. Any additional information required to reanalyze the data reported in this paper is available from the lead contact upon request. This paper does not report original code.
EXPERIMENTAL MODEL AND SUBJECT DETAILS
Melanoma patient serum samples
Study design, baseline clinical and demographic characteristics, assessments and definition of endpoints of a cohort of advanced stage IV melanoma patients was recently described in50. Briefly, clinical data and sera of advanced stage IV melanoma patients that either responded (referred to as responders (R)) = partial response or complete response, n = 19) or failed to respond (referred to as non-responders (NR) = stable disease or progressive disease, n = 23) to combinatorial IFNα and αPD1 were used in this study (ClinialTrials.gov identifier: NCT02112032; KEYNOTE-020). Collected serum samples at baseline in treatment naïve patients were used to analyze systemic I3A, kynurenine, and anthranilate by mass spectroscopy. Approval to treat patients was obtained from the University of Pittsburgh’s Hillman Cancer Center Institutional Review Board (No. PRO14030075).
Animals
C57BL/6 mice were obtained from The Jackson Laboratory. IfngL E8I Cre mice were provided by Dr. Dario A. A. Vignali, University of Pittsburgh, and Rag2−/− mice were kindly provided by Dr. M. Shlomchik, University of Pittsburgh. Ahrf/f CD8 Cre mice were generated by crossing Ahrf (Ahrtm3.1Bra/J, The Jackson Laboratory, 006203) mice with CD8α-Cre (C57BL/6-Tg(Cd8a-cre)1Itan/J, The Jackson Laboratory, 008766) mice. Ahrf CD11c Cre mice were generated by crossing Ahrf (Ahrtm3.1Bra/J, The Jackson Laboratory, 006203) mice with B6N.Cg-Tg(Itgax-cre)1–1Reiz/J, The Jackson Laboratory, 018967) mice. Ahrf LysM Cre mice were generated by crossing Ahrf (Ahrtm3.1Bra/J, The Jackson Laboratory, 006203) mice with B6. B6.129P2-Lyz2tm1(cre)Ifo/J, The Jackson Laboratory, 004781) mice. Spontaneously developing MMTV-PyMT breast cancer mouse model was procured from The Jackson Laboratory (022974). Unless otherwise indicated, for all experiments, 6–10 week-old females or males were used; no notable sex-dependent differences were found for the reported experiments. Mice were housed at the University of Pittsburgh animal facilities under specific pathogen-free (SPF) conditions, where cages were changed on a weekly basis. Ventilated cages, bedding, food and water (non-acidified) were autoclaved before use, ambient temperature maintained at 23 °C, and 5% Clidox-S was used as a disinfectant. Experimental and breeding cages were randomly housed on two different racks in the vivarium, and all cages were kept on automatic 12-h light/dark cycles. Animal care and experimentation were conducted in accordance with NIH guidelines and approved by the Institutional Animal Care and Use Committee at the University of Pittsburgh.
Gnotobiotic animal husbandry
Food, bedding, and water (non-acidified) were autoclaved before transfer into the sterile isolators. Cages within isolators were changed weekly, and all the cages in the vivarium were kept on 12-h light/dark cycles. Microbiology testing of fecal (experimental mice) or of cecum samples (sentinel mice; aerobic and anaerobic culture, 16S qPCR) was performed every other week to confirm germ-free status.
METHOD DETAILS
Tumor models
On day zero mice were injected subcutaneously in the right hind flank with 106 B16-F0 (ATCC, CRL-6322), 106 YUMM1.7 (ATCC, CRL-3362), or 5 × 10⁵ MC38 (Kerafast, ENH204-FP) tumor cells in 100 µL sterile PBS. Spontaneously developed breast tumors MMTV-PyMT mice (20 weeks of age) were dissected under sterile conditions, and a single cell suspension generated by digestion of tumor tissue in collagenase (Collagenase IV (Worthington Biochemical, LS004189, 2mg/mL) and DNAse I (Sigma-Aldrich, 10104159001, 200μg/mL) digest media. After three washing steps with sterile PBS, 5×10*5 MMTV-PyMT breast cancer cells in 100 µL sterile PBS were subcutaneously injected into C57BL/6 WT mice. Tumor volumes were calculated using the formula , where length represents the largest tumor diameter and width represents the diameter perpendicular to the length 10. For survival experiments mice were sacrificed when tumors reached a volume of ≥ 6000 mm3. Gnotobiotic mouse tumor measurements were performed with sterilized calipers located inside isolators.
Administration of bacteria, I3A, KYN, FICZ, and antibiotics
Lactobacillus reuteri ΔArAT lacking the gene coding for aromatic amino acid aminotransferase class I/II37 was provided by Dr. L. Cervantes-Barragan, Emory University. Lactobacillus reuteri (ATCC, BAA-2837, isolated from human breast milk), Lactobacillus johnsonii (ATCC BAA-3147), Bifidobacterium longum Reuter (ATCC, BAA-999), and Lactobacillus reuteri ΔArAT were cultured anaerobically in MRS Broth (BD Difco, DF0881–17-5) at 37°C. Escherichia coli (ATCC, BAA-1429) was cultured aerobically in Tryptic Soy Broth (BD Bacto, DF0370–17-3) at 37°C. Briefly, for oral gavage experiments mice were gavaged daily with 109 colony forming units (CFU) bacteria in 200 µL PBS, or 20 mg/kg body weight (b.w.) or 40 mg/kg b.w. Indole-3-Aldehyde (Sigma-Aldrich, 129445) in 200 µL corn oil, or vehicle control starting one day post tumor cell engraftment until endpoint analysis (EPA) unless noted otherwise. For heat-killed experiments, bacteria were incubated at 95 °C for 150 minutes (min) prior to gavage. For intratumoral injection experiments, mice were injected with 2×10⁷ CFU viable or heat-killed Lr or Ec in 40 µL PTT, 10 µM, 1000 µM, or 200µg/mL I3A, L-kynurenine (Sigma-Aldrich, K8625), or 6-Formylindolo(3,2-b)carbazole (FICZ) (Fischer Scientific, 50–103-1779) in 40 µL 10% Tween 20, 0.5 mg/mL ampicillin (Fisher BioReagents, BP1760–25) or vancomycin (Sigma-Aldrich, V2002) in 40 µL sterile water, or vehicle control starting when tumors reached an average volume of 300 mm3 every three days until EPA unless indicated otherwise. Experiment in Fig. S7I and S7N was performed at the same time but displayed separately for clarity of species-specific metabolic requirements.
In vitro assessment of ampicillin and vancomycin effectiveness against Lactobacillus reuteri
5 × 10⁷ CFU of Lr were inoculated in MRS broth containing 0.5 mg/mL ampicillin or vancomycin or vehicle control (sterile water). Cultures were grown anaerobically at 37 °C for 24 hours (h). Cultures were plated on MRS agar and incubated at 37 °C for 24 h under anaerobic conditions. CFU were then quantified.
CD8/CD4 T cell depletion, anti-PD-L1 mAb and anti-CTLA-4 mAb immunotherapy
For depletion of CD8/CD4 T Cells mice were injected intraperitoneally weekly with 250 µg InVivoMAb anti-mouse CD8α (BioXCell, BE0061), InVivoMAb anti-mouse CD4 (BioXcell, BE0003–1), or isotype control (BioXCell, BE0090) for a total of three times. For anti-PD-L1 mAb immunotherapy experiments, mice were injected intraperitoneally on day 5, 7, 9, and 12, with 100 µg InVivoMAb anti-mouse PD-L1 (BioXCell, BE0101) or InVivoMAb rat IgG2b isotype control (BioXCell, BE0090). For experiments in Fig. S4D mice were treated with daily Lr gavage (200µl, 109 CFU) and received the first dose of 50 µg InVivoMAb anti-mouse PD-L1 (BioXCell, BE0101) or InVivoMAb rat IgG2b isotype control (BioXCell, BE0090) as indicated once tumors were established (~100 mm3). For Fig. S4E, mice were treated with daily Lr gavage (200µl, 109 CFU) and received the first dose of 100µg InVivoMAb anti-mouse CTLA-4 (BioXCell, BE0164) or InVivoMAb mouse IgG2b isotype control (BioXCell, BE0086) as indicated once tumors were established (~100 mm3). For Fig. S8D, in conjunction with 100 µg InVivoMAb anti-mouse PD-L1 (BioXCell, BE0101) or InVivoMAb rat IgG2b isotype control (BioXCell, BE0090) treatment mice received 50 μL FICZ (200μg/mL) via intraperitoneal injection as indicated.
Tissue harvest and cell purification
Tumors and spleens were harvested with autoclaved tools under sterile conditions and weight was recorded. Spleens were mashed and underwent erythrocyte lysis using the Mouse Erythrocyte Lysing Kit (R&D Systems, WL2000) and remaining cells were used for flow cytometry analysis. Tumor-intrinsic lymphocytes were isolated via purification of mononuclear cells using 40% percoll centrifugation (Cytiva, 17089101), subsequent erythrocyte lysis, and an enrichment of CD45+ cells as described: cells were incubated for 5 min on ice with rat serum and Fc block (BD Biosciences, 553142), followed by a 15 min incubation on ice with biotinylated anti-CD45 (Biolegend, 103104). Cells were washed, and incubated with streptavidin beads (BD Biosciences, 557812) for 20 min, followed by a 5 min incubation in an EasySep magnet (STEMCELL, 18000). Cells poured out from the magnet were discarded, and cells remaining were used for flow cytometry analysis.
Lamina propria cell isolation was performed similar to63. In brief, Peyer’s patches, fat, and intestinal contents were removed. Intestinal epithelial cells and intestinal epithelial lymphocytes were removed by repeated shaking in HBSS, 2 mM EDTA in 10 min intervals at 37 °C. Lamina propria lymphocytes were isolated by shaking in RPMI containing 20% FBS, 1 mg/mL collagenase (Worthington Biochemical, LS004189), and 0.05 mg/mL DNAse I (Sigma-Aldrich, 10104159001) for 30 min at 37 °C followed by a 40% Percoll purification step.
Flow cytometry
Single cell suspensions were prepared as described above and stimulated in RPMI containing PMA (0.1µg/mL), ionomycin (1µg/mL), Golgi Stop (1.95µM), and Golgi Plug (1µg/mL). Post 3 h of stimulation, cells were washed and resuspended in FACS buffer (PBS, 2% FBS) for immunostaining and subsequent FACS analysis. Cell suspensions were incubated with Fc Block (BD Biosciences, 553142), followed with surface marker antibody (Ab) stain for 20 min at 4 °C. Surface Abs were used as follows: anti-CD45 (BV480, BD Biosciences, 566095; BUV395, BD Biosciences, 564279; APC-Cy7, BD Biosciences, 557659), anti-TCRβ (Alexa Fluor® 700, BD Biosciences, 560705), anti-TCRγδ (FITC, BioLegend, 107504), anti-CD4 (BUV395, BD Biosciences, 563790; BV650, BD Biosciences, 563232), anti-CD8α (BV570, BioLegend, 100740; BUV737, BioLegend, 612759), anti-I-A/I-E (MHC II) (BUV496, BD Biosciences, 750281; FITC, Thermo Fisher Scientific, 11–5321-82), anti-CD11c (FITC, BioLegend, 117306; BV421, BD Biosciences, 565452), anti-CD11b (APC-eFluor 780, eBioscience, 47–0112-80; BUV805, BD Biosciences, 741934), anti-F4/80 (PE-Cyanine5, eBioscience, 15–4801-80), anti-Gr1 (PerCP-Cy5.5, BD Biosciences, 552093), anti-NK1.1 (BV421, BD Biosciences, 568224). For dead cell exclusion, cells were stained with Zombie NIR Fixable Viability dye (BioLegend, 423105) for 10 min at 4 °C and washed in FACS buffer. For intracellular cytokine and transcription factor staining, surface Ab-stained cells were first fixed and permeabilized using the FoxP3 Transcription Factor Staining Buffer kit (eBioscience, 00–5523-00) following manufacturer’s instructions. Cells were further stained with Abs against intracellular proteins for 30 min at 4 °C. Intracelluar Abs were used as follows: anti-IFNγ (BV605, BioLegend, 505839; PE-Cy7, Fisher Tonbo Biosciences, 50–105-4909), anti-FoxP3 (FITC, eBioscience, 11–5773-82; efluor 450, Thermo Fisher Scientific, 50–163-74), anti-Granzyme B (PE, eBioscience, 12–8898-80), anti-Ki67 (PE-eFluor 610, eBioscience, 61–5698-82). Samples were FSC-A/SSC-A gated to exclude debris and gated to exclude dead cells. Samples were run on an Aurora (Cytek) flow cytometer and analyzed with FlowJo 10 (Tree Star).
T Cell Gating Strategies: Lymphocytes (FSC-H vs SSC-H), Single Cells (FSC-H vs FSC-A), Live CD45+ cells (Zombie NIR− and CD45+), T cells (TCRβ+ or TCRγδ+); CD8 T cells (CD8α+, CD4− gated on TCRβ+ cells); CD4 T cells (CD8α−, CD4+ gated on TCRβ+ cells); Th1 cells (IFNγ+ gated on CD4 T cells); Tc1 cells (IFNγ+ gated on CD8 T cells); Proliferating Th1 cells (Ki67+ gated on Th1 cells); Proliferating Tc1 cells (Ki67+ gated on Tc1 cells); GzmB-producing Th1 cells (GzmB+ gated on Th1 cells); GzmB-producing Tc1 cells (GzmB+ gated on Tc1 cells); Treg cells (Foxp3+ gated on CD4 T cells); IFNγ-producing Treg cells (IFNγ+ gated on Tregs); γδ T cells (TCRγδ+, TCRβ− gated on Live CD45+ cells). Innate Immune Cell Gating Strategies: Lymphocytes (FSC-H vs SSC-H), Single Cells (FSC-H vs FSC-A), Live CD45+ cells (Zombie NIR− and CD45+); DCs (MHC-II+, CD11c+ gated on Live CD45+ cells); Macrophages (CD11b+, F4–80+ gated on Live CD45+ cells); MDSCs (CD11b+, Gr-1+ gated on Live CD45+ cells); NK cells (NK1.1+, CD11b− gated on Live CD45+, CD8α− and CD4− cells); NKT cells (NK1.1+, CD11b− gated on CD8α+ T cells and CD4+ T cells).
Single-cell RNA sequencing sample preparation
Single-cell suspensions from tumors (n = 4 per condition) were prepared as described above except as follows. Cells were purified via an enrichment for CD90.2+ cells using EasySep™ Mouse CD90.2 Positive Selection Kit II (STEMCELL, 18951). Samples were stained using anti-TCRβ (Alexa Fluor® 700, BD Biosciences, 560705), anti-CD4 (BUV395, BD Biosciences, 563790), anti-CD8α (BUV737, BD Biosciences, 612759), and each sample was stained with TotalSeq™-C03NN anti-mouse Hashtag 1 Antibodies with unique hashtag oligonucleotides (HTOs) in staining buffer for 30 min on ice (Biolegend Cat # 155861, 155863, 155865, 155867, 155871, 155873, 155875, 155877). For dead cell exclusion, cells were stained with LIVE/DEAD™ Fixable Aqua Dead Cell Stain Kit (Invitrogen, L34957) for 10 min on ice. Doublets and dead cells were excluded. From each animal, 8,000 CD8+ live cells were sorted using a 5-laser Aria-10 cytometer, and samples from the same condition were pooled in PBS + 0.04% BSA. GEM formation and library preparation was performed using Chromium Next GEM Single Cell 5’ v2 workflow from 10x Genomics (Chromium Next GEM Single Cell 5’ Kit v2, 16 rxns PN-1000263, Library Construction Kit, 16 rxns PN-1000190, 5’ Feature Barcode Kit, 16 rxns PN-1000256, Chromium Next GEM Chip K Single Cell Kit, 48 rxns PN-1000286, Dual Index Kit TT Set A, 96 rxns PN-1000215, Dual Index Kit TN Set A, 96 rxns PN-1000250). Hashtagged cells from 8 mice (4 PBS treated and 4 Lr treated) were pooled onto a single lane of the 10x chip to allow sample multiplexing. Prepared libraries were quality-checked on Agilent TapeStation and sequenced on HiSeq4000 (Novogene Inc).
Single-cell RNA sequencing analysis
Sequencing data were downloaded from Novogene onto the Joglekar laboratory server. Reads were aligned with CellRanger-4.0.0 to the Mus musculus reference genome (mm10–2020-A). Hashtag oligonucleotide sequences were added in the feature reference file included in the cellranger count step. Following alignment and generation of gene expression matrix, samples were processed in Seurat v4.0.164. We used Seurat’s hashtag demultiplexing workflow to read hashtag oligos (HTODemux). Data from the resultant HTOs were reprocessed and re-demultiplexed for further analysis. First, data were normalized, and integration anchors were identified. Integrated data were scaled and used for downstream Principle Component Analysis and visualization using Uniform Manifold Approximation Embedding (UMAP). First 20 principle components were used to derive Seurat clusters. Differential gene expression analysis was performed using the FindMarkers function in Seurat using negbinom testing. Trajectory analyses were performed using Monocle 322,65. Visualization and all statistical testing was performed in RStudio running on R version 4.0.3.
In vivo intestinal permeability measurement
To determine intestinal epithelial barrier permeability in mice, FITC-labelled dextran method was used as previously described30. In brief, mice were withheld from food and water for 4 hours upon which they were gavaged with 60mg/100g body weight Fluorescein isothiocyanate (FITC)–dextran (MW 4,000, Sigma-Aldrich, 46944). After 3 h blood was collected by cheek bleeding, spun at 10,000 rpm for 10 min at 4 C, and 50 µL plasma was added to a 96-well flat bottom plate (Corning, 07–200-656) in duplicate. Analysis of FITC–dextran concentration was performed with a fluorescence spectrophotometer setup (SpectraMax® i3x using SoftMax Pro 3.0.7 Software) under the following settings: read type endpoint at excitation wavelength 485 and emission wavelength 520 (bandwidth 15), flashes per well 6, read height 4 mm. FITC-dextran concentration was determined in samples from a standard curve generated by serial dilution of FITC-dextran.
RNA processing and RT-PCR of intestinal tissue and cells
A piece of the jejunum and colon (~5 mm) was incubated in RNAprotect™ (Qiagen) at 4 °C for 48 h and stored at −80 °C until further analysis. For RNA extraction a Tissue-Tearor Homogenizer (Biospec) was used. RNA was extracted using the RNeasy Mini Kit (Qiagen). cDNA synthesis was performed using iScript™ cDNA Synthesis Kit (Bio-Rad) according to manufacturer’s instructions. Expression analysis was performed in duplicate via real-time PCR on a BioRad CFX384 Touch™ Real-Time PCR Detection System using iTaq™ Universal SYBR (Bio-Rad). Expression levels were quantified and normalized to Gapdh expression. Primers as follows: Gapdh (For, 5’-AGGTCGGTGTGAACGGATTTG-3’ and Rev, 5’-TGTAGACCATGTAGTTGAGGTCA-3’), Occludin (Ocln) (For, 5’-ACTGGGTCAGGGAATATCCA-3’ and Rev, 5’-TCAGCAGCAGCCATGTACTC-3’), Tight junction protein 2 (Tjp2) (For, 5’-AAGTTCCCTGCCTACGAG-3’ and Rev, 5’-ATTCAACCGAACCACTCC-3’), Tjp1 (For, 5’-ACTCCCACTTCCCCAAAAAC-3’ and Rev, 5’-CCACAGCTGAAGGACTCACA-3’), Desmoplakin (Dsp) (For, 5’-TACACCTCAGGGCTGGAAAC-3’ and Rev, 5’-GGGCCAGTCTTAGCTCCTCT-3’), Plasmalemma vesicle associated protein (Pvlap) (For, 5’-CGTCAAGGCCAAGTCGCT-3’ and Rev, 5’-CAGCAGGGTTGACTACAGGG-3’), Vascular endothelial growth factor A (Vegfa) (For, 5’- CTGCTGTAACGATGAAGCCCTG-3’ and Rev, 5’- GCTGTAGGAAGCTCATCTCTCC-3’), Junctional adhesion molecule A (F11r) (For, 5’- CACCTACTCTGGCTTCTCCTCT-3’ and Rev, 5’- TGCCACTGGATGAGAAGGTGAC-3’), Cingulin (Cng) (For, 5’- CCAAGCCCGGATCAAATCCT-3’ and Rev, 5’- CCACTCCCTACTCCCCAAGA-3’), Epithelial cell adhesion molecule (Epcam) (For, 5’- GCGGCTCAGAGAGACTGTG-3’ and Rev, 5’- CCAAGCATTTAGACGCCAGTTT −3’), Endothelial cell adhesion molecule (Esam) (For, 5’- TGCCCACATTCTAGACCTCCA-3’ and Rev, 5’- CTCCTTTTGTCCTTTGACCCAG-3’), Cadherin 5 (Cdh5) (For, 5’- GAACGAGGACAGCAACTTCACC-3’ and Rev, 5’- GTTAGCGTGCTGGTTCCAGTCA-3’), Beta-catenin (Cttnb1) (For, 5’- GTTCGCCTTCATTATGGACTGCC-3’ and Rev, 5’- ATAGCACCCTGTTCCCGCAAAG-3’), Adrenomedullin (Adm) (For, 5’- GCCAGATACTCCTTCGCAGTTC-3’ and Rev, 5’- AGGAACTGTCGTCTCATCAGCG-3’). See Table S4 for complete primer list.
Adoptive CD8 T cell transfer
FACS sorted, CD8+ TCRβ+ T cells (Live CD45+ TCRβ+ NK1.1- TCRγδ- MHCII- CD25- CD4-) were purified from spleen and lymph nodes of C57BL/6 WT mice and 3 × 10⁵ cells adoptively transferred (retro-orbital injection) into Rag−/− recipient mice that were pre-treated with broad spectrum antibiotics (0.45g/L ampicillin (used to suppress Lactobacilli), 2.15 g/L metronidazole, 0.57 g/L colistin, 4 g/L kanamycin and 0.35 g/L gentamicin) for one week (daily oral gavage, 100µl). Next day, recipient mice were subcutaneously injected with 106 B16-F0 cells. After 24 h of tumor inoculation, mice were gavaged daily with Lr (109 CFU) in 200ul PBS until EPA.
In vivo AhR antagonist treatment
B16 tumor-bearing mice were treated with 109 CFU (OG, oral gavage) Lr along with either vehicle (corn oil) or AhR antagonist (CH223191; 300 mg/mouse) via intraperitoneal (i.p.) injection until EPA was performed. Treatment was performed five days/week.
AhR agonist containing supernatant
Similar to previously described37, to generate AhR agonist containing supernatants, Lr WT or Lr ΔArAT were grown in MRS broth overnight, harvested by centrifugation, washed with PBS, and 1010 CFU were inoculated into sterile 10 mL of peptone-tryptone water (10 g/L peptone and 10 g/L tryptone, 5 g/L NaCl) supplemented with 0.6 mM L-tryptophan. After a 14 h incubation at 37 °C under anaerobic conditions, bacteria were centrifuged (5000 x g, 10 min), supernatant collected and filter sterilized (0.2 μm pore diameter cellulose acetate filter (VWR)) and stored at −80 °C until further use. For in vitro experiments, supernatants were added to cells at a final concentration of 10% vol/vol in culture media37.
In vitro naïve CD8 T cell stimulation with Lr culture supernatant
Naïve CD8 T cells derived from spleen and lymph nodes of WT mice were purified with EasySep™ Mouse Naïve CD8 T Cell Isolation Kit (Stem cell Technologies, 19858). Purity test by flow cytometry revealed 95%–98% enriched TCRβ+ NK1.1− TCRγδ− MHCII− CD44− CD25− CD62L+ cells (data not shown). 5 × 10⁵ naïve CD8 T cells were stimulated with plate coated anti-CD3 (BD Biosciences, 553057) and soluble anti-CD28 (BD Biosciences, 553294) (each 1 μg/mL) in the presence of 10% Lr WT- or 10% Lr ΔArAT-supernatant. Amount of produced IFNγ in the supernatant after 72 h was assessed by ELISA.
In vitro naïve CD8 T cell stimulation with increasing anti-CD3 concentrations
Naïve CD8 T cells derived from spleen and lymph nodes of Ahrf/f CD8 Cre+ mice and littermate controls were purified with EasySep™ Mouse Naïve CD8 T Cell Isolation Kit (Stem cell Technologies, 19858). 5 × 10⁵ naïve CD8 T cells were stimulated with either 2, 5 and 10 μg/mL plate coated anti-CD3 (BD Biosciences, 553057) and 2 μg/mL soluble anti-CD28 (BD Biosciences, 553294). Amount of produced IFNγ in the supernatant after 72 h was assessed by ELISA.
Enzyme-linked immunosorbent assay (ELISA) to measure IFNγ
In vitro T cell supernatants were used to measure IFNγ according to manufacturer’s instructions. Briefly, ELISA plates were coated overnight at 4 °C with 0.5 µg/ml IFNγ (BD Pharmingen, 551309). Plates were washed once (0.05% Tween 20 in PBS) and blocked for 1 h with blocking buffer (5% FBS in PBS). Standards and samples were incubated overnight at 4 °C. Plates were washed and incubated with biotin-conjugated IFNγ detection AB (0.5 µg/ml, BD Pharmingen, 554410) for 1 h at room temperature (RT). Plates were then washed and incubated with Horseradish Peroxidase-conjugated streptavidin (Jackson ImmunoResearch, 016–030-084) for 10 min followed by washing and development with TMB substrate (Pierce, 34021). Reactions were stopped by the addition of 2N H2SO4, and absorbance was measured at 450 nm on a SpectraMax i3 plate reader (Molecular Devices). IFNγ concentration in supernatants was determined from a standard curve generated by serial dilution of IFNγ.
In vitro Tc1 cell differentiation for assessment of CREB phosphorylation and IFNγ production
Naive CD8 T cells were purified from splenocytes and lymph nodes of WT mice (Fig. 5C–5E) or Ahrf/f CD8 Cre+ mice (Fig. 5F–5H) by using a naive CD8 T cell purification Kit (Stem cell Technologies). 1.1 ×10⁵ CD8 T cells were added per well of a 96 well plate and stimulated with plate bound anti-CD3 and soluble anti-CD28 (each 1μg/ml). Cells were treated with vehicle (DMSO) or 5µM I3A (Sigma-Aldrich) with or without 30 µM AhR antagonist (CH-223191, Sigma-Aldrich) for 72 h. Culture supernatant were removed and cells were replenished with fresh culture medium with soluble anti-CD28 (1ug/ml) along with respective stimuli for another 72h. For Tc1 profile analysis, (Fig. 5E and 5H), after those 6 days of stimulation, differentiated Tc1 cells were stimulated for 3 hours with PMA (0.1 µg/ml) and ionomycin (1 µg/ml) in the presence of Golgi Stop (1.95 µM) and Golgi Plug (1 µg/ml). Post 3 h of stimulation, cells were washed and flow cytometry analysis was performed (see Flow cytometry section) to examine Tc1 cell effector function.
For phospho-CREB analysis (Fig. 5C and 5F), after those 6 days of stimulation, differentiated Tc1 cells were restimulated with PMA (0.1µg/ml) and ionomycin (1µg/ml) for 30 min. Fixable live/dead viability stain (Zombie NIR, BioLegend, 423105) was added 15 min prior to fixation. Cells were fixed with BD Phosflow Lyse/Fix Buffer (BD Biosciences, 558049) and subsequently incubated for 15 min at 37 °C. Next, samples were permeabilized with ice-cold pre-chilled True-Phos Perm Buffer (BioLegend, 425401) and incubated at −20 °C for 1 h. After washing, cells were incubated with Abs for CD45 (BV480), CD4 (BV605), CD8 (BV570), TCRβ (Alexa Fluor® 700), and anti-phospho-CREB (PE, Cell Signaling Technology, 14228S) in FACS buffer for 30 min at RT. After washing twice, samples were acquired on an Aurora (Cytek) flow cytometer and analyzed with FlowJo 10 (Tree Star).
In vitro naive CD8 T cell stimulation for gene expression analysis
Naive CD8 T cells were purified from splenocytes and lymph nodes of WT mice (Fig. 5D) or Ahrf/f CD8 Cre+ mice (Fig. 5G) by using a naïve CD8 T cell purification Kit (Stem cell Technologies). 2 ×10⁵ CD8 T cells were added per well of a 96 well plate and stimulated with plate bound anti-CD3 and soluble anti-CD28 (each 1μg/ml) for 48 h. Activated CD8 T cells were subsequently treated with anti-CD28 (1μg/ml), along with vehicle (DMSO) or 5 µM I3A (Sigma-Aldrich) with or without 30µM AhR antagonist (CH-223191, Sigma-Aldrich) for an additional 72 h. Before harvesting, at each 24 h intervals, cells were replenished with anti-CD28-containing fresh culture medium along with respective stimuli. RNA was extracted from CD8 T cells by RNeasy plus micro kit (Qiagen) and cDNA synthesis was performed using SuperScript VILO cDNA Synthesis Kit (Thermo Fisher Scientific) according to manufacturer’s instructions. Expression analysis was performed by qPCR. Primers as follows: Gapdh (For, 5’-AGGTCGGTGTGAACGGATTTG-3’ and Rev, 5’-TGTAGACCATGTAGTTGAGGTCA-3’), Ifng (For, 5’- ATG AAC GCT ACA CAC TGC ATC-3’ and Rev, 5’- TCT AGG CTT TCA ATG ACT GTG C-3’), Prdm1 (Blimp1) (For, 5’- GAC CCA CCT ACA TAA CTC AGA C-3’ and Rev, 5’- GCT CTT AAG GCT CTG CTC C-3’). For the transcription factor enrichment analysis in Fig. 5B we used bulk RNAseq data from our recent work 29. In brief, sorted splenic naïve WT CD8 T cells were stimulated with αCD3 and αCD28 in the presence or absence of I3A and AhR inhibitor CH223191 (n = 3 per group) for 8 hours followed by lysis of cells for RNA isolation and RNAseq analysis. Transcription factor enrichment analysis was performed using 234 differentially expressed genes (FDR < 0.1; p < 0.001) between I3A and I3A + AhR inhibitor CH223191 treated WT CD8 T cells.
AhR activity assay
Luciferase-expressing HT29-Lucia™ AhR reporter cells under the control of Cyp1a1 gene promoter (referred to as “AhR reporter cells”) were purchased from InvivoGen (ht2l-ahr). Cells were cultured in DMEM (Gibco) supplemented with 10% FBS, 1 x Penicillin-Streptomycin-Glutamine (Gibco), 100 µg/mL Normocin (InvivoGen), and 100 µg/mL selective antibiotic Zeocin (InvivoGen). Briefly, 20 µL of sample was incubated with approximately 50,000 AhR reporter cells for 24 h. Following incubation, 20 µL of supernatant was transferred into a 96-Well Clear Bottom Black Microplate (Corning) and 50 µL QUANTI-Luc™ (InvivoGen) was added. Samples were immediately read for luminescence via a SpectraMax® i3x using SoftMax Pro 3.0.7 Software under the following settings: read type endpoint at all wavelengths, integration time 100 ms, read height 2 mm.
AhR activity measurement in tumor homogenate
Pieces of tumor (~ 200 mg) were removed and mashed through 100 µm cell strainers in sterile PBS, followed by centrifugation at 1800 rpm for 5 min to pellet cells. Supernatant was collected and measured for AhR activity using AhR reporter cells.
AhR activity measurement in translocated bacteria in the tumor
For assessments of AhR activity, MRS-broth-expanded cultures described above were pelleted at 5000 x g for 10 min, resuspended in peptone-tryptone-tryptophan (PTT) media, and cultured anaerobically at 37 °C, shaking at 250 rpm, for 14 h. Bacteria were again pelleted and supernatant was collected and measured for AhR activity.
Assessment of bacterial translocation efficiency
Tumors, spleen, liver and mLN were aseptically removed, weighed, and homogenized via mashing through a 100 µm cell strainer in 2 mL, 2 mL, 3mL and 1mL sterile water containing 0.05% NP-40, respectively (Sigma, 18896). Bacterial expansion was performed under anaerobic conditions at 37 °C as follows. After a 3 h incubation, 5 mL MRS or Tryptic Soy broth was added to each sample followed by an additional overnight incubation, after which the expansion and subsequent serial dilutions were plated on MRS or Tryptic Soy agar. Plates were incubated anaerobically for 24 h. Similar as previously described30, CFUs were then quantified and single colonies were picked for 16S rRNA amplicon sequencing. In Fig. 4D, where mice were treated with Lr WT or Lr ΔArAT, additional single colonies were picked for strain-specific PCR (see Fig. S6D), where deletion, or lack of deletion, of Lreu23DRAFT_RS05825 was verified using primers 5’-CGACTTGGTGGTCAAAGCGG-3’ and 5’-CATTGCTACCCACTTCCTTTACG-3’37.
Culturomics
Tumor tissue was sterilely isolated, split into two parts, and homogenized in 0.05% NP-40 (IGEPAL, Sigma-Aldrich, 18896) by mashing into a 40µm filter in a 6-well plate. Tumor homogenate was incubated at 37 °C under either aerobic or anaerobic conditions for 3 hours. Tumor homogenate was diluted 1:3 with sterile PBS, centrifuged 7 min at 5000 rpm to pellet tumor tissue and bacteria, and supernatant was discarded to eliminate remaining lysis buffer. Pelleted tumor homogenate was resuspended in sterile PBS and aliquoted into four different bacteriological growth media for pre-expansion of translocated bacterial communities: Brain Heart Infusion Broth (Fisher Scientific, CM1135B) supplemented with 5% sheep’s blood (Fisher Defibrinated Blood, 50–863-753) (BHI+5%), DeMann Rosa Sharpe (Fisher Scientific, DF0881–17-5) (MRS) Broth, Reinforced Clostridial (Fisher Scientific, cat# OXCM0149B) (RCL) Broth, and Cooked Meat (Fisher BD, cat# 226730) (CMM) Broth. Tumor culture broths were incubated for either 48h aerobically (shaken, 37 °C) or 72 hours anaerobically (stationary, 37 °C). Tumor culture broths were then streaked for single colony isolation across seven different agars (Fisher BD, DF0140–01-0) as follows: BHI+5% broth culture was streaked on BHI+5% agar, Chocolate Agar (Fisher Scientific, R01300), Bacteroides Bile Esculin (Fisher Scientific, NC0998155) Agar and Tryptic Soy (Fisher Scientific, DF0370–17-3) Agar; RCL broth culture was streaked on RCL agar; CMM broth culture was streaked on CMM agar, and MRS broth culture was streaked on MRS agar. Agar plates were incubated at 37 °C for either 48 hours aerobically or 72 hours anaerobically. Single colonies were then picked from agar plates for 16s rRNA single colony sequencing.
Oligotyping analysis
By using Shannon entropy, minimum entropy decomposition (MED) integrates amplicon data into oligotypes iteratively at single nucleotide resolution, to partition the sequences into discrete sequence groups by minimizing the total entropy in the dataset. Oligotypes from Lactobacillus reuteri, with ATCC Lactobacillus reuteri (Lr WT) and the other samples were first concatenated, and then supervised oligotyping pipeline was performed. In the supervised oligotyping method, Shannon entropy with a threshold value of minimum 0.2 and minimum substantive abundance threshold of 10 was used. Using the vegan library metaMDS function, ordinations of samples by oligotype profiles were generated. This was done through non-metric multidimensional scaling with Bray-Curtis distances with the vegan envfit function including 999 permutations to test for significant associations between sample treatment groups. Hierarchical clustering of profiles was generated by treatment groups to infer oligotype differences.
16S rRNA-based PCR, ilumina library preparation, and data analysis
To assess bacterial community structure, primers specific for 16S rRNA V3-V4 region (forward: 341F: 5′- CCTACGGGNGGCWGCAG −3′ and reverse: 805R: 5′- GACTACHVGGGTATCTAATCC −3′) that contained Illumina 5′ adapter sequences, as well as a 12-bp barcode, were used. Sequences were generated by an Illumina MiSeq DNA platform at University of Wisconsin-Madison Biotech Center, followed by AxyPrep Mag PCR clean-up (Axygen biosciences), quality and quantity assessment of finished libraries using Agilent 4200 TapeStation DNA 1000 kit Qubit dsDNA HS Assay Kit. Paired-end reads were processed using QIIME2 version 2022.8. Sequences were imported, trimmed, dereplicated and denoised through DADA2 to generate ASVs. Taxonomy was assigned using a naive-bayes classifier, trained with the 341F/805R primers above against Greengenes 13_5. Beta-diversity was calculated using Bray-Curtis group differences assessed using PERMNOVA and ANOSIM. Pattern Search was performed using Pearson correlations coefficient on relative abundances.
Bacterial colony identification
Bacterial colonies were identified as described in30. In brief, grown colonies were picked with sterile pipette tips and stored at −80 °C until analysis. At day of analysis, picked bacterial colonies were thawed at RT, resuspended with 20 µL of sterile water or ATE buffer (Qiagen) and lysed at 95 °C for 10 min. Samples were subsequently cooled down to 4 °C and then the DNA (2 µl) was used as template DNA in PCR reactions amplifying the 16S rRNA gene using universal bacterial 16S rRNA primers (27F, 5′-AGAGTTTGATCMTGGCTCAG-3′ and 1525R, 5′-AAGGAGGTGATCCAGCC-3′) with reaction conditions: 95 °C for 5 min followed by 35 cycles of 95 °C for 30 sec, 55 °C for 30 sec, 72 °C for 2 min and then 72 °C for 20 min. The amplification product (8 µl) was incubated with 2 µl ExoSAP-IT™ (ThermoFisher, 78201.1.ML) for 37 °C for 15 min, followed by 80 °C for 15 min. As recently described30, amplicons were sequenced by capillary sequencing, and the resulting sequences were analyzed using BLASTN and the 16S ribosomal RNA sequences NCBI database for species identification.
DNA extraction from intestinal contents and feces
The Fast DNA Stool Mini Kit (Qiagen, 51604) was used to extract total DNA from intestinal contents and feces. Quantitative PCR (qPCR) was performed as recently described66. Briefly, qPCR was performed on a Bio-Rad CFX384 Touch™ Real-Time PCR Detection System using iTaq™ Universal SYBR (Bio-Rad, 1725125) using primers as follows: 16S rRNA-encoding gene (340F, 5’-ACTCCTACGGGAGGCAGCAGT-3’ and 514R, 5’-ATTACCGCGGCTGCTGGC-3’), Lactobacillus reuteri (F, 5’-TTGGAAATGTTCCACAAGAC-3’ and R, 5’-TTGTGAGTTTGGATTGAACC-3), mouse Ifnb1 (F, 5’- CCATCCAAGAGATGCTCCAG-3’ and R, 5’- GTGGAGAGCAGTTGAGGACA-3’). Reactions were run at 95 °C for 3 min, followed by 40 cycles of 95 °C for 15 min and 63 °C for 60 seconds. Expression levels of 16S rRNA-encoding gene and Lactobacillus reuteri were quantified and normalized to Ifnb1 expression. In Figure S6G where L. johnsonii expression was measured, verification was done using primers L. johnsonii F 5’-GTGCAAAGCCGGATGAATGT-3’ and R 5’-GGCTTTTCAAGAAGTGGCGT-3’ and standardized to 16S rRNA-encoding gene.
Dietary experiments
For non-dietary experiments, mice were fed with irradiated standard chow (Prolab, RMH 3000) ad libitum that contains approximately 0.28% tryptophan. For dietary experiments, tryptophan-modified synthetic chows that differ only by their tryptophan content (0.19% or 1.19%; A11022501–02, Research Diets) were fed to mice for the indicated periods of time (ad libitum). Overall food consumption was similar across chows (data not shown).
Sample preparation of untargeted high-resolution LC-HRMS
Metabolic quenching and polar metabolite pool extraction was performed by adding 360 µL ice cold methanol containing 10 µM 13C1-creatine (Sigma-Aldrich) to 90 µL sample. After 3 min of vortexing, the supernatant was cleared of protein by centrifugation at 16,000 x g. 450 µL cleared supernatant was dried to completion under nitrogen gas and resuspended in 90 µL water. 2 µL of resuspended sample was subjected to online LC-MS analysis. Molar quantities were calculated using a calibration curve using purified kynurenine (Kyn) and indole-3-carboxaldehyde (I3A, Sigma-Aldrich, 129445) in a 1:3 series dilution from 25 µM to 11 nM.
Untargeted high-resolution LC-HRMS
Analyses were performed by untargeted LC-HRMS. Briefly, samples were injected via a Thermo Vanquish UHPLC and separated over a reversed phase Phenomenex Kinetix C18 column (2.1 × 150mm, 1.7 μm particle size) maintained at 55 °C. For the 10 min LC gradient, the mobile phase consisted of the following: solvent A (water / 5 mM ammonium formate / 0.1% formic acid) and solvent B (methanol / 0.1% formic acid). The gradient was the following: 0 – 0.3 min 3% B, increase to 30% B over 0.5 min, continue increasing to 60% B over 1 min, hold at 60% B for 1.3 min, increase to 95% B over 0.5 min, hold at 95% B for 1.4 min, equilibrate at 3% B for 4.5 min. The Thermo IDX tribrid mass spectrometer was operated in positive ion mode, scanning in ddMS2 mode (2 μscans) from 70 to 800 m/z at 120,000 resolution with an AGC target of 2e5 for full scan, 2e4 for ms2 scans using HCD fragmentation at stepped 15,35,50 collision energies. Source ionization setting was 3.0 kV spray voltage for positive mode. Source gas parameters were 35 sheath gas, 12 auxiliary gas at 320 °C, and 8 sweep gas. Calibration was performed prior to analysis using the PierceTM FlexMix Ion Calibration Solutions (Thermo Fisher Scientific). Integrated peak areas for Kyn, I3A, and anthranilate were then extracted manually using Quan Browser (Thermo Fisher Xcalibur ver. 2.7). Purified standards were then purchased and compared in retention time, m/z, along with ms2 fragmentation patterns to validate the identity of peaks.
Measurement of plasma anti-nuclear Abs (ANA)
Similar to our previous study29 plasma samples were diluted 1:10 in sample diluent and anti-nuclear Abs (ANA) were determined by using the mouse specific ANA ELISA Kit (MyBioSource, MBS261480) according to manufacturer’s instructions. Absorbance was measured at 450nm on a SpectraMax i3 plate reader (Molecular Devices). ANA and concentrations in plasma were determined from a standard curve generated by serial dilution of ANA.
Quantification and Statistical Analysis.
The majority of experiments were repeated at least two times to obtain data for indicated statistical analyses. Mice were allocated to experimental groups on the basis of their genotype and randomized within the given sex- and age-matched group. Given that our mice were inbred and matched for age and sex, we assumed similar variance between the different experimental groups. Statistically significant outliers were excluded from analysis. We did not perform a priori sample size estimation but always used as many mice per group as possible in an attempt to minimize type Ι and type ΙΙ errors. Except mass spectroscopical (LC-HRMS) analysis, investigators were not blinded during experiments and outcome assessment. All experimental and control animals were littermates and none were excluded from the analysis at the time of harvest. All quantitative data are presented as mean ± standard error of the mean (SEM), unless otherwise indicated. Data was analyzed using an unpaired two-tailed Student’s t-test for single comparisons, a paired t-test for repeated measured between independent samples, and one-way or 2-way ANOVA for multiple comparisons. ANOVA analysis was followed by a Sidak’s post-hoc test. Data for repeated measures between individual samples was analyzed using a repeated measures (RM) one-way ANOVA, followed by a Sidak’s post-hoc test. Survival data was analyzed by log-rank test. Correlations were calculated using the Spearman correlation. Figures and statistical analysis were generated using GraphPad Prism 9 (GraphPad Software). The statistical test used, and P values are indicated in each figure legend. P values of < 0.05 were considered statistically significant. *P < 0.05, **P <0.01, ***P <0.001 and ****P <0.0001.
Supplementary Material
(A) B16-F0 tumor growth of mice orally administered Lr or PBS daily starting once tumors reached approximately 150 mm3 (D6 pTCE); treatment continued until endpoint analysis (EPA) (n = 5 per group). OG, oral gavage. (B) Survival analysis of mice from (A). (C) Relative abundance of Lr normalized to host DNA (Ifnb) within the small intestine (SI), cecum, and colon of mice orally administered Lr or PBS daily starting one day pTCE until D14. (D-K) B16-F0 tumor-bearing mice were orally administered Lr or PBS daily starting on D6 pTCE and until D17 (n= 3–5 mice per group). (D) Hierarchical clustering heatmap of genera within the small intestine (SI) and cecum. (E and F) Pattern Search analysis of genera by treatment from the SI (E) and cecum (F) of mice from (D). (G) Relative abundance of Lactobacilli genus within SI and cecum of individual mice from (D). (H and I) Taxonomic bacterial composition distribution at family level for SI (H) and cecum (I) samples of mice from D. (J and K) Principal component analysis of SI (J) and cecal (K) microbiomes of individual mice from (D). Data for (A) represents mean ± SEM analyzed by two-way analysis of variance (ANOVA) with Sidak’s correction for multiple comparisons. Data for (B) represents comparison of survival curves analyzed by log-rank test. Data for (C) represents individual mice analyzed by unpaired t-test. Mean ± SEM is shown. Data for (G) represents individual mice analyzed by one-way ANOVA. Mean ± SEM is shown. *P < 0.05, **P < 0.01, *** P< 0.001, ****P < 0.0001; ns, not significant.
(A) Experimental schematic of mice from (Fig. 1E–F; Fig. S2B–M): For D9 (blue line) and D11 (green line) timepoints, mice were orally administered Lr or PBS daily starting on D6 when tumors were ~150 mm3 in volume; For D17 (pink line) mice were orally administered Lr or PBS daily starting on D1 pTCE. Tumor-infiltrating lymphocytes (TILs) from the tumor and spleen were assessed by flow cytometry (n = 4 – 8 mice per group); s.c., subcutaneous. (B-E) Percentage (left) and total cells normalized to g tumor tissue (right) of Ki67+ Th1 cells (B), Ki67+ Tc1 cells (C), GzmB+ Th1 cells (D), and GzmB+ Tc1 cells (E) within the TME of mice from (A). Th1, IFNγ+ CD4 T cells; Tc1, IFNγ+ CD8 T cells. (F and G) Quantification of percentage of Foxp3+ CD4 T cells (regulatory T cells (Tregs)) (F) and IFNγ+ Tregs (G) within the TME of mice from (A). (H-M) Percentage (left) and total cells (right) of IFNγ+ CD4 T (Th1) cells (H), IFNγ+ CD8 T (Tc1) cells (I), Ki67+ Th1 cells (J), Ki67+ Tc1 cells (K), GzmB+ Th1 cells (L), and GzmB+ Tc1 cells (M) within the spleen of mice from (A). (N and O) B16-F0 tumor-bearing mice treated with daily OG of PBS or Lr starting one day pTCE and sacrificed on D14. Percentage (left) and total cells (right) of IFNγ+ CD4 T (Th1) cells (N), IFNγ+ CD8 T (Tc1) cells (O) within the lamina propria (n = 4 – 5 mice per group). Data for (B-O) represent individual mice analyzed by unpaired t-test. Mean ± SEM is shown. *P < 0.05, **P < 0.01, ***P < 0.001, ****P < 0.0001; ns, not significant.
(A-F) B16-F0-bearing mice were treated with daily oral gavage of Lr or PBS daily starting on D6 pTCE until EPA (D9, D11, or D17). Immune cells from the tumor were assessed by flow cytometry. Percentage (left) and total cells normalized to g tumor tissue (right) of dendritic cells (DCs) (A), macrophages (B), myeloid-derived suppressor cells (MDSCs) (C), natural killer cells (NK cells) (D), natural killer T cells (NKT cells) (E), and γδ T cells (F) (n = 4–6 mice per group). (G) B16-F0 tumor growth of Rag−/− and WT mice orally administered Lr or PBS daily starting one day pTCE (n = 4 (WT PBS), n = 5 (WT Lr), n = 5 (Rag−/− PBS), n = 5 (Rag−/− Lr)). (H) B16-F0 tumor growth of mice orally administered Lr or PBS daily starting one day pTCE and treated with anti-mouse CD8α, anti-mouse CD4, or isotype control (Iso. ctrl.) one day prior to TCE, on D6 and on D13 pTCE (n = 4–5 mice/group). (I) B16-F0 tumor growth curve of Rag−/− mice that received an adoptive cell transfer (ACT) of 5 × 10⁵ CD8 T cells from WT donor mice one day prior to TCE and were treated with orally administered Lr or PBS daily starting one day pTCE (n = 3 per group). (J) Survival of mice from (I). Data for (A-F) represent individual mice analyzed by unpaired t-test. Mean ± SEM is shown. Data for (G), (H), and (I) represent mean ± SEM analyzed by two-way ANOVA with Sidak’s correction for multiple comparisons. Data for (J) represents comparison of survival curves analyzed by log-rank test. *P < 0.05, ***P < 0.001, ****P < 0.0001; ns, not significant.
(A and B) Single-cell RNA-sequencing analysis of CD8 T cells isolated from the TME on D15 of mice treated daily with Lr or PBS starting one day pTCE (n = 4 mice/group). (A) Heatmap showing the top 10 differentially expressed genes expressed for each individual cluster shown in Fig. 1G. (B) Distribution of gene expression levels (Nkg7, Gzmb, Ccl4, Ccl5) in individual CD8 T cells. (C) Percentage (top) and total cells normalized to g tumor tissue (bottom) of IFNγ+ CD8 T cells within the TME of mice from (Fig.1L) assessed by flow cytometry on D14. (D) B16-F0 tumor growth of mice orally administered Lr or PBS daily starting on D5 pTCE (tumor size ~100 mm3) and treated with intraperitoneal injections (IP) of 50 μg αPD-L1 or isotype control (Iso. ctrl.) on D5, 7, 9 and 12 (n = 4–6 mice/group). (E) B16-F0 tumor growth of mice orally administered Lr or PBS daily starting on D5 pTCE (tumor size ~100 mm3) and treated with IP of 100 μg αCTLA-4 or isotype control (Iso. ctrl.) on D5, 8, 11 and 14 (n = 4–6 mice/group). Data for (B) represents violin plots showing distributions of expression levels in individual cells analyzed by Wilcoxon test; p-value is shown. Data for (C) represents individual mice analyzed by one-way ANOVA with Sidak’s correction for multiple comparisons. Mean ± SEM is shown. Data for (D) and (E) represent mean ± SEM analyzed by two-way ANOVA with Sidak’s correction for multiple comparisons. *P < 0.05, **P < 0.01, ****P < 0.0001.
(A) Images of tumor homogenate cultures on MRS agar of mice orally administered PBS (M1 – 5) or Lr (M6 – 10) for four consecutive days starting on D8 pTCE. Tumors were harvested for culture on D15 pTCE (n = 5 per group). Presence of Lj was confirmed in one PBS treated mouse (M1) by 16S amplicon sequencing. (B and C) B16-F0-bearing germ-free (GF) or specific pathogen-free (SPF) mice were orally gavaged daily with Lr or PBS (GF = OG every other day for 4–7 treatments; SPF = OG daily for 7 treatments). CFU quantification of Lr per mg tumor (B) or organ (C). Median is shown. Presence of Lr was confirmed by 16S amplicon sequencing of individual colonies. (D) Concentration of 4-kDa fluorescein isothiocyanate (FITC) dextran in plasma of mice orally administered Lr or PBS daily starting one day pTCE for 14 days (n = 5 per group). (E) Concentration of FITC-dextran in plasma of mice orally administered Lr or PBS daily starting on D5 pTCE (for D9 and D11 EPA) or starting on D1 pTCE (for D14 EPA). (F) Jejunal (top) and colonic (bottom) gene expression of intestinal barrier genes normalized to Gapdh of mice from (D). (G) Representative images of tumor homogenate cultures on Tryptic Soy agar (left) and detection of viable Ec within the tumors (right) of mice orally administered Ec daily starting one day pTCE until EPA of Fig. 1C. Ec presence confirmed by 16S amplicon sequencing of individual colonies. (H) Detection of viable Bl within the tumors of mice orally administered Bl daily starting one day pTCE until EPA of Fig. 1C. (I) CFU quantification of Lr per mg tumor from mice intratumorally (IT) injected with Lr or vehicle control (PBS) one time when tumors reached approximately 200 mm3 and sacrificed at indicated time points pTCE (D10 - D22) (n = 1 (PBS) mouse per time point, n = 2–3 (Lr ) mice per time point). Median is shown. (J) CFU of Lr per mg tumor from (I) versus respective tumor weights of individual mice from (I). (K) Quantification of CFU/mL of Lr cultured in MRS broth supplemented with vehicle control, 0.5 mg/mL vancomycin (VAN), or 0.5 mg/mL ampicillin (AMP); ABX, antibiotics. (L) Experimental schematic of mice from (Fig. 2H–2J and Fig. S5M–S5N): mice were orally administered Lr or PBS daily and IT injected with VAN or AMP every other day starting on D8 pTCE. Treatment continued until EPA (n = 5 per group). (M) Relative abundance of Lr normalized to host DNA (Ifnb) within the small intestine (SI) at EPA of mice treated as in (L). (N) Relative abundance of 16S rRNA copies normalized to host DNA (Ifnb) within the fecal matter of mice from (L) prior to the start of antibiotic (ABX) and Lr or PBS treatment (D7) and upon EPA. (O) Relative abundance of Lr normalized to host DNA (Ifnb) within the SI at EPA of mice from (Fig. 2L). (P) CFU of bacteria per mg tissue from GF mice from (Fig. 2L) monocolonized with Lr. Median is shown. Data for (D) represents individual mice analyzed by one-way ANOVA with Sidak’s correction for multiple comparisons. Mean ± SEM is shown. Data for (E) represents individual mice analyzed by unpaired t-test for each day. Mean ± SEM is shown. Data for (F) represents mean ± SEM of individual mice analyzed by one-way ANOVA with Sidak’s correction for multiple comparisons. Data for (I) represents individual mice analyzed by one-way ANOVA with Sidak’s correction for multiple comparisons. Median is shown. Data for (J) represents individual mice analyzed by nonparametric Spearman correlation. Data for (M) represents individual mice. Mean ± SEM is shown. Data for (N) represents individual mice analyzed by one-way ANOVA with Sidak’s correction for multiple comparisons. Mean ± SEM is shown. Data for (O) represents individual mice analyzed by unpaired t-test. Mean ± SEM is shown. *P < 0.05, **P < 0.01; ns, not significant.
(A) Extracted ion chromatograph of 13C1 creatine (left) and I3A (right) standards. Retention time (RT) in min is indicated at the top of each chromatograph. (B and C) Supernatant of Lr WT or ΔArAT cultured in PTT media was used to assess each strain’s ability to produce I3A. Extracted ion chromatogram of supernatant (B) and quantification of pmol I3A/100 µL supernatant (C) assessed by mass spectrometry (n = 1 per group). 13C1 creatine is used as a reference protein and for normalization of I3A. Red outline in (B) indicates I3A peak after a RT of 3.2 min. (D) Image of Lr-strain-specific PCR of tumor-isolated bacterial colonies from Fig. 4D. Lanes 1–5: colonies from tumors of Lr WT OG mice (1 colony per mouse); 6–9: colonies from Lr ΔArAT OG mice tumors (1 colony per mouse); lane 10- positive Lr WT control; 11- positive Lr ΔArAT control; 12- negative PCR reaction control. (E) Mice were administered Lr WT or ΔArAT daily starting on D1 pTCE until D17, and tumor samples were homogenized and cultured in PTT media. AhR activity of tumor expansion culture supernatants was measured as luminescence by luciferase-expressing AhR reporter cells. The dotted line represents the mean luminescence of PTT media, (n = 4–5 mice/group). (F) Relative abundance of Lj normalized to bacterial 16s within the small intestine of B16-F0 tumor-bearing mice orally administered PBS or Lj daily starting on D1 pTCE and sacrificed on D14. (G) Detection of viable Lj within the tumors of mice orally administered Lj daily starting one day pTCE until EPA of Fig. 1C. (H) Total number of IFNγ+ CD8 T cells normalized to g tumor tissue of mice orally administered 40 mg/kg b.w. I3A or corn oil for seven consecutive days once tumors reached approximately 300 mm3 (D9), assessed by flow cytometry on D18 (n = 3 mice/group). (I) B16-F0 tumor growth of mice IT injected with 10 μM or 1000 μM I3A or vehicle control (10% Tween 20) every three days starting when tumors reached approximately 300 mm3 (D9) (n = 4–5 mice/group). (J) Survival analysis of mice from (I). (K) B16-F0 tumor growth of mice treated with daily oral gavage of Lr or PBS and daily intraperitoneal (IP) injection of AhR inhibitor or vehicle control (corn oil) starting on D3 pTCE; IP (n = 5–8 mice/group). (L) AhR activity measured as luminescence derived from luciferase-expressing AhR reporter cells following stimulation with supernatant of either Lr WT or Lr ΔArAT cultured in PTT media (n = 1 per group). FICZ, 6-Formylindolo[3,2-b]carbazole (AhR agonist). (M) IFNγ concentration in supernatant of naïve Ahr deficient and Ahr sufficient CD8 T cells stimulated with various αCD3 concentrations and αCD28 (2 µg/mL) measured by ELISA (n = 4 per group). (N) YUMM1.7 tumor growth of Ahrf/f CD8 Cre+ and Ahrf/f Cre− mice orally administered Lr WT, Lr ΔArAT, or PBS daily starting on D1 pTCE (n = 5–7 mice/group). (O) B16-F0 tumor growth of Ahrf/f CD11c Cre+ and Ahrf/f Cre− mice orally administered Lr or PBS daily starting on D1 pTCE (n = 7–15 mice/group). (P) B16-F0 tumor growth of Ahrf/f LysM Cre+ and Ahrf/f Cre− mice orally administered Lr or PBS daily starting on D1 pTCE (n = 10–12 mice/group). Data for (E), (F), (H) represent individual mice analyzed by unpaired t-test. Mean ± SEM is shown. Data for (I), (K), (N), (O), and (P) represent mean ± SEM analyzed by two-way ANOVA with Sidak’s correction for multiple comparisons. Data for (J) represents comparison of survival curves analyzed by log-rank test. Data for (M) represents mean ± SEM analyzed by two-way ANOVA with Sidak’s correction for multiple comparisons. *P < 0.05, **P < 0.01, ***P < 0.001, ****P < 0.0001.
(A) Experimental schematic of mice from (Fig. 6A, 6B, and 6D): mice were placed on a low-tryptophan (Trp) diet ((Trp LD), Trp = 0.19%) or high-Trp diet ((Trp HD), Trp = 1.19%) four weeks prior to TCE, maintained on diet until EPA, and orally administered Lr or PBS daily starting one day pTCE. (B) Tumor weight of (Fig. 6B) versus total pmol I3A/g tumor of (Fig. 6F). (C) B16-F0 tumor growth of mice placed on a Trp LD or Trp HD four weeks prior to TCE, maintained on diet until EPA and treated with intraperitoneal injections of AhR inhibitor or vehicle control (corn oil) five days per week starting 1 day before TCE (n = 6 (Trp LD and corn oil), n = 7 (Trp HD and corn oil), n = 7 (Trp HD and AhR inhibitor)). (D) Tumor weights of mice from (C) on D14 pTCE. Dotted line represents mean value of tumor weights from vehicle treated mice on a Trp LD. (E-G) ANA plasma levels of daily Lr or PBS-treated (OG) B16-F0 tumor-bearing mice on D17 pTCE (E), Trp LD or Trp HD treated YUMM1.7 tumor-bearing mice on D20 pTCE maintained on a Trp HD for 6 weeks (F), and non-tumor-bearing mice maintained on a Trp HD for 6 weeks (G). (H) AhR activity measured as luminescence derived from luciferase-expressing AhR reporter cells following stimulation with supernatant of respective culture (Lr, Bl, Ec) (n = 1 per group). (I) B16-F0 tumor growth of mice IT injected with viable or heat-killed (HK) Ec or vehicle control (PTT) every three days starting when tumors reached approximately 150 mm3 (D6) (n = 5 per group). (J) Percentage of IFNγ+ CD8 T cells within the TME of mice orally administered Ec every other day starting one day pTCE assessed by flow cytometry on D17. (K) AhR activity measured as luminescence normalized to g tumor derived from luciferase-expressing AhR reporter cells stimulated with tumor homogenate from mice from (J). (L) AhR activity from (K) versus percentage of IFNγ+ CD8 T cells within the TME of respective mice from (J). (M) Quantification of I3A in 100 μL of bacterial culture supernatant assessed by mass spectrometry (n = 1 per group). (N) B16-F0 tumor growth of mice IT injected with viable or HK Bl or vehicle control (PTT) every three days starting when tumors reached approximately 150 mm3 (D6) (n = 5 per group). (O) Survival analysis of mice from (N).
(P) Quantification of anthranilate in sera of patients from Fig. 7 assessed by mass spectrometry; ISTD, internal standard. (Q and R) Kaplan-Meier survival curve comparing progression-free survival (PFS) (Q) and overall survival (R) of melanoma patients stratified by pre-treatment anthranilate sera levels. High anthranilate [> 70th percentile] with sera levels > 0.1648 Area/ISTD per 100 µL serum (n = 12, green), low anthranilate [< 30th percentile] with sera levels < 0.0364 Area/ISTD per 100 µL serum (n = 12, black). (S) B16-F0 tumor growth of mice treated with IP injections of αPD-L1 or isotype control (Iso. ctrl.) (D5, 7, 9 and 12 pTCE) and 200 μg/mL FICZ or vehicle control (10% Tween 20) IT injections every three days starting on D8 pTCE (n = 5–6 per group). (T) Survival of mice from (S). Data for (B) represent individual mice. Data for (C), (I), (N) and (S) represent mean ± SEM analyzed by two-way ANOVA with Sidak’s correction for multiple comparisons. Data for (D), (E), (F), (J), and (K) represent individual mice analyzed by unpaired t-test. Mean ± SEM is shown. Data for (G) represent individual mice analyzed by paired t-test. Data for (L) represent individual mice analyzed by Pearson r correlation of E. coli treated mice. Data for (O, Q, R, and T) represents comparison of survival curves analyzed by log-rank test. Data for (P) represents individual patients analyzed by unpaired t-test. Violin plots showing median and upper and lower quartiles are shown. *P < 0.05, **P < 0.01, ***P < 0.001; ****P < 0.0001; ns, not significant.
Table S2. Related to Figure 1 and Figure S4. Cluster marker genes and DEGs from single-cell RNA-sequencing dataset.
Table S3. Related to Figure 5. DEGs of naïve CD8 T cells stimulated with αCD3 and αCD28 in the presence of I3A vs. I3A and AhR inhibitor.
KEY RESOURCES TABLE
| REAGENT or RESOURCE | SOURCE | IDENTIFIER |
|---|---|---|
| Antibodies | ||
| Anti-Mouse CD16/CD32 (Mouse BD Fc Block™, Rat, Clone 2.4G2) unconjugated) | BD Biosciences | Cat # 553142; RRID:AB_394657 |
| anti-Mouse CD45 monoclonal antibody (Rat, Clone 30-F11), Brilliant Violet 480 conjugated | BD Biosciences | Cat # 566095; RRID:AB_2739499 |
| anti-Mouse CD45 monoclonal antibody (Rat, Clone 30-F11), APC-Cy™7 conjugated | BD Biosciences | Cat # 557659; RRID:AB_396774 |
| anti-Mouse CD45 monoclonal antibody (Rat, Clone 30-F11), BUV 395 conjugated | BD Biosciences | Cat # 564279; RRID: AB_2651134 |
| anti-Mouse TCRβ monoclonal antibody (Armenian hamster, Clone H57–597), Alexa Fluor® 700 conjugated | BD Biosciences | Cat # 560705; RRID:AB_1727573 |
| anti-Mouse TCRγδ monoclonal antibody (Armenian Hamster, Clone UC7–13D5), FITC conjugated | BioLegend | Cat # 107504; RRID: AB_313313 |
| anti-Mouse CD4 monoclonal antibody (Rat, Clone GK1.5), Brilliant Violet 650 conjugated | BD Biosciences | Cat # 563232; RRID:AB_2738083 |
| anti-Mouse CD4 monoclonal antibody (Rat, Clone GK1.5), BUV395 conjugated | BD Biosciences | Cat # 563790; RRID:AB_2738426 |
| anti-Mouse CD8α monoclonal antibody (Rat, Clone 53–6.7), Brilliant Violet 570 conjugated | Biolegend | Cat # 100740; RRID:AB_2563055 |
| anti-Mouse CD8α monoclonal antibody (Rat, Clone 53–6.7), BUV737 conjugated | BD Biosciences | Cat # 612759; RRID:AB_2870090 |
| anti-Mouse I-A/I-E (MHC-II) monoclonal antibody (Rat, Clone M5/114.15.2), FITC conjugated | Thermo Fisher Scientific | Cat # 11–5321-82; RRID:AB_465232 |
| anti-Mouse I-A/I-E (MHC-II) monoclonal antibody (Rat, Clone M5/114.15.2), BUV496 conjugated | BD Biosciences | Cat # 750281; RRID:AB_2874472 |
| anti-Mouse CD11c monoclonal antibody (Hamster, Clone N418), FITC conjugated | BioLegend | Cat # 117306; RRID:AB_313775 |
| anti-Mouse CD11c monoclonal antibody (Armenian hamster, Clone N418), Brilliant Violet 421 conjugated | BD Biosciences | Cat # 565452; RRID: AB_2744278 |
| anti-Mouse CD11b monoclonal antibody (Rat, Clone M1/70), APC-eFluor 780 conjugated | eBioscience | Cat # 47–0112-80; RRID:AB_1603193 |
| anti-Mouse Cd11b monoclonal antibody (Rat, Clone M1/70), BUV805 conjugated | BD Biosciences | Cat # 741934; RRID: AB_2871246 |
| anti-Mouse F4/80 monoclonal antibody (Rat, Clone BM8), PE-Cyanine5 conjugated | eBioscience | Cat # 15–4801-80; RRID:AB_468798 |
| anti-Mouse NK1.1 monoclonal antibody (Rat, Clone PK136 ), Brilliant Violet 786 conjugated | BD Biosciences | Cat # 568224; RRID: AB_2916852 |
| anti-Mouse NK1.1 monoclonal antibody (Rat, Clone PK136), FITC conjugated | BioLegend | Cat# 108706; RRID:AB_313393 |
| anti-Mouse CD25 monoclonal antibody (Rat, Clone 3C7), FITC conjugated | BioLegend | Cat# 101908; RRID:AB_961212 |
| anti-Mouse Gr1 monoclonal antibody (Rat, Clone RB6–8C5), PerCP-Cy5.5 conjugated | BD Biosciences | Cat# 552093; RRID: AB_394334 |
| anti-Mouse Granzyme B monoclonal antibody (Rat, Clone NGZB), PE conjugated | eBioscience | Cat # 12–8898-82; RRID:AB_10870787 |
| anti-Mouse Ki67 monoclonal antibody (Rat, Clone SolA15), PE-eFlour 610 conjugated | eBioscience | Cat # 61–5698-82; RRID:AB_2574620 |
| anti-mouse FoxP3 monoclonal antibody (Rat, Clone FJK-16s), eFluor 450 conjugated | Thermo Fisher Scientific | Cat # 48–5773-82; RRID: AB_1518812 |
| anti-Mouse FoxP3 monoclonal antibody (Rat, Clone FJK-16s), FITC conjugated | Thermo Fisher Scientific | Cat # 11–5773-82; RRID:AB_465243 |
| anti-Mouse IFN-gamma monoclonal antibody (Rat, Clone XMG1.2), Brilliant Violet 605 conjugated | BioLegend | Cat # 505839; RRID:AB_2561438 |
| Anti-Mouse IFN-gamma monoclonal antibody (Rat Clone XMG1.2), PE-Cy7 conjugated | Thermo Fisher Scientific | Cat # 25–7311-41, RRID: AB_1257211 |
| anti-Mouse pCREB monoclonal antibody (Rabbit, Clone 87G3), PE conjugated | Cell Signaling Technology | Cat # 14228S; RRID: AB_2798432 |
| InVivoMAb anti-mouse CD8α | BioXCell | Cat # BE0061; RRID:AB_1125541 |
| InVivoMAb anti-mouse CD4 | BioXCell | Cat # BE0003–1; RRID:AB_1107636 |
| InVivoMAb rat IgG2b isotype control | BioXCell | Cat # BE0090; RRID:AB_1107780 |
| InVivoMAb anti-mouse PD-L1 | BioXCell | Cat # BE0101; RRID:AB_10949073 |
| InVivoMAb anti-mouse CTLA-4 (CD152) | BioXCell | Cat # BE0164; RRID:AB_10949609 |
| InVivoMAb mouse IgG2b isotype control | BioXCell | Cat # BE0086: RRID:AB_1107791 |
| Biotin anti-mouse CD45 antibody (Clone 30-F11) | Biolegend | Cat # 103104; RRID:AB_312969 |
| TotalSeq™-C0301 anti-mouse Hashtag 1 Antibodies (Rat, Clone M1/42; 30-F11) | BioLegend | Cat # 155861; RRID: AB_2800693 |
| TotalSeq™-C0302 anti-mouse Hashtag 2 Antibodies (Rat, Clone M1/42; 30-F11) | BioLegend | Cat # 155863; RRID: AB_2800694 |
| TotalSeq™-C0303 anti-mouse Hashtag 3 Antibodies (Rat, Clone M1/42; 30-F11) | BioLegend | Cat # 155865; RRID: AB_2800695 |
| TotalSeq™-C0304 anti-mouse Hashtag 4 Antibodies (Rat, Clone M1/42; 30-F11) | BioLegend | Cat # 155867; RRID: AB_2800696 |
| TotalSeq™-C0306 anti-mouse Hashtag 6 Antibodies (Rat, Clone M1/42; 30-F11) | BioLegend | Cat # 155871; RRID: AB_2819910 |
| TotalSeq™-C0307 anti-mouse Hashtag 7 Antibodies (Rat, Clone M1/42; 30-F11) | BioLegend | Cat # 155873; RRID: AB_281991 |
| TotalSeq™-C0308 anti-mouse Hashtag 8 Antibodies (Rat, Clone M1/42; 30-F11) | BioLegend | Cat # 155875; RRID: AB_2819912 |
| TotalSeq™-C0309 anti-mouse Hashtag 9 Antibodies (Rat, Clone M1/42; 30-F11) | BioLegend | Cat # 155875; RRID: AB_2819913 |
| anti-Mouse CD3e monoclonal antibody (Armenian hamster, 145–2C11) unconjugated | BD Biosciences | Cat # 553057; RRID: AB_394590 |
| anti-Mouse CD28 monoclonal antibody (Syrian hamster, 37.51) unconjugated | BD Biosciences | Cat # 553294; RRID: AB_394763 |
| anti-Mouse IFN-gamma Monoclonal Antibody (Rat, Clone AN 18), unconjugated | BD Pharmingen | Cat# 551309; RRID: AB_394145 |
| anti-Mouse IFN-gamma Monoclonal Antibody (Rat, Clone XMG1.2), biotin conjugated | BD Pharmingen | Cat# 554410; RRID: AB_395374 |
| Biological Samples | ||
| Patient sera from NCT02112032; KEYNOTE-020 | Provided by | N/A |
| D. Davar and H. Zarour | ||
| Chemicals, Peptides, and Recombinant Proteins | ||
| Recombinant Mouse IFN-gamma | R & D Systems | Cat# 485-MI-100 |
| Zombie NIR™ Fixable Viability Kit | BioLegend | Cat# 423105 |
| LIVE/DEAD™ Fixable Aqua Dead Cell Stain Kit | Invitrogen | Cat# L34957 |
| Super Bright Complete Staining Buffer | eBioscience | Cat# SB-4401–75 |
| Horseradish Peroxidase-conjugated streptavidin | Jackson Immuno Research | Cat# 016–030-084; RRID:AB_2337238 |
| TMB substrate | Pierce | Cat# 34021 |
| Proteinase K Solution | Invitrogen | Cat# 25530049 |
| ExoSAP-IT™ PCR Product Cleanup Reagent | Applied Biosystems | Cat# 78201.1.ML |
| iTaq™ Universal SYBR® Green Supermix | Bio-Rad | Cat# 1725125 |
| GolgiStop™ | BD Biosciences | Cat# 554724 |
| GolgiPlug™ | BD Biosciences | Cat# 555029 |
| PMA | Sigma-Aldrich | Cat# P1585 |
| Ionomycin calcium salt | Sigma-Aldrich | Cat# I0634 |
| Mouse Erythrocyte Lysing Kit | R & D Systems | Cat# WL2000 |
| Percoll™ | Thermo Fisher Scientific | Cat# 45–001-747 |
| RPMI 1640 | Thermo Fisher Scientific | Cat# MT10040CV |
| DMEM | Gibco™ | Cat# 11–995-065 |
| Penicillin-Streptomycin-Glutamine | Gibco™ | Cat# 10–378-016 |
| Collagenase IV | Worthington Biochemical | Cat# LS004189 |
| L-Tryptophan | Sigma-Aldrich | Cat# T0254 |
| Peptone | Sigma | Cat# 70173 |
| Tryptone | Sigma | Cat# T7293 |
| Sodium chloride | Sigma | Cat# S3014 |
| Indole-3-Aldehyde (I3A) | Sigma-Aldrich | Cat# 129445 |
| L-kynurenine | Sigma-Aldrich | Cat# K8625 |
| 6-Formylindolo(3,2-b)carbazole (FICZ) | Fischer Scientific | Cat# 50–103-1779 |
| AHR inhibitor (CH-223191) | Sigma-Aldrich | Cat# C8124 |
| RNAprotect™ | Qiagen | Cat# 76106 |
| DNase I | Roche | Cat# 10104159001 |
| Lactobacillus MRS Broth (DeMann Rosa Sharpe) | BD Biosciences | Cat# DF0881–17-5 |
| Tryptic Soy Broth | BD Bacto | Cat# DF0370–17-3 |
| Brain Heart Infusion Broth | Fisher Scientific | Cat# CM1135B |
| Defibrinated Sheep Blood | Fisher Scientific | Cat# 50–863-753 |
| Reinforced Clostridial Broth | Fisher Scientific | Cat# OXCM0149B |
| Cooked Meat Broth | Fisher BD | Cat# 226730 |
| Agar | Fisher BD | Cat# DF0140–01-0 |
| Chocolate Agar | Fisher Scientific | Cat# R01300 |
| Bacteroides Bile Esculin Agar | Fisher Scientific | Cat# NC0998155 |
| Gentamicin | Sigma-Aldrich | Cat# G1914–5G |
| Metronidazole | Sigma-Aldrich | Cat# M3761–25G |
| Colistin | Sigma-Aldrich | Cat# C4461–1G |
| Kanamycin | Fisher Scientific | Cat# 11–815-024 |
| Ampicillin | Fisher Bioreagents | Cat# BP1760–25 |
| Vancomycin | Sigma-Aldrich | Cat# V2002 |
| Normocin | InvivoGen | Cat# ant-nr-1 |
| Zeocin | InvivoGen | Cat# ant-zn-05 |
| QUANTI-Luc™ | InvivoGen | Cat# rep-qlc1 |
| Fluorescein isothiocyanate (FITC)–dextran (MW 4,000) | Sigma-Aldrich | Cat# 46944 |
| NP-40 (IGEPAL® CA-630) | Sigma-Aldrich | Cat# 18896 |
| Pierce™ FlexMix™ Calibration Solution | Thermo Fisher Scientific | Cat# A39239 |
| Critical Commercial Assays | ||
| FoxP3 Transcription Factor Staining Kit | eBioscience | Cat# 00–5523-00 |
| Cytofix/Cytoperm™ Fixation/Permeablization Kit | BD Biosciences | Cat# 554714 |
| EasySep™ Mouse CD90.2 Positive Selection Kit II | STEMCELL | Cat# 18951 |
| EasySep™ Mouse Naïve CD8 T Cell Isolation Kit | STEMCELL | Cat# 19858 |
| Fast DNA Stool Mini Kit | Qiagen | Cat# 51604 |
| RNeasy Plus Mini Kit | Qiagen | Cat# 74136 |
| iScript™ cDNA Synthesis Kit | Bio-Rad | Cat# 1708891 |
| SuperScript™ VILO™ cDNA Synthesis Kit | Invitrogen | Cat# 11754050 |
| BD Phosflow Lyse/Fix Buffer | BD Biosciences | Cat# 558049 |
| True-Phos Perm Buffer | BioLegend | Cat# 425401 |
| Mouse Anti-nuclear antibody (ANA) ELISA Kit | MyBioSource | Cat# MBS261480 |
| xyPrep Mag PCR clean-up | Axygen biosciences | Cat# MAG-PCR-CL-50 (Corning) |
| 4200 TapeStation DNA 1000 kit Qubit dsDNA HS Assay Kit | Agilent | Cat# 5067–5585 |
| Deposited Data | ||
| Experimental Models: Cell Lines | ||
| B16-F0 cell line | ATCC | Cat# CRL-6322 |
| YUMM1.7 cell line | ATCC | Cat# CRL-3362 |
| MC38 cell line | Kerafast | Cat# ENH204-FP |
| HT29-Lucia™ AhR reporter cell line | Invivogen | Cat# ht2l-ahr |
| Experimental Models: Organisms/Strains | ||
| Mouse: B6.C57BL/6J | Jackson Laboratory | Stock No: 000664 |
| Mouse: B6. Cg-Rag2tm1.1Cgn/J | Jackson Laboratory | Stock No: 008449 |
| Mouse: B6. IfngL E8I Cre | Provided by D. Vignali | N/A |
| Mouse: B6. Ahrfl CD8a Cre (B6. Ahrtm3.1Bra/J x B6.C57BL/6J-Tg(Cd8a*-cre)B8Asin/J x) | Jackson Laboratory | Stock No: 006203 x Stock No: 008766 |
| Mouse: B6. Ahrfl CD11c Cre (B6. Ahrtm3.1Bra/J x B6N.Cg-Tg(Itgax-cre)1–1Reiz/J) | Jackson Laboratory | Stock No: 006203 x Stock No: 018967 |
| Mouse: B6. Ahrfl LysM Cre (B6. Ahrtm3.1Bra/J x B6. B6.129P2-Lyz2tm1(cre)Ifo/J) | Jackson Laboratory | Stock No: 006203 x Stock No: 004781 |
| Mouse: B6.FVB-Tg(MMTV-PyVT)634Mul/LellJ | Jackson Laboratory | Stock No: 022974 |
| L. reuteri | ATCC | Cat# BAA-2837 |
| L. johnsonii | ATCC | Cat# BAA-3147 |
| B. longum | ATCC | Cat# BAA-999 |
| E. coli | ATCC | Cat# BAA-1429 |
| ΔArAT L. reuteri | Provided by L. Cervantes-Barragan | N/A |
| Oligonucleotides | ||
| Primers for qRT-PCR, PCR, and 16S sequencing see Table S4 | ||
| Software and Algorithms | ||
| QIIME2 version 2022.8. | N/A | |
| Cell Ranger-4.0.0 | Chromium Single Cell Software Suite | N/A |
| Seurat v4.0.1 | R | N/A |
| SoftMax Pro 3.0.7 Software | SpectraMax® i3x | N/A |
| CFX Maestro | Bio-Rad | N/A |
| Quan Browser Xcalibur ver. 2.7 | Thermo Fisher | N/A |
| GraphPad Prism 9 | GraphPad Software | N/A |
| FlowJo 10.7.1 | Tree Star | https://www.flowjo.com/solutions/flowjo/downloads |
| Adobe Illustrator | Adobe | N/A |
| BioRender | BioRender | N/A |
Highlights.
L. reuteri translocates to and drives antitumor Tc1 immunity from within the tumor
L. reuteri-derived metabolite indole-3-aldehyde (I3A) improves immune checkpoint inhibitor treatment (ICI) efficacy
I3A induces aryl hydrocarbon receptor-dependent CREB activation thereby driving Tc1 effector function
Potential role of I3A in promoting ICI response and survival in melanoma patients
Acknowledgments
We thank the Unified Flow Core at the Department of Immunology, University of Pittsburgh for flow cytometry sorting and resources, the Single Cell Core at the University of Pittsburgh for performing 10x genomic workflow and library generation, the Gnotobiotic Core Facility at the University of Pittsburgh for their service, and the Health Sciences Mass Spectrometry Core at the University of Pittsburgh for their service.
Funding:
This work was supported by an Investigator Start-up Fund, Department of Immunology, University of Pittsburgh School of Medicine to M.M and R.H; a Hillman Developmental Pilot Award (NIH/NCI P30 CA047904) to M.M. and A.V.J; a NIH/NIDDK R01 DK130897, a NIH/NCI R21 CA259636, and a Melanoma Research Alliance award https://doi.org/10.48050/pc.gr.143738 (820677) to M.M.; T32 CA082084 to A.C.M and C.M.P; NIH T32 AI089443 to L.M.S; F32 CA247004–01, T32 CA082084 to A.M.G.D; P01 AI108545 and R01 CA203689 to D.A.A.V.; A NIH R56AI168478, R21AI163721 grant and a Hillman Developmental Pilot Award (NIH/NCI P30 CA047904) to R.H.; NIH/NIDDK R01 DK129950 to L.C.B.; a NIHS10OD023402 grant to S.L.G.; T.R and S.T.M.L are supported by an Institutional Development Award (IDeA) from the National Institute of General Medical Sciences of the National Institutes of Health under grant number P20 GM103418; a NIH R01CA253329 and U01CA272541 to J.F.P; a NIH/NCI RO1CA222203, P50CA254865, and U01CA268806 to H.M.Z. This research was supported in part by the Intramural Research Program of the NIH, NCI to N.C. and J.A.M..
Footnotes
Publisher's Disclaimer: This is a PDF file of an unedited manuscript that has been accepted for publication. As a service to our customers we are providing this early version of the manuscript. The manuscript will undergo copyediting, typesetting, and review of the resulting proof before it is published in its final form. Please note that during the production process errors may be discovered which could affect the content, and all legal disclaimers that apply to the journal pertain.
DECLARATION OF INTERESTS: D.A.A.V.: cofounder and stock holder – Novasenta, Tizona, Trishula; stock holder – Oncorus, Werewolf; patents licensed and royalties – Novasenta, BMS; scientific advisory board member - Tizona, Werewolf, F-Star, Bicara, Apeximmune, T7/Imreg Bio; consultant - BMS, Almirall, Incyte, G1 Therapeutics, Inzen Therapeutics, Regeneron, Avidity Partners; research funding - BMS, Novasenta. A.V.J: Research funding – Mitsubishi Tanabe Pharma. J.F.P: cofounder and stock holder – Gateway Biome Corporation. D.D.: grants/Research Support (institutional) - Arcus, CellSight Technologies, Immunocore, Merck, Regeneron Pharmaceuticals Inc., Tesaro/GSK; consultant: Clinical Care Options (CCO), Finch Therapeutics, Gerson Lehrman Group (GLG), Medical Learning Group (MLG), Xilio Therapeutics; CE Speakers’ Bureau - Castle Biosciences; intellectual Property includes US Patent 63/124,231, “Compositions and Methods for Treating Cancer”, Dec 11, 2020 and US Patent 63/208,719, “Compositions and Methods For Determining Responsiveness to Immune Checkpoint Inhibitors (ICI), Increasing Effectiveness of ICI and Treating Cancer”, June 9, 2021.
INCLUSION AND DIVERSITY STATEMENT: One or more of the authors of this paper a) self-identifies as an underrepresented ethnic minority in science or a member of the LGBTQ+ community or b) received support from a program designed to increase minority representation in science.
References and Notes:
- 1.Hodi FS, O’Day SJ, McDermott DF, Weber RW, Sosman JA, Haanen JB, Gonzalez R, Robert C, Schadendorf D, Hassel JC, et al. (2010). Improved survival with ipilimumab in patients with metastatic melanoma. N Engl J Med 363, 711–723. 10.1056/NEJMoa1003466. [DOI] [PMC free article] [PubMed] [Google Scholar]
- 2.Robert C, Thomas L, Bondarenko I, O’Day S, Weber J, Garbe C, Lebbe C, Baurain JF, Testori A, Grob JJ, et al. (2011). Ipilimumab plus dacarbazine for previously untreated metastatic melanoma. N Engl J Med 364, 2517–2526. 10.1056/NEJMoa1104621. [DOI] [PubMed] [Google Scholar]
- 3.Topalian SL, Hodi FS, Brahmer JR, Gettinger SN, Smith DC, McDermott DF, Powderly JD, Carvajal RD, Sosman JA, Atkins MB, et al. (2012). Safety, activity, and immune correlates of anti-PD-1 antibody in cancer. N Engl J Med 366, 2443–2454. 10.1056/NEJMoa1200690. [DOI] [PMC free article] [PubMed] [Google Scholar]
- 4.Hamid O, Robert C, Daud A, Hodi FS, Hwu WJ, Kefford R, Wolchok JD, Hersey P, Joseph RW, Weber JS, et al. (2013). Safety and tumor responses with lambrolizumab (anti-PD-1) in melanoma. N Engl J Med 369, 134–144. 10.1056/NEJMoa1305133. [DOI] [PMC free article] [PubMed] [Google Scholar]
- 5.Miller BC, Sen DR, Al Abosy R, Bi K, Virkud YV, LaFleur MW, Yates KB, Lako A, Felt K, Naik GS, et al. (2019). Subsets of exhausted CD8(+) T cells differentially mediate tumor control and respond to checkpoint blockade. Nat Immunol 20, 326–336. 10.1038/s41590-019-0312-6. [DOI] [PMC free article] [PubMed] [Google Scholar]
- 6.Sade-Feldman M, Yizhak K, Bjorgaard SL, Ray JP, de Boer CG, Jenkins RW, Lieb DJ, Chen JH, Frederick DT, Barzily-Rokni M, et al. (2018). Defining T Cell States Associated with Response to Checkpoint Immunotherapy in Melanoma. Cell 175, 998–1013 e1020. 10.1016/j.cell.2018.10.038. [DOI] [PMC free article] [PubMed] [Google Scholar]
- 7.Sharma P, and Allison JP (2015). The future of immune checkpoint therapy. Science 348, 56–61. 10.1126/science.aaa8172. [DOI] [PubMed] [Google Scholar]
- 8.Luksza M, Riaz N, Makarov V, Balachandran VP, Hellmann MD, Solovyov A, Rizvi NA, Merghoub T, Levine AJ, Chan TA, et al. (2017). A neoantigen fitness model predicts tumour response to checkpoint blockade immunotherapy. Nature 551, 517–520. 10.1038/nature24473. [DOI] [PMC free article] [PubMed] [Google Scholar]
- 9.Snyder A, Makarov V, Merghoub T, Yuan J, Zaretsky JM, Desrichard A, Walsh LA, Postow MA, Wong P, Ho TS, et al. (2014). Genetic basis for clinical response to CTLA-4 blockade in melanoma. N Engl J Med 371, 2189–2199. 10.1056/NEJMoa1406498. [DOI] [PMC free article] [PubMed] [Google Scholar]
- 10.Sivan A, Corrales L, Hubert N, Williams JB, Aquino-Michaels K, Earley ZM, Benyamin FW, Lei YM, Jabri B, Alegre ML, et al. (2015). Commensal Bifidobacterium promotes antitumor immunity and facilitates anti-PD-L1 efficacy. Science 350, 1084–1089. 10.1126/science.aac4255. [DOI] [PMC free article] [PubMed] [Google Scholar]
- 11.Vetizou M, Pitt JM, Daillere R, Lepage P, Waldschmitt N, Flament C, Rusakiewicz S, Routy B, Roberti MP, Duong CP, et al. (2015). Anticancer immunotherapy by CTLA-4 blockade relies on the gut microbiota. Science 350, 1079–1084. 10.1126/science.aad1329. [DOI] [PMC free article] [PubMed] [Google Scholar]
- 12.Routy B, Le Chatelier E, Derosa L, Duong CPM, Alou MT, Daillere R, Fluckiger A, Messaoudene M, Rauber C, Roberti MP, et al. (2018). Gut microbiome influences efficacy of PD-1-based immunotherapy against epithelial tumors. Science 359, 91–97. 10.1126/science.aan3706. [DOI] [PubMed] [Google Scholar]
- 13.Matson V, Fessler J, Bao R, Chongsuwat T, Zha Y, Alegre ML, Luke JJ, and Gajewski TF (2018). The commensal microbiome is associated with anti-PD-1 efficacy in metastatic melanoma patients. Science 359, 104–108. 10.1126/science.aao3290. [DOI] [PMC free article] [PubMed] [Google Scholar]
- 14.Baruch EN, Youngster I, Ben-Betzalel G, Ortenberg R, Lahat A, Katz L, Adler K, Dick-Necula D, Raskin S, Bloch N, et al. (2021). Fecal microbiota transplant promotes response in immunotherapy-refractory melanoma patients. Science 371, 602–609. 10.1126/science.abb5920. [DOI] [PubMed] [Google Scholar]
- 15.Davar D, Dzutsev AK, McCulloch JA, Rodrigues RR, Chauvin JM, Morrison RM, Deblasio RN, Menna C, Ding Q, Pagliano O, et al. (2021). Fecal microbiota transplant overcomes resistance to anti-PD-1 therapy in melanoma patients. Science 371, 595–602. 10.1126/science.abf3363. [DOI] [PMC free article] [PubMed] [Google Scholar]
- 16.Gopalakrishnan V, Spencer CN, Nezi L, Reuben A, Andrews MC, Karpinets TV, Prieto PA, Vicente D, Hoffman K, Wei SC, et al. (2018). Gut microbiome modulates response to anti-PD-1 immunotherapy in melanoma patients. Science 359, 97–103. 10.1126/science.aan4236. [DOI] [PMC free article] [PubMed] [Google Scholar]
- 17.Spencer CN, McQuade JL, Gopalakrishnan V, McCulloch JA, Vetizou M, Cogdill AP, Khan MAW, Zhang X, White MG, Peterson CB, et al. (2021). Dietary fiber and probiotics influence the gut microbiome and melanoma immunotherapy response. Science 374, 1632–1640. 10.1126/science.aaz7015. [DOI] [PMC free article] [PubMed] [Google Scholar]
- 18.Slizewska K, Markowiak-Kopec P, and Slizewska W (2020). The Role of Probiotics in Cancer Prevention. Cancers (Basel) 13. 10.3390/cancers13010020. [DOI] [PMC free article] [PubMed] [Google Scholar]
- 19.Suez J, Zmora N, Segal E, and Elinav E (2019). The pros, cons, and many unknowns of probiotics. Nat Med 25, 716–729. 10.1038/s41591-019-0439-x. [DOI] [PubMed] [Google Scholar]
- 20.Elkrief A, Derosa L, Kroemer G, Zitvogel L, and Routy B (2019). The negative impact of antibiotics on outcomes in cancer patients treated with immunotherapy: a new independent prognostic factor? Ann Oncol 30, 1572–1579. 10.1093/annonc/mdz206. [DOI] [PubMed] [Google Scholar]
- 21.Valeur N, Engel P, Carbajal N, Connolly E, and Ladefoged K (2004). Colonization and immunomodulation by Lactobacillus reuteri ATCC 55730 in the human gastrointestinal tract. Appl Environ Microbiol 70, 1176–1181. 10.1128/AEM.70.2.1176-1181.2004. [DOI] [PMC free article] [PubMed] [Google Scholar]
- 22.Trapnell C, Cacchiarelli D, Grimsby J, Pokharel P, Li S, Morse M, Lennon NJ, Livak KJ, Mikkelsen TS, and Rinn JL (2014). The dynamics and regulators of cell fate decisions are revealed by pseudotemporal ordering of single cells. Nat Biotechnol 32, 381–386. 10.1038/nbt.2859. [DOI] [PMC free article] [PubMed] [Google Scholar]
- 23.Tumeh PC, Harview CL, Yearley JH, Shintaku IP, Taylor EJ, Robert L, Chmielowski B, Spasic M, Henry G, Ciobanu V, et al. (2014). PD-1 blockade induces responses by inhibiting adaptive immune resistance. Nature 515, 568–571. 10.1038/nature13954. [DOI] [PMC free article] [PubMed] [Google Scholar]
- 24.Geller LT, Barzily-Rokni M, Danino T, Jonas OH, Shental N, Nejman D, Gavert N, Zwang Y, Cooper ZA, Shee K, et al. (2017). Potential role of intratumor bacteria in mediating tumor resistance to the chemotherapeutic drug gemcitabine. Science 357, 1156–1160. 10.1126/science.aah5043. [DOI] [PMC free article] [PubMed] [Google Scholar]
- 25.Riquelme E, Zhang Y, Zhang L, Montiel M, Zoltan M, Dong W, Quesada P, Sahin I, Chandra V, San Lucas A, et al. (2019). Tumor Microbiome Diversity and Composition Influence Pancreatic Cancer Outcomes. Cell 178, 795–806. 10.1016/j.cell.2019.07.008. [DOI] [PMC free article] [PubMed] [Google Scholar]
- 26.Nejman D, Livyatan I, Fuks G, Gavert N, Zwang Y, Geller LT, Rotter-Maskowitz A, Weiser R, Mallel G, Gigi E, et al. (2020). The human tumor microbiome is composed of tumor type-specific intracellular bacteria. Science 368, 973–980. 10.1126/science.aay9189. [DOI] [PMC free article] [PubMed] [Google Scholar]
- 27.Poore GD, Kopylova E, Zhu Q, Carpenter C, Fraraccio S, Wandro S, Kosciolek T, Janssen S, Metcalf J, Song SJ, et al. (2020). Microbiome analyses of blood and tissues suggest cancer diagnostic approach. Nature 579, 567–574. 10.1038/s41586-020-2095-1. [DOI] [PMC free article] [PubMed] [Google Scholar] [Retracted]
- 28.Fu A, Yao B, Dong T, Chen Y, Yao J, Liu Y, Li H, Bai H, Liu X, Zhang Y, et al. (2022). Tumor-resident intracellular microbiota promotes metastatic colonization in breast cancer. Cell 185, 1356–1372 e1326. 10.1016/j.cell.2022.02.027. [DOI] [PubMed] [Google Scholar]
- 29.Pandey SP, Bender MJ, McPherson AC, Phelps CM, Sanchez LM, Rana M, Hedden L, Sangani KA, Chen L, Shapira JH, et al. (2022). Tet2 deficiency drives liver microbiome dysbiosis triggering Tc1 cell autoimmune hepatitis. Cell Host Microbe 30, 1003–1019 e1010. 10.1016/j.chom.2022.05.006. [DOI] [PMC free article] [PubMed] [Google Scholar]
- 30.Meisel M, Hinterleitner R, Pacis A, Chen L, Earley ZM, Mayassi T, Pierre JF, Ernest JD, Galipeau HJ, Thuille N, et al. (2018). Microbial signals drive pre-leukaemic myeloproliferation in a Tet2-deficient host. Nature 557, 580–584. 10.1038/s41586-018-0125-z. [DOI] [PMC free article] [PubMed] [Google Scholar]
- 31.Zegarra-Ruiz DF, El Beidaq A, Iniguez AJ, Lubrano Di Ricco M, Manfredo Vieira S, Ruff WE, Mubiru D, Fine RL, Sterpka J, Greiling TM, et al. (2019). A Diet-Sensitive Commensal Lactobacillus Strain Mediates TLR7-Dependent Systemic Autoimmunity. Cell Host Microbe 25, 113–127. 10.1016/j.chom.2018.11.009. [DOI] [PMC free article] [PubMed] [Google Scholar]
- 32.Yang Y, Nguyen M, Khetrapal V, Sonnert ND, Martin AL, Chen H, Kriegel MA, and Palm NW (2022). Within-host evolution of a gut pathobiont facilitates liver translocation. Nature 607, 563–570. 10.1038/s41586-022-04949-x. [DOI] [PMC free article] [PubMed] [Google Scholar]
- 33.Campedelli I, Mathur H, Salvetti E, Clarke S, Rea MC, Torriani S, Ross RP, Hill C, and O’Toole PW (2019). Genus-Wide Assessment of Antibiotic Resistance in Lactobacillus spp. Appl Environ Microbiol 85. 10.1128/AEM.01738-18. [DOI] [PMC free article] [PubMed] [Google Scholar]
- 34.Choi SC, Brown J, Gong M, Ge Y, Zadeh M, Li W, Croker BP, Michailidis G, Garrett TJ, Mohamadzadeh M, and Morel L (2020). Gut microbiota dysbiosis and altered tryptophan catabolism contribute to autoimmunity in lupus-susceptible mice. Sci Transl Med 12, eaax2220. 10.1126/scitranslmed.aax2220. [DOI] [PMC free article] [PubMed] [Google Scholar]
- 35.Klare I, Konstabel C, Werner G, Huys G, Vankerckhoven V, Kahlmeter G, Hildebrandt B, Muller-Bertling S, Witte W, and Goossens H (2007). Antimicrobial susceptibilities of Lactobacillus, Pediococcus and Lactococcus human isolates and cultures intended for probiotic or nutritional use. J Antimicrob Chemother 59, 900–912. 10.1093/jac/dkm035. [DOI] [PubMed] [Google Scholar]
- 36.Wang J, Perry CJ, Meeth K, Thakral D, Damsky W, Micevic G, Kaech S, Blenman K, and Bosenberg M (2017). UV-induced somatic mutations elicit a functional T cell response in the YUMMER1.7 mouse melanoma model. Pigment Cell Melanoma Res 30, 428–435. 10.1111/pcmr.12591. [DOI] [PMC free article] [PubMed] [Google Scholar]
- 37.Cervantes-Barragan L, Chai JN, Tianero MD, Di Luccia B, Ahern PP, Merriman J, Cortez VS, Caparon MG, Donia MS, Gilfillan S, et al. (2017). Lactobacillus reuteri induces gut intraepithelial CD4(+)CD8alphaalpha(+) T cells. Science 357, 806–810. 10.1126/science.aah5825. [DOI] [PMC free article] [PubMed] [Google Scholar]
- 38.Zelante T, Iannitti RG, Cunha C, De Luca A, Giovannini G, Pieraccini G, Zecchi R, D’Angelo C, Massi-Benedetti C, Fallarino F, et al. (2013). Tryptophan catabolites from microbiota engage aryl hydrocarbon receptor and balance mucosal reactivity via interleukin-22. Immunity 39, 372–385. 10.1016/j.immuni.2013.08.003. [DOI] [PubMed] [Google Scholar]
- 39.Veldhoen M, Hirota K, Westendorf AM, Buer J, Dumoutier L, Renauld JC, and Stockinger B (2008). The aryl hydrocarbon receptor links TH17-cell-mediated autoimmunity to environmental toxins. Nature 453, 106–109. 10.1038/nature06881. [DOI] [PubMed] [Google Scholar]
- 40.Quintana FJ, Basso AS, Iglesias AH, Korn T, Farez MF, Bettelli E, Caccamo M, Oukka M, and Weiner HL (2008). Control of T(reg) and T(H)17 cell differentiation by the aryl hydrocarbon receptor. Nature 453, 65–71. 10.1038/nature06880. [DOI] [PubMed] [Google Scholar]
- 41.Shaywitz AJ, and Greenberg ME (1999). CREB: a stimulus-induced transcription factor activated by a diverse array of extracellular signals. Annu Rev Biochem 68, 821–861. 10.1146/annurev.biochem.68.1.821. [DOI] [PubMed] [Google Scholar]
- 42.Samten B, Howard ST, Weis SE, Wu S, Shams H, Townsend JC, Safi H, and Barnes PF (2005). Cyclic AMP response element-binding protein positively regulates production of IFN-gamma by T cells in response to a microbial pathogen. J Immunol 174, 6357–6363. 10.4049/jimmunol.174.10.6357. [DOI] [PubMed] [Google Scholar]
- 43.Samten B, Townsend JC, Weis SE, Bhoumik A, Klucar P, Shams H, and Barnes PF (2008). CREB, ATF, and AP-1 transcription factors regulate IFN-gamma secretion by human T cells in response to mycobacterial antigen. J Immunol 181, 2056–2064. 10.4049/jimmunol.181.3.2056. [DOI] [PMC free article] [PubMed] [Google Scholar]
- 44.Yao C, Hirata T, Soontrapa K, Ma X, Takemori H, and Narumiya S (2013). Prostaglandin E(2) promotes Th1 differentiation via synergistic amplification of IL-12 signalling by cAMP and PI3-kinase. Nat Commun 4, 1685. 10.1038/ncomms2684. [DOI] [PMC free article] [PubMed] [Google Scholar]
- 45.Barton K, Muthusamy N, Chanyangam M, Fischer C, Clendenin C, and Leiden JM (1996). Defective thymocyte proliferation and IL-2 production in transgenic mice expressing a dominant-negative form of CREB. Nature 379, 81–85. 10.1038/379081a0. [DOI] [PubMed] [Google Scholar]
- 46.Kallies A, Xin A, Belz GT, and Nutt SL (2009). Blimp-1 transcription factor is required for the differentiation of effector CD8(+) T cells and memory responses. Immunity 31, 283–295. 10.1016/j.immuni.2009.06.021. [DOI] [PubMed] [Google Scholar]
- 47.Xin A, Masson F, Liao Y, Preston S, Guan T, Gloury R, Olshansky M, Lin JX, Li P, Speed TP, et al. (2016). A molecular threshold for effector CD8(+) T cell differentiation controlled by transcription factors Blimp-1 and T-bet. Nat Immunol 17, 422–432. 10.1038/ni.3410. [DOI] [PMC free article] [PubMed] [Google Scholar]
- 48.Hezaveh K, Shinde RS, Klotgen A, Halaby MJ, Lamorte S, Ciudad MT, Quevedo R, Neufeld L, Liu ZQ, Jin R, et al. (2022). Tryptophan-derived microbial metabolites activate the aryl hydrocarbon receptor in tumor-associated macrophages to suppress anti-tumor immunity. Immunity 55, 324–340 e328. 10.1016/j.immuni.2022.01.006. [DOI] [PMC free article] [PubMed] [Google Scholar]
- 49.Roager HM, and Licht TR (2018). Microbial tryptophan catabolites in health and disease. Nat Commun 9, 3294. 10.1038/s41467-018-05470-4. [DOI] [PMC free article] [PubMed] [Google Scholar]
- 50.Davar D, Wang H, Chauvin JM, Pagliano O, Fourcade JJ, Ka M, Menna C, Rose A, Sander C, Borhani AA, et al. (2018). Phase Ib/II Study of Pembrolizumab and Pegylated-Interferon Alfa-2b in Advanced Melanoma. J Clin Oncol, JCO1800632. 10.1200/JCO.18.00632. [DOI] [PMC free article] [PubMed]
- 51.Badawy AA (2017). Kynurenine Pathway of Tryptophan Metabolism: Regulatory and Functional Aspects. Int J Tryptophan Res 10, 1178646917691938. 10.1177/1178646917691938. [DOI] [PMC free article] [PubMed] [Google Scholar]
- 52.Azuma K, Xiang H, Tagami T, Kasajima R, Kato Y, Karakawa S, Kikuchi S, Imaizumi A, Matsuo N, Ishii H, et al. (2022). Clinical significance of plasma-free amino acids and tryptophan metabolites in patients with non-small cell lung cancer receiving PD-1 inhibitor: a pilot cohort study for developing a prognostic multivariate model. J Immunother Cancer 10. 10.1136/jitc-2021-004420. [DOI] [PMC free article] [PubMed] [Google Scholar]
- 53.Geca K, Rawicz-Pruszynski K, Mlak R, Sadok I, Polkowski WP, and Staniszewska M (2022). Kynurenine and Anthranilic Acid in the Peritoneum Correlate With the Stage of Gastric Cancer Disease. Int J Tryptophan Res 15, 11786469211065620. 10.1177/11786469211065620. [DOI] [PMC free article] [PubMed] [Google Scholar]
- 54.Weinlich G, Murr C, Richardsen L, Winkler C, and Fuchs D (2007). Decreased serum tryptophan concentration predicts poor prognosis in malignant melanoma patients. Dermatology 214, 8–14. 10.1159/000096906. [DOI] [PubMed] [Google Scholar]
- 55.Meireson A, Ferdinande L, Haspeslagh M, Hennart B, Allorge D, Ost P, Sundahl N, Spaas M, Demeyer A, and Brochez L (2021). Clinical Relevance of Serum Kyn/Trp Ratio and Basal and IFNgamma-Upregulated IDO1 Expression in Peripheral Monocytes in Early Stage Melanoma. Front Immunol 12, 736498. 10.3389/fimmu.2021.736498. [DOI] [PMC free article] [PubMed] [Google Scholar]
- 56.Lee KA, Thomas AM, Bolte LA, Bjork JR, de Ruijter LK, Armanini F, Asnicar F, Blanco-Miguez A, Board R, Calbet-Llopart N, et al. (2022). Cross-cohort gut microbiome associations with immune checkpoint inhibitor response in advanced melanoma. Nat Med 28, 535–544. 10.1038/s41591-022-01695-5. [DOI] [PMC free article] [PubMed] [Google Scholar]
- 57.McCulloch JA, Davar D, Rodrigues RR, Badger JH, Fang JR, Cole AM, Balaji AK, Vetizou M, Prescott SM, Fernandes MR, et al. (2022). Intestinal microbiota signatures of clinical response and immune-related adverse events in melanoma patients treated with anti-PD-1. Nat Med 28, 545–556. 10.1038/s41591-022-01698-2. [DOI] [PMC free article] [PubMed] [Google Scholar]
- 58.Limeta A, Ji B, Levin M, Gatto F, and Nielsen J (2020). Meta-analysis of the gut microbiota in predicting response to cancer immunotherapy in metastatic melanoma. JCI Insight 5. 10.1172/jci.insight.140940. [DOI] [PMC free article] [PubMed] [Google Scholar]
- 59.Spranger S, Koblish HK, Horton B, Scherle PA, Newton R, and Gajewski TF (2014). Mechanism of tumor rejection with doublets of CTLA-4, PD-1/PD-L1, or IDO blockade involves restored IL-2 production and proliferation of CD8(+) T cells directly within the tumor microenvironment. J Immunother Cancer 2, 3. 10.1186/2051-1426-2-3. [DOI] [PMC free article] [PubMed] [Google Scholar]
- 60.Eynde Van den et al. (2020). Is There a Clinical Future for IDO1 Inhibitors After the Failure of Epacadostat in Melanoma? Annual Review of Cancer Biology 4, 241–256. [Google Scholar]
- 61.Martins F, Sofiya L, Sykiotis GP, Lamine F, Maillard M, Fraga M, Shabafrouz K, Ribi C, Cairoli A, Guex-Crosier Y, et al. (2019). Adverse effects of immune-checkpoint inhibitors: epidemiology, management and surveillance. Nat Rev Clin Oncol 16, 563–580. 10.1038/s41571-019-0218-0. [DOI] [PubMed] [Google Scholar]
- 62.Reuter G (2001). The Lactobacillus and Bifidobacterium microflora of the human intestine: composition and succession. Curr Issues Intest Microbiol 2, 43–53. [PubMed] [Google Scholar]
- 63.Bouziat R, Hinterleitner R, Brown JJ, Stencel-Baerenwald JE, Ikizler M, Mayassi T, Meisel M, Kim SM, Discepolo V, Pruijssers AJ, et al. (2017). Reovirus infection triggers inflammatory responses to dietary antigens and development of celiac disease. Science 356, 44–50. 10.1126/science.aah5298. [DOI] [PMC free article] [PubMed] [Google Scholar]
- 64.Hao Y, Hao S, Andersen-Nissen E, Mauck WM 3rd, Zheng S, Butler A, Lee MJ, Wilk AJ, Darby C, Zager M, et al. (2021). Integrated analysis of multimodal single-cell data. Cell 184, 3573–3587 e3529. 10.1016/j.cell.2021.04.048. [DOI] [PMC free article] [PubMed] [Google Scholar]
- 65.Cao J, Spielmann M, Qiu X, Huang X, Ibrahim DM, Hill AJ, Zhang F, Mundlos S, Christiansen L, Steemers FJ, et al. (2019). The single-cell transcriptional landscape of mammalian organogenesis. Nature 566, 496–502. 10.1038/s41586-019-0969-x. [DOI] [PMC free article] [PubMed] [Google Scholar]
- 66.Meisel M, Mayassi T, Fehlner-Peach H, Koval JC, O’Brien SL, Hinterleitner R, Lesko K, Kim S, Bouziat R, Chen L, et al. (2017). Interleukin-15 promotes intestinal dysbiosis with butyrate deficiency associated with increased susceptibility to colitis. ISME J 11, 15–30. 10.1038/ismej.2016.114. [DOI] [PMC free article] [PubMed] [Google Scholar]
Associated Data
This section collects any data citations, data availability statements, or supplementary materials included in this article.
Supplementary Materials
(A) B16-F0 tumor growth of mice orally administered Lr or PBS daily starting once tumors reached approximately 150 mm3 (D6 pTCE); treatment continued until endpoint analysis (EPA) (n = 5 per group). OG, oral gavage. (B) Survival analysis of mice from (A). (C) Relative abundance of Lr normalized to host DNA (Ifnb) within the small intestine (SI), cecum, and colon of mice orally administered Lr or PBS daily starting one day pTCE until D14. (D-K) B16-F0 tumor-bearing mice were orally administered Lr or PBS daily starting on D6 pTCE and until D17 (n= 3–5 mice per group). (D) Hierarchical clustering heatmap of genera within the small intestine (SI) and cecum. (E and F) Pattern Search analysis of genera by treatment from the SI (E) and cecum (F) of mice from (D). (G) Relative abundance of Lactobacilli genus within SI and cecum of individual mice from (D). (H and I) Taxonomic bacterial composition distribution at family level for SI (H) and cecum (I) samples of mice from D. (J and K) Principal component analysis of SI (J) and cecal (K) microbiomes of individual mice from (D). Data for (A) represents mean ± SEM analyzed by two-way analysis of variance (ANOVA) with Sidak’s correction for multiple comparisons. Data for (B) represents comparison of survival curves analyzed by log-rank test. Data for (C) represents individual mice analyzed by unpaired t-test. Mean ± SEM is shown. Data for (G) represents individual mice analyzed by one-way ANOVA. Mean ± SEM is shown. *P < 0.05, **P < 0.01, *** P< 0.001, ****P < 0.0001; ns, not significant.
(A) Experimental schematic of mice from (Fig. 1E–F; Fig. S2B–M): For D9 (blue line) and D11 (green line) timepoints, mice were orally administered Lr or PBS daily starting on D6 when tumors were ~150 mm3 in volume; For D17 (pink line) mice were orally administered Lr or PBS daily starting on D1 pTCE. Tumor-infiltrating lymphocytes (TILs) from the tumor and spleen were assessed by flow cytometry (n = 4 – 8 mice per group); s.c., subcutaneous. (B-E) Percentage (left) and total cells normalized to g tumor tissue (right) of Ki67+ Th1 cells (B), Ki67+ Tc1 cells (C), GzmB+ Th1 cells (D), and GzmB+ Tc1 cells (E) within the TME of mice from (A). Th1, IFNγ+ CD4 T cells; Tc1, IFNγ+ CD8 T cells. (F and G) Quantification of percentage of Foxp3+ CD4 T cells (regulatory T cells (Tregs)) (F) and IFNγ+ Tregs (G) within the TME of mice from (A). (H-M) Percentage (left) and total cells (right) of IFNγ+ CD4 T (Th1) cells (H), IFNγ+ CD8 T (Tc1) cells (I), Ki67+ Th1 cells (J), Ki67+ Tc1 cells (K), GzmB+ Th1 cells (L), and GzmB+ Tc1 cells (M) within the spleen of mice from (A). (N and O) B16-F0 tumor-bearing mice treated with daily OG of PBS or Lr starting one day pTCE and sacrificed on D14. Percentage (left) and total cells (right) of IFNγ+ CD4 T (Th1) cells (N), IFNγ+ CD8 T (Tc1) cells (O) within the lamina propria (n = 4 – 5 mice per group). Data for (B-O) represent individual mice analyzed by unpaired t-test. Mean ± SEM is shown. *P < 0.05, **P < 0.01, ***P < 0.001, ****P < 0.0001; ns, not significant.
(A-F) B16-F0-bearing mice were treated with daily oral gavage of Lr or PBS daily starting on D6 pTCE until EPA (D9, D11, or D17). Immune cells from the tumor were assessed by flow cytometry. Percentage (left) and total cells normalized to g tumor tissue (right) of dendritic cells (DCs) (A), macrophages (B), myeloid-derived suppressor cells (MDSCs) (C), natural killer cells (NK cells) (D), natural killer T cells (NKT cells) (E), and γδ T cells (F) (n = 4–6 mice per group). (G) B16-F0 tumor growth of Rag−/− and WT mice orally administered Lr or PBS daily starting one day pTCE (n = 4 (WT PBS), n = 5 (WT Lr), n = 5 (Rag−/− PBS), n = 5 (Rag−/− Lr)). (H) B16-F0 tumor growth of mice orally administered Lr or PBS daily starting one day pTCE and treated with anti-mouse CD8α, anti-mouse CD4, or isotype control (Iso. ctrl.) one day prior to TCE, on D6 and on D13 pTCE (n = 4–5 mice/group). (I) B16-F0 tumor growth curve of Rag−/− mice that received an adoptive cell transfer (ACT) of 5 × 10⁵ CD8 T cells from WT donor mice one day prior to TCE and were treated with orally administered Lr or PBS daily starting one day pTCE (n = 3 per group). (J) Survival of mice from (I). Data for (A-F) represent individual mice analyzed by unpaired t-test. Mean ± SEM is shown. Data for (G), (H), and (I) represent mean ± SEM analyzed by two-way ANOVA with Sidak’s correction for multiple comparisons. Data for (J) represents comparison of survival curves analyzed by log-rank test. *P < 0.05, ***P < 0.001, ****P < 0.0001; ns, not significant.
(A and B) Single-cell RNA-sequencing analysis of CD8 T cells isolated from the TME on D15 of mice treated daily with Lr or PBS starting one day pTCE (n = 4 mice/group). (A) Heatmap showing the top 10 differentially expressed genes expressed for each individual cluster shown in Fig. 1G. (B) Distribution of gene expression levels (Nkg7, Gzmb, Ccl4, Ccl5) in individual CD8 T cells. (C) Percentage (top) and total cells normalized to g tumor tissue (bottom) of IFNγ+ CD8 T cells within the TME of mice from (Fig.1L) assessed by flow cytometry on D14. (D) B16-F0 tumor growth of mice orally administered Lr or PBS daily starting on D5 pTCE (tumor size ~100 mm3) and treated with intraperitoneal injections (IP) of 50 μg αPD-L1 or isotype control (Iso. ctrl.) on D5, 7, 9 and 12 (n = 4–6 mice/group). (E) B16-F0 tumor growth of mice orally administered Lr or PBS daily starting on D5 pTCE (tumor size ~100 mm3) and treated with IP of 100 μg αCTLA-4 or isotype control (Iso. ctrl.) on D5, 8, 11 and 14 (n = 4–6 mice/group). Data for (B) represents violin plots showing distributions of expression levels in individual cells analyzed by Wilcoxon test; p-value is shown. Data for (C) represents individual mice analyzed by one-way ANOVA with Sidak’s correction for multiple comparisons. Mean ± SEM is shown. Data for (D) and (E) represent mean ± SEM analyzed by two-way ANOVA with Sidak’s correction for multiple comparisons. *P < 0.05, **P < 0.01, ****P < 0.0001.
(A) Images of tumor homogenate cultures on MRS agar of mice orally administered PBS (M1 – 5) or Lr (M6 – 10) for four consecutive days starting on D8 pTCE. Tumors were harvested for culture on D15 pTCE (n = 5 per group). Presence of Lj was confirmed in one PBS treated mouse (M1) by 16S amplicon sequencing. (B and C) B16-F0-bearing germ-free (GF) or specific pathogen-free (SPF) mice were orally gavaged daily with Lr or PBS (GF = OG every other day for 4–7 treatments; SPF = OG daily for 7 treatments). CFU quantification of Lr per mg tumor (B) or organ (C). Median is shown. Presence of Lr was confirmed by 16S amplicon sequencing of individual colonies. (D) Concentration of 4-kDa fluorescein isothiocyanate (FITC) dextran in plasma of mice orally administered Lr or PBS daily starting one day pTCE for 14 days (n = 5 per group). (E) Concentration of FITC-dextran in plasma of mice orally administered Lr or PBS daily starting on D5 pTCE (for D9 and D11 EPA) or starting on D1 pTCE (for D14 EPA). (F) Jejunal (top) and colonic (bottom) gene expression of intestinal barrier genes normalized to Gapdh of mice from (D). (G) Representative images of tumor homogenate cultures on Tryptic Soy agar (left) and detection of viable Ec within the tumors (right) of mice orally administered Ec daily starting one day pTCE until EPA of Fig. 1C. Ec presence confirmed by 16S amplicon sequencing of individual colonies. (H) Detection of viable Bl within the tumors of mice orally administered Bl daily starting one day pTCE until EPA of Fig. 1C. (I) CFU quantification of Lr per mg tumor from mice intratumorally (IT) injected with Lr or vehicle control (PBS) one time when tumors reached approximately 200 mm3 and sacrificed at indicated time points pTCE (D10 - D22) (n = 1 (PBS) mouse per time point, n = 2–3 (Lr ) mice per time point). Median is shown. (J) CFU of Lr per mg tumor from (I) versus respective tumor weights of individual mice from (I). (K) Quantification of CFU/mL of Lr cultured in MRS broth supplemented with vehicle control, 0.5 mg/mL vancomycin (VAN), or 0.5 mg/mL ampicillin (AMP); ABX, antibiotics. (L) Experimental schematic of mice from (Fig. 2H–2J and Fig. S5M–S5N): mice were orally administered Lr or PBS daily and IT injected with VAN or AMP every other day starting on D8 pTCE. Treatment continued until EPA (n = 5 per group). (M) Relative abundance of Lr normalized to host DNA (Ifnb) within the small intestine (SI) at EPA of mice treated as in (L). (N) Relative abundance of 16S rRNA copies normalized to host DNA (Ifnb) within the fecal matter of mice from (L) prior to the start of antibiotic (ABX) and Lr or PBS treatment (D7) and upon EPA. (O) Relative abundance of Lr normalized to host DNA (Ifnb) within the SI at EPA of mice from (Fig. 2L). (P) CFU of bacteria per mg tissue from GF mice from (Fig. 2L) monocolonized with Lr. Median is shown. Data for (D) represents individual mice analyzed by one-way ANOVA with Sidak’s correction for multiple comparisons. Mean ± SEM is shown. Data for (E) represents individual mice analyzed by unpaired t-test for each day. Mean ± SEM is shown. Data for (F) represents mean ± SEM of individual mice analyzed by one-way ANOVA with Sidak’s correction for multiple comparisons. Data for (I) represents individual mice analyzed by one-way ANOVA with Sidak’s correction for multiple comparisons. Median is shown. Data for (J) represents individual mice analyzed by nonparametric Spearman correlation. Data for (M) represents individual mice. Mean ± SEM is shown. Data for (N) represents individual mice analyzed by one-way ANOVA with Sidak’s correction for multiple comparisons. Mean ± SEM is shown. Data for (O) represents individual mice analyzed by unpaired t-test. Mean ± SEM is shown. *P < 0.05, **P < 0.01; ns, not significant.
(A) Extracted ion chromatograph of 13C1 creatine (left) and I3A (right) standards. Retention time (RT) in min is indicated at the top of each chromatograph. (B and C) Supernatant of Lr WT or ΔArAT cultured in PTT media was used to assess each strain’s ability to produce I3A. Extracted ion chromatogram of supernatant (B) and quantification of pmol I3A/100 µL supernatant (C) assessed by mass spectrometry (n = 1 per group). 13C1 creatine is used as a reference protein and for normalization of I3A. Red outline in (B) indicates I3A peak after a RT of 3.2 min. (D) Image of Lr-strain-specific PCR of tumor-isolated bacterial colonies from Fig. 4D. Lanes 1–5: colonies from tumors of Lr WT OG mice (1 colony per mouse); 6–9: colonies from Lr ΔArAT OG mice tumors (1 colony per mouse); lane 10- positive Lr WT control; 11- positive Lr ΔArAT control; 12- negative PCR reaction control. (E) Mice were administered Lr WT or ΔArAT daily starting on D1 pTCE until D17, and tumor samples were homogenized and cultured in PTT media. AhR activity of tumor expansion culture supernatants was measured as luminescence by luciferase-expressing AhR reporter cells. The dotted line represents the mean luminescence of PTT media, (n = 4–5 mice/group). (F) Relative abundance of Lj normalized to bacterial 16s within the small intestine of B16-F0 tumor-bearing mice orally administered PBS or Lj daily starting on D1 pTCE and sacrificed on D14. (G) Detection of viable Lj within the tumors of mice orally administered Lj daily starting one day pTCE until EPA of Fig. 1C. (H) Total number of IFNγ+ CD8 T cells normalized to g tumor tissue of mice orally administered 40 mg/kg b.w. I3A or corn oil for seven consecutive days once tumors reached approximately 300 mm3 (D9), assessed by flow cytometry on D18 (n = 3 mice/group). (I) B16-F0 tumor growth of mice IT injected with 10 μM or 1000 μM I3A or vehicle control (10% Tween 20) every three days starting when tumors reached approximately 300 mm3 (D9) (n = 4–5 mice/group). (J) Survival analysis of mice from (I). (K) B16-F0 tumor growth of mice treated with daily oral gavage of Lr or PBS and daily intraperitoneal (IP) injection of AhR inhibitor or vehicle control (corn oil) starting on D3 pTCE; IP (n = 5–8 mice/group). (L) AhR activity measured as luminescence derived from luciferase-expressing AhR reporter cells following stimulation with supernatant of either Lr WT or Lr ΔArAT cultured in PTT media (n = 1 per group). FICZ, 6-Formylindolo[3,2-b]carbazole (AhR agonist). (M) IFNγ concentration in supernatant of naïve Ahr deficient and Ahr sufficient CD8 T cells stimulated with various αCD3 concentrations and αCD28 (2 µg/mL) measured by ELISA (n = 4 per group). (N) YUMM1.7 tumor growth of Ahrf/f CD8 Cre+ and Ahrf/f Cre− mice orally administered Lr WT, Lr ΔArAT, or PBS daily starting on D1 pTCE (n = 5–7 mice/group). (O) B16-F0 tumor growth of Ahrf/f CD11c Cre+ and Ahrf/f Cre− mice orally administered Lr or PBS daily starting on D1 pTCE (n = 7–15 mice/group). (P) B16-F0 tumor growth of Ahrf/f LysM Cre+ and Ahrf/f Cre− mice orally administered Lr or PBS daily starting on D1 pTCE (n = 10–12 mice/group). Data for (E), (F), (H) represent individual mice analyzed by unpaired t-test. Mean ± SEM is shown. Data for (I), (K), (N), (O), and (P) represent mean ± SEM analyzed by two-way ANOVA with Sidak’s correction for multiple comparisons. Data for (J) represents comparison of survival curves analyzed by log-rank test. Data for (M) represents mean ± SEM analyzed by two-way ANOVA with Sidak’s correction for multiple comparisons. *P < 0.05, **P < 0.01, ***P < 0.001, ****P < 0.0001.
(A) Experimental schematic of mice from (Fig. 6A, 6B, and 6D): mice were placed on a low-tryptophan (Trp) diet ((Trp LD), Trp = 0.19%) or high-Trp diet ((Trp HD), Trp = 1.19%) four weeks prior to TCE, maintained on diet until EPA, and orally administered Lr or PBS daily starting one day pTCE. (B) Tumor weight of (Fig. 6B) versus total pmol I3A/g tumor of (Fig. 6F). (C) B16-F0 tumor growth of mice placed on a Trp LD or Trp HD four weeks prior to TCE, maintained on diet until EPA and treated with intraperitoneal injections of AhR inhibitor or vehicle control (corn oil) five days per week starting 1 day before TCE (n = 6 (Trp LD and corn oil), n = 7 (Trp HD and corn oil), n = 7 (Trp HD and AhR inhibitor)). (D) Tumor weights of mice from (C) on D14 pTCE. Dotted line represents mean value of tumor weights from vehicle treated mice on a Trp LD. (E-G) ANA plasma levels of daily Lr or PBS-treated (OG) B16-F0 tumor-bearing mice on D17 pTCE (E), Trp LD or Trp HD treated YUMM1.7 tumor-bearing mice on D20 pTCE maintained on a Trp HD for 6 weeks (F), and non-tumor-bearing mice maintained on a Trp HD for 6 weeks (G). (H) AhR activity measured as luminescence derived from luciferase-expressing AhR reporter cells following stimulation with supernatant of respective culture (Lr, Bl, Ec) (n = 1 per group). (I) B16-F0 tumor growth of mice IT injected with viable or heat-killed (HK) Ec or vehicle control (PTT) every three days starting when tumors reached approximately 150 mm3 (D6) (n = 5 per group). (J) Percentage of IFNγ+ CD8 T cells within the TME of mice orally administered Ec every other day starting one day pTCE assessed by flow cytometry on D17. (K) AhR activity measured as luminescence normalized to g tumor derived from luciferase-expressing AhR reporter cells stimulated with tumor homogenate from mice from (J). (L) AhR activity from (K) versus percentage of IFNγ+ CD8 T cells within the TME of respective mice from (J). (M) Quantification of I3A in 100 μL of bacterial culture supernatant assessed by mass spectrometry (n = 1 per group). (N) B16-F0 tumor growth of mice IT injected with viable or HK Bl or vehicle control (PTT) every three days starting when tumors reached approximately 150 mm3 (D6) (n = 5 per group). (O) Survival analysis of mice from (N).
(P) Quantification of anthranilate in sera of patients from Fig. 7 assessed by mass spectrometry; ISTD, internal standard. (Q and R) Kaplan-Meier survival curve comparing progression-free survival (PFS) (Q) and overall survival (R) of melanoma patients stratified by pre-treatment anthranilate sera levels. High anthranilate [> 70th percentile] with sera levels > 0.1648 Area/ISTD per 100 µL serum (n = 12, green), low anthranilate [< 30th percentile] with sera levels < 0.0364 Area/ISTD per 100 µL serum (n = 12, black). (S) B16-F0 tumor growth of mice treated with IP injections of αPD-L1 or isotype control (Iso. ctrl.) (D5, 7, 9 and 12 pTCE) and 200 μg/mL FICZ or vehicle control (10% Tween 20) IT injections every three days starting on D8 pTCE (n = 5–6 per group). (T) Survival of mice from (S). Data for (B) represent individual mice. Data for (C), (I), (N) and (S) represent mean ± SEM analyzed by two-way ANOVA with Sidak’s correction for multiple comparisons. Data for (D), (E), (F), (J), and (K) represent individual mice analyzed by unpaired t-test. Mean ± SEM is shown. Data for (G) represent individual mice analyzed by paired t-test. Data for (L) represent individual mice analyzed by Pearson r correlation of E. coli treated mice. Data for (O, Q, R, and T) represents comparison of survival curves analyzed by log-rank test. Data for (P) represents individual patients analyzed by unpaired t-test. Violin plots showing median and upper and lower quartiles are shown. *P < 0.05, **P < 0.01, ***P < 0.001; ****P < 0.0001; ns, not significant.
Table S2. Related to Figure 1 and Figure S4. Cluster marker genes and DEGs from single-cell RNA-sequencing dataset.
Table S3. Related to Figure 5. DEGs of naïve CD8 T cells stimulated with αCD3 and αCD28 in the presence of I3A vs. I3A and AhR inhibitor.
Data Availability Statement
Raw and processed 16S rRNA-Seq data are available via the NCBI Sequence Read Archive (PRJNA925499). Raw and processed single cell RNA-seq data of tumor-infiltrating CD8 T cells are available at Gene Expression Omnibus (GSE225496). Remaining data needed to support the conclusion of this manuscript are included in the main text and supplementary materials. Any additional information required to reanalyze the data reported in this paper is available from the lead contact upon request. This paper does not report original code.