

Abstract
We hereby apply the approach of photoacoustic chemical imaging, performing an in vivo chemical analysis that is spatially resolved (200 µm) and in real time, to predict a given tumor’s response to therapy. Using triple negative breast cancer as a model, we took photoacoustic images of tumors’ oxygen distributions in patient-derived xenografts (PDXs) in mice using biocompatible, oxygen-sensitive tumor-targeted chemical contrast nano-elements (nanosonophores), which function as contrast agents for photoacoustic imaging. Following radiation therapy, we established a quantitatively significant correlation between the spatial distribution of the initial oxygen levels in the tumor and its spatial distribution of the therapy’s efficacy: the lower the local oxygen, the lower the local radiation therapy efficacy. We thus provide a simple, noninvasive, and inexpensive method to both predict the efficacy of radiation therapy for a given tumor and identify treatment-resistant regions within the tumor’s microenvironment.
Keywords: breast cancer oxygen imaging, nanoparticles, photoacoustic, radiotherapy, TME (tumor microenvironment), TTCCNE (tumor targeted chemical contrast nano-elements)
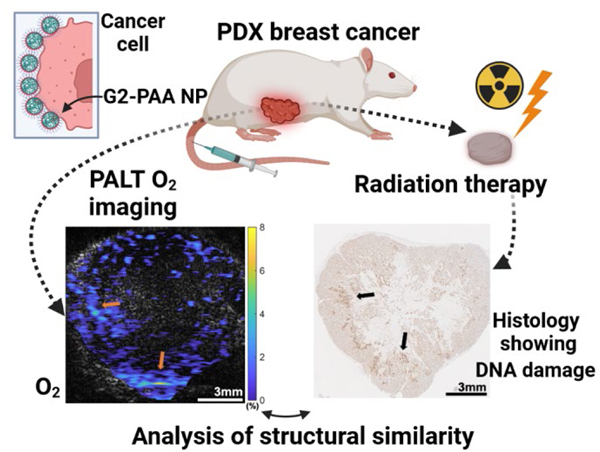
Graphical Abstract
One of the largest advances in 20th century medicine was the advent of imaging methods, including Computed Tomography (CT), Magnetic Resonance Imaging (MRI), and Ultrasound (US). All of these are physical/anatomical imaging methods that show structural details, ranging from bone fractures to brain tumors 1, 2. Hitherto, medical information on a patient’s chemical anomalies has been largely based on taking samples of blood, tissue, or urine, for chemical analysis. Such information obviously does not provide any spatial or temporal information. When it comes to the tumor microenvironment (TME), a “triad of chemical resistance” has been recently established; it includes low oxygen levels (hypoxia), low pH (acidosis), and high potassium ion levels (hyperkalemia). While each member of the triad contributes some resistance to any given therapeutic course, hypoxia will primarily resist radiation therapy 3–5, acidosis will primarily resist chemotherapy (and occasionally radiotherapy)6–8, and hyperkalemia will resist immunotherapy 9, 10. Presently the decision on the recommended treatment method, including surgery, is mainly based on the tumor’s location, size and aggressivity, information usually obtained by anatomical imaging. A tumor’s chemical imaging of the above “triad” may serve as another tool for optimizing the choice of treatment, i.e., an optimal personalized oncology, called precision oncology.
Chemical imaging, in vivo, is a method, able to report, non-invasively and in real time, an organ or tumor’s distribution of specific molecules, ions, or radicals 11. Our method of in vivo chemical imaging is based on the combination of photoacoustic (PA) imaging with tumor-targeted chemical contrast nano-elements (TTCCNE), the latter resembling MRI magnetic contrast nano-elements 12–14. Notably, the advantages of PA imaging include both a tissue penetration depth up to around 3 cm by the incoming infrared photons and a complete tissue penetration by the outgoing acoustic signals, thus providing the spectral fingerprints of the given chemical species, such as oxygen or potassium 15–22. We note that among the advantages of such nano-contrast elements is their tumor targetability, coupled with their required biocompatibility and bioelimination 13,23–26.
In the present work the chemical unknown is the oxygen molecule (O2). The Nobelist, Warburg, discovered, already a century ago, that tumors are often hypoxic, i.e., have a lower oxygen level than normal tissue 27, 28. So far, the tumor’s in vivo spatial distribution of the hypoxia has been determined by Positron Emission Tomography (PET), and Tissue Oxygenation Level Dependent (TOLD) MRI, methods of both limited spatial resolution and accessibility 29, 30. Very recently, there appeared a theoretical work concerning the potential effects of the spatial distribution, and heterogeneity, of hypoxia on radiation therapy 31. The important point is that most types of radiation therapy, whether involving gamma rays or X-rays (the common methods), or protons, positrons or UV/VIS photons, all depend on the biological tissue’s O2 and its ability to create the reactive oxygen species (ROS) that kill cancer cells 3–5. Therefore, a tumor’s hypoxia may disrupt the efficacy of the radiation treatment, and thus timely information on its oxygen levels and their distributions may provide a highly important input onto which, how, or whether at all, radiation therapy should be undertaken.
Triple negative breast cancer (TNBC) is the most aggressive subtype, defined by lack of expression of the estrogen and progesterone receptors and lack of HER2 overexpression 32. While radiation therapy plays an important role in the management of patients with TNBC 33, there are currently no precise means to predict their response to radiation therapy. In this study we employed TNBC patient-derived xenografts (PDXs) implanted in the mammary fat pads of mice which recapitulate the genetic and biochemical attributes of the original patient’s tumor 34.
We show a highly significant spatial correlation between pre-treatment oxygen distribution in the tumors and radiation therapy efficacy. It is known that at higher oxygen concentrations, the radiosensitivity of cells increases rapidly in comparison with particularly low oxygen levels (0 mmHg to 40 mmHg) 3. We note that our observations are spatially resolved, i.e., localized. Thus, our study illustrates the utilization of a chemical imaging method, using the photoacoustic lifetime (PALT) based measurement of the in vivo oxygen distribution in the TME, for precision oncology.
RESULTS/DISCUSSION
In vivo PALT Images of Tumors
PA molecular images were gathered using excitation from the laser illumination (at wavelengths of 620 nm and 920 nm), working at a 10 Hz pulse repetition rate, with US signals being collected with a linear array transducer (Figure 1). The PA oxygen images and histology results from 10 PDX tumor samples, derived from two patients with TNBC, are shown in Figure 2. Histologically, both original PDX tumors are of high histological grade, with the tumors derived from PDX1 (first 3 tumors from left) showing large adenocarcinoma cells with areas of necrosis and the tumors derived from PDX2 (7 tumors) exhibiting a solid and nested pattern (Figure 2, lower panel). In each B-scan PA image that show cross-sectional view of tumors, the quantified oxygen level in the tumor is displayed in pseudo color. As shown in Figure 2, there is concordance between the PALT oxygen images and the histology photographs of the tissue with the γ-H2AX stain showing the DNA damage in response to radiation therapy. Figure 3 shows a detailed comparison between the PA oxygen images and the γ-H2AX stain results for two tumors as examples. Figures 3a and 3c are the images from a PDX1 tumor and Figures 3b and 3d show the images from a PDX2 tumor. The indicated areas for high oxygen level (orange arrows) and the DNA damaged by radiation therapy (black arrows) are correlated.
Figure 1.
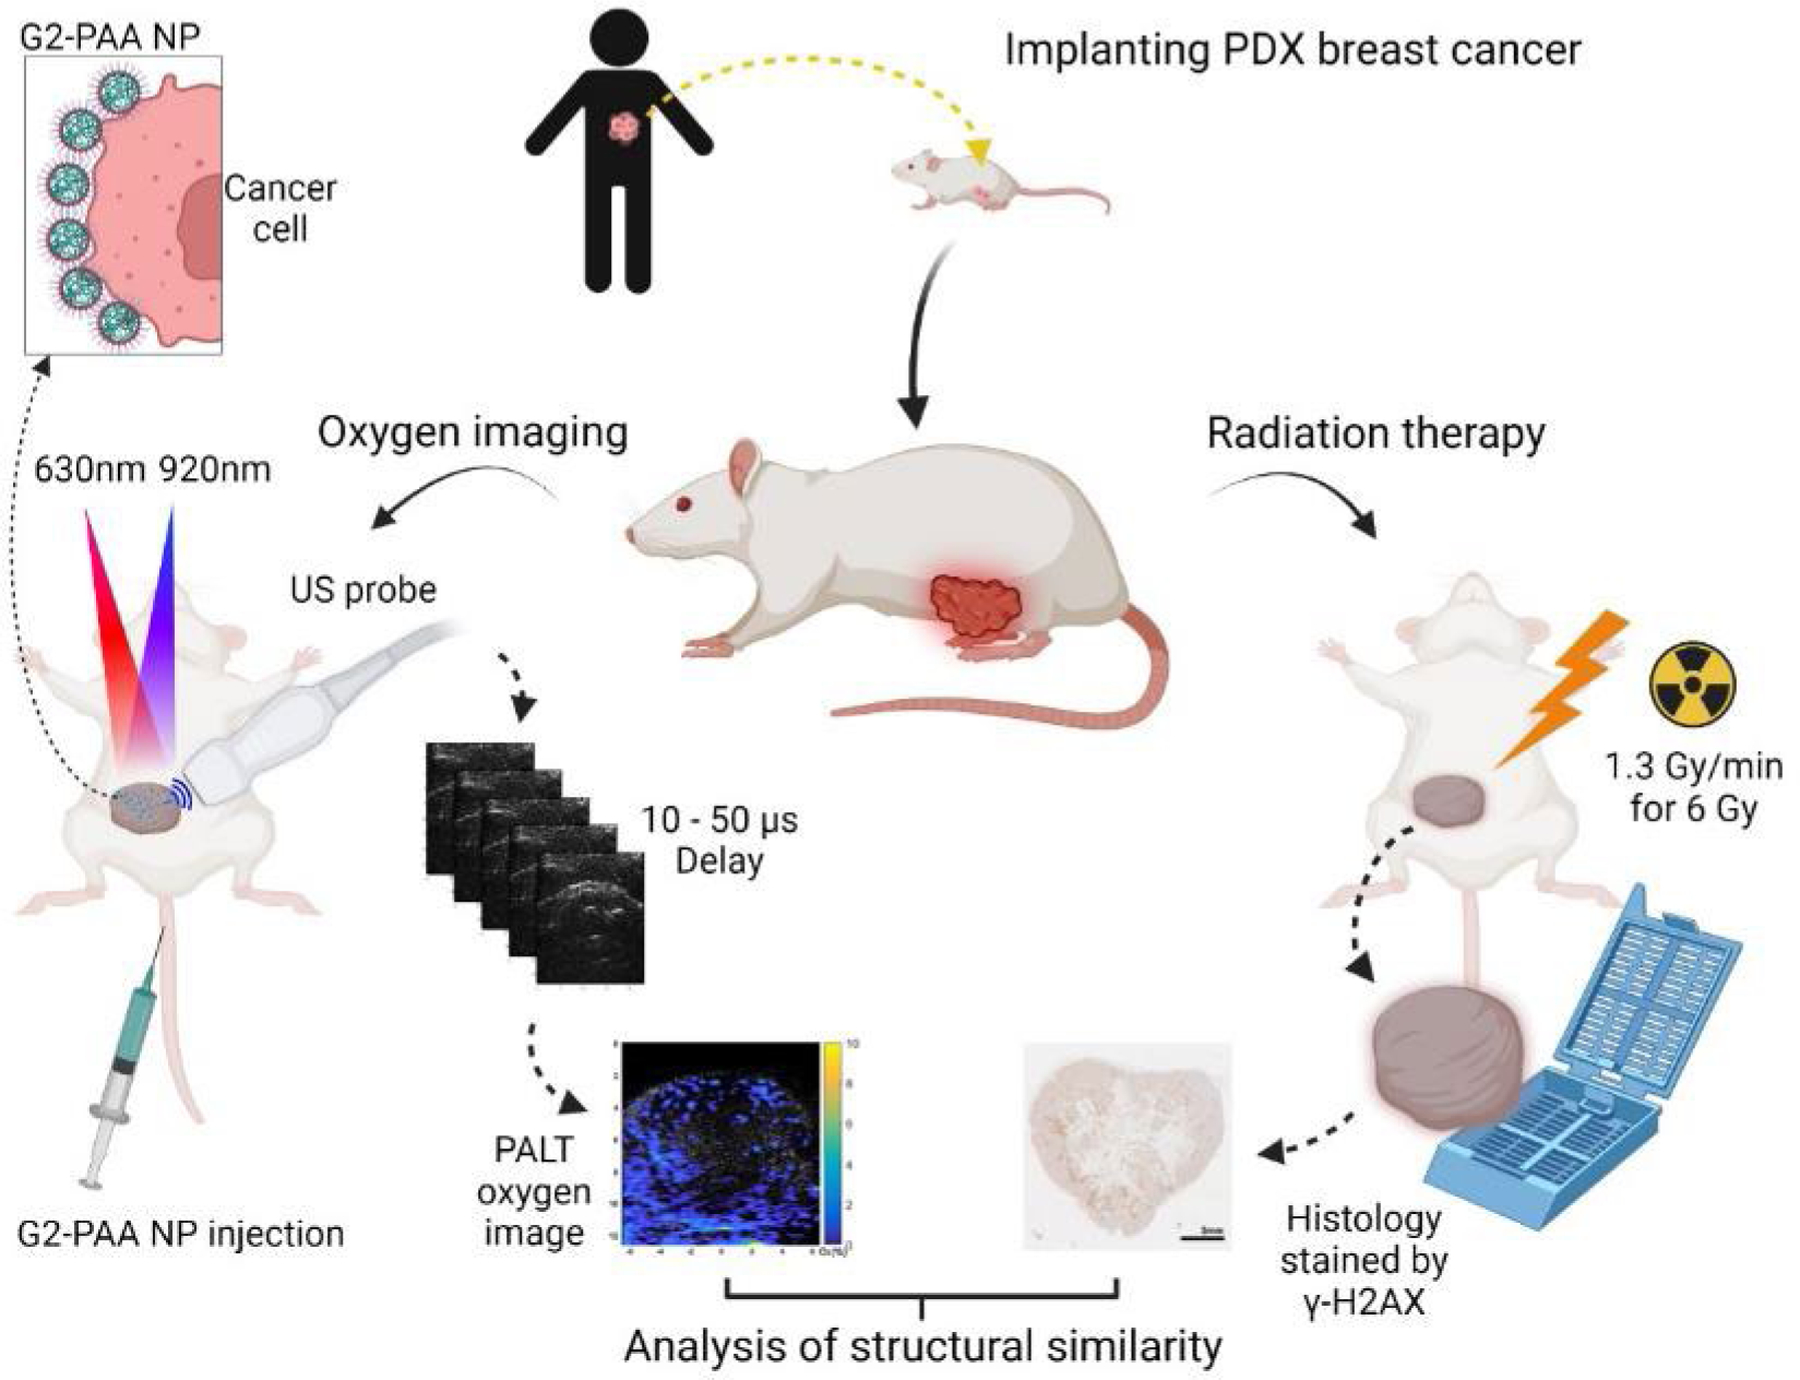
The experimental setup and illustration of system and flows. The process begins with implanting a PDX tumor into a mouse model (top, center). Once the tumor has grown (left side), G2-PAA nanoparticles are injected via the mouse’s tail vein, which will accumulate at the tumor. After 1 hour, a pump beam (630 nm) excites the dye to an excited state whose lifetime is linearly dependent on the oxygen concentration. The probe beam (920 nm) monitors the excited state decay, allowing us to determine the oxygen concentration. After the images are gathered (right side), the mice undergo radiation therapy, and their tumors are harvested. Finally (bottom, center), we stain the tumors for DNA damage and compare the PALT oxygen images with the immunohistochemical photographs of the tissue with the γ-H2AX stain reflecting tumor response to radiation therapy.
Figure 2.
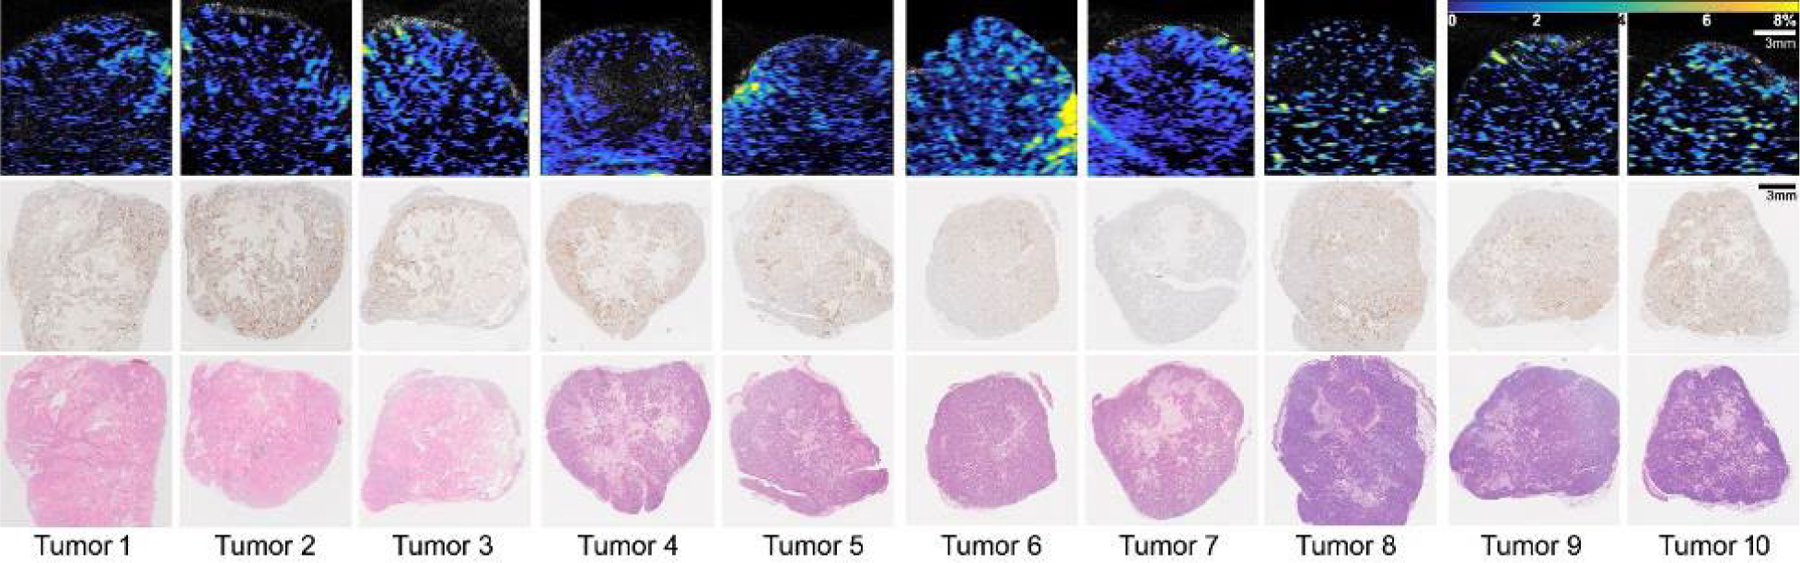
The photoacoustic lifetime based (PALT) oxygen images and histology results of 10 orthotopic PDX breast tumors. Tumors 1–3 derive from patient 1 (PDX1, TM01079) and tumors 4–10 derive from patient 2 (PDX2, J000100675). The top row shows the B-scan PALT oxygen images along the center sections of the tumors. The middle row shows the histology photographs along the center sections of the tumors with the γ-H2AX stain. The bottom row shows the histology photographs along the center sections of the tumors with the Hematoxylin and eosin (H&E) stain. Scale bar is for 3 mm. Color bar shows 0 −10 % of oxygen concentration.
Figure 3.

The comparison between photoacoustic lifetime based (PALT) oxygen images and γ-H2AX stained histology photographs of two PDX tumors (TM01079 and J000100675, Jackson Laboratory). (a) PALT oxygen image of the TM01079 tumor. (b) PALT oxygen image of the J000100675 tumor. (c) Histology photograph of γ-H2AX stained TM01079 tumor. (d) Histology photograph of γ-H2AX stained J000100675 tumor. The orange arrows in (a) and (b) show the higher oxygen level area, and the black arrows in (c) and (d) indicate the DNA damaged area.
Quantitative Analysis of Similarity
The images from each PDX tumor were divided into either 5 by 5 or 10 by 10 regions and compared the similarity using structural similarity index measure (SSIM) that compares local patterns of normalized pixel intensities, as Figure 4 showing the analysis process. In each region, the image intensities of the PA oxygen image were averaged (Figure 4). In the same region, the numbers of cells stained by γ-H2AX were also averaged. We then calculated the Structural Similarity Index (SSI) 35 to measure the regional correlation between the PA oxygen images and the γ-H2AX staining histology photos after excluding the non-tumor regions in each. When analyzed using the 5 by 5 regions, the quantified SSI values range from 0.51 to 0.78 for the 10 PDX tumors, as shown in Figure 4. The average SSI from the 10 tumors was 0.62 with a standard deviation of ±0.09, thus indicating high distribution similarities between the PALT oxygen images and the histology results showing the DNA damage marker, γ-H2AX. Such cell damage is expected, as the mechanism of radiation therapy is closely associated with the excitation of prevalent oxygen molecules to their long-lived lowest excited singlet state, giving rise in the biological environment to the group of the so-called ROS that damage cell DNA 3–5. When analyzed using the 10 by 10 regions, the quantified SSI values for the 10 PDX tumors, although somewhat decreased with an average of 0.36 and a standard deviation of 0.11, still show good distribution similarities between the pre-treatment PALT oxygen images and the post-treatment histology photos. Overall, this result from the 10 PDX tumors is promising, as it suggests that PA imaging of tumor oxygenation powered by TTCCNE consisting of G2-PAA NPs (See Experimental Procedures) is capable of predicting tumor responses to radiation therapy, thus enabling personalized treatment decisions.
Figure 4.
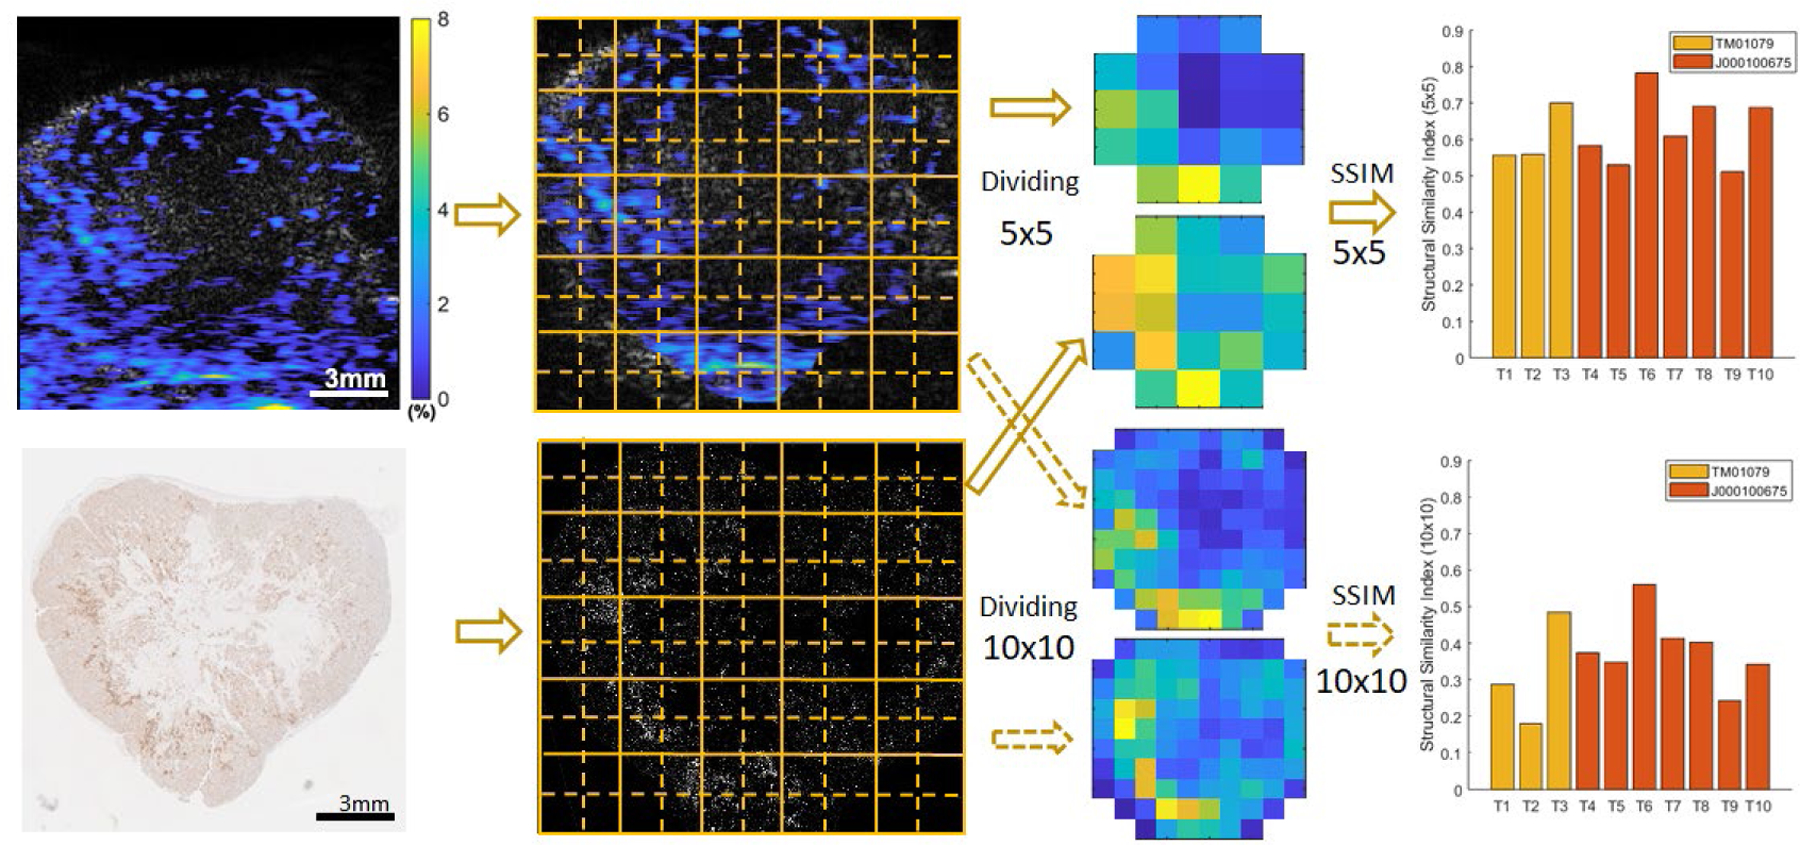
Quantitative analysis of the similarity between the PALT oxygen images and the histology results showing the tumor response to radiation therapy. In both the PA oxygen images (left top) and the histology photos with the γ-H2AX stain (left bottom), the tumor area was cropped and then divided into either 5 by 5 or 10 by 10 regions. In each region, the PALT oxygen image intensities were averaged; and the numbers of cells stained with γ-H2AX were also averaged. With these two processed images, the Structural Similarity Index (SSI) was calculated to quantify the regional similarity between the images. The quantified SSI results from the 10 PDX tumors are shown for the analyses when the images are divided into 5 by 5 regions (right above) and 10 by 10 regions (right below).
As a control group, the PALT oxygen images from the PDX tumors that were not treated by radiation therapy were also compared with the histology results with the γ-H2AX stain. The SSI values of the control groups plotted in Figure 5 indicate a significantly lower local similarity between the PALT oxygen images and the histology photos showing the γ-H2AX stain. When analyzed using the 5 by 5 regions, the quantified SSI values of the control (non-treated) group are from 0.10 to 0.26, with an average and standard deviation of 0.18 ± 0.07, as shown in Figure 5a. A two tailed t-test was conducted by using the built-in functions of the MATLAB (R2021b, MathWorks, Natick, MA) to compare the SSI results from the radiation treatment group (n=10) and the control (non-treated) group (n=4), resulting in a p value of 1.51×10⁻⁶. When analyzed using the 10 by 10 regions, the SSI values of the treated and control groups are from 0.18 to 0.56 and from 0.03 to 0.13, respectively, as shown in Figure 5b. The averages and standard deviations of the two groups are 0.36 ± 0.11 and 0.07 ± 0.05, respectively, leading to a p value of 3.52×10⁻⁴ from a two tailed t-test.
Figure 5.

Boxplots showing the statistical distribution of the SSI values from the radiation therapy treated PDX tumors (treated group, n=10) and the non-treated PDX tumors (control group, n=4). (a) SSI results from analyses when images and photos are divided into 5 by 5 regions. Between the two groups, the p-value from a two tailed t-test is 1.51×10⁻⁶. (b) SSI results from analyses when images and photos are divided into 10 by 10 regions. The two groups are also significantly different with a p-value of 3.52×10⁻⁴ from a two tailed t-test.
Figure 6 shows the microscopy images of a PDX tumor tissue by fluorescence imaging and bright field microscopy. The unstained histology sample from the PDX tumor, harvested one hour after G2-PAA NP injection, shows the accumulation of the NPs. As shown in Figure 6a, the fluorescence image demonstrates the NPs being visible with high intensity while the cells have low intensity. The bright field image in Figure 6b confirms that only the NPs are visible.
Figure 6.
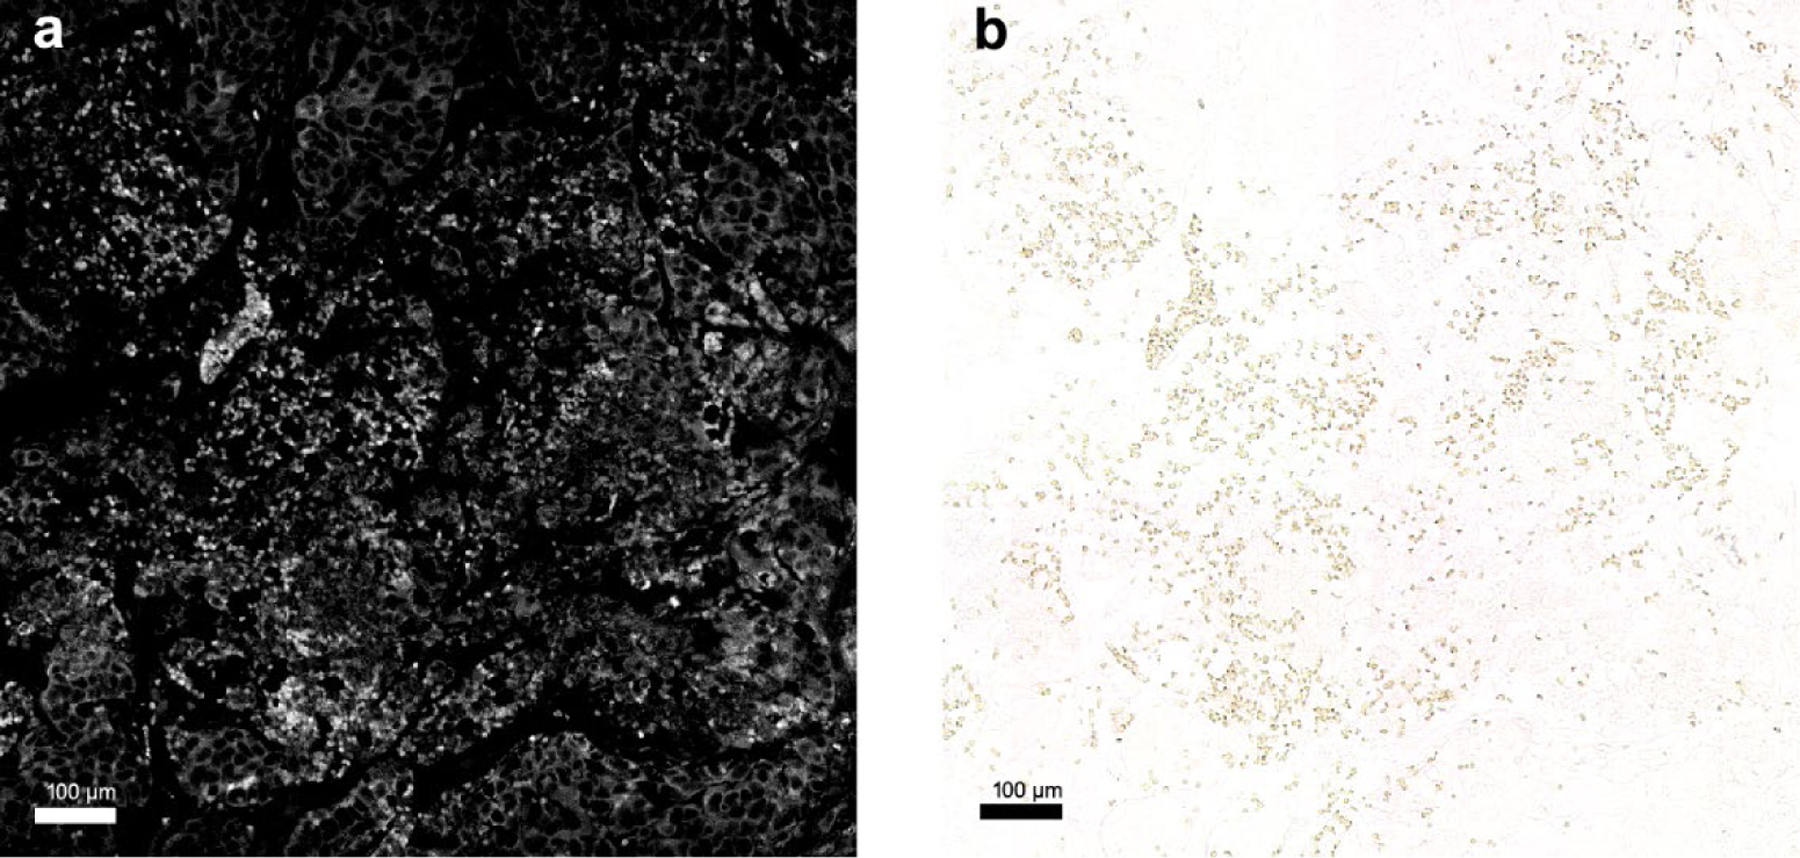
Microscopy images of G2-PAA NPs accumulated in a PDX tumor. (a) Fluorescent image of G2-PAA NPs in the PDX tumor. (b) Bright field image of G2-PAA NPs in the same PDX tumor sample of (a).
Conclusions
Repeating our previous statement, this result from the 10 tumors is promising, as it suggests that PA imaging of tumor oxygenation powered by TTCCNE is capable of predicting tumor responses to radiation therapy, thus enabling personalized treatment decisions. The excellent spatial correlation found here between the pre-treatment tumor oxygen concentration and the radiation-induced DNA damage promises to predict the efficacy of radiation treatment for a given patient’s tumor. As best done via testing the oxygen level heterogeneity in a xenograft mouse model, this test should guide the caregiver’s recommendation on radiation treatment. To image the local oxygenation and show the diverse distribution of hypoxic areas, we used relatively large tumors that reach 1–2 cm3 volumes which have necrotic areas with oxygen level heterogeneity.
Comparing PA oxygen imaging to TOLD MRI or PET, we note that in addition to its better spatial resolution, at a depth of several centimeters, the PA imaging modality is orders of magnitude less expensive 36, 37. In clinics, the use of MRI or PET is limited by its very high cost, which is especially a concern for studies requiring frequent monitoring. PA imaging can be utilized more frequently than MRI or PET imaging, and for patients prohibited from exposure to high magnetic fields. Furthermore, PA molecular imaging could be generalized for use with additional chemical analytes, such as tests of the tumor’s acidosis (low pH) or hyperkalemia (high K+), based on their respective proper nano-contrast elements 16, 17. Using the proper TTCCNE, PA chemical imaging could predict the efficacy of chemotherapy (or of specific drugs thereof), as well as of immunotherapy treatment, for the given patient’s tumor, and thus guide the choice among those three therapies vs. surgery. Notably, diagnosis and selection of the appropriate therapeutic approach would require an invasive biopsy. Potentially avoiding this requirement may be made possible by directly imaging the patient’s tumor by PA imaging plus an injection of the TTCCNE.
In this study, we used laser light at 630 nm wavelength (Figure S2), which can penetrate up to around 40 mm deep into tumors 38 and a high frequency US probe of 18 MHz that has 30 mm of focal length. Although PA imaging is limited to depths of about a few centimeters for the present functional imaging technique, the adoption of NIR-IR lasers, the attempts of developing endoscopic imaging approaches, and the presently available miniaturized US probes may enable this approach to image tumors deep inside the body. From the clinical standpoint, our chemical imaging approach is poised to inform clinicians on the suitability of radiotherapy treatment for individual patients, which is nonexistent at present.
Using the 18-MHz probe, the PALT based imaging was capable of mapping the tumor oxygen with spatial resolution of about 200 µm along both lateral and axial directions. Our calculation of the SSI between each pair of PA oxygen image and γ-H2AX staining histology photo in this work, however, was not conducted based on this spatial resolution but instead by dividing each image into 5 by 5 regions or 10 by 10 regions. This is due to the fact that PA oxygen image was acquired in vivo, while the histology image was acquired after the tumor was harvested, fixed, and sectioned. Therefore, despite the fact that we tried the best to ensure that the two were from the similar section through the tumor, there could be some misalignment between them which could be larger than the spatial resolution of PA imaging. Because of this, the calculation of the SSI was affected by not only the spatial resolution of PA imaging but also the misalignment between the in vivo PA oxygen image and the ex vivo histology photo. This also explains why the calculated SSI values based on 10 by 10 regions were lower than those based on 5 by 5 regions.
In summary, presented is the chemical imaging done on xenograft TMEs, i.e., real patient tumors implanted in mice, studied in vivo, where the spatial distribution of the TME oxygen was correlated with the spatial distribution of the radiation treatment effectivity (cell damage), thus illustrating the medical promise of such an in vivo chemical imaging approach. We expect that such a technique of chemical imaging could contribute to effective personalized cancer therapy, i.e., precision oncology.
METHODS/EXPERIMENTAL
Nanoparticle Synthesis
Targeted G2 oxyphor polyacrylamide nanoparticle were synthesized according to the literature procedure 15, 16, 39. The chemical structure of G2 oxyphor is shown in Figure S1. To covalently attach G2 oxyphor to the acrylamide backbone, a monomer solution is made containing G2 oxyphor (4 mg, Oxygen Enterprises, Ltd.), 3-(aminopropyl) methacrylamide hydrochloride salt (53.6mg), acrylamide (690 mg), 1-ethyl-3-(3-(dimethylamino)propyl) carbodiimide (2.9 mg), and sulfo-N-hydroxysuccinimide (8.2 mg) dissolved in phosphate-buffered saline (pH 7.4, 1.3 mL) (PBS). This reaction is stirred at room temperature for 2 hours in the dark, after which the crosslinker, 3-(acryloylxy)-2-hydroxypropyl methacrylate (321.3 mg) is added, completing the monomer solution.
Separately, an oil phase is prepared in a 100 mL round-bottom flask containing hexanes (45 mL), dioctyl sulfosuccinate sodium salt (1.6 g), and Brij L4 (3.3 mL) with vigorous stirring. Once ready, the previously prepared monomer solution is injected into the oil phase. To remove dissolved oxygen from the oil phase, it is purged with argon gas for at least 30 minutes prior to reaction initiation. After the purge, it is critical to keep the reaction mixture under its inert argon atmosphere, as exposure to oxygen in the air can fully or partially inhibit the polymerization. Following the purge, free radical polymerization is initiated by the addition of 100 μL N,N,N’,N’-tetramethylethylenediamine followed by 100 μL of a 10% (w/v) ammonium persulfate solution. The reaction mixture is then stirred vigorously for 2 hours. After 2-hour stirring, the reaction is exposed to the atmosphere for 5 minutes to ensure that the free radical reaction is complete. Hexanes are then removed via rotary evaporation. The prepared nanoparticles were washed with ethanol and water with an Amicon Filter Cell using a 300 kDa filter. It is typical to observe slight leaching of the dye during the initial washes as no reaction can successfully incorporate 100% of the dye. However, no leaching is observed after the initial washes. After the washes are finished, the nanoparticles are flash frozen and lyophilized.
To actively target G2-PAAm nanoparticle to the tumor area, the nanoparticles’ surface is conjugated with F3 peptides. F3 peptide was identified as a possible tumor-homing peptide in 2002 when it was discovered during a screening assay that used a phage-displayed cDNA library and combined ex vivo screening on cell suspensions 40. F3 exerts its targeting effect by binding to nucleolin, a receptor that is expressed in the angiogenic blood vessels near tumors 41. The F3 peptides, which bind to nucleolin, increase the retention time of their payloads in the area of interest. F3 has been routinely used to aid in in vivo delivery of nanoparticles by the Kopelman lab 15,16 and has Experimental Proceduresn robust use in the literature 42–44. A PBS solution (pH 7.4, 2.5 mL) containing G2-PAAm nanoparticle (50 mg) and bifunctional polyethylene glycol (MAL-PEG-SCM, 2kDa, Creative PEGWorks) (4mg) was stirred for 30 minutes. The mixture was then washed 3 times with PBS using an Amicon Ultra Centrifugal Filter (100 kDa) to remove unreacted PEG. After the washes, the solution was resuspended to its original concentration (50 mg/2.5 mL) and F3 peptide (KDEPQRRSARLSAKPAPPKPEPKPKKAPAKKC, RS Synthesis) (11 mg) was added. The reaction was stirred overnight. Cysteine (0.63 mg) was added to quench the unreacted maleimide groups and stirred for 2 hours. The solution was then washed again to remove unreacted F3 and cysteine, then lyophilized. The characterization such as size distribution, TEM image, MTT assay data for the G2-PAA NPs, demonstrating their biocompatibility, are shown in Supporting information.
To avoid unnecessary experiments in living rodents, no controls using blank nanoparticle (without dye or without F3) were administered, and no controls involving the targeting element alone (F3) were administered.
Animal Models
Orthotopic PDX mouse models of breast cancer were involved in the PALT oxygen imaging. The two models (TM01079 and J000100675) purchased from Jackson Laboratory were studied to validate the spatial correlation between the PALT oxygen image in the TME and the tumor response to radiation therapy. To generate orthotopic breast tumors, fragments of human tumors were implanted into the abdominal mammary fat pad of immunodeficient mice (NOD.Cg-Prkdcscid Il2rgtm-1Wjl/SzJ or NSG). After the sizes of the PDX tumors reached the desired volumes (1–2 cm3), the mice were ready for the proposed imaging experiment and the radiation therapy.
Experimental Procedure of Tumor Imaging and Treatment
The mice were anesthetized with isoflurane during the imaging and therapy processes. Before imaging, oxygen sensing G2 Polyacrylamide Nanoparticles (G2-PAA NPs), conjugated with tumor-targeting F3 peptides 40, were administrated systematically through the tail vein (20 mg/mL in PBS, 0.1 mL). The PA imaging was conducted around 1 hour after the injection with the contrast of the tumor enhanced by the PAA NPs 16. The setup for PALT oxygen imaging was similar to that in our previous study 15. For each tumor, 2D B-scan imaging was conducted through the center of the tumor. Two lasers, for pump beam at 630 nm (Surelite OPO, Amplitude, CA) and probe beam at 920 nm (Phocus Mobile, OPOTEK, CA), covered the imaging region of the PDX tumor. PA signals were collected using an US and PA dual imaging system (Vantage, Verasonics) and a linear array probe working at a central frequency of 18 MHz (L22–14v, Verasonics). The lateral and axial resolutions of PA images using the probe were 205 µm and 218 µm, respectively, at 10 mm depth. With varying delays, of 10, 20, 30, 40 and 50 µs, the PALT oxygen image of each tumor was produced by following the same process of PALT oxygen imaging. We used a needle type oximeter (Microx TX3 Presens, Regensburg, Germany) to setup the PALT calibration as described in our previous study 15. At different concentrations, the linear correlations between decay rates and oxygen concentrations were quantified (Figure S4). The averaged calibration line was within a ±1.34% of error in the range of 1–10% oxygen concentration 15. At the same time of PA imaging of the tumor oxygen, a 2D gray-scale US image of the tumor was scanned by the same system. For each result, as shown in Figure 1, the PALT oxygen image was superimposed on the gray-scaled US image to show both the spatially distributed functional information and tissue structures.
After imaging, the tumor of each mouse was treated once with radiation therapy. Irradiations were performed using a Kimtron IC 225 (Kimtron Medical) at a dose rate of approximately 1.3 Gy/min at the University of Michigan Comprehensive Cancer Center Experimental Irradiation Core (Ann Arbor, MI). Dosimetry is performed semiannually using an ionization chamber connected to an electrometer system that is directly traceable to a National Institute of Standards and Technology calibration. The beam is collimated, and a 2-mm Cu beam hardening filter is utilized. After 24 hours, the animal was euthanized, and the treated tumor was harvested for histological analysis. To compare with the imaging results, the tumor was sliced along the same section imaged. The tumor slices were stained by different stains including γ-H2AM and H&E. The histology slides with the γ-H2AM stain show the tumor response to radiation therapy 45.
Supplementary Material
Figure S1: Chemical structure of the dye, G2 oxyphor; Figure S2: UV-VIS absorption spectrum for the G2-PAA NPs; Figure S3: Fluorescence emission spectra for 1mg/mL G2-PAA NPs; Figure S4: Decay rate of the phosphorescent lifetime of the G2-PAA NPs; Figure S5: Size distribution of G2-PAA NPs in PBS assessed via dynamic light scattering; Figure S6: Size distribution of G2-PAA NPs in PBS assessed via dynamic light scattering after 1 week incubation at 4°C; Figure S7 and S8: TEM image of G2-PAA NPs; Figure S9: MTT assay data for the G2-PAA NPs. (Supporting.PDF)
Acknowledgments
This work was supported by NIH/NCI grants R01CA250499 (to XW, RK) and R01CA125577 and R01CA107469 (to CK).
Funding Sources
This work was supported by NIH/NCI grants R01CA250499 (to XW, RK), and R01CA125577 and R01CA107469 (to CK).
ABBREVIATIONS
- CT
computed tomography
- H&E
Hematoxylin and eosin stain
- MRI
Magnetic Resonance Imaging
- NP
nanoparticle
- PA
photoacoustic
- PALT
photoacoustic lifetime
- PBS
phosphate-buffered saline
- PDX
patient-derived xenografts
- PET
Positron Emission Tomography
- ROS
reactive oxygen species
- SSI
Structural Similarity Index
- SSIM
Structural Similarity Index Measure
- TME
tumor microenvironment
- TNBC
Triple negative breast cancer
- TOLD
Tissue Oxygenation Level Dependent
- TTCCNE
tumor targeted chemical contrast nano-elements
- US
Ultrasound
Footnotes
ASSOCIATED CONTENT
Notes
The authors declare no competing financial interest.
REFERENCES
- 1.Rieffel J; Chitgupi U; Lovell JF, Recent Advances in Higher-Order, Multimodal, Biomedical Imaging Agents. Small 2015, 11, 4445–4461. [DOI] [PMC free article] [PubMed] [Google Scholar]
- 2.Vu T; Razansky D; Yao JJ, Listening to tissues with new light: recent technological advances in photoacoustic imaging. J Optics-Uk 2019, 21. [DOI] [PMC free article] [PubMed]
- 3.Rockwell S; Dobrucki IT; Kim EY; Marrison ST; Vu VT, Hypoxia and radiation therapy: past history, ongoing research, and future promise. Curr Mol Med 2009, 9, 442–458. [DOI] [PMC free article] [PubMed] [Google Scholar]
- 4.Harrison LB; Chadha M; Hill RJ; Hu K; Shasha D, Impact of tumor hypoxia and anemia on radiation therapy outcomes. Oncologist 2002, 7, 492–508. [DOI] [PubMed] [Google Scholar]
- 5.Horsman MR; Mortensen LS; Petersen JB; Busk M; Overgaard J, Imaging hypoxia to improve radiotherapy outcome. Nat Rev Clin Oncol 2012, 9, 674–687. [DOI] [PubMed] [Google Scholar]
- 6.Tredan O; Galmarini CM; Patel K; Tannock IF, Drug resistance and the solid tumor microenvironment. J Natl Cancer Inst 2007, 99, 1441–1454. [DOI] [PubMed] [Google Scholar]
- 7.Tannock IF; Rotin D, Acid pH in tumors and its potential for therapeutic exploitation. Cancer Res 1989, 49, 4373–4384. [PubMed] [Google Scholar]
- 8.Gerweck LE; Vijayappa S; Kozin S, Tumor pH controls the in vivo efficacy of weak acid and base chemotherapeutics. Mol Cancer Ther 2006, 5, 1275–1279. [DOI] [PubMed] [Google Scholar]
- 9.Eil R; Vodnala SK; Clever D; Klebanoff CA; Sukumar M; Pan JH; Palmer DC; Gros A; Yamamoto TN; Patel SJ; Guittard GC; Yu ZY; Carbonaro V; Okkenhaug K; Schrump DS; Linehan WM; Roychoudhuri R; Restifo NP, Ionic immune suppression within the tumour microenvironment limits T cell effector function. Nature 2016, 537, 539–543. [DOI] [PMC free article] [PubMed] [Google Scholar]
- 10.Vodnala SK; Eil R; Kishton RJ; Sukumar M; Yamamoto TN; Ha NH; Lee PH; Shin M; Patel SJ; Yu Z; Palmer DC; Kruhlak MJ; Liu X; Locasale JW; Huang J; Roychoudhuri R; Finkel T; Klebanoff CA; Restifo NP, T cell stemness and dysfunction in tumors are triggered by a common mechanism. Science 2019, 363, 1417. [DOI] [PMC free article] [PubMed] [Google Scholar]
- 11.Lee CH; Folz J; Tan JWY; Jo JG; Wang XD; Kopelman R, Chemical Imaging in Vivo: Photoacoustic-Based 4-Dimensional Chemical Analysis. Anal Chem 2019, 91, 2561–2569. [DOI] [PubMed] [Google Scholar]
- 12.Na HB; Song IC; Hyeon T, Inorganic Nanoparticles for MRI Contrast Agents. Adv Mater 2009, 21, 2133–2148. [Google Scholar]
- 13.Moffat BA; Reddy GR; McConville P; Hall DE; Chenevert TL; Kopelman RR; Philbert M; Weissleder R; Rehemtulla A; Ross BD, A novel polyacrylamide magnetic nanoparticle contrast agent for molecular imaging using MRI. Mol Imaging 2003, 2, 324–332. [DOI] [PubMed] [Google Scholar]
- 14.Xiao YD; Paudel R; Liu J; Ma C; Zhang ZS; Zhou SK, MRI contrast agents: Classification and application (Review). Int J Mol Med 2016, 38, 1319–1326. [DOI] [PubMed] [Google Scholar]
- 15.Jo J; Lee CH; Folz J; Tan JWY; Wang X; Kopelman R, In Vivo Photoacoustic Lifetime Based Oxygen Imaging with Tumor Targeted G2 Polyacrylamide Nanosonophores. ACS Nano 2019, 13, 14024–14032. [DOI] [PMC free article] [PubMed] [Google Scholar]
- 16.Jo J; Lee CH; Kopelman R; Wang X, In vivo quantitative imaging of tumor pH by nanosonophore assisted multispectral photoacoustic imaging. Nat Commun 2017, 8, 471. [DOI] [PMC free article] [PubMed] [Google Scholar]
- 17.Tan JWY; Folz J; Kopelman R; Wang X, In vivo photoacoustic potassium imaging of the tumor microenvironment. Biomed Opt Express 2020, 11, 3507–3522. [DOI] [PMC free article] [PubMed] [Google Scholar]
- 18.Wood CA; Han S; Kim CS; Wen YF; Sampaio DRT; Harris JT; Homan KA; Swain JL; Emelianov SY; Sood AK; Cook JR; Sokolov KV; Bouchard RR, Clinically translatable quantitative molecular photoacoustic imaging with liposome-encapsulated ICG J-aggregates. Nature Communications 2021, 12, 5410. [DOI] [PMC free article] [PubMed] [Google Scholar]
- 19.Kubelick KP; Emelianov SY, Prussian blue nanocubes as a multimodal contrast agent for image -guided stem cell therapy of the spinal cord. Photoacoustics 2020, 18, 100166. [DOI] [PMC free article] [PubMed] [Google Scholar]
- 20.Shao Q; Morgounova E; Jiang C; Choi J; Bischof J; Ashkenazi S, In vivo photoacoustic lifetime imaging of tumor hypoxia in small animals. J Biomed Opt 2013, 18, 076019. [DOI] [PMC free article] [PubMed] [Google Scholar]
- 21.Punnoose J; Nachman H; Ashkenazi S, Oxygen Imaging for Non-Invasive Metastasis Detection. Sensors (Basel) 2021, 22, 237. [DOI] [PMC free article] [PubMed] [Google Scholar]
- 22.Ray A; Rajian JR; Lee YE; Wang X; Kopelman R, Lifetime-based photoacoustic oxygen sensing in vivo. J Biomed Opt 2012, 17, 057004. [DOI] [PMC free article] [PubMed] [Google Scholar]
- 23.Canovas R; Padrell Sanchez S; Parrilla M; Cuartero M; Crespo GA, Cytotoxicity Study of Ionophore-Based Membranes: Toward On-Body and in Vivo Ion Sensing. ACS Sens 2019, 4, 2524–2535. [DOI] [PubMed] [Google Scholar]
- 24.Chen R; Huang S; Lin T; Ma H; Shan W; Duan F; Lv J; Zhang J; Ren L; Nie L, Photoacoustic molecular imaging-escorted adipose photodynamic-browning synergy for fighting obesity with virus-like complexes. Nat Nanotechnol 2021, 16, 455–465. [DOI] [PubMed] [Google Scholar]
- 25.Wang S; Chen R; Yu Q; Huang W; Lai P; Tang J; Nie L, Near-Infrared Plasmon-Boosted Heat/Oxygen Enrichment for Reversing Rheumatoid Arthritis with Metal/Semiconductor Composites. ACS Appl Mater Interfaces 2020, 12, 45796–45806. [DOI] [PubMed] [Google Scholar]
- 26.Li H; Wu Z; Zhang J; Sun X; Duan F; Yao J; Sun M; Zhang J; Nie L, Instant Ultrasound-Evoked Precise Nanobubble Explosion and Deep Photodynamic Therapy for Tumors Guided by Molecular Imaging. ACS Appl Mater Interfaces 2021, 13, 21097–21107. [DOI] [PubMed] [Google Scholar]
- 27.Hockel M; Vaupel P, Tumor hypoxia: definitions and current clinical, biologic, and molecular aspects. J Natl Cancer Inst 2001, 93, 266–276. [DOI] [PubMed] [Google Scholar]
- 28.Warburg O; Wind F; Negelein E, The Metabolism of Tumors in the Body. J Gen Physiol 1927, 8, 519–30. [DOI] [PMC free article] [PubMed] [Google Scholar]
- 29.Melsens E; De Vlieghere E; Descamps B; Vanhove C; Kersemans K; De Vos F; Goethals I; Brans B; De Wever O; Ceelen W; Pattyn P, Hypoxia imaging with (18)F-FAZA PET/CT predicts radiotherapy response in esophageal adenocarcinoma xenografts. Radiat Oncol 2018, 13, 39. [DOI] [PMC free article] [PubMed] [Google Scholar]
- 30.Hallac RR; Zhou H; Pidikiti R; Song K; Stojadinovic S; Zhao D; Solberg T; Peschke P; Mason RP, Correlations of noninvasive BOLD and TOLD MRI with pO2 and relevance to tumor radiation response. Magn Reson Med 2014, 71, 1863–1873. [DOI] [PMC free article] [PubMed] [Google Scholar]
- 31.Dimou A; Argyrakis P; Kopelman R, Tumor Hypoxia Heterogeneity Affects Radiotherapy: Inverse-Percolation Shell-Model Monte Carlo Simulations. Entropy (Basel) 2022, 24, 86. [DOI] [PMC free article] [PubMed] [Google Scholar]
- 32.Goldhirsch A; Winer EP; Coates AS; Gelber RD; Piccart-Gebhart M; Thurlimann B; Senn HJ; Panel m., Personalizing the treatment of women with early breast cancer: highlights of the St Gallen International Expert Consensus on the Primary Therapy of Early Breast Cancer 2013. Ann Oncol 2013, 24, 2206–2223. [DOI] [PMC free article] [PubMed] [Google Scholar]
- 33.Horton JK; Jagsi R; Woodward WA; Ho A, Breast Cancer Biology: Clinical Implications for Breast Radiation Therapy. Int J Radiat Oncol Biol Phys 2018, 100, 23–37. [DOI] [PubMed] [Google Scholar]
- 34.Tentler JJ; Tan AC; Weekes CD; Jimeno A; Leong S; Pitts TM; Arcaroli JJ; Messersmith WA; Eckhardt SG, Patient-derived tumour xenografts as models for oncology drug development. Nature Reviews Clinical Oncology 2012, 9, 338–350. [DOI] [PMC free article] [PubMed] [Google Scholar]
- 35.Wang Z; Bovik AC; Sheikh HR; Simoncelli EP, Image quality assessment: from error visibility to structural similarity. IEEE Trans Image Process 2004, 13, 600–612. [DOI] [PubMed] [Google Scholar]
- 36.Xu MH; Wang LHV, Photoacoustic imaging in biomedicine. Rev Sci Instrum 2006, 77, 041101. [Google Scholar]
- 37.Wang LV, Multiscale photoacoustic microscopy and computed tomography. Nat Photonics 2009, 3, 503–509. [DOI] [PMC free article] [PubMed] [Google Scholar]
- 38.Muller PJ; Wilson BC, An update on the penetration depth of 630 nm light in normal and malignant human brain tissue in vivo. Phys Med Biol 1986, 31, 1295–1297. [DOI] [PubMed] [Google Scholar]
- 39.Lee YE; Smith R; Kopelman R, Nanoparticle PEBBLE sensors in live cells and in vivo. Annu Rev Anal Chem (Palo Alto Calif) 2009, 2, 57–76. [DOI] [PMC free article] [PubMed] [Google Scholar]
- 40.Porkka K; Laakkonen P; Hoffman JA; Bernasconi M; Ruoslahti E, A fragment of the HMGN2 protein homes to the nuclei of tumor cells and tumor endothelial cells in vivo. Proc Natl Acad Sci U S A 2002, 99, 7444–7449. [DOI] [PMC free article] [PubMed] [Google Scholar]
- 41.Christian S; Pilch J; Akerman ME; Porkka K; Laakkonen P; Ruoslahti E, Nucleolin expressed at the cell surface is a marker of endothelial cells in angiogenic blood vessels. J Cell Biol 2003, 163, 871–878. [DOI] [PMC free article] [PubMed] [Google Scholar]
- 42.Ham SH; Min KA; Shin MC, Molecular tumor targeting of gelonin by fusion with F3 peptide. Acta Pharmacol Sin 2017, 38, 897–906. [DOI] [PMC free article] [PubMed] [Google Scholar]
- 43.Hu Q; Gu G; Liu Z; Jiang M; Kang T; Miao D; Tu Y; Pang Z; Song Q; Yao L; Xia H; Chen H; Jiang X; Gao X; Chen J, F3 peptide-functionalized PEG-PLA nanoparticles co-administrated with tLyp-1 peptide for anti-glioma drug delivery. Biomaterials 2013, 34, 1135–1145. [DOI] [PubMed] [Google Scholar]
- 44.Feng X; Jiang D; Kang T; Yao J; Jing Y; Jiang T; Feng J; Zhu Q; Song Q; Dong N; Gao X; Chen J, Tumor-Homing and Penetrating Peptide-Functionalized Photosensitizer-Conjugated PEG-PLA Nanoparticles for Chemo-Photodynamic Combination Therapy of Drug-Resistant Cancer. ACS Appl Mater Interfaces 2016, 8, 17817–17832. [DOI] [PubMed] [Google Scholar]
- 45.Kao J; Milano MT; Javaheri A; Garofalo MC; Chmura SJ; Weichselbaum RR; Kron SJ, gamma-H2AX as a therapeutic target for improving the efficacy of radiation therapy. Curr Cancer Drug Tar 2006, 6, 197–205. [DOI] [PubMed] [Google Scholar]
Associated Data
This section collects any data citations, data availability statements, or supplementary materials included in this article.
Supplementary Materials
Figure S1: Chemical structure of the dye, G2 oxyphor; Figure S2: UV-VIS absorption spectrum for the G2-PAA NPs; Figure S3: Fluorescence emission spectra for 1mg/mL G2-PAA NPs; Figure S4: Decay rate of the phosphorescent lifetime of the G2-PAA NPs; Figure S5: Size distribution of G2-PAA NPs in PBS assessed via dynamic light scattering; Figure S6: Size distribution of G2-PAA NPs in PBS assessed via dynamic light scattering after 1 week incubation at 4°C; Figure S7 and S8: TEM image of G2-PAA NPs; Figure S9: MTT assay data for the G2-PAA NPs. (Supporting.PDF)