

Abstract
Background:
Chronic alcohol consumption in adults can induce various cardiac toxicities such as arrhythmias, cardiomyopathy, and heart failure. Prenatal alcohol exposure can increase the risk of developing congenital heart diseases. Understanding biological mechanisms involved in the long-term alcohol exposure-induced cardiotoxicity is pivotal to the discovery of therapeutic strategies.
Methods:
Cardiomyocytes derived from human induced pluripotent stem cells (hiPSC-CMs) were engineered into cardiac spheroids and treated with clinically relevant concentrations of ethanol (17 and 50 mM) for 5 weeks. The cells were then analyzed for changes in mitochondrial features, transcriptomic and metabolomic profiles as well as integrated omics outcomes.
Results:
Following chronic ethanol treatment of hiPSC-CMs, a decrease in mitochondrial membrane potential and respiration and changes in expression of mitochondrial function-related genes were observed. RNA-sequencing analysis revealed changes in various metabolic processes, heart development, response to hypoxia, and extracellular matrix-related activities. Metabolomics analysis revealed dysregulation of energy metabolism and increased metabolites associated with upregulation of inflammation. Integrated omics analysis further identified functional subclusters and revealed potentially affected pathways that are associated with cardiac toxicities.
Conclusion:
Chronic ethanol treatment of hiPSC-CMs resulted in overall decreased mitochondrial function, increased glycolysis, disrupted fatty acid oxidation and impaired cardiac structural development.
Keywords: Stem cells, cardiomyocytes, alcohol, mitochondria, RNA-Seq, metabolomics
INTRODUCTION
Alcohol is the most consumed and highly addictive chemical substance, and chronic consumption of alcohol can lead to increased risk of health problems. According to the National Institute of Alcohol Abuse and Alcoholism, nearly one million people died from alcohol-related causes between 1999 and 2017, and in 2017 alcohol was involved with 2.6% of the ~2.8 million deaths in the United States (White et al., 2020). The impact of alcohol on human health is more prevalent on a global scale: in 2018, the World Health Organization reported that the harmful use of alcohol contributed to more than 5% of deaths worldwide per annum (World Health Organization, 2018). Alcohol can affect the cardiovascular system, causing various disease states such as arrhythmias (Voskoboinik et al., 2019) and dilated cardiomyopathy (Glymour, 2014). Alcohol-induced cardiotoxicity is not restricted to just adults: according to the Center for Disease Control and Prevention, about 10% of pregnant woman reported current drinking and about half of them reported binge drinking (England et al., 2020), which increases the risk of fetal alcohol spectrum disorder (FASD). Likewise, a large, multi-community-based study estimated that the full range of FASDs in the US might number as high as 50 per 1,000 school children (May et al., 2018). Consequently, there is a serious threat to the cardiovascular health of a significant portion of the population given that congenital heart disease is a common clinical manifestation of FASD with comorbidity rate of 28.6% (Burd et al., 2007).
Given the severity of alcohol-induced cardiotoxicity, understanding the mechanisms involved is critical to developing clinical guidelines and therapeutic interventions. The effects of chronic alcohol exposure have been mostly investigated in animal models treated with ethanol (EtOH). In these models, long-term EtOH treatment leads to oxidative stress, autophagy, apoptosis, mitochondrial dysfunction, activation of pro-inflammatory pathway, and cardiac contraction defects (Nakashima et al., 2019, Mouton et al., 2020, Yang et al., 2021, Wang et al., 2021b). Furthermore, EtOH exposure during embryonic development results in heart chamber defects, cardiac hypertrophy, fibrosis, apoptosis, oxidative stress, Ca2+ overload, and contractile dysfunction (Ren et al., 2002, Nguyen et al., 2014, Sarmah and Marrs, 2017, Ninh et al., 2019). However, since human and animal cardiac physiologies differ significantly (Guo et al., 2018), there is a need for a model more reflective of human cardiac physiology.
Human induced pluripotent stem cell-derived cardiomyocytes (hiPSC-CMs) have shown great potential in addressing the main limitations of human primary cardiomyocytes (Hnatiuk et al., 2021), which are difficult to obtain in large quantities and maintain in vitro for an extended period of time while preserving key functional characteristics (Mitcheson et al., 1998). Indeed, hiPSC-CM models have been successfully used to model various cardiac disease conditions, as well as alcohol-induced cardiotoxicity (Rampoldi et al., 2019, Liu et al., 2021, Liu et al., 2020b). As hiPSC-CMs resemble fetal cardiomyocytes, these cells could be used as an ideal cellular system to model prenatal alcohol exposure.
Here, we report the effects of long-term treatment of hiPSC-CMs with EtOH. We found that long-term EtOH treatment decreased mitochondrial membrane potential and mitochondrial function and altered the expression of genes associated with mitochondrial function in a concentration-dependent manner. In addition, by transcriptomic and metabolomic analyses we found that long-term EtOH treatment resulted in global shifts in gene expression and/or metabolites associated with metabolic processes, heart development, response to hypoxia, extracellular matrix (ECM)-related activities, vascular smooth muscle function, stem cell pluripotency regulation, and regulation of inflammation.
Materials and Methods
Vendor information and catalog numbers for major reagents are available in Table S1.
Cell culture and EtOH treatment
hiPSC line IMR90 (WiCell Research Institute) was fed daily on Matrigel-coated plates with mTeSR medium. hiPSCs were induced to differentiate towards cardiomyocytes using a growth factor driven differentiation protocol (Jha et al., 2015, Laflamme et al., 2007). At the day of induction (day 0), medium was replaced with RPMI 1640 medium supplemented with 2% B27 minus insulin containing 100 ng/ml Activin A. After 24 h, medium was replaced with fresh RPMI supplemented with 2% B27 minus insulin containing 10 ng/ml BMP4. After 3 days, medium was changed to RPMI supplemented with 2% regular B27. At day 5 of differentiation, the cells were dissociated and reseeded into AggreWell400 plates to obtain cardiac spheroids (CSs) (Jha et al., 2016). After 24 h, the CSs were collected and transferred to low-adhesion dishes for suspension culture with medium refreshed every 2 days. CSs typically started spontaneous beating by day 7 to 9 of differentiation. From day 14, different concentrations of EtOH-containing medium were freshly prepared by diluting pure ethyl alcohol in the culture medium to 2× test concentrations. Every 3 days, CSs were collected and resuspended in fresh culture medium, the same volume of 2× EtOH-working solutions were added into the dishes, and then mineral oil was overlaid on top of the medium to prevent EtOH evaporation. EtOH concentration of 17 mM is the legal limit in the United States to drive, corresponding to blood alcohol concentration of 0.08% (g/100 mL blood); and 50 mM corresponds to the blood alcohol concentration of 0.24%, which is associated with the excitement stage of alcohol intoxication in clinic. The exposure duration of 5 weeks was selected according to the findings from our previous study (Liu et al., 2021). We found that EtOH treatment of hiPSC-CMs for 5 weeks resulted in lower cell viability than EtOH treatment for 1 week or 3 weeks.
Immunocytochemistry and cardiomyocyte purity quantification
For immunocytochemistry, CSs were dissociated and reseeded into Matrigel-coated 96-well plates. Cells were fixed in 4% paraformaldehyde for 15 min and permeabilized using ice-cold methanol for 2 min at room temperature (RT). The cells were then incubated with 5% normal goat serum (NGS) in phosphate-buffered saline (PBS) at RT for 1 h and incubated with primary antibodies including NKX2–5, cardiac troponin T (cTnT), and α-actinin (Table S2) in 3% NGS overnight at 4°C. After washing with PBS, the cells were incubated with the corresponding secondary antibodies at RT for 1 h in dark followed by counterstaining the nuclei with 7 μM Hoechst 33342. For cardiomyocyte purity quantification, images were acquired and quantitatively analyzed using ArrayScan XTI Live High Content Platform (Thermo Fisher Scientific). Briefly, total cell numbers and cell locations were acquired based on the Hoechst staining of the nuclei. Signal detection of NKX2–5 was restricted to the nucleus and that of α-actinin and cTnT was restricted to the cytoplasm with a mask that extended 7 units from the nucleus. The percentages of cells positive for NKX2–5, α-actinin and cTnT were calculated as cardiomyocyte purity.
Detection of mitochondrial membrane potential
For tetramethylrhodamine (TMRM) staining, CSs were dissociated and reseeded into Matrigel-coated 96-well plates. The cells were incubated with 100 nM TMRM and 7 μM Hoechst working solutions in warm 0.25% bovine serum albumin (BSA) in PBS solution for 15 min at 37°C in dark. Images were acquired and analyzed using ArrayScan XTI Live High Content Platform. Briefly, cell locations were determined based on the Hoechst staining of the nuclei. Signal detection of TMRM was restricted to the cytoplasm with a mask that extended 7 units from the nucleus. Mean fluorescence intensities of TMRM of cells were quantified and used as readout.
Seahorse XF24 metabolic flux analysis
The oxygen consumption rate (OCR) was measured using the Seahorse XF24 Extracellular Flux Analyzer (Agilent Technologies, Santa Clara) (Gentillon et al., 2019). CSs with or without EtOH treatment for 5 weeks were dissociated and seeded into a Matrigel-coated Seahorse XF-24 cell culture plate at a density of 2×10⁵ cells/well. Cells were maintained for 2 days to allow them to attach and adapt to the Seahorse plate before the assay. During the 2-day incubation, the cells were not exposed to ethanol, since the Seahorse readout may be affected by mineral oil used on top of the medium to prevent EtOH evaporation. We note the potential limitation of this assay protocol: the 2-day incubation could cause an underestimation of the detrimental effect of EtOH on mitochondrial function if the effects from 5 weeks of ethanol exposure were reversible to some extent during the 2-day incubation. One hour before the assay, the cells were washed once with XF assay medium (non-buffered RPMI supplemented with 10 mM glucose, 2 mM Sodium Pyruvate and 2 mM Glutamine) and incubated in 525 μl of XF assay medium at 37°C in a non-CO2 incubator. Mitochondrial function was analyzed using the XF Cell Mito Stress Kit. Mitochondrial inhibitors—oligomycin (2 μM), carbonyl cyanide p-(trifluoromethoxy) phenylhydrazone (FCCP, 1 μM) and rotenone (0.5 μM) + antimycin A (0.5 μM)—were diluted in XF assay medium and sequentially added into each well during the measurements. Each measurement cycle comprised 3 min of mixing, 2 min of waiting, and 3 min measurements of OCR (pmol/min) and extracellular acidification rate (ECAR, mpH/min). Measurement cycles were performed after each injection of given compounds. The results were normalized to 105 cells as determined by trypan blue assay. The data were analyzed using Wave 2.6 and Report Generator 4.0.
Quantification of mitochondrial translocase of outer membrane (TOM) receptor complex component
CSs were dissociated and reseeded into Matrigel-coated 96-well plates. Cells were fixed in 4% paraformaldehyde for 15 min and permeabilized using ice-cold methanol for 2 min at RT. The cells were then incubated with 5% NGS in PBS at RT for 1 h and incubated with anti-Tom20 primary antibody (Table S2) in 3% NGS overnight at 4°C. After washing with PBS, the cells were incubated with the corresponding secondary antibody at RT for 1 h in dark followed by counterstaining the nuclei with 7 μM Hoechst 33342. Images were acquired and analyzed using ArrayScan XTI Live High Content Platform. Briefly, cell locations were determined based on the Hoechst staining of the nuclei. Signal detection of Tom20 was restricted to the cytoplasm with a mask that extended 7 units from the nucleus. Mean fluorescence intensities of Tom20 of cells were quantified and used as readout.
Quantitative real-time polymerase chain reaction (qRT-PCR)
Aurum total RNA mini kit was used to extract RNA and SuperScript VILO cDNA Synthesis Kit was used to reverse transcribe 1μg of RNA into cDNA, according to the manufacturer’s instructions. qRT-PCR was performed in an Applied Biosystems 7500 real-time PCR system (Thermo Fisher Scientific) using the iTaq SyBr green master mix. Human specific PCR primers (Table S3) for the genes examined were retrieved from open access websites (https://pga.mgh.harvard.edu/primerbank/). All samples were normalized to the level of the housekeeping gene GAPDH. Relative expression levels were calculated by the 2^-ΔΔCt method.
Quantification of mitochondrial DNA content
Total genomic DNA (gDNA) was isolated using QIAamp DNA Mini Kit according to the manufacturer’s instructions. Following determination of gDNA concentration using a UV–vis spectrophotometer (NanoDrop, Thermo Fisher Scientific), samples were diluted to 20 ng/μl. RT-PCR was performed in Applied Biosystems 7500 real-time PCR systems (Thermo Fisher Scientific) using the iTaq SyBr green master mix for nuclear genes, succinate dehydrogenase subunit A (SDHA) and lipoprotein lipase (LPL), and mitochondrial genes, NADH dehydrogenase subunit I (ND1) and mitochondrial cytochrome oxidase II (MT-CO2). The mitochondrial DNA (mtDNA) was normalized to nuclear DNA (nDNA) (Gentillon et al., 2019).
RNA-seq analysis
RNA was extracted from both hiPSC-CMs with and without EtOH treatment using Aurum total RNA mini kit (Bio-Rad, CA) according to manufacturer’s instructions. Library preparation and sequencing were performed at the Parker H. Petit Institute for Bioengineering and Bioscience at the Georgia Institute of Technology. RNA quality was assessed on a Bioanalyzer instrument (Agilent, CA Technologies) and all samples had RNA integrity number (RIN) ≥ 7. cDNA was derived from RNA, hybridized and probe intensities were generated on Illumina HumanHT-12 v3 (Illumina, CA). RNA sequence reads were aligned to the human reference genome (GRCh38) using HISAT2 (hierarchical indexing for spliced alignment of transcripts), followed by using UCSC reference annotation and HTSeq to estimate gene abundance. All downstream analyses were performed in R 4.1.2. Read count normalization and differential expression analysis were performed using DESeq2 R package 1.34.0 (Table S4, S5) (Love et al., 2014). Gene Ontology (GO) enrichment analysis of differentially expressed genes was done using clusterProfiler R package 4.2.2 (Yu et al., 2012).
Metabolomic analysis
hiPSC-CMs treated with or without EtOH (n=3/group, 1–2×10⁶ per sample) were lysed and extracted with ice cold acetonitrile and water (2:1 v/v). Cell extracts were analyzed as described previously (Go et al., 2014). Briefly, thawed extracts were incubated at 4 °C for 30 min, centrifuged at 16100 g for 10 min to remove protein and transferred to a refrigerated (4 °C) autosampler for analysis. Samples were analyzed with three technical replicates using ultra-high-resolution mass spectrometry with hydrophilic interaction liquid chromatography (HILIC) [Accucore HILIC 100 × 2.1 mm columns]. Electrospray ionization was used in the positive ion mode on a Thermo Scientific Q-Exactive HF mass spectrometer (Thermo, Waltham, Massachusetts) operating with a resolution of 120000 and scan range of 85–1275 m/z (mass to charge). Analyte separation for HILIC was performed with a Waters XBridge BEH Amide XP HILIC column (2.1 × 50 mm2, 2.6 μm particle size) and gradient elution with mobile phases including water, acetonitrile and formic acid as described previously (Liu et al., 2020a). Raw data were extracted with apLCMS (Yu et al., 2009) and xMSanalyzer (Uppal et al., 2013). Significant features with partial least squares discriminant analysis [PLS-DA] score > 2 were further studied by pathway enrichment analysis using Mummichog (Li et al., 2013). Metabolites in pathways were verified via xMSannotator (Uppal et al., 2017). This approach protects against type 2 statistical error by including all features at P < 0.05 and protects against type 1 statistical error by permutation testing.
Integrated omics analysis
Integrated omics analysis of proteomics (Liu et al., 2020b), transcriptomics, and metabolomics data was performed using xMWAS network algorithm (Uppal et al., 2018), which uses sparse partial least squares regression, community detection algorithms and eigen vector centrality measures to estimate pair-wise correlations between omics features to identify protein-gene-metabolite communities. The number of protein-gene-metabolite communities was identified by optimizing cluster modularity, a frequently used community detection algorithm that partitions a network into clusters made up of densely connected nodes, so that nodes belonging to different clusters are sparsely connected (Subelj and Bajec, 2011). For this dataset, correlation threshold of 0.70 and p-value cutoff of 0.05 were used.
Statistical analysis
Data were analyzed and graphed in Excel, GraphPad Prism 8, and RStudio. Data are presented as mean ± SD. Comparisons were conducted via One-way ANOVA test followed by multiple comparison procedures (Dunnett method) with significant differences defined by P < 0.05 (*), P < 0.01 (**), P < 0.001 (***), P < 0.0001 (****). Sample sizes were given for each experiment.
RESULTS
Chronic EtOH exposure decreases mitochondrial membrane potential and respiration of hiPSC-CMs
To examine the effect of long-term EtOH exposure on the mitochondrial function of hiPSC-CMs, we first generated highly enriched hiPSC-CMs through cardiac induction and formation of cardiac spheroids on differentiation day 5 (Figure 1A). Cardiac spheroids were generated by microtissue engineering (Figure 1B), which helps better mimic in vivo cellular microenvironment than 2D cultures (Liu et al., 2020b). As shown in Figure 1C, 3D differentiation cultures contained cells that were positive for cardiomyocyte-associated markers including NKX2–5, α-actinin and cardiac troponin T (cTnT) at 91%, 84%, and 86%, respectively.
Figure 1. Experimental scheme of hiPSC-CM generation and characterization.
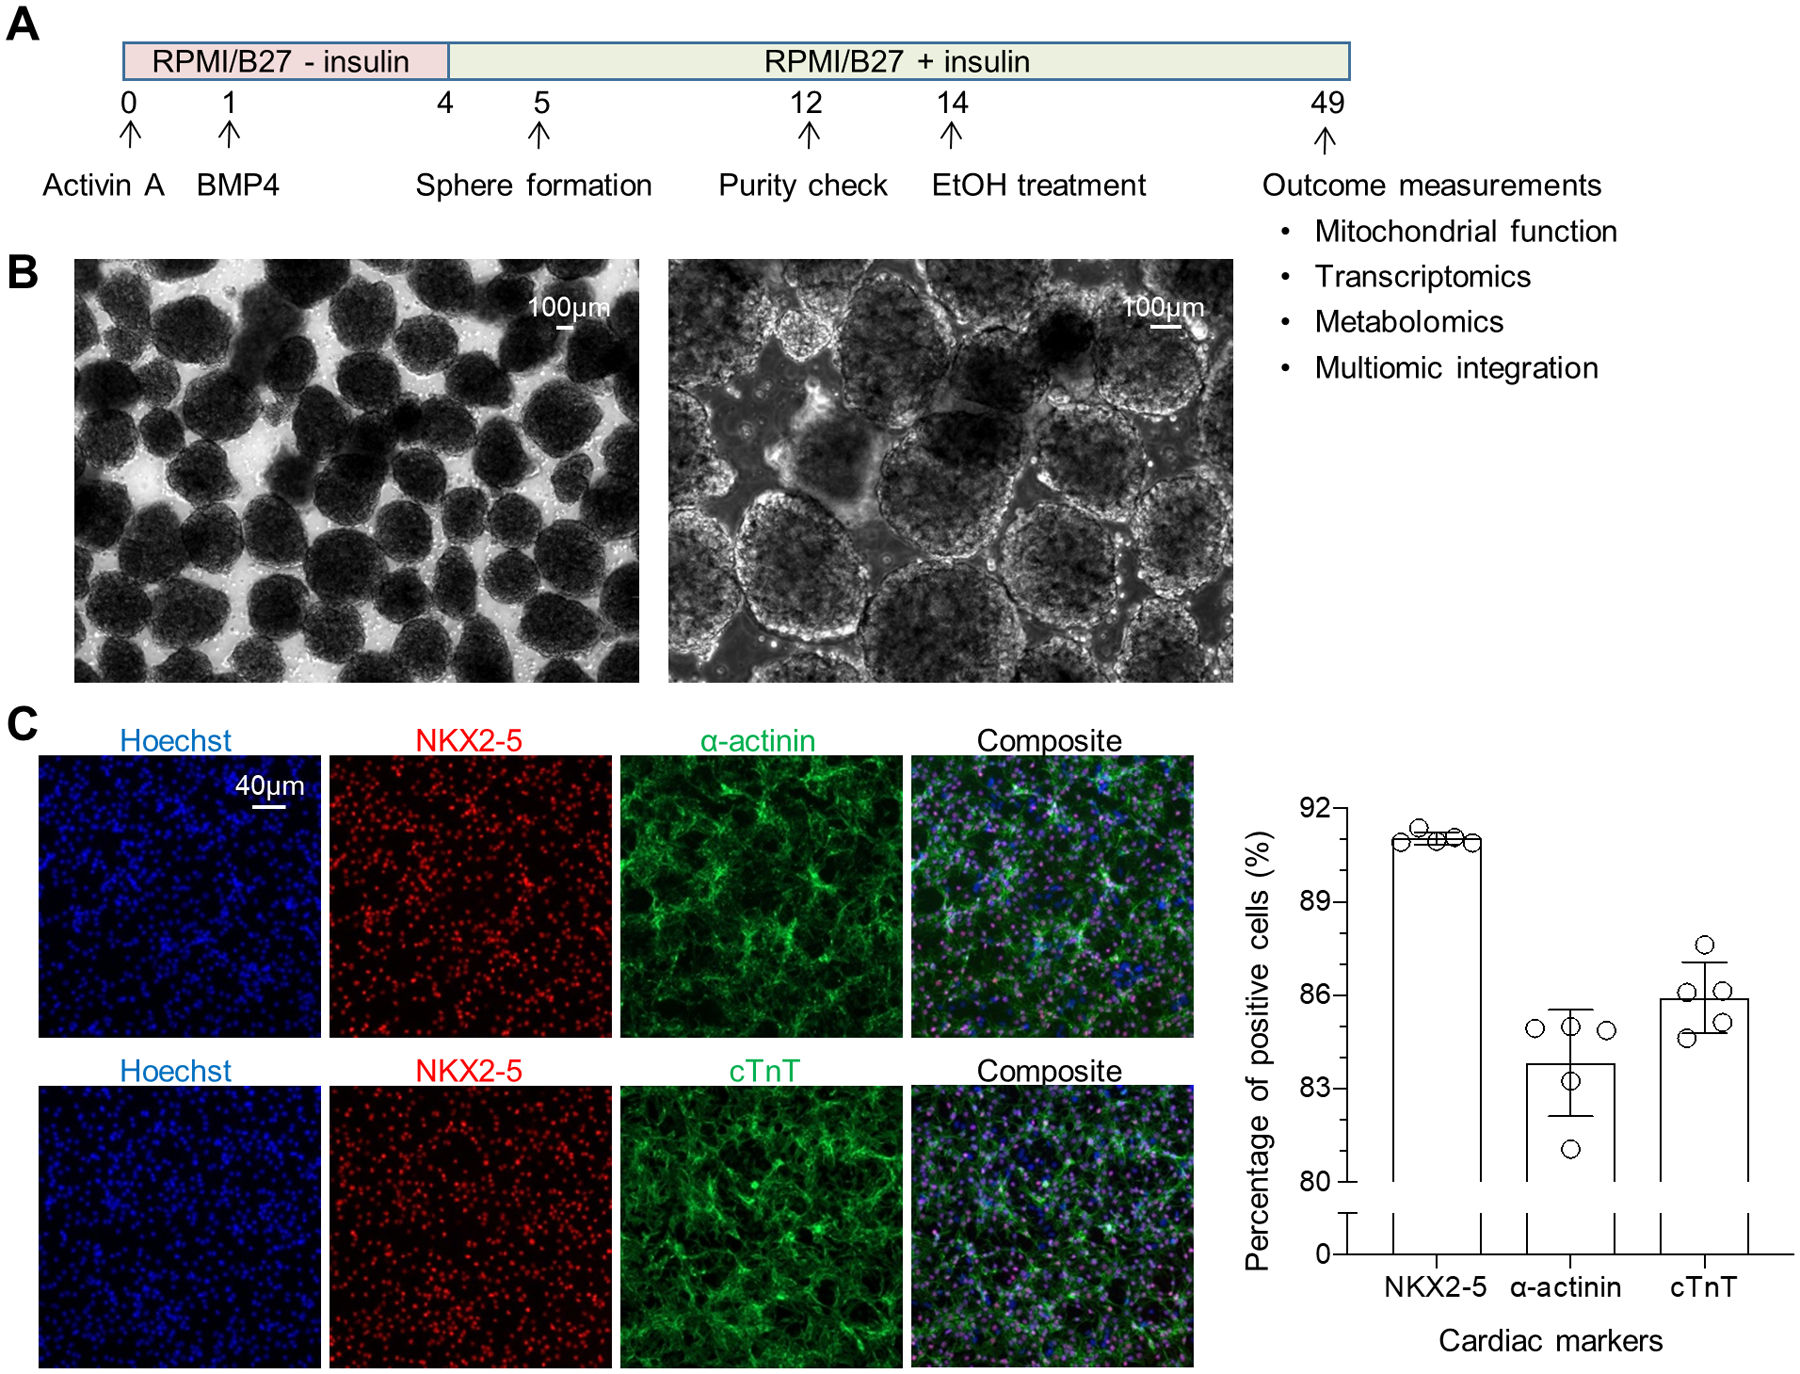
(A) Overall experimental design. (B) Phase-contrast images of cardiac spheroids under two magnifications. (C) Representative images and quantification of immunocytochemistry acquired from ArrayScan revealing that the majority of the cells in culture were positive for cardiac transcription factor NKX2–5 and structural proteins cardiac troponin T and α-actinin, indicating highly enriched hiPSC-CMs at day 12 (n=5 cultures).
On differentiation day 14, cardiac spheroids were treated with EtOH at 17 and 50 mM for 5 weeks. At the end of the treatment, we measured mitochondrial membrane potential by TMRM probe. Decreased TMRM signals were detected in cells treated with EtOH (Figure 2A). The mean fluorescence intensity of TMRM was 10% lower in cells treated with 17 mM EtOH and 13% lower in cells treated with 50 mM EtOH than in untreated (control) cells.
Figure 2. Chronic EtOH exposure decreases mitochondrial membrane potential and respiration of hiPSC-CMs.

(A) Representative images and quantification of TMRM staining in 3D hiPSC-CMs treated with EtOH for 5 weeks (n = 4). Relative mean fluorescence intensity (MFI) was calculated based on the average values of EtOH-treated group vs. untreated group. (B) Representative traces showing the oxygen consumption rate (OCR) of hiPSC-CMs following sequential addition of oligomycin (2 μM), FCCP (1 μM), and rotenone/antimycin A (0.5 μM). Bar charts present the quantification of basal respiration, maximal respiration, non-mitochondrial respiration, ATP production, spare respiratory capacity and coupling efficiency (n = 4 cultures for no treatment group and n = 5 cultures for treatment groups). Comparisons were conducted between each treatment group and no treatment group via One-way ANOVA test. *, P-value < 0.05; **, P-value < 0.01; ***, P-value < 0.001; ****, P-value < 0.0001.
We also measured the key parameters of mitochondrial coupling and respiratory by Seahorse XF24 metabolic flux analysis. As shown in Figure 2B, changes of oxygen consumption rate (OCR) in control and EtOH-treated hiPSC-CMs were traced following the sequential supplements of the ATP synthase inhibitor oligomycin, a protonophore uncoupler FCCP, and electron inhibitors rotenone and antimycin A. Compared with the control, cells treated with 50 mM EtOH displayed dramatically decreased OCR in most parameters [in absolute OCR per 105 cells (pmol/min)] of the mitochondrial respiration, including basal respiration (84.73 ± 16.36 vs. 154.70 ± 26.75, P < 0.01), maximal respiration (209.00 ± 46.88 vs. 407.74 ± 60.24, P < 0.001), non-mitochondrial respiration (25.39 ± 9.95 vs. 55.60 ± 17.38, P < 0.05), spare respiratory capacity (124.27 ± 33.38 vs. 253.04 ± 40.53, P < 0.001), and ATP production (73.25 ± 16.00 vs. 145.54 ± 19.18, P < 0.0001). Cells treated with 17 mM EtOH had milder effects on mitochondrial respiration compared with those treated with 50 mM EtOH. Nevertheless, compared with no EtOH treatment, 17 mM EtOH exposure significantly decreased maximal respiration (271.25 ± 53.77 vs. 407.74 ± 60.24, P < 0.01), spare respiratory capacity (139.88 ± 40.67 vs. 253.04 ± 40.53, P < 0.01), and ATP production (116.17 ± 12.23 vs. 145.54 ± 19.18, P < 0.05).
Taken together, these observations indicate that chronic EtOH exposure affected mitochondrial function of hiPSC-CMs by decreasing mitochondrial membrane potential and damaging respiration process at a concentration-dependent manner.
Chronic EtOH exposure affects the expression of mitochondrial function-related genes of hiPSC-CMs
To investigate the molecular changes of mitochondria in hiPSC-CMs exposed to chronic EtOH treatment, we treated cardiac spheroids with EtOH at 17 and 50 mM for 5 weeks and quantified the expression of Tom20 by immunocytochemical analysis. Tom20 is located at the surface of the mitochondrion outer membrane and functions as the transit peptide receptor responsible for the recognition and translocation of cytosolically synthesized mitochondrial preproteins. Compared with the control cells, Tom20 was expressed at lower levels in EtOH-treated hiPSC-CMs (Figure 3A).
Figure 3. Chronic EtOH exposure affects the expression of critical mitochondrial function-related genes of hiPSC-CMs.

(A) Representative images and quantification of Tom20 expression in hiPSC-CMs treated with EtOH for 5 weeks (n = 4 cultures). (B) qRT-PCR analysis showing relative mRNA levels of mitochondrial function related genes in hiPSC-CMs treated with EtOH for 5 weeks (n = 3 cultures). (C) Quantification of the ratio of mitochondria-encoded complex I ND1 or MT-CO2 to nuclear-encoded complex II LPL or SHDA DNA in hiPSC-CMs treated with EtOH for 5 weeks (n = 3). Relative mean fluorescence intensity (MFI), mRNA levels and mt/nDNA ratios were calculated based on the average values of EtOH-treated group vs. untreated group. Comparisons were conducted between each treatment group and no treatment group via One-way ANOVA test. *, P-value < 0.05; **, P-value < 0.01***; P-value < 0.001.
Next, we analyzed the expression of genes critical for mitochondrial function including genes implicated in fatty acid metabolism, glucose metabolism, and electron transport chain of mitochondria. The fatty acid metabolism-related genes included ACADVL (encoding very long chain acyl-Coenzyme A dehydrogenase, which catalyzes the first step of the fatty acid oxidation pathway), CPT1A and CPT1B (encoding carnitine palmitoyltransferase, which transports fatty acids from the cytoplasm into the mitochondria), PPARA and PPARGC1A (encoding peroxisome proliferator-activated receptors, which are transcriptional factors that regulate the genes involved in energy metabolism) and HADHA and HADHB (encoding the mitochondrial trifunctional protein hydroxyacyl-Coenzyme A dehydrogenase, which catalyzes the last three steps of oxidation of long chain fatty acids in mitochondria). The glucose metabolism-related genes included PDK1, PDK3, and PDK4 (encoding pyruvate dehydrogenase kinases, which are important for modulating glucose metabolism in mitochondria). The electron transport chain of mitochondria-related genes included UCP3 (encoding uncoupling protein 3), COQ10A (encoding coenzyme Q10A), NDUFB5 (encoding NADH:ubiquinone oxidoreductase), OPA1 (encoding mitochondrial dynamin like GTPase), and MFN1 and MFN2 (encoding mitochondrial protein mitofusins which are essential for the maintenance and operation of the mitochondrial network). As shown in Figure 3B and Figure S1, compared with no EtOH treatment, the expression levels of COQ10A, MFN2, OPA1, HADHB, CPT1B, and PPARGC1A were 35%, 39%, 54%, 41%, 44%, and 38% lower, respectively, in cells exposed to 50 mM EtOH. The expression of MFN2, HADHB, CPT1B, and PPARGC1A was also significantly decreased in 17 mM EtOH-treated cells. The reduced expression of COQ10A, MFN2, OPA1, HADAB, CPT1B and PPARGC1A in EtOH-treated cells was consistent with decreased mitochondrial function detected by metabolic flux analysis.
In addition, we assessed mtDNA:nDNA ratio to evaluate the mitochondrial DNA content in hiPSC-CMs with or without long-term EtOH treatment. As shown in Figure 3C, the mitochondrial DNA content was comparable in all the groups, indicating that chronic EtOH exposure did not affect mitochondrial DNA content in hiPSC-CMs.
Together, these results show that chronic EtOH exposure affected the expression of genes that are crucial for mitochondrial function in hiPSC-CMs without altering mitochondrial DNA content.
Chronic EtOH treatment of hiPSC-CMs alters transcriptome profile identified by RNA-seq analysis
To more comprehensively examine changes induced by long-term EtOH exposure, we compared transcriptome profiles of cardiac spheroids treated with EtOH at 17 mM for 5 weeks with untreated cells by RNA-seq analysis. This analysis revealed 1703 differentially expressed genes (DEGs), of which 783 were upregulated and 920 downregulated (adjusted p-value < 0.05). From volcano plot visualization of all genes, some DEGs associated with cardiac structure, metabolism and extracellular matrix (ECM) organization were evident (Figure 4A). For instance, glycolysis-related genes such as ENO1, GAPDH, and LDHA were upregulated while key cardiac structural genes MYL2 and MYH7 were downregulated.
Figure 4. RNA-seq identifies differentially expressed genes and GO terms.

(A) Volcano plot showing differentially expressed genes. (B) GO enrichment using upregulated genes. (C) GO enrichment using downregulated genes. 3D hiPSC-CMs were treated with 17 mM ethanol for 5 weeks and were compared with untreated cells (n=3 cultures).
We next performed GO enrichment analysis on upregulated and downregulated DEGs (Figure 4B, 4C). This analysis revealed upregulation of glycolytic process, carbohydrate metabolic process terms as well as response to hypoxia and T cell chemotaxis (Figure 4B, Figure 5A, Table S6). Upregulated DEGs associated with T cell chemotaxis included WNK1, WNT5A, ADAM10, CXCL11. This analysis also revealed that the downregulated DEGs were over-represented by GO terms related to extracellular matrix organization, blood vessel development, heart development, actin filament organization, cell growth, muscle cell development, female pregnancy, and response to hypoxia (Figure 4C, Figure 5B, Table S7). Overall downregulation of development and growth was also evident, with downregulation of ECM function and cardiac development showing consistency with our previously published proteomics data (Liu et al., 2020b). In particular, collagen trimer component genes (COL3A1, COL11A1, and COL1A1), muscle contraction genes (CRYAB, TNNI3, and ACTA1), apoptosis genes (PLK1 and SOD3), and pleiotropic genes included in multiple GO terms (SFRP1, COL1A1, and EMILIN1) showed decreased expression, which is consistent with previous findings (Liu et al., 2020b).
Figure 5. RNA-seq identifies KEGG pathways as well as the association of differentially expressed genes and GO terms.

(A) Chord plot of upregulated pathways and its genes. (B) Chord plot of downregulated pathways and its genes. (C) KEGG enrichment analysis using upregulated genes. (D) KEGG enrichment analysis using downregulated genes. 3D hiPSC-CMs were treated with 17 mM ethanol for 5 weeks and were compared with untreated cells (n=3 cultures).
In addition, Kyoto Encyclopedia of Genes and Genomes (KEGG) pathway analysis revealed that EtOH treatment increased glycolysis/gluconeogenesis, HIF-1 signaling, fructose and mannose metabolism, adrenergic signaling in cardiomyocytes, carbon metabolism, and glucagon signaling (Figure 5C, Table S8). EtOH treatment also decreased focal adhesion, ECM-receptor interaction, protein digestion and absorption, dilated cardiomyopathy, Hippo signaling, TGF-beta signaling, hypertrophic cardiomyopathy, regulation of actin cytoskeleton, PI3K-Akt signaling, vascular smooth muscle contraction, platelet activation, signaling pathways regulating pluripotency of stem cells, Rap1 signaling, and growth hormone synthesis, secretion and action (Figure 5D, Table S9).
Overall, our transcriptomics analysis revealed dysregulation of metabolic function, downregulation of ECM organization and disturbance in cytoskeletal organization and developmental pathways in EtOH-treated cells.
Chronic EtOH treatment of hiPSC-CMs alters metabolite levels identified by metabolomics analysis
To further understand the metabolic differences associated with chronic EtOH treatment, we compared metabolic features of cardiac spheroids treated with EtOH at 17 mM for 5 weeks with untreated cells by untargeted metabolomic analysis via liquid chromatography-mass spectroscopy (LC-MS). Of the 14,454 features identified, 548 were significantly altered (variable importance in projection [VIP] score > 2) (Figure 6A). By partial least squares discriminant analysis, a clear separation of metabolome was observed between chronic EtOH-treated cells and controls (Figure 6B). This was also evident when significantly differentially expressed metabolites were displayed using heatmap (Figure 6C).
Figure 6. Metabolomics identifies significantly perturbed metabolic features, pathways and metabolites.
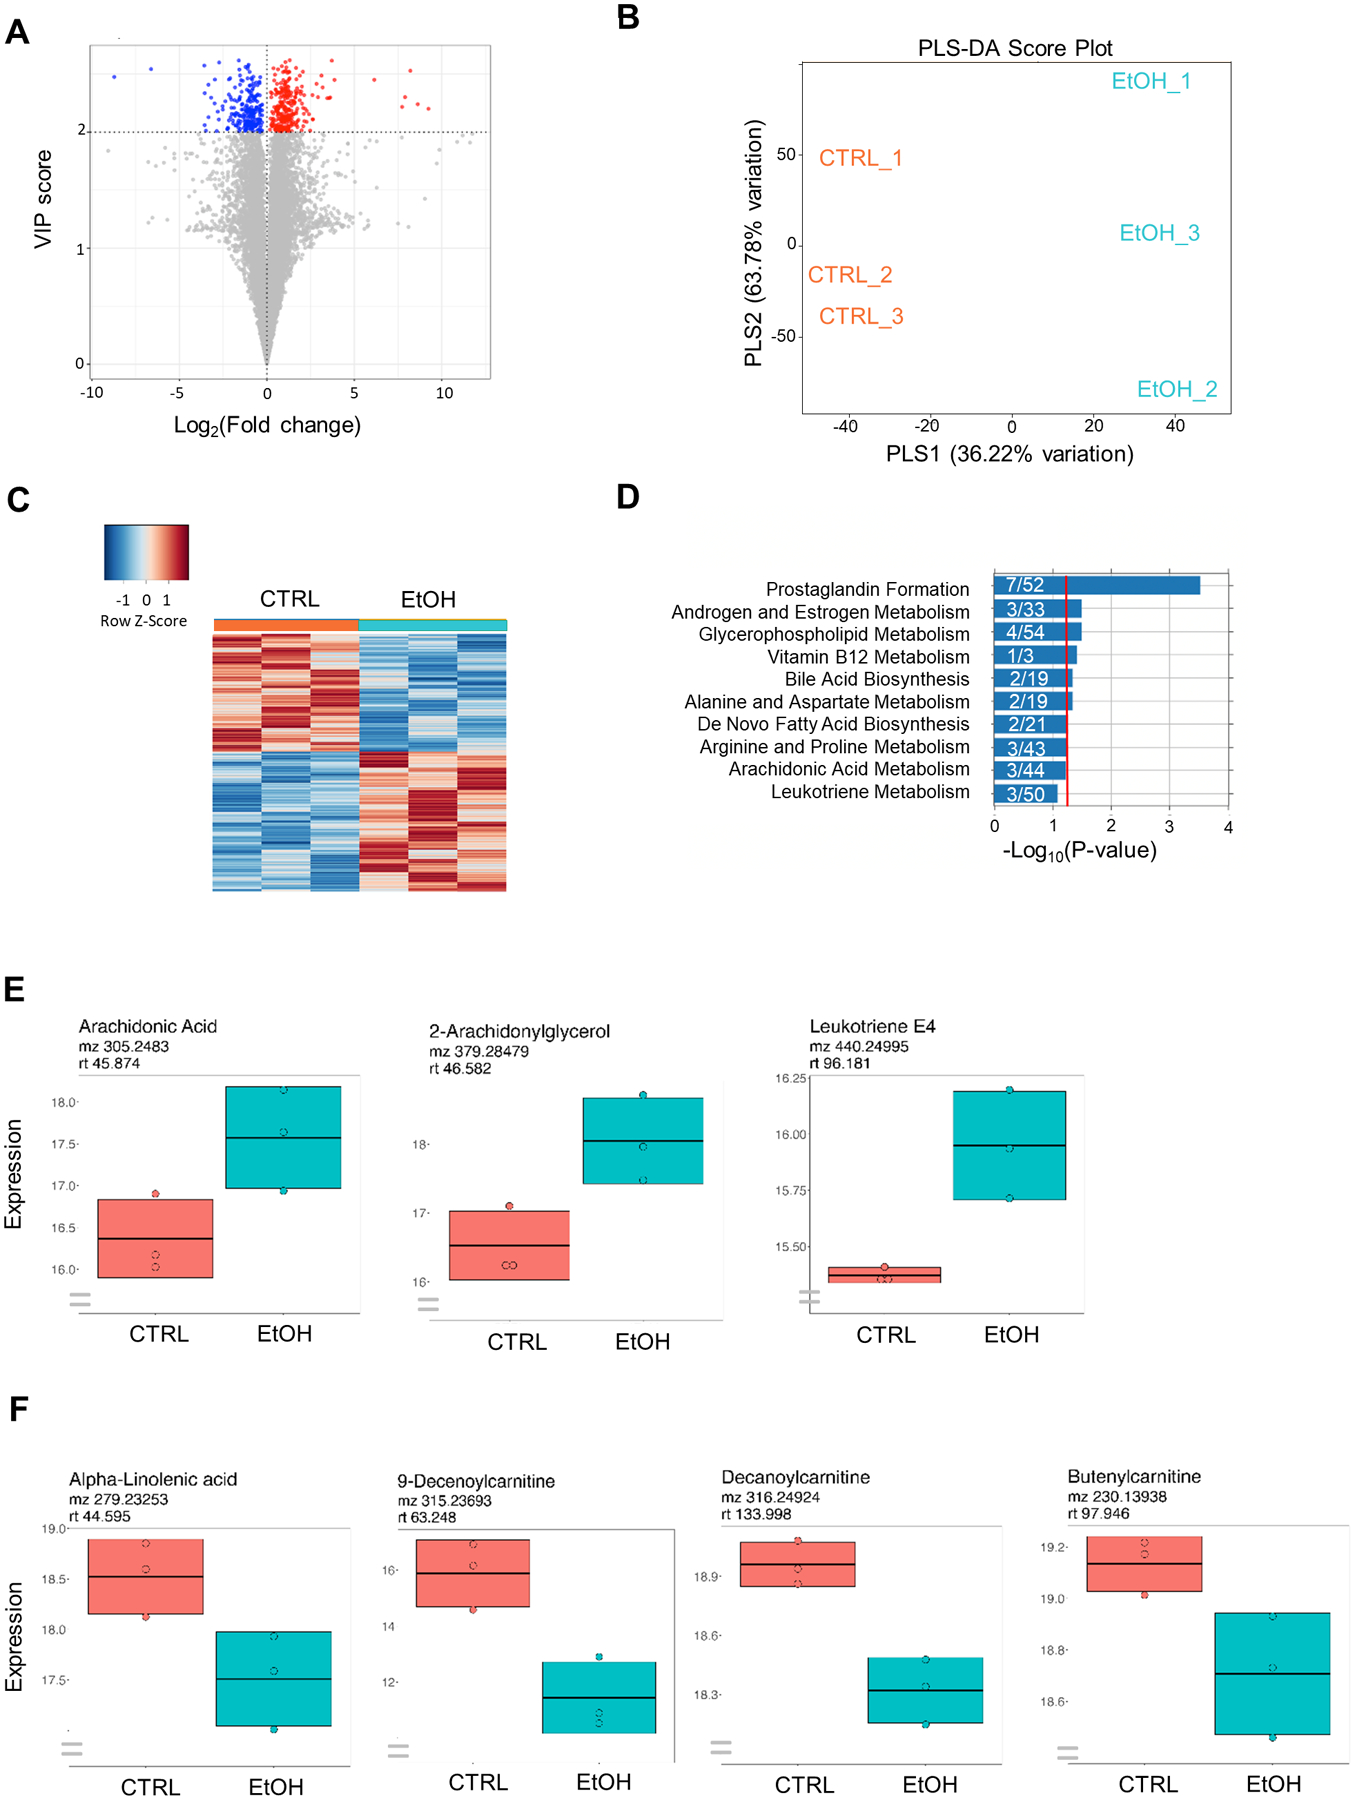
(A) Volcano plot showing significantly perturbed metabolic features. (B) Partial least squares discriminant analysis (PLS-DA) score plot of group separation along the two principal components. (C) Heat map of significantly perturbed metabolic features. (D) Significantly perturbed metabolic pathways identified by Mummichog pathway analysis. The ratios of overlap_size to pathway_size are denoted on the graph. Red line indicates 0.05 p-value threshold. (E) Box plots of individual metabolites within the pathway of prostaglandin formation from arachidonic acid showing the mean intensity of each metabolite between the two groups. (F) Box plots of selected metabolites showing metabolic shift in long-term EtOH-treated cells. 3D hiPSC-CMs were treated with 17 mM ethanol (EtOH) for 5 weeks and were compared with untreated cells (CTRL) (n=3 cultures).
To identify significantly affected metabolic pathways, we performed pathway enrichment analysis on the selected significantly altered metabolic features. Pathway analysis performed on HILIC-pos data revealed enrichment of prostaglandin formation from arachidonate, androgen and estrogen biosynthesis and metabolism, glycerophospholipid metabolism, vitamin B12 metabolism, bile acid biosynthesis, and alanine and aspartate metabolism (Figure 6D).
We further analyzed individual metabolic features within enriched metabolic pathways using xMSannotator metabolic feature annotation tool (Uppal et al., 2017) to characterize the regulation of each pathway. Prostaglandin formation pathway was upregulated as indicated by increased intensity of metabolites such as arachidonic acid, 2-arachidonylglycerol, and leukotriene E4 in long-term EtOH-treated hiPSC-CMs compared with untreated cells (Figure 6E). Furthermore, other metabolites not included in pathway enrichment analysis were also affected by long-term EtOH treatment in hiPSC-CMs. Specifically, essential fatty acid such as alpha-linolenic acid and various acylcarnitines such as 9-decenoylcarnitine, decanoylcarnitine and butenylcarnitine were decreased in long-term EtOH-treated cells compared with untreated cells (Figure 6F).
Since prostaglandin formation is associated with proinflammation, these findings suggest proinflammatory effects of EtOH treatment on hiPSC-CMs. In addition, since acylcarnitines are responsible for the transportation of fatty acids from the cytoplasm into the mitochondria to produce energy through fatty acid oxidation (β-oxidation), these results also suggest that long-term EtOH treatment of hiPSC-CMs resulted in decreased fatty acid oxidation, which is consistent with the observed mitochondrial dysfunction and decreased expression of CPT1B in long-term EtOH-treated hiPSC-CMs.
Integrated omics analysis revealed pathways associated with metabolic and functional alterations in hiPSC-CMs upon chronic ethanol exposure
Each of the omics dataset revealed unique functional alterations in hiPSC-CMs subjected to long-term EtOH exposure: transcriptomics data revealed increase in glycolysis, disturbance in cytoskeletal organization and HIF-1α pathway activation; metabolomics data revealed activation of proinflammatory pathways, hormonal responses and decrease in mitochondrial function and overall energy metabolism; and proteomics data from our previous publication suggested dysregulation of proteins involved with heart contraction and ECM regulation (Liu et al., 2020b). To put all this information together and gain a comprehensive insight into changes that occurred after long-term EtOH exposure, we performed integrated omics analysis using xMWAS network algorithm (Uppal et al., 2018).
The integration of proteomics (Liu et al., 2021), transcriptomics, and metabolomics data generated five unique protein-gene-metabolite communities or clusters by correlating 382 proteins, 1,701 genes, and 14,454 metabolic features (Figure 7A, S2). Subsequently, functional enrichment analysis of omics feature set within each xMWAS community revealed their respective functional subclusters. More specifically, functional enrichment analysis performed on subclusters of proteomics features revealed alterations in pathways including focal adhesion and nucleotide sugar metabolism (Table S10). Transcriptomic features showed alterations in metabolism, developmental pathways such as hippo signaling, TGF-beta signaling and MAPK signaling, as well as focal adhesion (Table S11). Among these pathways, focal adhesion was identified by both transcriptomic and proteomic features (Figures 7A, S3).
Figure 7. Integrated omics analysis.

(A) Visualization of the proteins, genes, and metabolites in clusters. Each cluster is indicated by a different color as shown. Squares are proteins, circles are genes, and triangles are metabolites, with positive correlations between them denoted in blue lines and negative correlations in red. GO terms next to square bullets are enriched by proteins and circle bullets by genes. (B) Putative mechanism of chronic EtOH-induced cardiotoxicity. 3D hiPSC-CMs cells were treated with 17 mM ethanol for 5 weeks and were compared with untreated cells (n=3 cultures). Integrated omics analysis reveals key pathways affected by EtOH. The affected pathways are likely associated with dysregulated metabolism, increased mitochondrial damage, decreased contractility and abnormal Ca2+ handling, which are highly relevant to clinical outcomes including atrial fibrillation and dilated cardiomyopathy.
Hence, integrated omics analysis highlighted downstream specific pathways affected by long-term EtOH exposure that are associated with metabolic and functional alterations in hiPSC-CMs (Figure 7B).
DISCUSSION
By modeling chronic alcohol exposure-induced cardiotoxicity in hiPSC-CMs, we found that treatment with EtOH at physiologically relevant concentrations for an extended period caused severe detrimental effects on hiPSC-CMs. These effects were manifested in decreased mitochondrial membrane potential and mitochondrial content, decreased mitochondrial function, and altered expression of related genes. Our transcriptomics and metabolomics analyses identified key genes and metabolic features affected by chronic EtOH exposure, which will be useful in future studies to address relevant disease phenotypes. In addition, our integrated omics analysis revealed specific pathways affected by long-term EtOH exposure that were associated with metabolic and functional alterations in hiPSC-CMs.
Our transcriptomics and GO enrichment analyses revealed that upregulated DEGs in EtOH-treated hiPSC-CMs were highly associated with glycolytic process and carbohydrate metabolic process as well as response to hypoxia. The genes related to glycolytic process such as PDK1, PDK3, GAPDH, LDHA, PGK1, GPI, and HK2 were increased in their expression levels in EtOH-treated hiPSC-CMs than in untreated cells; among them, PDK1 and PDK3 function as inhibitors of pyruvate dehydrogenase and activate glycolysis in TCA cycle. Similar metabolic remodeling on increasing glycolysis occurs during cardiac pathological response such as hypertrophy (Allard et al., 1994), heart failure (Masoud et al., 2014), and ischemia (Hue et al., 2002), and upregulation of hypoxia pathway is indicative of increased reliance to glycolysis rather than using fatty acids for energy source (Kierans and Taylor, 2021). In heart failure, increased glycolysis is likely due to a compensatory response to reduced mitochondrial function including oxidative metabolism and ATP production (Lopaschuk et al., 2021). Such defects in mitochondrial function can be contributed by many factors including increased oxidative stress (Lopaschuk et al., 2021). Consistently, we observed increased glycolysis, decreased mitochondrial function (in this study) and increased oxidative stress (Rampoldi et al., 2019) in EtOH-treated hiPSC-CMs.
In addition to changes in genes associated with glycolysis, hiPSC-CMs had reduced mitochondrial function upon long-term EtOH treatment. This conclusion was based on measurements of multiple mitochondrial features, including mitochondrial membrane potential detected by TMRM staining, the expression of mitochondrial protein Tom20 by immunocytochemistry and high-content imaging, and overall mitochondrial function as measured by oxygen consumption rate in the Seahorse MitoStress assay and gene expression. The decreased mitochondrial function in EtOH-treated hiPSC-CMs also supports the hypothesis that long-term EtOH treatment prevents normal cardiomyocyte development. Indeed, our RNA-seq analysis showed down-regulation of genes associated with heart development.
Our RNA-seq analysis also indicated alteration of genes associated with inflammation in EtOH-treated hiPSC-CMs, which is consistent with inflammation induced by chronic EtOH consumption in many parts of the body such as the joints (Barr et al., 2016), intestines (Bishehsari et al., 2017), and brain (Leclercq et al., 2017). For example, we found upregulation of T cell chemotaxis genes like WNK1, Wnt5A, ADAM10, and CXCL11 in EtOH-treated hiPSC-CMs. Upregulation of these genes provides a potential causal link to proinflammatory response upon chronic EtOH exposure. WNK1 is a negative regulator of NLRP3 inflammasome (Mayes-Hopfinger et al., 2021). Wnt5A is involved in macrophage inflammatory activation in sepsis and is a target for anti-inflammatory mediators (Pereira et al., 2008). ADAM10 is a mediator of vascular inflammation (Yang et al., 2020). CXCL11 stimulates intestinal inflammation in response to microbial stimuli (Liu et al., 2011), and also serves as immunostimulatory cytokine that is partially responsible for SARS-CoV-2 cytokine storm (Callahan et al., 2021).
Patients with excessive alcohol use have altered serum metabolomic signature when compared with healthy controls (Liu et al., 2022). Excessive alcohol use can also induce pro-inflammatory response (Crews et al., 2021). In our study, metabolomic profiling of EtOH-treated hiPSC-CMs revealed activation of proinflammatory pathways by arachidonic acid and its downstream metabolites. Chronic alcohol consumption has been shown to induce inflammation in many bodily contexts, as suggested by increased concentrations of arachidonic acid, prostaglandin, leukotriene, and other arachidonic acid metabolites (Sonnweber et al., 2018). Indeed, arachidonic acid and its wide spectrum of derivatives such as prostaglandins and leukotrienes contribute to many metabolic pathways behind cardiovascular diseases, cancers, and inflammatory diseases (Wang et al., 2021a, Ma et al., 2022). Downregulation of alpha-linolenic acid is suggestive of defective cell membrane and cardiac function (Fleming and Kris-Etherton, 2014). Downregulation of various acylcarnitine such as 9-decenoylcarnitine suggests mitochondrial dysfunction, and this metabolite is also involved in incident atrial fibrillation and related to left atrium size and left ventricular mass (Lind et al., 2021).
Comprehensive analysis of omics data using xMWAS network algorithm identified distinct subclusters of differentially expressed genes and proteins in EtOH-treated hiPSC-CMs compared with untreated cells. The most frequently observed pathway associated with these genes and proteins was actin cytoskeleton regulation including focal adhesion. EtOH-treatment induced cytoskeleton dysregulation and changes in ECM-receptor interaction, focal adhesion and cytokine-cytokine receptor interaction. In addition, EtOH-treatment altered signaling pathways such as PI3K-Akt signaling, hippo signaling, and TGF-beta signaling. These changes in EtOH-treated hiPSC-CMs are consistent with observations from other in vitro and in vivo studies of chronic EtOH exposure (Table S12). In a swine model, the myocardium of EtOH-treated animals had decreased expression of proadhesion proteins focal adhesion kinase, paxillin, integrin-β1, and TGF-beta compared with sucrose-treated animals (Elmadhun et al., 2017). The impact of chronic EtOH exposure to actin cytoskeleton and ECM has also been documented in both cardiac cells (Fernandez-Sola, 2020) and non-cardiac cells such as hepatocytes (Shepard and Tuma, 2010). It is also known that dysregulation of actin cytoskeleton and ECM leads to inflammation and affects downstream signaling pathways (Suresh and Diaz, 2021).
In addition to the affected pathways identified by our integrated omics analysis, EtOH-treated hiPSC-CMs also had pathological phenotypes such as dysregulated metabolism and increased mitochondrial damage as observed in this study, and decreased contractility and Ca2+ handling regulation as observed in previous studies (Rampoldi et al., 2019, Liu et al., 2021, Liu et al., 2020b). These pathological phenotypes in EtOH-treated hiPSC-CMs are highly relevant to preclinical in vivo animal studies (Steiner and Lang, 2017) and clinical outcomes including atrial fibrillation (Voskoboinik et al., 2019) and dilated cardiomyopathy (Fernandez-Sola, 2020) (Figure 7B and Table S12).
Our findings also have implication for potential treatment for FASD. Increased mitochondrial damage observed in EtOH-treated hiPSC-CMs was also observed in a mouse model of FASD (Nyquist-Battie and Freter, 1988). In our hiPSC-CM model, upregulation of HIF-1α pathway together with decreased mitochondrial function likely contributed to increased glycolytic pathway identified by RNA-seq and decreased β-oxidation identified by metabolomics. Given that the inhibition of HIF-1α pathway can increase β-oxidation, ATP production, and mitochondrial function in cardiomyocytes (Gentillon et al., 2019), targeting HIF-1α pathway may attenuate alcohol-induced cardiotoxicity.
In conclusion, our study demonstrates that chronic EtOH treatment of hiPSC-CMs results in (1) decreased mitochondrial function, (2) altered metabolism including fatty acid oxidation, and (3) gene expression changes associated with increased glycolysis and impaired cardiac structural development. Our study also reveals changes in various signaling pathways (e.g., HIF-1α pathway) worthy of further investigation for potential therapeutic intervention in alcohol-induced cardiotoxicity including FASD.
Supplementary Material
ACKNOWLEDGMENTS
This study was supported by the National Institutes of Health [R01HL136345 and R01AA028527]; NSF-CASIS (National Science Foundation-Center for the Advancement of Science in Space) [CBET 1926387]; and Imagine, Innovate and Impact (I3) Funds from the Emory School of Medicine and through the Georgia CTSA NIH award [UL1-TR002378].
Footnotes
SUPPLEMENTAL INFORMATION
Supplemental Materials include 3 supplementary figures and 12 supplementary tables.
CONFLICTS OF INTEREST
The authors have no disclosures to report and declare no competing financial interests.
DATA AND CODE AVAILABILITY
RNA-seq data reported in this paper is at GEO: GSE218604. Other data that support the findings in this study are available per request.
REFERENCES
- Allard MF, Schonekess BO, Henning SL, English DR, Lopaschuk GD (1994) Contribution of oxidative metabolism and glycolysis to ATP production in hypertrophied hearts. Am J Physiol 267:H742–750. [DOI] [PubMed] [Google Scholar]
- Barr T, Helms C, Grant K, Messaoudi I (2016) Opposing effects of alcohol on the immune system. Prog Neuropsychopharmacol Biol Psychiatry 65:242–251. [DOI] [PMC free article] [PubMed] [Google Scholar]
- Bishehsari F, Magno E, Swanson G, Desai V, Voigt RM, Forsyth CB, Keshavarzian A (2017) Alcohol and gut-derived inflammation. Alcohol Res 38:163–171. [PMC free article] [PubMed] [Google Scholar]
- Burd L, Deal E, Rios R, Adickes E, Wynne J, Klug MG (2007) Congenital heart defects and fetal alcohol spectrum disorders. Congenit Heart Dis 2:250–255. [DOI] [PubMed] [Google Scholar]
- Callahan V, Hawks S, Crawford MA, Lehman CW, Morrison HA, Ivester HM, Akhrymuk I, Boghdeh N, Flor R, Finkielstein CV, Allen IC, Weger-Lucarelli J, Duggal N, Hughes MA, Kehn-Hall K (2021) The pro-inflammatory chemokines CXCL9, CXCL10 and CXCL11 are upregulated following SARS-CoV-2 infection in an AKT-dependent manner. Viruses 13.1062. [DOI] [PMC free article] [PubMed] [Google Scholar]
- Crews FT, Zou J, Coleman LG, Jr. (2021) Extracellular microvesicles promote microglia-mediated pro-inflammatory responses to ethanol. J Neurosci Res 99:1940–1956. [DOI] [PMC free article] [PubMed] [Google Scholar]
- Elmadhun NY, Sabe AA, Lassaletta AD, Dalal RS, Sellke FW (2017) Effects of alcohol on postoperative adhesion formation in ischemic myocardium and pericardium. Ann Thorac Surg 104:545–552. [DOI] [PubMed] [Google Scholar]
- England LJ, Bennett C, Denny CH, Honein MA, Gilboa SM, Kim SY, Guy GP Jr., Tran EL, Rose CE, Bohm MK, Boyle CA (2020) Alcohol use and co-use of other substances among pregnant females aged 12–44 years - United States, 2015–2018. MMWR Morb Mortal Wkly Rep 69:1009–1014. [DOI] [PMC free article] [PubMed] [Google Scholar]
- Fernandez-Sola J (2020) The effects of ethanol on the heart: alcoholic cardiomyopathy. Nutrients 12.572 [DOI] [PMC free article] [PubMed] [Google Scholar]
- Fleming JA, Kris-Etherton PM (2014) The evidence for alpha-linolenic acid and cardiovascular disease benefits: Comparisons with eicosapentaenoic acid and docosahexaenoic acid. Adv Nutr 5:863S–876S. [DOI] [PMC free article] [PubMed] [Google Scholar]
- Gentillon C, Li D, Duan M, Yu WM, Preininger MK, Jha R, Rampoldi A, Saraf A, Gibson GC, Qu CK, Brown LA, Xu C (2019) Targeting HIF-1alpha in combination with PPARalpha activation and postnatal factors promotes the metabolic maturation of human induced pluripotent stem cell-derived cardiomyocytes. J Mol Cell Cardiol 132:120–135. [DOI] [PMC free article] [PubMed] [Google Scholar]
- Glymour MM (2014) Alcohol and cardiovascular disease. BMJ 349:g4334. [DOI] [PubMed] [Google Scholar]
- Go YM, Uppal K, Walker DI, Tran V, Dury L, Strobel FH, Baubichon-Cortay H, Pennell KD, Roede JR, Jones DP (2014) Mitochondrial metabolomics using high-resolution Fourier-transform mass spectrometry. Methods Mol Biol 1198:43–73. [DOI] [PMC free article] [PubMed] [Google Scholar]
- Guo GR, Chen L, Rao M, Chen K, Song JP, Hu SS (2018) A modified method for isolation of human cardiomyocytes to model cardiac diseases. J Transl Med 16:288. [DOI] [PMC free article] [PubMed] [Google Scholar]
- Hnatiuk AP, Briganti F, Staudt DW, Mercola M (2021) Human iPSC modeling of heart disease for drug development. Cell Chem Biol 28:271–282. [DOI] [PMC free article] [PubMed] [Google Scholar]
- Hue L, Beauloye C, Marsin AS, Bertrand L, Horman S, Rider MH (2002) Insulin and ischemia stimulate glycolysis by acting on the same targets through different and opposing signaling pathways. J Mol Cell Cardiol 34:1091–1097. [DOI] [PubMed] [Google Scholar]
- Jha R, Wu Q, Singh M, Preininger MK, Han P, Ding G, Cho HC, Jo H, Maher KO, Wagner MB, Xu C (2016) Simulated microgravity and 3D culture enhance induction, viability, proliferation and differentiation of cardiac progenitors from human pluripotent stem cells. Sci Rep 6:30956. [DOI] [PMC free article] [PubMed] [Google Scholar]
- Jha R, Xu RH, Xu C (2015) Efficient differentiation of cardiomyocytes from human pluripotent stem cells with growth factors. Methods Mol Biol 1299:115–131. [DOI] [PMC free article] [PubMed] [Google Scholar]
- Kierans SJ, Taylor CT (2021) Regulation of glycolysis by the hypoxia-inducible factor (HIF): implications for cellular physiology. J Physiol 599:23–37. [DOI] [PubMed] [Google Scholar]
- Laflamme MA, Chen KY, Naumova AV, Muskheli V, Fugate JA, Dupras SK, Reinecke H, Xu C, Hassanipour M, Police S, O’Sullivan C, Collins L, Chen Y, Minami E, Gill EA, Ueno S, Yuan C, Gold J, Murry CE (2007) Cardiomyocytes derived from human embryonic stem cells in pro-survival factors enhance function of infarcted rat hearts. Nat Biotechnol 25:1015–1024. [DOI] [PubMed] [Google Scholar]
- Leclercq S, de Timary P, Delzenne NM, Starkel P (2017) The link between inflammation, bugs, the intestine and the brain in alcohol dependence. Transl Psychiatry 7:e1048. [DOI] [PMC free article] [PubMed] [Google Scholar]
- Li S, Park Y, Duraisingham S, Strobel FH, Khan N, Soltow QA, Jones DP, Pulendran B (2013) Predicting network activity from high throughput metabolomics. PLoS Comput Biol 9:e1003123. [DOI] [PMC free article] [PubMed] [Google Scholar]
- Lind L, Salihovic S, Sundstrom J, Broeckling CD, Magnusson PK, Prenni J, Fall T, Arnlov J (2021) Multicohort metabolomics analysis discloses 9-decenoylcarnitine to be associated with incident atrial fibrillation. J Am Heart Assoc 10:e017579. [DOI] [PMC free article] [PubMed] [Google Scholar]
- Liu D, Yang Z, Chandler K, Oshodi A, Zhang T, Ma J, Kusumanchi P, Huda N, Heathers L, Perez K, Tyler K, Ross RA, Jiang Y, Zhang D, Zhang M, Liangpunsakul S (2022) Serum metabolomic analysis reveals several novel metabolites in association with excessive alcohol use - an exploratory study. Transl Res 240:87–98. [DOI] [PMC free article] [PubMed] [Google Scholar]
- Liu KH, Nellis M, Uppal K, Ma C, Tran V, Liang Y, Walker DI, Jones DP (2020a) Reference standardization for quantification and harmonization of large-scale metabolomics. Anal Chem 92:8836–8844. [DOI] [PMC free article] [PubMed] [Google Scholar]
- Liu R, Sun F, Armand LC, Wu R, Xu C (2021) Chronic ethanol exposure induces deleterious changes in cardiomyocytes derived from human induced pluripotent stem cells. Stem Cell Rev Rep 17:2314–2331. [DOI] [PMC free article] [PubMed] [Google Scholar]
- Liu R, Sun F, Forghani P, Armand LC, Rampoldi A, Li D, Wu R, Xu C (2020b) Proteomic profiling reveals roles of stress response, Ca2+ transient dysregulation, and novel signaling pathways in alcohol-induced cardiotoxicity. Alcohol Clin Exp Res 44:2187–2199. [DOI] [PMC free article] [PubMed] [Google Scholar]
- Liu Z, Chen X, Wang X, Chen X, Song CH, Du Y, Su J, Yaseen SA, Yang PC (2011) Chemokine CXCL11 links microbial stimuli to intestinal inflammation. Clin Exp Immunol 164:396–406. [DOI] [PMC free article] [PubMed] [Google Scholar]
- Lopaschuk GD, Karwi QG, Tian R, Wende AR, Abel ED (2021) Cardiac energy metabolism in heart failure. Circ Res 128:1487–1513. [DOI] [PMC free article] [PubMed] [Google Scholar]
- Love MI, Huber W, Anders S (2014) Moderated estimation of fold change and dispersion for RNA-seq data with DESeq2. Genome Biol 15:550. [DOI] [PMC free article] [PubMed] [Google Scholar]
- Ma K, Yang J, Shao Y, Li P, Guo H, Wu J, Zhu Y, Zhang H, Zhang X, Du J, Li Y (2022) Therapeutic and prognostic significance of arachidonic acid in heart failure. Circ Res 130:1056–1071. [DOI] [PubMed] [Google Scholar]
- Masoud WG, Ussher JR, Wang W, Jaswal JS, Wagg CS, Dyck JR, Lygate CA, Neubauer S, Clanachan AS, Lopaschuk GD (2014) Failing mouse hearts utilize energy inefficiently and benefit from improved coupling of glycolysis and glucose oxidation. Cardiovasc Res 101:30–38. [DOI] [PubMed] [Google Scholar]
- May PA, Chambers CD, Kalberg WO, Zellner J, Feldman H, Buckley D, Kopald D, Hasken JM, Xu R, Honerkamp-Smith G, Taras H, Manning MA, Robinson LK, Adam MP, Abdul-Rahman O, Vaux K, Jewett T, Elliott AJ, Kable JA, Akshoomoff N, Falk D, Arroyo JA, Hereld D, Riley EP, Charness ME, Coles CD, Warren KR, Jones KL, Hoyme HE (2018) Prevalence of fetal alcohol spectrum disorders in 4 US communities. JAMA 319:474–482. [DOI] [PMC free article] [PubMed] [Google Scholar]
- Mayes-Hopfinger L, Enache A, Xie J, Huang CL, Kochl R, Tybulewicz VLJ, Fernandes-Alnemri T, Alnemri ES (2021) Chloride sensing by WNK1 regulates NLRP3 inflammasome activation and pyroptosis. Nat Commun 12:4546. [DOI] [PMC free article] [PubMed] [Google Scholar]
- Mitcheson JS, Hancox JC, Levi AJ (1998) Cultured adult cardiac myocytes: future applications, culture methods, morphological and electrophysiological properties. Cardiovasc Res 39:280–300. [DOI] [PubMed] [Google Scholar]
- Mouton AJ, El Hajj EC, Ninh VK, Siggins RW, Gardner JD (2020) Inflammatory cardiac fibroblast phenotype underlies chronic alcohol-induced cardiac atrophy and dysfunction. Life Sci 245:117330. [DOI] [PubMed] [Google Scholar]
- Nakashima MA, Silva CBP, Gonzaga NA, Simplicio JA, Omoto ACM, Tirapelli LF, Tanus-Santos JE, Tirapelli CR (2019) Chronic ethanol consumption increases reactive oxygen species generation and the synthesis of pro-inflammatory proteins in the heart through TNFR1-dependent mechanisms. Cytokine 121:154734. [DOI] [PubMed] [Google Scholar]
- Nguyen VB, Probyn ME, Campbell F, Yin KV, Samuel CS, Zimanyi MA, Bertram JF, Black MJ, Moritz KM (2014) Low-dose maternal alcohol consumption: effects in the hearts of offspring in early life and adulthood. Physiol Rep 2: e12087. [DOI] [PMC free article] [PubMed] [Google Scholar]
- Ninh VK, El Hajj EC, Ronis MJ, Gardner JD (2019) N-Acetylcysteine prevents the decreases in cardiac collagen I/III ratio and systolic function in neonatal mice with prenatal alcohol exposure. Toxicol Lett 315:87–95. [DOI] [PMC free article] [PubMed] [Google Scholar]
- Nyquist-Battie C, Freter M (1988) Cardiac mitochondrial abnormalities in a mouse model of the fetal alcohol syndrome. Alcohol Clin Exp Res 12:264–267. [DOI] [PubMed] [Google Scholar]
- Pereira C, Schaer DJ, Bachli EB, Kurrer MO, Schoedon G (2008) Wnt5A/CaMKII signaling contributes to the inflammatory response of macrophages and is a target for the antiinflammatory action of activated protein C and interleukin-10. Arterioscler Thromb Vasc Biol 28:504–510. [DOI] [PubMed] [Google Scholar]
- Rampoldi A, Singh M, Wu Q, Duan M, Jha R, Maxwell JT, Bradner JM, Zhang X, Saraf A, Miller GW, Gibson G, Brown LA, Xu C (2019) Cardiac toxicity from ethanol exposure in human-induced pluripotent stem cell-derived cardiomyocytes. Toxicol Sci 169:280–292. [DOI] [PMC free article] [PubMed] [Google Scholar]
- Ren J, Wold LE, Natavio M, Ren BH, Hannigan JH, Brown RA (2002) Influence of prenatal alcohol exposure on myocardial contractile function in adult rat hearts: role of intracellular calcium and apoptosis. Alcohol Alcohol 37:30–37. [DOI] [PubMed] [Google Scholar]
- Sarmah S, Marrs JA (2017) Embryonic ethanol exposure affects early- and late-added cardiac precursors and produces long-lasting heart chamber defects in zebrafish. Toxics 5:35. [DOI] [PMC free article] [PubMed] [Google Scholar]
- Shepard BD, Tuma PL (2010) Alcohol-induced alterations of the hepatocyte cytoskeleton. World J Gastroenterol 16:1358–1365. [DOI] [PMC free article] [PubMed] [Google Scholar]
- Sonnweber T, Pizzini A, Nairz M, Weiss G, Tancevski I (2018) Arachidonic acid metabolites in cardiovascular and metabolic diseases. Int J Mol Sci 19:3285. [DOI] [PMC free article] [PubMed] [Google Scholar]
- Steiner JL, Lang CH (2017) Alcoholic cardiomyopathy: disrupted protein balance and impaired cardiomyocyte contractility. Alcohol Clin Exp Res 41:1392–1401. [DOI] [PMC free article] [PubMed] [Google Scholar]
- Subelj L, Bajec M (2011) Unfolding communities in large complex networks: combining defensive and offensive label propagation for core extraction. Phys Rev E Stat Nonlin Soft Matter Phys 83:036103. [DOI] [PubMed] [Google Scholar]
- Suresh R, Diaz RJ (2021) The remodelling of actin composition as a hallmark of cancer. Transl Oncol 14:101051. [DOI] [PMC free article] [PubMed] [Google Scholar]
- Uppal K, Ma C, Go YM, Jones DP, Wren J (2018) xMWAS: a data-driven integration and differential network analysis tool. Bioinformatics 34:701–702. [DOI] [PMC free article] [PubMed] [Google Scholar]
- Uppal K, Soltow QA, Strobel FH, Pittard WS, Gernert KM, Yu T, Jones DP (2013) xMSanalyzer: automated pipeline for improved feature detection and downstream analysis of large-scale, non-targeted metabolomics data. BMC Bioinformatics 14:15. [DOI] [PMC free article] [PubMed] [Google Scholar]
- Uppal K, Walker DI, Jones DP (2017) xMSannotator: An R package for network-based annotation of high-resolution metabolomics data. Anal Chem 89:1063–1067. [DOI] [PMC free article] [PubMed] [Google Scholar]
- Voskoboinik A, Wong G, Lee G, Nalliah C, Hawson J, Prabhu S, Sugumar H, Ling LH, McLellan A, Morton J, Kalman JM, Kistler PM (2019) Moderate alcohol consumption is associated with atrial electrical and structural changes: Insights from high-density left atrial electroanatomic mapping. Heart Rhythm 16:251–259. [DOI] [PubMed] [Google Scholar]
- Wang B, Wu L, Chen J, Dong L, Chen C, Wen Z, Hu J, Fleming I, Wang DW (2021a) Metabolism pathways of arachidonic acids: mechanisms and potential therapeutic targets. Signal Transduct Target Ther 6:94. [DOI] [PMC free article] [PubMed] [Google Scholar]
- Wang W, Liu T, Liu Y, Yu L, Yan X, Weng W, Lu X, Zhang C (2021b) Astaxanthin attenuates alcoholic cardiomyopathy via inhibition of endoplasmic reticulum stress-mediated cardiac apoptosis. Toxicol Appl Pharmacol 412:115378. [DOI] [PubMed] [Google Scholar]
- White AM, Castle IP, Hingson RW, Powell PA (2020) Using death certificates to explore changes in alcohol-related mortality in the United States, 1999 to 2017. Alcohol Clin Exp Res 44:178–187. [DOI] [PubMed] [Google Scholar]
- World Health Organization (2018) Global status report on alcohol and health 2018. Geneva: World Health Organization; Licence: CC BY-NC-SA 3.0. [Google Scholar]
- Yang J, LeBlanc ME, Cano I, Saez-Torres KL, Saint-Geniez M, Ng YS, D’Amore PA (2020) ADAM10 and ADAM17 proteases mediate proinflammatory cytokine-induced and constitutive cleavage of endomucin from the endothelial surface. J Biol Chem 295:6641–6651. [DOI] [PMC free article] [PubMed] [Google Scholar]
- Yang M, Wang S, Fu S, Wu NN, Xu X, Sun S, Zhang Y, Ren J (2021) Deletion of the E3 ubiquitin ligase, Parkin, exacerbates chronic alcohol intake-induced cardiomyopathy through an Ambra1-dependent mechanism. Br J Pharmacol 178:964–982. [DOI] [PubMed] [Google Scholar]
- Yu G, Wang LG, Han Y, He QY (2012) clusterProfiler: an R package for comparing biological themes among gene clusters. OMICS 16:284–287. [DOI] [PMC free article] [PubMed] [Google Scholar]
- Yu T, Park Y, Johnson JM, Jones DP (2009) apLCMS--adaptive processing of high-resolution LC/MS data. Bioinformatics 25:1930–1936. [DOI] [PMC free article] [PubMed] [Google Scholar]
Associated Data
This section collects any data citations, data availability statements, or supplementary materials included in this article.
Supplementary Materials
Data Availability Statement
RNA-seq data reported in this paper is at GEO: GSE218604. Other data that support the findings in this study are available per request.