Abstract
Ketone bodies are essential alternative fuels that allow humans to survive periods of glucose scarcity induced by starvation and prolonged exercise. A widely used ketogenic diet (KD), which is extremely high in fat with very low carbohydrates, drives the host into using β-hydroxybutyrate for the production of ATP and lowers NLRP3-mediated inflammation. However, the extremely high fat composition of KD raises the question of how ketogenesis affects adipose tissue to control inflammation and energy homeostasis. Here, by using single-cell RNA sequencing of adipose-tissue-resident immune cells, we show that KD expands metabolically protective γδ T cells that restrain inflammation. Notably, long-term ad libitum KD feeding in mice causes obesity, impairs metabolic health and depletes the adipose-resident γδ T cells. In addition, mice lacking γδ T cells have impaired glucose homeostasis. Our results suggest that γδ T cells are mediators of protective immunometabolic responses that link fatty acid–driven fuel use to reduced adipose tissue inflammation.
Diets with limited carbohydrate content induce a metabolic switch to fatty acid metabolism whereby the host produces and uses ketone bodies to meet energetic demands. The KD is an extremely high-fat, very low-carbohydrate diet in which ~90% of calories come from fat and <1% of calories from carbohydrate, thus limiting glucose availability and forcing this metabolic adaptation towards fatty acid oxidation. Despite its very high caloric density, the consumption of KD is linked to weight loss and improved metabolic health in obese individuals1,2 and reduced inflammation in mouse models3–5. In contrast, it is established that caloric excess, especially the high-fat, high-carbohydrate western-type diet, is the main cause of obesity and its associated chronic inflammatory diseases. Obesity is a growing global epidemic that is associated with increased risk of numerous chronic diseases, including stroke and cardiovascular diseases, diabetes and certain cancers6. According to the World Health Organization, nearly 2 billion people world-wide are overweight and approximately one-third of these individuals are obese7. Thus, weight-loss diets, including KD, that force the host to be driven into fatty acid oxidation and production of ketone bodies represent a potential strategy to alleviate obesity-associated diseases. It is, however, unclear how a calorically rich KD affects adipose tissue inflammation.
Visceral adipose tissue contains a unique compartment of resident leukocytes that help maintain energy homeostasis but can also cause inflammation during chronic caloric excess8. Notably, in obese visceral fat the adipose-resident immune cell composition skews towards increased proportions of pro-inflammatory cell types such as effector T cells and pro-inflammatory macrophages. The influx of pro-inflammatory cells overwhelms the resident cells present in adipose tissue in lean animals that typically maintain tissue homeostasis9–15. This accumulation of pro-inflammatory leukocytes facilitates systemic inflammation leading to loss of metabolic homeostasis.
We have previously identified the NLRP3 inflammasome as a key driver of obesity-related inflammation and disease16. The NLRP3 inflammasome is a carefully regulated cytosolic innate immune sensor expressed in innate immune cells that provides a scaffold for caspase 1 activation, enabling cleavage and secretion of IL-1β and IL-18. Elevated NLRP3-dependent caspase 1 activation can be detected in visceral white adipose tissue of obese mice, and Nlrp3−/− mice are protected from obesity-induced inflammatory diseases including glucose intolerance and hepatic steatosis16. These findings collectively highlight the NLRP3 inflammasome as a critical driver of adipose tissue inflammation during obesity.
The ketone body β-hydroxybutyrate (BHB) inhibits NLRP3 inflammasome activation4,17, thereby linking innate immunity and metabolism. Ketogenesis canonically occurs in the liver and is induced when glucose becomes limited, for example during fasting, or when consuming a very low-carbohydrate diet such as the KD18. Hepatocytes lack the required enzyme for ketolysis, 3-oxo-acid coenzyme-A-transferase 1 (Oxct1, SCOT), which allows ketone bodies to be transported in the blood to other essential tissues such as the brain, heart and skeletal muscle for oxidation and generation of ATP. KD has been used clinically for decades to relieve seizure burden in some drug-refractory epilepsy patients19 and was recently demonstrated to increase median lifespan and improve cognitive function in old mice20,21. Improvements in lifespan and healthspan by KD fits well with our recent findings that the ketone body BHB inhibits the NLRP3 inflammasome in macrophages and neutrophils4,17, which we have previously linked to age-related inflammation and disease22,23. Similarly, macrophages are capable of directly oxidizing ketone bodies such as acetoacetate, and this is important for protection against high-fat-diet-induced liver fibrosis24. These non-canonical functions of ketone bodies highlight an important and previously unappreciated node in immune-metabolic regulation of inflammation.
Because of its inhibitory effects on NLRP3 activation we wondered how KD feeding would affect visceral adipose tissue inflammation. Here, we report that short-term KD feeding improves metabolic control and activates a subset of tissue-resident γδ T cells. Transcriptomic analyses indicate that KD activates gene signatures supporting a role for tissue repair and homeostasis in adipose-resident γδ T cells. Conversely, long-term continuous KD feeding depletes γδ T cells, induces obesity and glucose intolerance, and consistent with these data, γδ T cell-deficient mice exhibit even worse metabolic outcomes. Overall our findings underscore the importance of adipose-tissue-resident γδ T cells in maintenance of inflammation and homeostasis.
Results
KD acutely improves glycaemia and increases fat mass.
We began by assessing the physiologic response to short-term (1 week) KD feeding. As noted in previous studies25,26 KD feeding in mice reduced non-fasting blood glucose levels, which mimicked the phenotype of fasting blood glucose levels (Fig. 1a). KD also elevated circulating BHB, and there was no additive effect of KD + fasting on BHB levels (Fig. 1b). Despite no net change in body weight (Fig. 1c), we did observe a modest but consistent increase in fat mass after only 1 week of KD feeding (Fig. 1d). In agreement with our previous findings4,17, 1 week of KD feeding significantly reduced Nlrp3 gene expression in epididymal fat (Efat), and Il1b expression tended to be lower in Efat of KD-fed mice (Fig. 1e). KD represents a unique metabolic paradox in that it is extremely high in fat but promotes fatty acid oxidation to generate ATP. We found that KD increased expression of Oxct1, the rate-limiting enzyme in ketolysis and Cpt1a (carnitine palmitoyltransferase I), a mitochondrial membrane enzyme that permits long-chain fatty acid entry into the mitochondria for oxidation (Fig. 1d). Induction of fatty acid metabolism genes is generally associated with improved metabolic homeostasis, despite our observation that whole-body fat mass was increased. Taken together these data indicated that 1 week of KD feeding improves glycaemia and increases expression of genes associated with fatty acid and ketone oxidation in Efat.
Fig. 1 |. Metabolic response to 1 week of KD feeding.
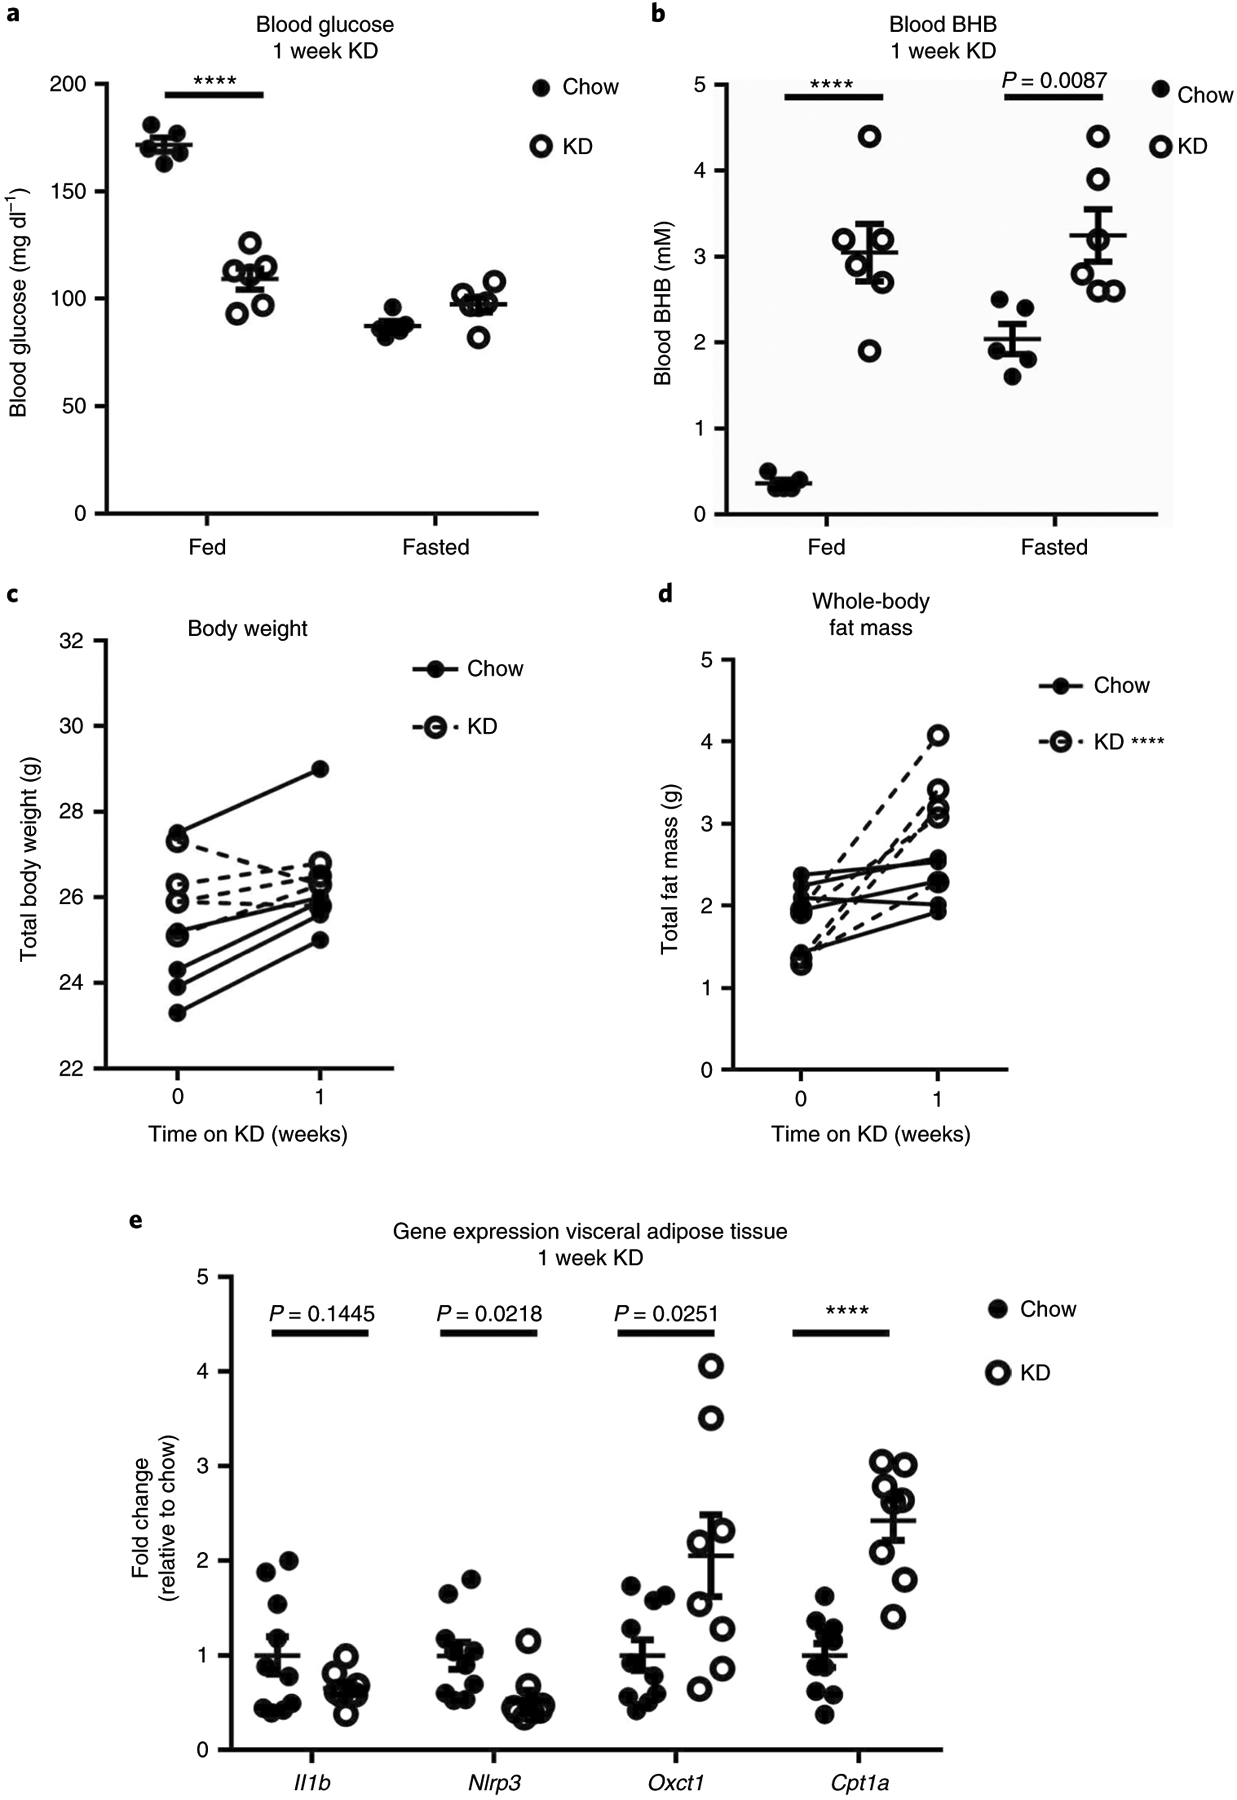
a,b, Fasting and non-fasting (a) blood glucose and (b) BHB levels after 1 week KD (n = 6) versus chow (n = 5) feeding. Statistical differences were calculated by two-way ANOVA with Sidak’s correction for multiple comparisons. c,d, Net body weight change (c) and total fat mass (d) before and after 1 week KD (n = 5) versus chow (n = 5) feeding. Statistical differences were calculated by paired two-tailed Student’s t-test. e, Inflammatory and metabolic gene expression in total Efat. Data are pooled from two independent experiments for a total of n = 10 chow and n = 9 KD samples. Statistical differences were calculated by two-tailed unpaired t-test for each gene. a–d are representative of at least three independent experiments. For all graphs, each dot represents an individual mouse. Data are represented as mean ± s.e.m. Exact P values are shown whenever possible, ****P < 0.0001.
KD alters the adipose-resident immune compartment.
Considering that adipose-resident immune cells regulate tissue homeostasis and systemic inflammation, and that ketone bodies can regulate immune cell function, we next wondered how KD affected the adipose immune compartment. To broadly assess this, we performed single-cell RNA sequencing (scRNA-seq) on exclusively tissue-resident haematopoietic cells in Efat after 1 week of chow or KD feeding. Tissue-resident cells were identified by intravenous (i.v.) labelling to exclude all circulating cells by fluorescence-activated cell sorting (FACS) before sequencing (Fig. 2a). We confirmed visually by two-photon microscopy that i.v. labelling is detected even in the microvasculature of the visceral adipose tissue, increasing the confidence that our analysis broadly captured all true tissue-resident CD45+ cells (Fig. 2b).
Fig. 2 |. Characterization of tissue-resident CD45+ cell populations in Efat by scrNA-seq.
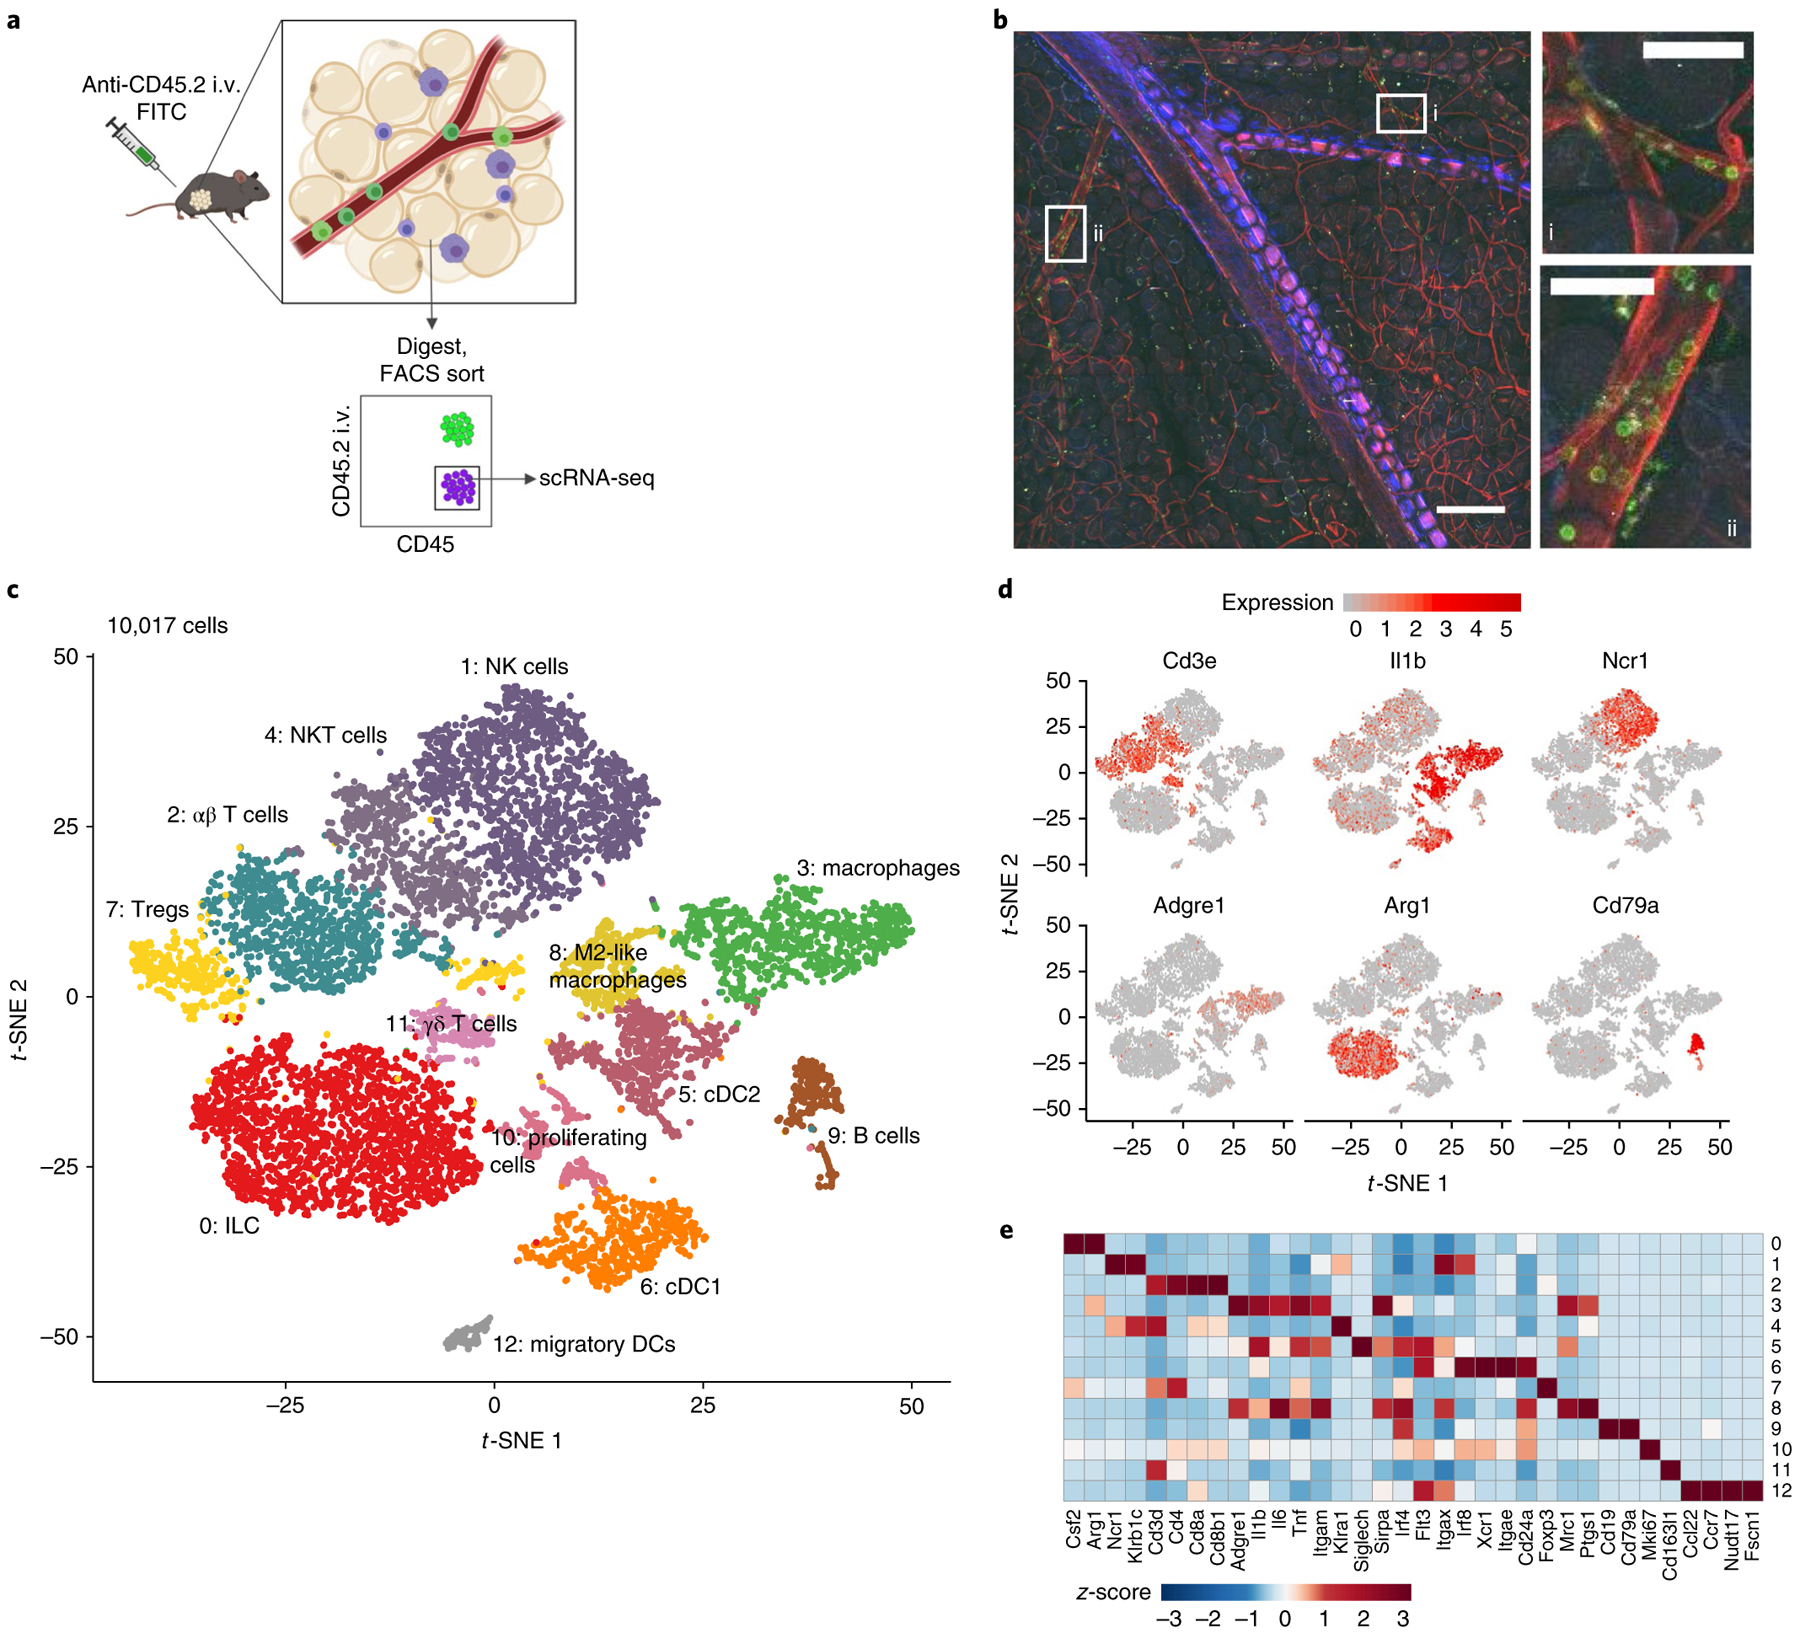
a, Schematic depicting cell sorting strategy to isolate tissue-resident haematopoietic cells in visceral adipose tissue. b, Two-photon microscopy showing i.v.-labelled CD45+ cells in Efat, scale bar, 200 μm. Insets highlight (i) microvasculature; scale bar, 50 μm and (ii) larger blood vessels within visceral adipose tissue; scale bar, 50 μm. Vasculature is visualized in red using a global membrane-Tomato reporter mouse, i.v.+ (circulating, non-resident) cells are shown in green after i.v. injection of anti-CD45.2-A488. Images are representative of two independent experiments. c, t-SNE plot of tissue-resident (i.v.−) CD45+ cells from Efat. Clustering is based on merged analysis of chow- and KD-fed mice. d, t-SNE plot as in c, displaying expression of selected lineage marker genes. e, Heat map of normalized gene expression values of selected genes to identify major lineages. For c–e, expression values were obtained by pooling data from chow and KD samples (each containing n = 4 chow and n = 3 KD pooled biological samples into one technical sample for each diet).
The scRNA-seq of resident CD45+ cells yielded data for 4,458 and 5,559 cells from chow (n = 4 mice pooled) and KD (n = 3 mice pooled) groups, respectively, with the mean number of reads per cell over 120,000 for both samples (Extended Data Fig. 1). Data from chow and KD groups were pooled together to identify sub-populations within the captured cells. Thirteen clusters were found by a graph-based algorithm (Fig. 2c). Using known cell-type markers we identified macrophages (clusters 3, 8), T cells (clusters 2, 7, 11), natural killer cells (NK, cluster 1), NKT cells (cluster 4), B cells (cluster 9), innate lymphoid cells (cluster 0), adipose-resident dendritic cells (DCs, clusters 5, 6) and migratory dendritic cells (cluster 12). Expression patterns of selected markers are shown in Fig. 2d,e and Extended Data Fig. 2a. Cluster 10 represents proliferating cells of mixed lineages (Extended Data Fig. 2b,c).
Side-by-side comparison of chow and KD samples revealed dramatic changes both in overall cellular composition and transcriptional states of individual cell subtypes (Fig. 3a,b). In agreement with our previous findings that BHB inhibits pro-inflammatory macrophages, we observed pronounced loss of these cells (clusters 3 and 8) in the Efat of KD-fed mice (Fig. 3b). In agreement with our earlier results (Fig. 1e) and previous findings17, scRNA-seq analysis revealed global reduction in Il1b expression (Fig. 3c) as a consequence of this macrophage loss (Fig. 3d and Extended Data Fig. 2d). The down-regulation of Nlrp3 gene expression after 1 week of KD feeding (Fig. 1d) may also be linked to this reduction of macrophages as clusters 3 and 8 show the most pronounced ‘NLRP3 inflammasome’ pathway gene signature (Fig. 3e). Both natural killer cells and innate lymphoid cells exhibited dramatic transcriptional shifts (Fig. 3a) but we were particularly struck by the combined transcriptional and numerical changes in adipose-resident B and T cell subsets (clusters 9, 2 and 11), which all approximately doubled after 1 week of KD feeding (Fig. 3b). Although they are a relatively small population, the increase in γδ T cells (cluster 11) by KD (Fig. 3b) piqued our curiosity due to their recently reported role in regulating adipose tissue thermogenesis27.
Fig. 3 |. KD alters the adipose-resident immune compartment.
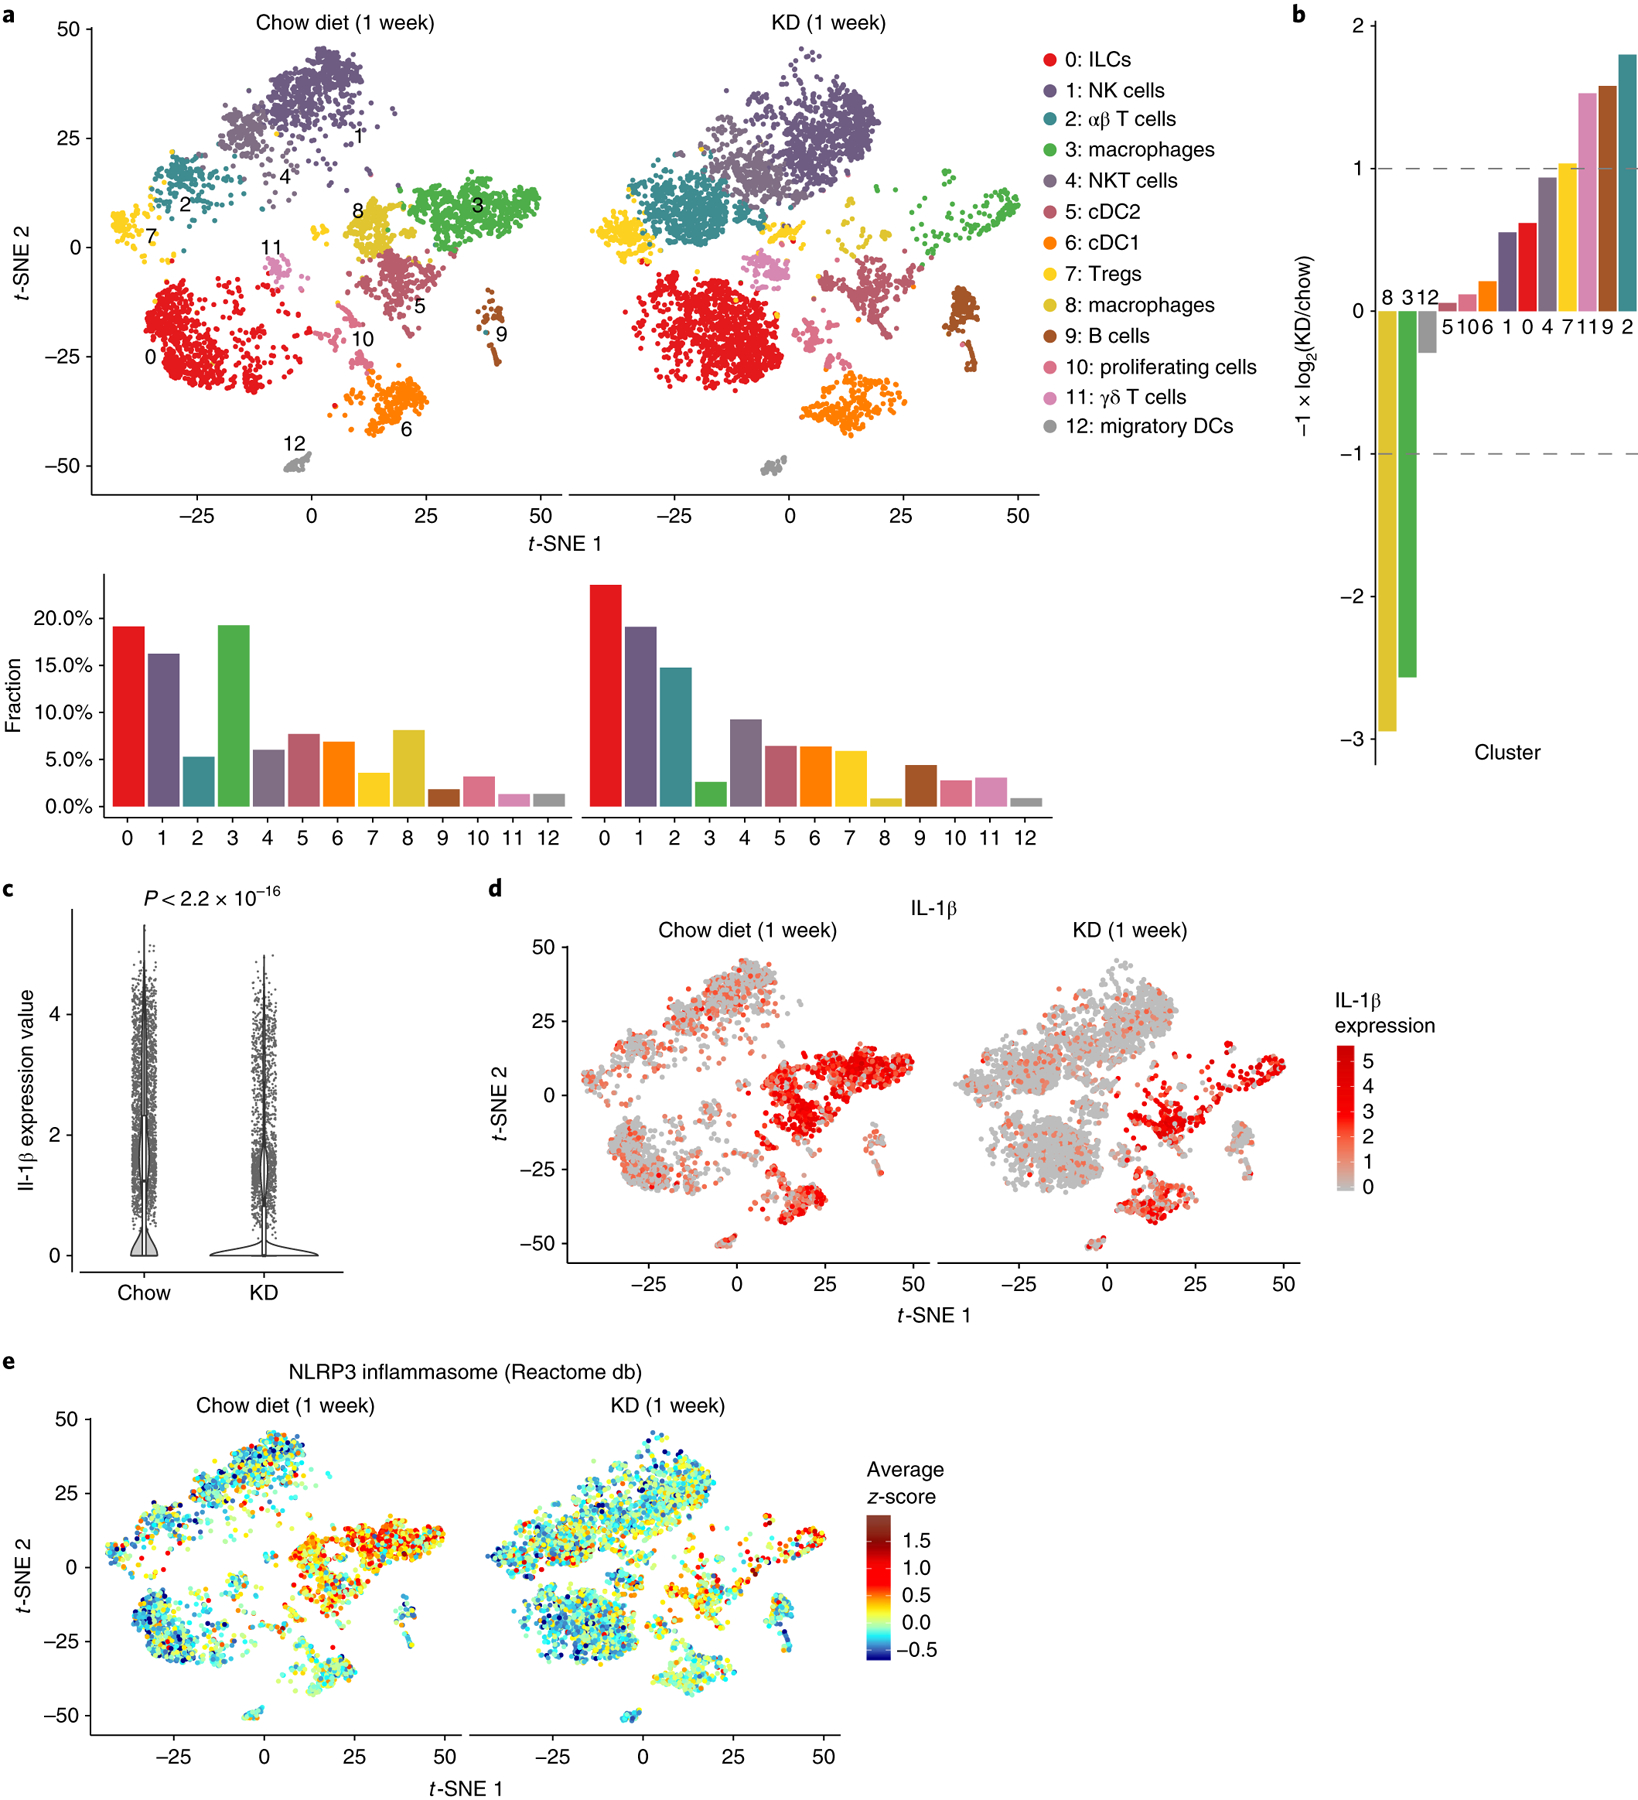
a, t-SNE plots (top) and bar charts (bottom) showing adipose-resident CD45+ populations from chow-fed or KD-fed mice. b, Bar chart showing population fold-changes in relative abundance of each cluster induced by 1 week of KD feeding compared to chow-fed mice. c, Violin plots of Il1b expression within all cells from each group. P value was calculated using two-sided Mann–Whitney U-test. Overlaid box plots show median and 25th–75th percentiles; whiskers extend no further than 1.5× IQR from either upper or lower hinge, as described in Methods. d, t-SNE plots as in a displaying expression of Il1b overlaid in red across all populations. e, t-SNE plot as in a showing average z-scores of genes in the NLRP3 pathway. For a–e, data represent a single technical sample for each diet group, generated by pooling n = 4 chow and n = 3 KD independent samples before sequencing.
Adipose γδ T cells are uniquely tissue-resident.
We verified the expansion of γδ T cells observed in the scRNA-seq data by multi-colour flow cytometry of the stromal vascular fraction of digested Efat (Fig. 4a,b). These analyses also confirmed the loss of adipose tissue macrophages and a loss of eosinophils that were not explicitly identified in the scRNA-seq clustering, but no significant change in Tregcells (Extended Data Fig. 3). Ketogenesis and the γδ T cell expansion were both independent of NLRP3 and FGF21 (Extended Data Fig. 4), a pro-longevity peroxisome proliferator-activated receptor α (PPARα)-dependent hormone induced during ketogenesis28,29. Intravascular labelling revealed that nearly 100% of γδ T cells were tissue-resident, which was notable compared to other CD3+ cells and B cells (Fig. 4c,d). In addition, these data revealed that in healthy adipose tissue, neutrophils (CD11b+Ly6G+) are present in the vasculature and are not tissue-resident (Fig. 4d). Parabiosis experiments also confirmed that, compared to γδ T cells in the spleen, bone marrow and lungs, which exhibited nearly 50% chimerism, Efat γδ T cells were uniquely tissue-resident, with nearly 0% chimerism (Fig. 4e,f). These data also indicated that γδ T cells do not passively migrate into visceral adipose tissue in adult mice. Phenotypic characterization of the Efat γδ T cells identified that 1 week of KD preferentially expanded the CD44+CD27−γδ T cell subset (Fig. 4g), which has previously been identified as IL-17-producing γδ T cells27,30 although we did not observe an increase in IL-17-competent γδ T cells (Fig. 4h). These data highlight the unique tissue-residence of γδ T cells in visceral adipose tissue that were expanded by 1 week of KD feeding.
Fig. 4 |. γδ T cells in visceral fat increase in response to KD and are uniquely tissue-resident.
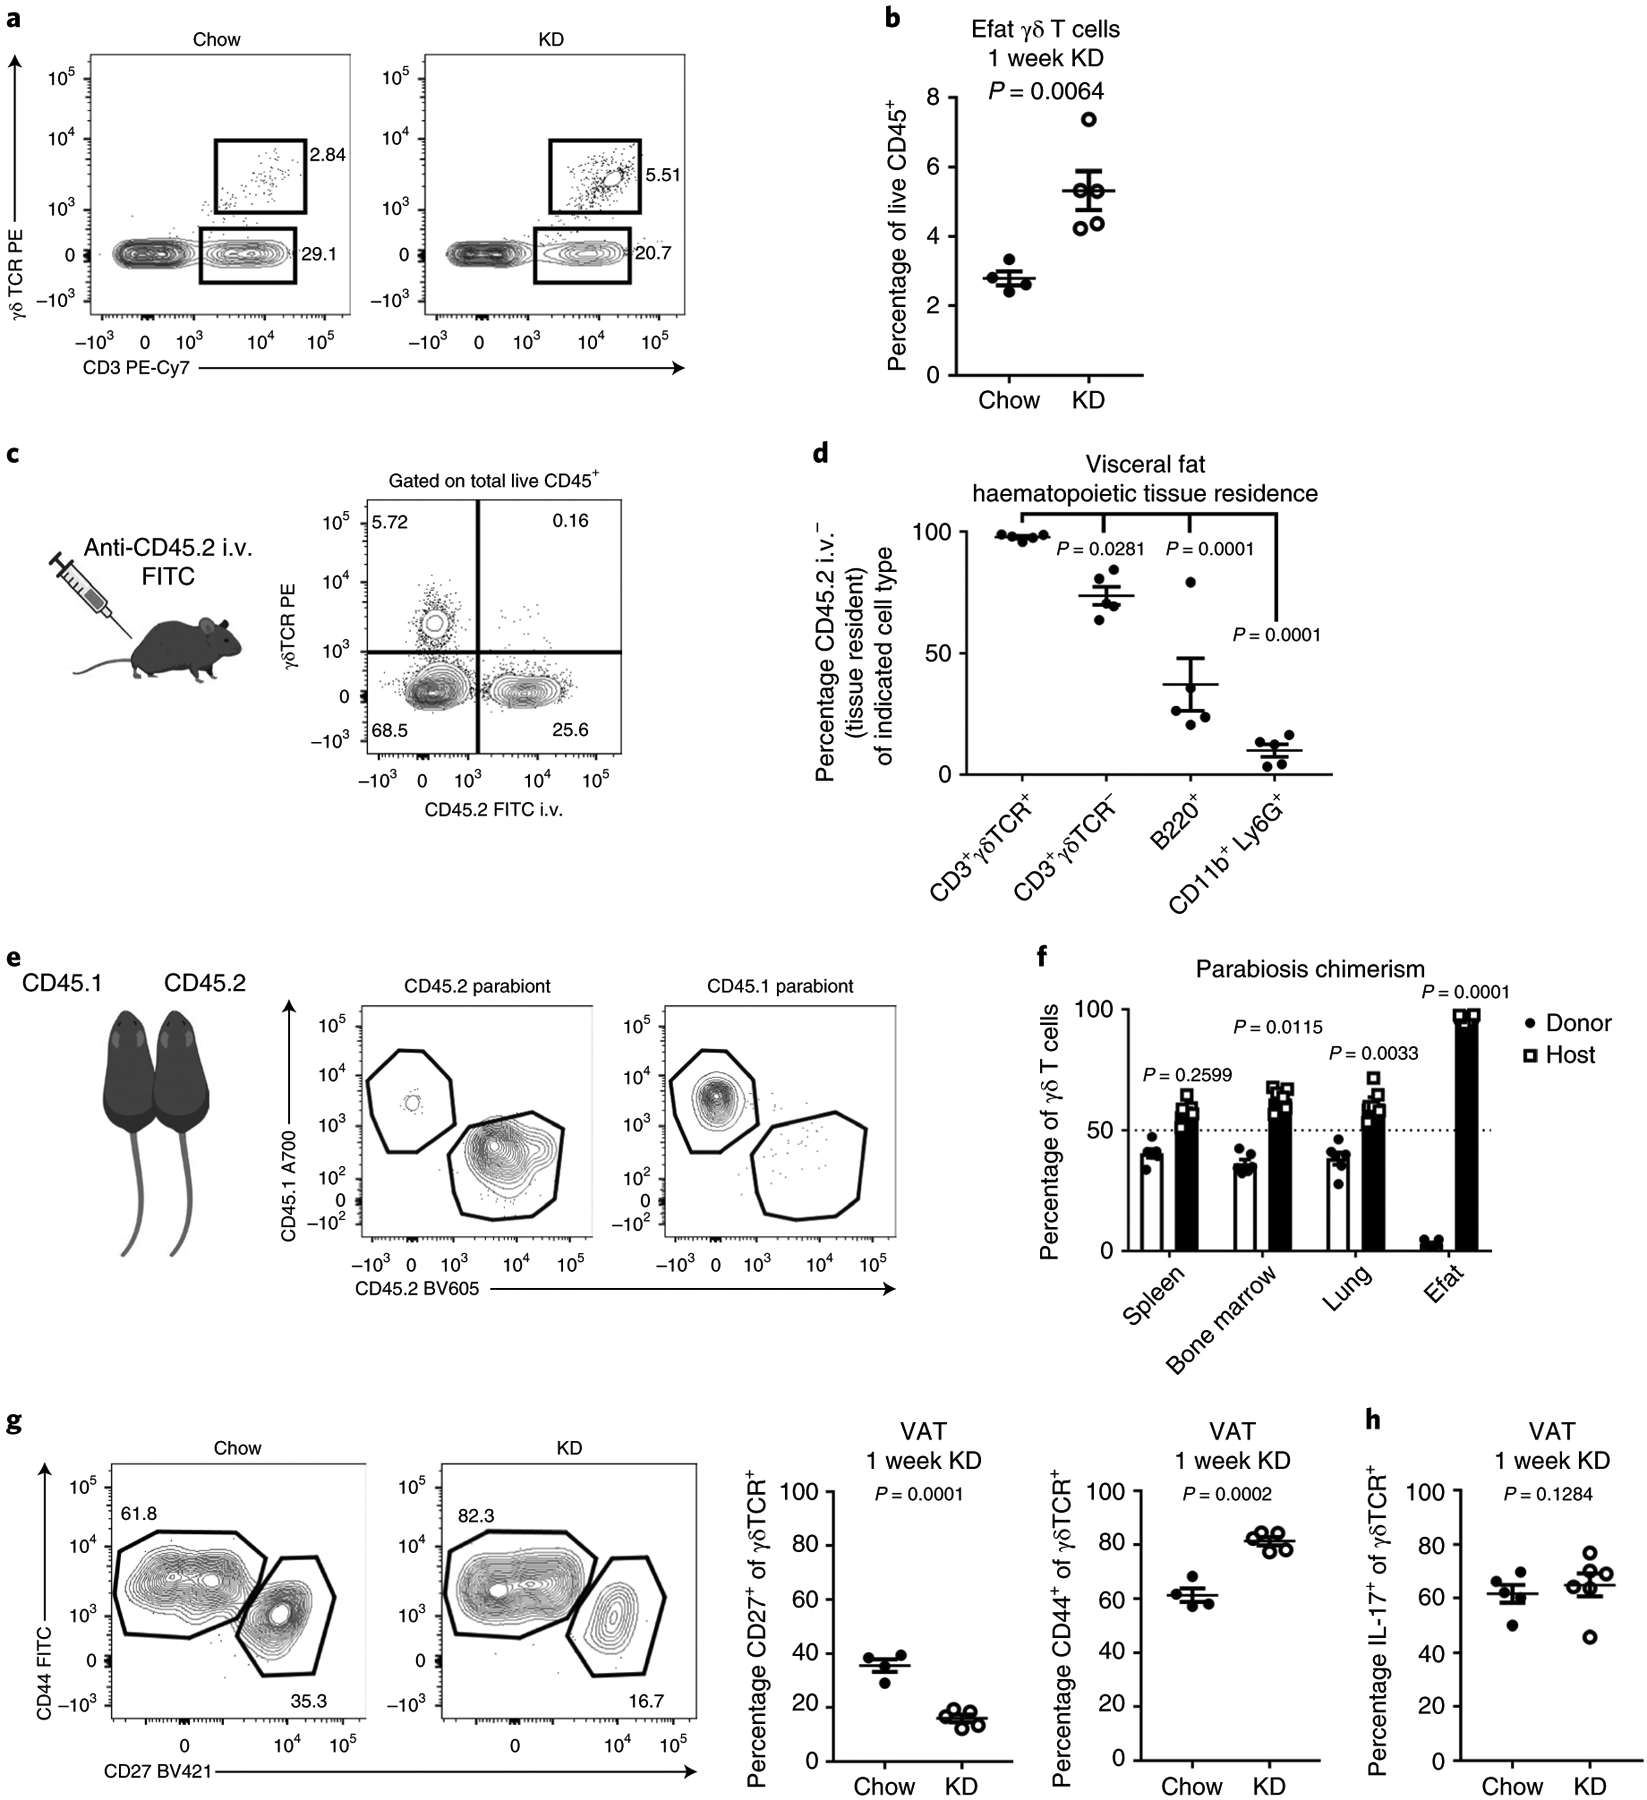
a, Representative FACS plots of γδ T cells from visceral fat after 1 week of of chow versus KD feeding. Representative of at least three independent experiments. b, Quantification of γδ T cells in visceral adipose after 1 week of KD (n = 5) versus chow (n = 4) feeding. Statistical differences were calculated by two-tailed unpaired t-test. c, Cartoon and representative FACS plot of intravascular labelling, gated on total live CD45+ cells in visceral adipose tissue. Data are representative of n = 4 independent experiments. d, Quantification of frequency of selected cell subsets identified as tissue-resident in visceral adipose tissue. Statistical differences were calculated by one-way ANOVA with Dunnet’s correction for multiple comparisons to compare each cell population to the CD3+ γδ T cells. e, Cartoon and representative FACS plot of γδ T cell chimerism in visceral adipose tissue 2 weeks after parabiosis. Gating here is shown within live CD45+ CD3+ γδ TCR + CD11b− B220− CD8− CD4− cells. f, γδ T cell chimerism in lymphoid and adipose tissues 2 weeks after parabiosis surgery. One-way ANOVA with Dunnet’s correction for multiple comparisons was used to determine whether each indicated population was statistically different from 50% chimerism. For e,f, data were collected from four parabiotic pairs, for a total of n = 8 mice analysed. Data are representative of two independent experiments with similar results. g, Representative FACS gating and quantification of CD44 and CD27 expression on visceral adipose tissue γδ T cells after 1 week of chow (n = 4) or KD (n = 5) feeding. Statistical differences were calculated by two-tailed unpaired t-test. Data are representative of two independent experiments. h, Quantification of IL-17-producing γδ T cells in visceral adipose tissue after stimulation with PMA + ionomycin in chow (n = 5) versus KD-fed (n = 6) mice. Statistical differences were calculated by unpaired two-tailed t-test. Data are representative of two independent experiments. For all graphs, data are represented as mean ± s.e.m. and exact P values are shown.
KD enhances γδ T cell gene signatures associated with adipose remodelling.
Whole-mount tissue imaging revealed that γδ T cells are dispersed throughout visceral adipose tissue (Fig. 5a) and not present within a specific neural or lymphoid niche. To gain further insight into the function of adipose γδ T cells we compared their transcriptional profiles after 1 week of chow versus KD feeding. scRNA-seq analysis is restricted to only the most highly expressed genes (on average ~1,500 per cell), thus limiting our ability to compare rare populations such as γδ T cells. To overcome this limitation, we performed whole-transcriptome analysis on bulk γδ T cells sorted from the Efat of chow- and KD-fed mice (Fig. 5b and Extended Data Fig. 5a). Gene set enrichment analysis (GSEA) indicated that KD feeding enriched pathways in adipose γδ T cells associated with extracellular matrix remodelling and tissue homeostasis including ‘extracellular matrix organization’, ‘semaphorin interactions’, ‘extracellular matrix receptor interactions’ and ‘core matrisome’ (Fig. 5d and Supplementary Table 1). Of note, secretion of extracellular matrix components has been implicated in the pro-inflammatory and deleterious senescence-associated secretory phenotype (SASP)-like phenomenon31 but we observed significant down-regulation of genes previously reported to confer a SASP-like phenotype32 (Extended Data Fig. 5b, P = 0.027). RNA-seq analysis identified 65 significantly differentially regulated genes (false discovery rate (FDR) 5%, abs(log2fold change (FC)) > 0.75) in Efat γδ T cells from KD- versus chow-fed mice, with 45 up-regulated and 20 down-regulated genes (Fig. 5c and Extended Data Fig. 5a). Several genes induced by KD, including S1pr1, Itgae and Lgals3, were related to cell trafficking, migration and adhesion. Transcriptome analysis also indicated that KD increased γδ T cell expression of Cpt1a (Extended Data Fig. 5a), the enzyme required for transport of long-chain fatty acids into the mitochondria for oxidation. In contrast, although γδ T cells express ketone metabolism enzymes, these were not induced by KD feeding (Fig. 5f). Together these data suggested that adipose-resident γδ T cells are already primed for adipose tissue remodelling and that activation of these tissue-protective cells may contribute to the physiological effects of KD.
Fig. 5 |. RNA-seq from bulk-sorted adipose γδ T cells reveals KD induces tissue-protective gene signatures in γδ T cells.
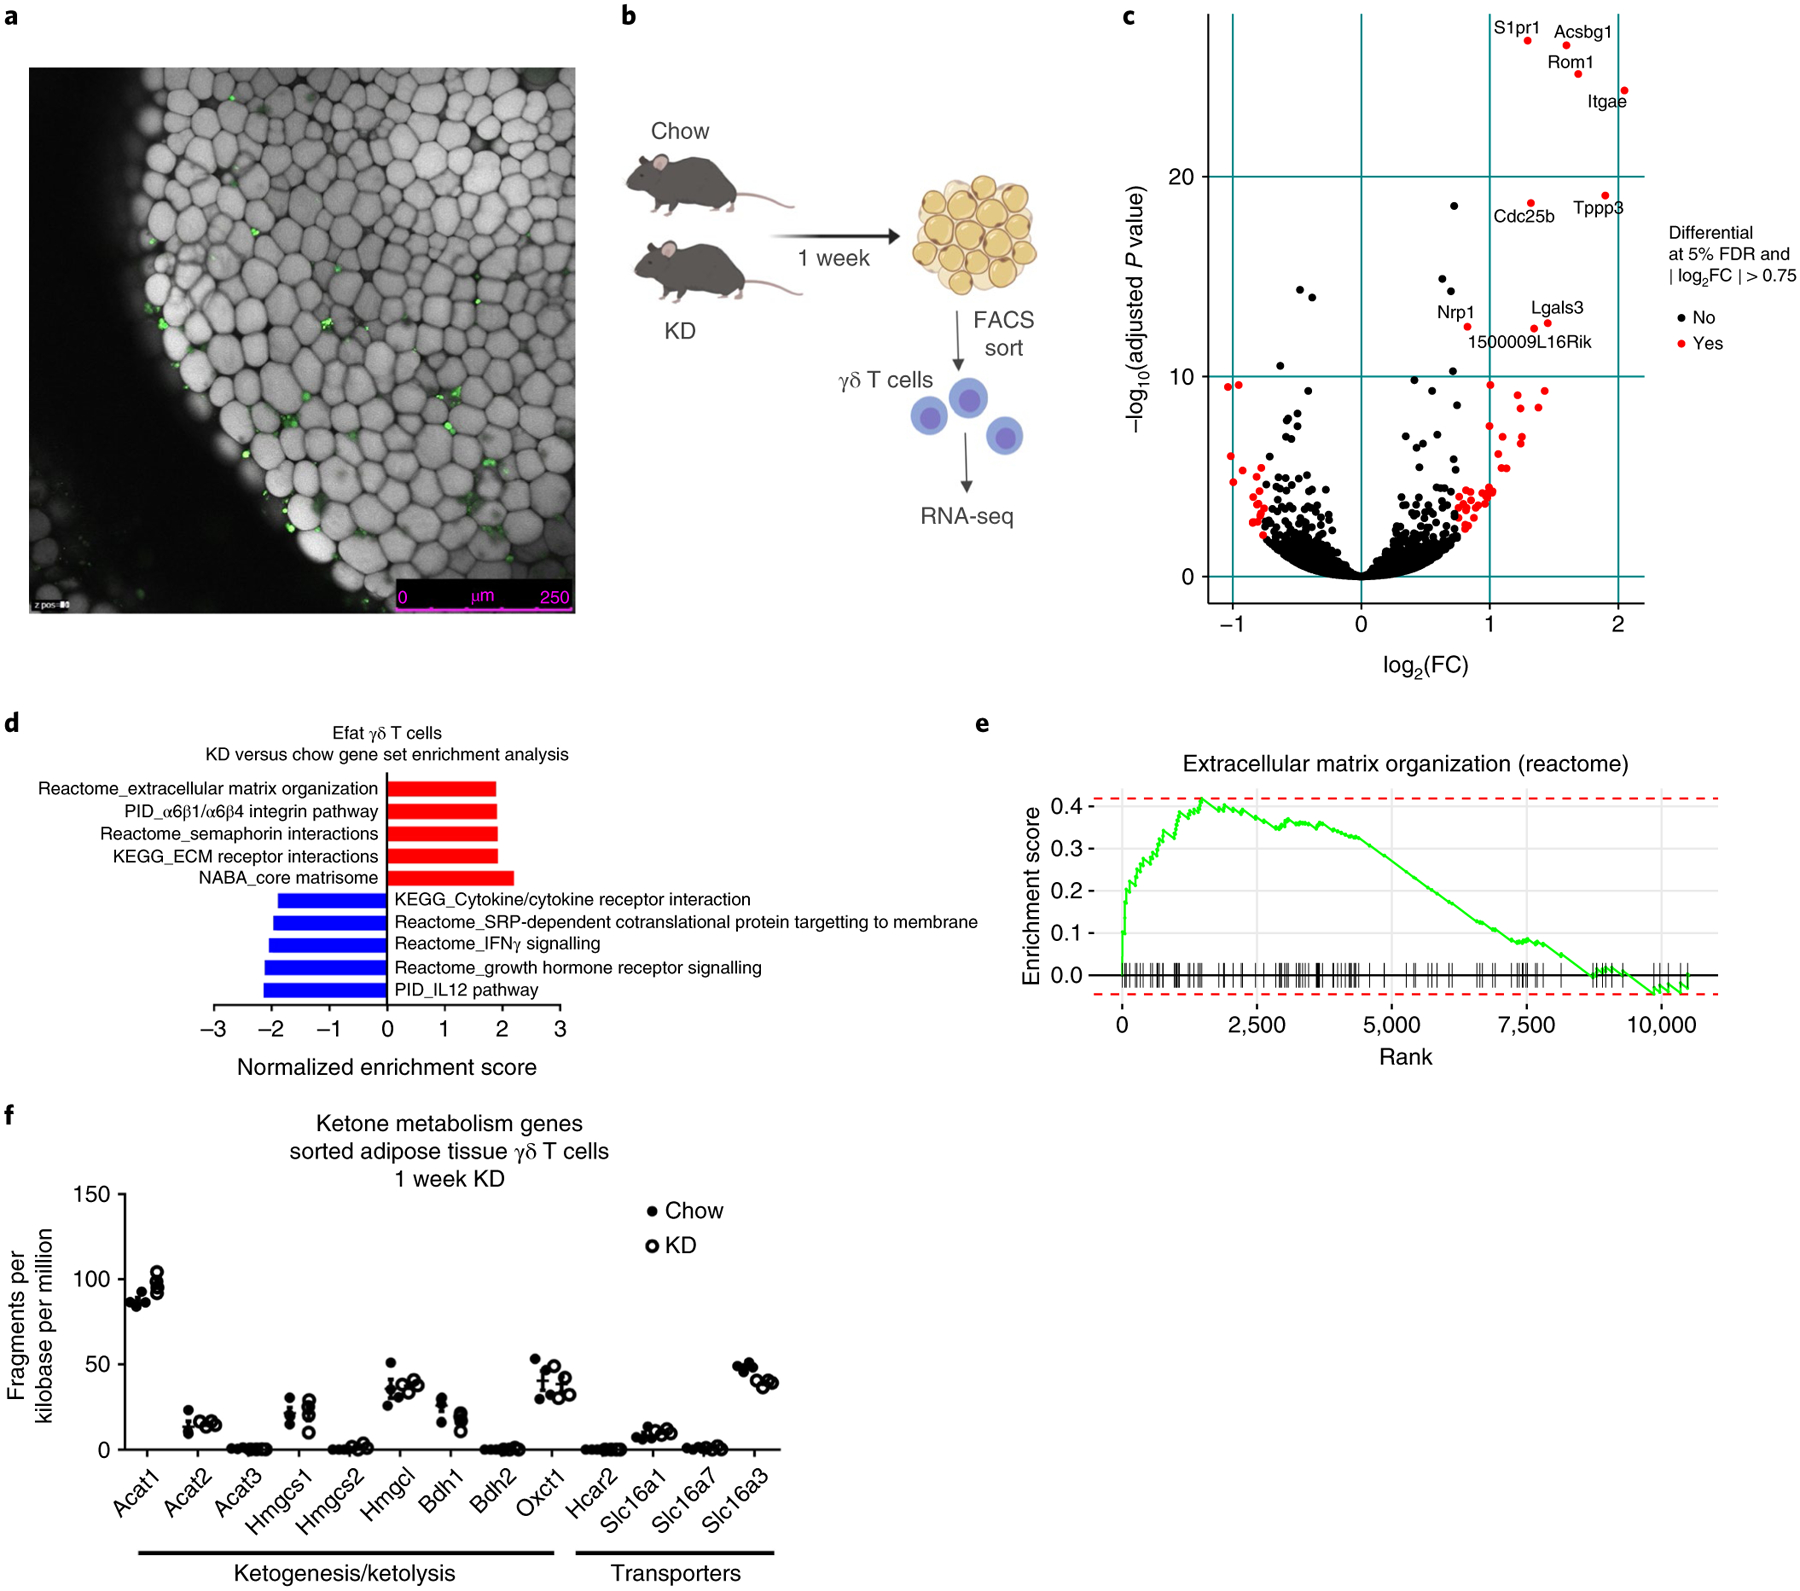
a, Confocal microscopy image of γδ T cell distribution in endometrial adipose tissue. γδ T cells are in green, driven by Tcrd-ZsGreen fluorescence, and adipocytes are stained with LipidTox and visualized in white. Scale bar, 250 μm. Data are representative of n = 4 individual mice from one experiment. b, Experimental design for bulk RNA-seq of FACS-sorted γδ T cells. c, Volcano plot identifying significantly regulated genes (FDR 5% and abs(log2FC) >0.75) within sorted γδ T cells obtained from Efat after 1 week of KD feeding. Increased expression indicates increases induced by KD feeding. d, GSEA of top five significantly up-regulated and top five significantly down-regulated pathways in Efat γδ T cells between chow-fed and 1 week KD-fed mice. Increased expression indicates increases induced by KD feeding. e, GSEA enrichment curves for the extracellular matrix organization pathway (reactome). f, Expression of ketone metabolism genes in adipose tissue γδ T cells, 1 week KD. Data were extracted from RNA-seq analysis (n = 3 chow and n = 3 KD samples each containing n = 2 pooled biological replicates) and are represented as mean ± s.e.m.
Prolonged ad libitum KD promotes obesity and adipose inflammation.
We were intrigued that short-term KD improved glycaemic control yet increased overall fat mass (Fig. 1d) and wondered how long-term KD feeding would affect metabolic health. After 2–3 months of ad libitum KD feeding, mice gained significantly more weight compared to chow-fed controls (Fig. 6a) and exhibited elevated fasting blood glucose (Fig. 6b). KD-fed mice remained ketogenic (Fig. 6c) despite exceptional weight gain. Obesity in KD-fed mice was driven by excessive whole-body fat accumulation (Extended Data Fig. 6a–c) including in the liver (Extended Data Fig. 6d,e). Analysis of insulin-induced AKT phosphorylation in the livers of long-term KD-fed mice revealed an inverse relationship of weight gain/adiposity to insulin action (Extended Data Fig. 6f). Collectively, all these obesity-related phenotypes were associated with impaired glucose tolerance (Fig. 6d). When we assessed changes in the adipose immune compartment of these mice (Extended Data Fig. 6g) we found increased macrophages (Fig. 6e) and reduced γδ T cells (Fig. 6f). Of note, γδ T cells were previously reported to be depleted in blood of obese humans33 and in the skin of genetically obese mice34. In agreement with the KD-induced obesity and insulin resistance, we found increased expression of pro-inflammatory genes Mcp1, Tnfa and Il1b (Fig. 6g–i). Together these data indicate that long-term ad libitum KD feeding in mice promotes obesity-related inflammation and loss of glycaemic control.
Fig. 6 |. Loss of γδ T cells contributes to metabolic dysregulation induced by long-term KD.
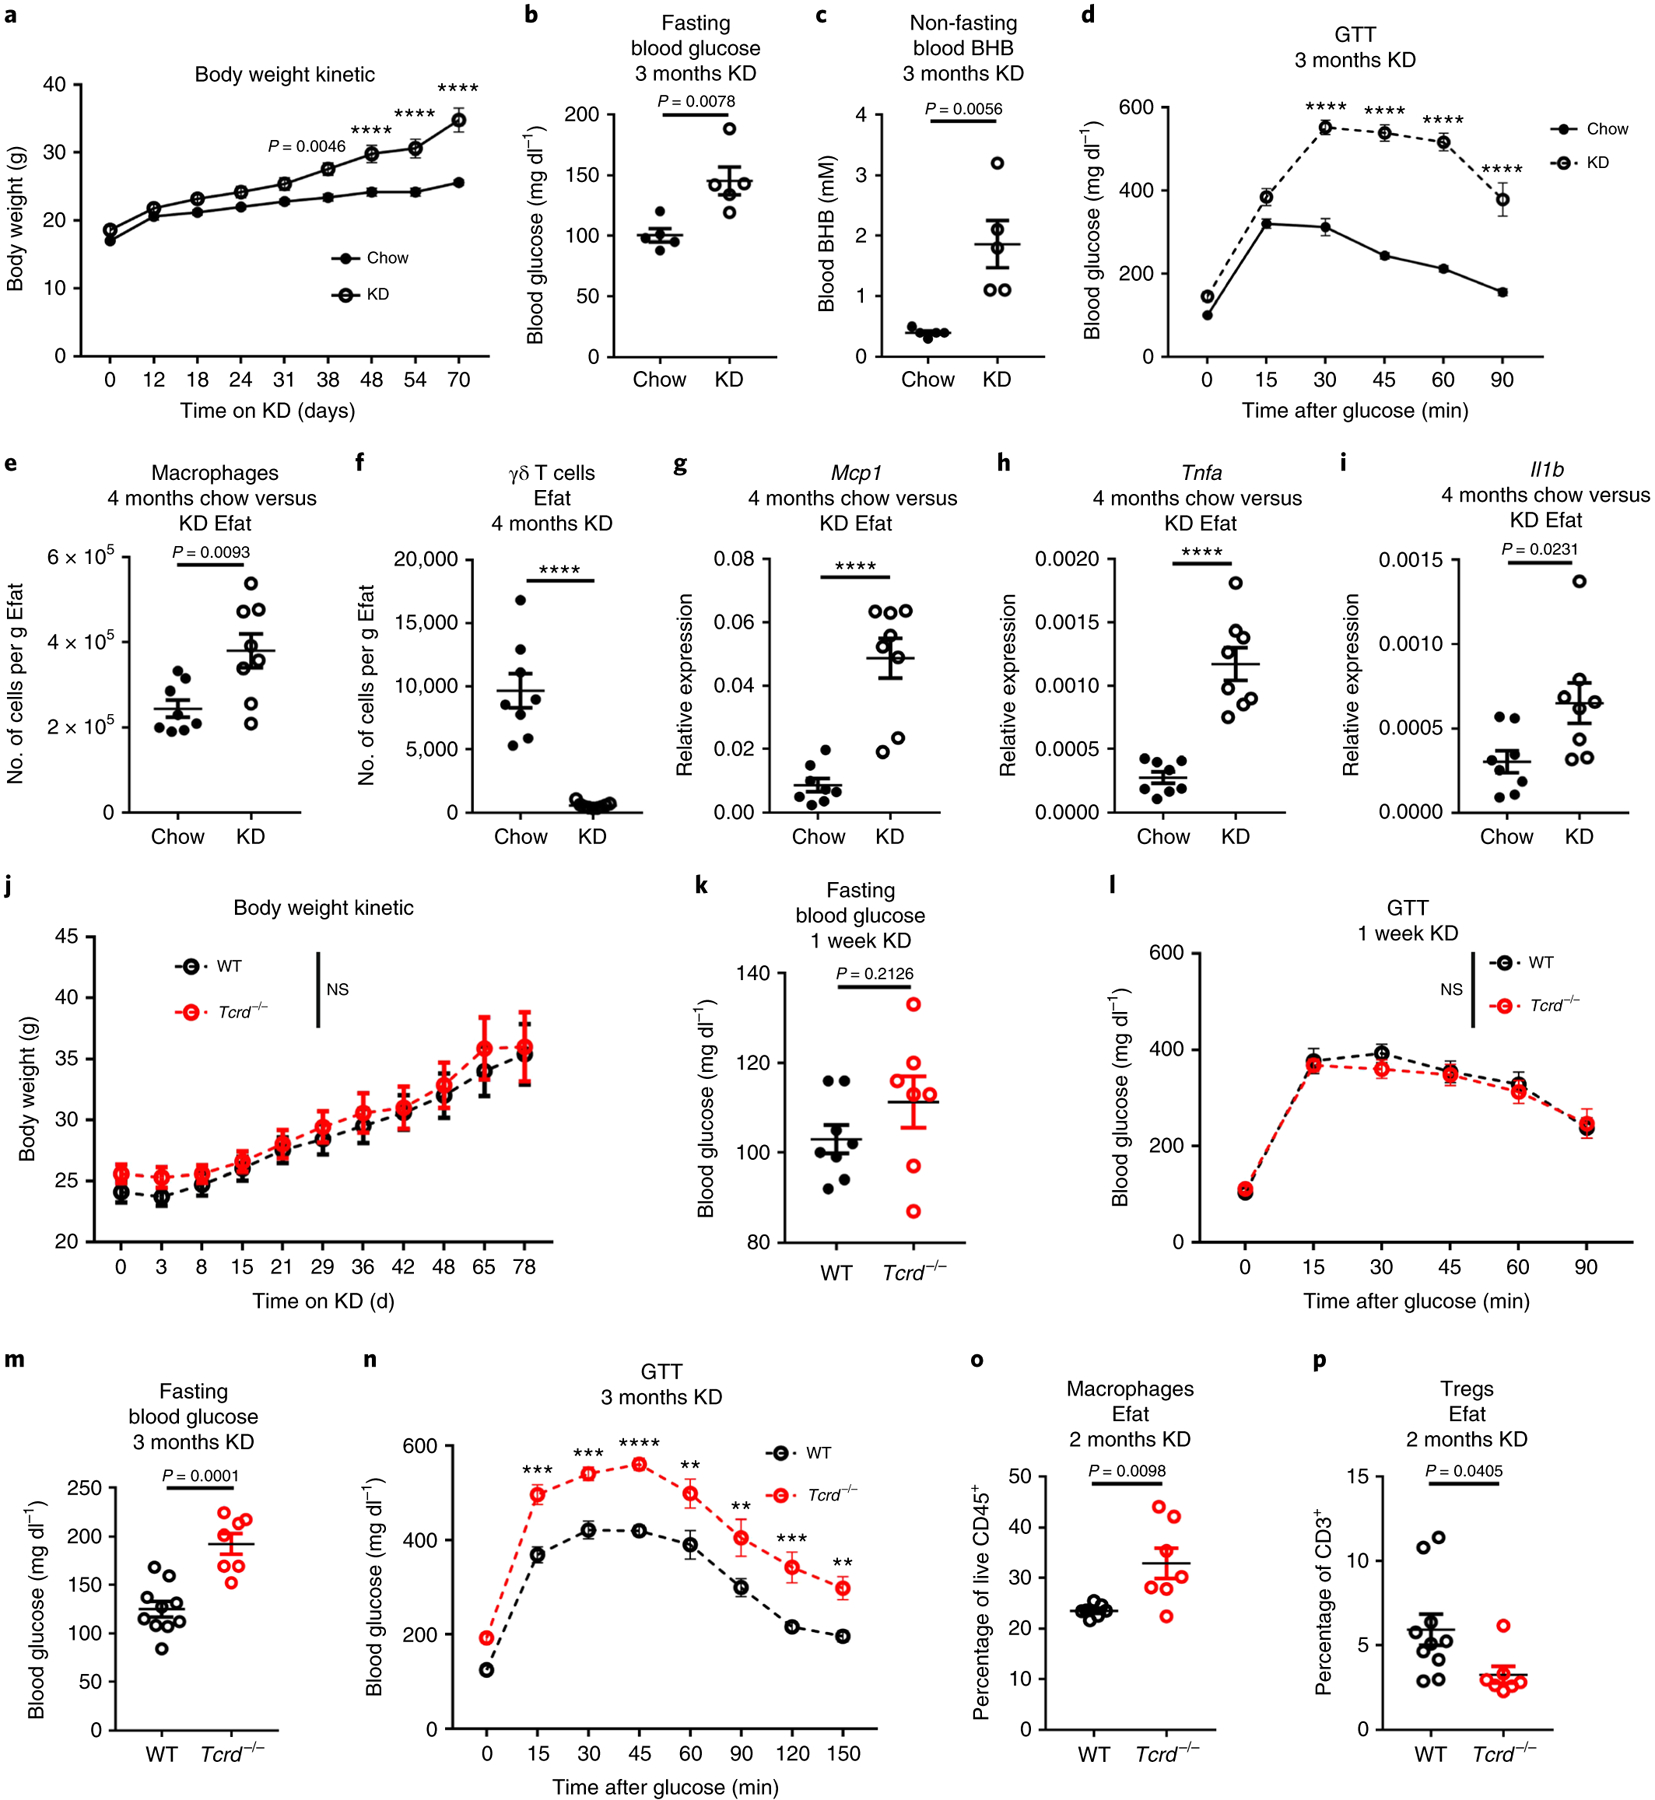
a–c, Body weight change (a) (n = 5 biological independent mice per group, representative of three independent experiments), fasting blood glucose (b) (n = 5 biological independent mice per group) and non-fasting blood BHB levels (c) (n = 5 biological independent mice per group) after 3 months KD feeding. Statistical differences were calculated by paired two-way ANOVA (a) and unpaired two-tailed t-tests (b,c). d, Glucose tolerance test after 3 months of chow versus KD feeding (n = 5 biological independent mice per group, representative of three independent experiments). Statistical differences were calculated by paired two-way ANOVA. e,f, Macrophage (e) and γδ T cell quantification (f) in epidydimal adipose tissue after 4 months KD. Statistical differences were calculated by unpaired two-tailed t-test. g–i, Inflammatory gene expression in whole epidydimal adipose tissue for Mcp1 (g), Tnfa (h) and Il1b (i) for 4 months chow versus KD Efat. Statistical differences were calculated by unpaired two-tailed t-test. Analysis in e–i is based on groups of n = 8 chow and n = 9 KD-fed mice and are representative of two independent experiments. j, Body weight change in WT (n = 10) versus Tcrd−/− (n = 7) mice during long-term KD feeding. Statistical differences were calculated by paired two-way ANOVA; NS, not significant two-way ANOVA P = 0.6124 for genotype considered as source of variation. Data are representative of three independent experiments. k,l, Fasting blood glucose (k) and glucose tolerance test (l) after 1 week KD feeding in WT (n = 8) versus Tcrd−/− (n = 7) mice. Statistical differences were calculated by unpaired two-tailed t-test (k) and paired two-way ANOVA (l). NS, not significant two-way ANOVA P = 0.7613 when genotype considered source of variation. m,n, Fasting blood glucose (m) and glucose tolerance test (n) after 3 months KD feeding in WT (n = 10) versus Tcrd−/− (n = 7) mice. Statistical differences were calculated by unpaired two-tailed t-test (m) and paired two-way ANOVA (n). Data are representative of three independent experiments. o,p, Quantification of macrophages (o) (n = 7 WT and n = 7 Tcrd−/−) and Tregcells (p) (n = 10 WT and n = 7 Tcrd−/−) after 2 months KD feeding in WT and Tcrd−/− mice. Statistical differences were calculated by unpaired two-tailed t-tests. All data are represented as mean ± s.e.m. and each symbol represents an individual mouse. Exact P values are shown whenever possible, **P < 0.01,**P < 0.001,****P < 0.0001.
Glycaemia is further impaired by chronic KD feeding in mice lacking γδ T cells.
The enrichment of extracellular matrix pathways in adipose γδ T cells (Fig. 5d,e) suggested that γδ T cells in visceral adipose tissue are activated by KD and might have important roles in adipose tissue remodelling and homeostasis. To test this hypothesis, we fed KD to both wild-type (WT) and Tcrd−/− mice, which lack γδ T cells. Both WT and Tcrd−/− mice gain weight similarly during KD feeding (Fig. 6j) and had similar body fat and lean mass composition (Extended Data Fig. 7a,b). Although Tcrd−/− mice tended to have slightly elevated fasting blood glucose after 1 week of KD (Fig. 6k) their overall glycaemic control was not compromised (Fig. 6l). However, after prolonged KD feeding (2–3 months) Tcrd−/− mice had significantly higher fasting blood glucose (Fig. 6m), further impaired glucose tolerance (Fig. 6n), but unremarkable changes in insulin sensitivity (Extended Data Fig. 7c,d) compared to WT mice on long-term KD feeding. Moreover, we noted increased macrophages in the adipose tissue of γδ T cell-deficient mice (Fig. 6o). It was previously reported that γδ T cells help recruit Tregcells to adipose tissue27. Indeed, Tcrd−/− mice also had fewer Tregcells in visceral adipose (Fig. 6p), which is associated with increased inflammation and metabolic dysregulation35. Tcrd−/− mice also contained increased proportion of adipose tissue B cells but all other aspects of their adipose immune compartment were similar to WT mice (Extended Data Fig. 7e,f), thus supporting a hypothesis that γδ T cells are an important orchestrator of protective adipose tissue remodelling and homeostasis.
Discussion
The acute metabolic benefits of KD are well-documented. The prevailing dogma is that KD activates a metabolic switch from glucose metabolism towards fatty acid oxidation, engaging mitochondrial metabolic programming. This metabolic state is associated with numerous health benefits including extended longevity and reduced inflammation. Accordingly, KD is reported to extend lifespan in mice20,21 and BHB increases lifespan in Caenorhabditis elegans36. BHB itself has potent signalling capabilities, including HDAC inhibition3, posttranslational β-hydroxybutyrlation modifications on lysine residues37 and biophysical inhibition of NLRP3 inflammasome assembly4,17, which are independent of metabolic changes during KD feeding. There are therefore numerous mechanisms through which KD might influence metabolic health and overall physiology.
While KD has gained public popularity for promoting weight loss, our data also clearly indicate that in mouse models increased fat storage is simultaneously induced as early as 1 week after initiating KD feeding. This upregulation of fat accumulation ultimately leads to obesity and loss of glycaemic regulation after several months of ad libitum KD feeding in mice. Our findings are in agreement with a previous report that long-term KD caused hepatic lipid accumulation and glucose intolerance20,38,39, although these authors did not observe weight gain in their mice. Our findings are in contrast with those from another study that reported stable weight loss with increased energy expenditure after 12 weeks of KD feeding25. This difference in body weight may have occurred because the KD diets used in these studies contained only 4.5% of calories from protein whereas ours contained 10.4%. Recent studies in which humans were fed isocaloric KD for 4 weeks in an inpatient environment showed that switching to KD actually increased C-reactive protein and that baseline weight changes influenced glucose parameters40. Thus, further controlled clinical studies are needed to fully dissect the effects of KD on adiposity and inflammation.
Given our previous findings that KD inhibits NLRP3 activation4,17 and that NLRP3 is an important driver of obesity-related inflammation16 we were surprised to find such dramatic obesity and glycaemic dysregulation in KD-fed mice. Although KD-induced weight gain had been previously reported20 and is due to excess caloric intake21, these experiments were performed in middle-aged and old mice (12+ months), which have impaired ketogenesis compared to young mice41. The simultaneous induction of divergent metabolic processes such as fat breakdown occurring in the presence of increased fat storage is of high physiological importance and deserves further scientific attention. Additionally, what determines how different cells respond to a given metabolic manipulation, even in the same tissue, has important systemic implications that are not currently understood. These open questions are particularly relevant given the recent findings that BHB can be produced from non-canonical sources such as adipocytes42 and intestinal stem cells43 to regulate local biological functions and that macrophages use acetoacetate to protect against liver fibrosis24.
γδ T cells are a unique subset of T cells that rely on T cell receptor (TCR) signals for development, but, in contrast to αβ T cells, not all γδ T cells require TCR activation in the periphery44. Instead, γδ T cells express cytokine receptors and pattern recognition receptors that stimulate rapid activation and secretion of cytokines. These innate-like T cells are most well known for their antimicrobial functions in barrier tissues including skin, lung and intestine45,46. In contrast, homeostatic roles of γδ T cells, especially in adipose tissue, are less-studied. Although comprising only a small percentage of the tissue-resident immune cells in visceral adipose (~5% of live CD45+ cells), they are almost exclusively tissue-resident with >95% of γδ T cells remaining resident and non-circulating. This level of residence in adipose tissue is higher than more canonical adipose-resident cells such as macrophages, which have long been regarded as regulators of tissue homeostasis and inflammation in lean versus obese states. Contradictory findings in high-fat-diet-induced obesity have indicated both protective27 and deleterious47,48 functions of γδ T cells in visceral adipose tissue. In an unbiased single-cell sequencing experiment, we discovered that KD-induced expansion of γδ T cells in visceral adipose tissue. Expansion of these cells was accompanied by transcriptional programming changes associated with enrichment of tissue-reparative pathway signatures that suggested to us γδ T cells have important homeostatic functions in response to KD feeding intended to protect adipose integrity. Accordingly, when Tcrd−/− mice lacking all γδ T cells were fed KD for several months they had worse metabolic responses than WT γδ T cell-sufficient mice. Tcrd−/− mice did not exhibit metabolic defects in response to KD after only 1 week of feeding, indicating that γδ T cells are not required for the acute metabolic benefits of KD. Rather, long-term KD feeding was required to reveal the functional importance of γδ T cells in visceral adipose tissue. It is likely that γδ T cells interact with other adipose-resident cells to coordinate their homeostatic and protective responses and their loss in obese adipose tissue suggests they become outcompeted and may be reciprocally regulated with macrophages, which increase in obese adipose tissue. Notably, besides decreased Tregcells, there were no differences in other cells implicated in adipose tissue metabolic regulation, such as ILC2 and eosinophils. Together, these findings highlight the importance of the interactions between γδ T cells and Tregcells, an interaction that has previously been highlighted for thermogenic regulation27, for maintaining adipose tissue integrity in response to long-term metabolic insult of extremely high-fat feeding.
It is not clear how the γδ T cells become activated in response to KD. It is possible they respond to the adipose tissue environmental stress during KD feeding. Whether these activating signals come from the adipose tissue itself, perhaps due to physiological changes during increased fat storage or increased lipolysis, or whether they respond to cytokines secreted by other adipose-resident immune cells remains to be determined. It should be noted that in contrast to our current work, a previous study using standard high-fat-diet-induced obesity showed that γδ T cells contribute to visceral adipose tissue inflammation47. The different diet compositions and metabolic programs induced by KD versus high-fat diet may be important for instructing tissue-protective immune responses, and it will be interesting to further explore these potential differences. Given that KD and BHB have systemic effects beyond the adipose tissue, future studies investigating these effects and how or whether γδ T cells are influenced in those tissues should be pursued. The presence of γδ T cells is among the strongest predictors of positive outcome in cancer49. Thus, the approaches for expansion of γδ T cells in immunotherapy are considered to confer enhanced cancer protection. Accordingly, both KD and γδ T cells are being independently explored for potential anti-cancer effects (several trials currently recruiting on www.clinicaltrials.gov); whether KD-induced γδ T cell expansion effects could synergize in cancer models warrants consideration. In conclusion, our data highlight that ketogenesis induces expansion of tissue-protective γδ T cells in adipose tissue during metabolic stress.
Methods
Mice.
All mice were on the C57BL/6J (B6) genetic background. B6 and Tcrd−/− mice (stock no. 002120) were purchased from Jackson Laboratories and breeding was maintained in the Dixit laboratory. Tcrd-CreER+R26-ZsGreen/+-Foxp3-RFP/+ mouse adipose tissue was generously provided by Y. Zhuang50. It should be noted that no RFP+ cells were detected by whole-mount tissue microscopy. Fgf21−/− mice were generously provided by S.A. Kliewer (UTSW) and Nlrp3−/− mice have been described previously51. For long-term feeding studies, B6 and Tcrd−/− mice were crossed to generate F1 heterozygous mice that were crossed for generating littermate cohorts of B6 and Tcrd−/− mouse cohorts, which were cohoused for the duration of the studies. Standard vivarium chow (Harlan 2018S; 58% of calories from carbohydrate, 24% of calories from protein, 18% of calories from fat, 3.1 kcal g−1) and KD (Research diets D12369B; 0.1% of calories from carbohydrate, 10.4% of calories from protein, 89.5% of calories from fat, 6.76 kcal g−1) were both provided ad libitum. Of note, the amount of protein in each diet, by weight, is similar (Supplementary Table 2). Mice were randomly assigned to experimental diet groups between 7 and 12 weeks of age. Body composition was measured in vivo by magnetic resonance imaging (EchoMRI, Echo Medical Systems). All tissue collections were performed between 07:00 and 10:00 (Zeitgeiber ZT0–3). Mice were housed under standard 12 h light/dark cycles. Blinding of investigators to diet group was not possible due to obvious visible differences between diets, but groups (diet, genotype) were deidentified for data analysis to blind investigators to this portion of each experiment. All animal procedures were approved by the Yale Institutional Animal Care and Use Committee.
Parabiosis.
Male mice were used for parabiosis experiments. Mice were weight-matched and cohoused as pairs for 2 weeks before surgery. Surgeries were performed under an isoflurane inhalation ventilator. Absorbable sutures were used to join the olecranon and stifle of each mouse to that of its partner. The skin from each mouse was then joined to that of its parabiont with absorbable sutures. Surgeries were performed on thermal warming pads, and mice were provided saline (1 ml, subcutaneous (s.c.)), meloxicam (1 mg kg−1 s.c. every 24 h for 3 d) and buprenorphine (0.05 mg kg−1 s.c. twice per day for 1 d).
Glucose tolerance tests.
Mice were fasted 16 h before glucose tolerance tests. Glucose was given by intraperitoneal injection on the basis of body weight (0.4 g kg−1) and blood glucose levels were measured by handheld glucometer. Blood BHB concentrations were measured in the morning between 08:00 and 10:00 (ZT1–3) using Precision Xtra Ketone strips in whole blood.
Flow cytometry.
Intravascular labelling was performed by i.v. injection of 2.5 μg CD45.2-FITC diluted in 100 μl PBS. Mice were euthanized exactly 3 min after injection for tissue collection. Adipose tissue was digested in HBSS+ 1 mg ml−1 Collagenase I in a shaking 37 °C water bath. For intracellular cytokine staining cells were stimulated at 37 °C with phorbol 12-myristate 13-acetate (PMA, 10 ng ml−1, Sigma) + ionomycin (1 μM, Sigma) for 4 h and protein transport inhibitor (eBioscience) was added for the last 3 h of stimulation. Cells were stained with live/dead viability dye (Invitrogen) and then for surface markers including CD45, CD3, B220, γδ TCR, CD4, CD8, NK1.1, CD11b, F4/80, Ly6G and Siglec F. All antibodies were purchased from eBioscience or Biolegend and are described in detail in the Reporting Summary. When needed, intracellular staining for Foxp3 was performed using the eBioscience Fix/Perm nuclear staining kit and IL-17 staining was performed using the BD Fix/Perm kit, otherwise cells were fixed in 2% PFA. Samples were acquired on a custom LSR II and data was analysed in FlowJo. For cell sorting on BD FACSAria, samples were stained with live/dead, CD45, CD3, γδ TCR and a dump channel to exclude CD4, CD8 and CD11b. Representative gating strategies are shown in Extended Data Fig. 8.
Adipose tissue microscopy.
Epidydimal adipose tissue was imaged by two-photon microscopy from Cre− mTmG mice after i.v. labelling with anti-CD45.2-A488. Because these mice do not express Cre all cells are labelled with membrane-bound Tomato red fluorescent protein. An upright, laser scanning two-photon LaVision Biotec TriMScope (LaVision Biotec) microscope was used to collect mosaic images (3 × 3) at a depth of 80 μm with z-steps of 5 μm. Images were stitched in Fiji52,53 and represented as maximum intensity projection. Seven-week-old Tcrd-CreER+ R26-ZsGreen+ female mice were treated with tamoxifen every other day for 3 d, and endometrial and inguinal adipose tissue was collected 4 weeks later. Adipocytes were stained with LipidTox Far Red (LifeTech, 1:500 for 1 h at room temperature). Images were immediately captured on a Leica SP5 Confocal Microscope.
scRNA-seq.
Male WT mice were fed chow or KD for 1 week. After i.v.-labelling epidydimal white adipose tissue was collected and pooled (1 g of fat used; n = 4 chow mice, n = 3 KD mice) to make a single technical sample for each diet, digested and stained for viability (live/dead Aqua, ThermoFisher) and pan-CD45 to FACS sort live tissue-resident haematopoietic cells. Cells were prepared for single-cell sequencing according to the 10x Genomics protocols. Sequencing was performed on a HiSeq4000. The Cell Ranger Single-Cell Software Suite (v.2.1.1) (available at https://support.10xgenomics.com/single-cell-gene-expression/software/pipelines/latest/what-is-cell-ranger) was used to perform sample demultiplexing, barcode processing and single-cell 3′ counting. Cellranger mkfastq was used to demultiplex raw base call files from the HiSeq4000 sequencer into sample-specific fastq files. Subsequently, fastq files for each sample were processed with cellranger counts to align reads to the mouse reference (v.mm10–2.1.0). The default estimated cell count value of 10,000 was used for this experiment. Samples were subsampled to have equal numbers of confidently mapped reads per cell. For the analysis, the R (v.3.4.2) package Seurat (v.2.3)54 was used. Cell Ranger filtered genes by barcode expression matrices were used as analysis inputs. Samples were pooled together using the AddSample function. The fraction of mitochondrial genes was calculated for every cell, and cells with high (>5%) mitochondrial fraction were filtered out. Expression measurements for each cell were normalized by total expression and then scaled to 10,000, after that log normalization was performed (NormalizeData function). Two sources of unwanted variation, unique molecular identifier counts and fraction of mitochondrial reads, were removed with ScaleData function. The most variable genes were detected using the FindVariableGenes function. PCA was run only using these genes. Cells are represented with t-distributed stochastic neighbour embedding (t-SNE) plots. We applied RunTSNE function to normalized data, first using ten PCA components. For clustering, we used function FindClusters that implements shared nearest-neighbour modularity optimization-based clustering algorithm on top ten PCA components using resolution of 0.5. To identify marker genes, FindAllMarkers function was used with likelihood-ratio test for single-cell gene expression. For each cluster, only genes that were expressed in more than 10% of cells with at least 0.1-fold difference (log scale) were considered. For heat-map representation, mean expression of markers inside each cluster was used. To obtain differential expression between clusters, MAST test was performed and P value adjustment was done using the Bonferroni correction55. Only genes that were expressed in more than 10% of cells in cluster were considered. Violin plots with overlaid box plots were used to compare selected gene expression. Lower and upper hinges of the box plots represent the 25th and 75th percentiles. Whiskers extend to the values that are no further than 1.5× the interquartile range (IQR) from either upper or lower hinge. The IQR is the difference between the 75th and 25th percentiles. Box plots were created using the geom_boxplot function in ggplot2 (ref.56). Differential expression of genes in each cluster between chow versus KD was not possible due to detection of highly expressed macrophage genes in multiple lymphoid clusters that showed significant down-regulation due to loss of macrophages in the KD sample (Extended Data Fig. 9a).
Bulk RNA isolation and transcriptome analysis.
γδ T cells were FACS sorted from epidydimal fat and RNA was isolated using a Qiagen RNA isolation kit. RNA was sequenced on a HiSeq2500. The quality of raw reads was assessed with FastQC (https://www.bioinformatics.babraham.ac.uk/projects/fastqc/). Raw reads were mapped to the GENCODE vM9 mouse reference genome57 using STAR aligner58 with the following options: –outFilterMultimapNmax 15 –outFilterMismatchNmax 6 –outSAMstrandField All –outSAMtype BAM SortedByCoordinate –quantMode TranscriptomeSAM. The quality control of mapped reads was performed using in-house scripts that employ Picard tools (http://broadinstitute.github.io/picard/). The list of ribosomal RNA genomic intervals that we used for this quality control was prepared on the basis of UCSC mm10 rRNA annotation file59 and GENCODE primary assembly annotation for vM9 (ref.57). rRNA intervals from these two annotations were combined and merged to obtain the final list of rRNA intervals. These intervals were used for the calculation of the percentage of reads mapped to rRNA genomic loci. Strand specificity of the RNA-seq experiment was determined using an in-house script, on the basis of Picard mapping statistics. Expression quantification was performed using RSEM60. For the assessment of expression of mitochondrial genes, we used all genes annotated on the mitochondrial chromosome in the GENCODE vM9 mouse reference genome57. PCA was performed in R using the top 5,000 genes with the highest mean fragments per kilobase per million values. R-log transformation was applied to the fragments per kilobase per million expression values of the top 5,000 genes before PCA. Heat map of significantly regulated genes (FDR 5%) was generated using Morpheus (https://software.broadinstitute.org/morpheus). Gene differential expression was calculated using DESeq2 (ref.61). Significance threshold was set at FDR < 5% and abs(log2FC) of >0.75. Consistency with the scRNA-seq dataset was taken into consideration when filtering parameters were selected to eliminate noise driven by the low number of input cells (Extended Data Fig. 9b,c). Pathway analysis was done using fgsea (fast GSEA) R-package62 with the minimum of 15 and maximum of 500 genes in a pathway and with 1 million of permutations. For the pathway analysis, we used the Canonical Pathways from the MSigDB C2 pathway set63,64 v.6.1. The elimination of redundant significantly regulated pathways (adjusted P < 0.05) was done using an in-house Python script in the following way. We considered all ordered pairs of pathways, where the first pathway had normalized enrichment score equal to or greater than the second pathway. For each ordered pair of pathways, we analysed the leading gene sets of these pathways. The leading gene sets were obtained using fgsea62. If at least one of the leading gene sets in a pair of pathways had more than 60% of genes in common with the other leading gene set, then we eliminated the second pathway in the pair.
Quantification and statistical analysis.
Statistical differences between groups were calculated by unpaired two-tailed t-tests. For comparing groups over time, mice were individually tracked and groups were compared using paired two-way analysis of variance (ANOVA) with Sidak’s correction for multiple comparisons. For all experiments, P ≤ 0.05 was considered significant.
Extended Data
Extended Data Fig. 1 |. Workflow of single-cell rNAseq analysis.
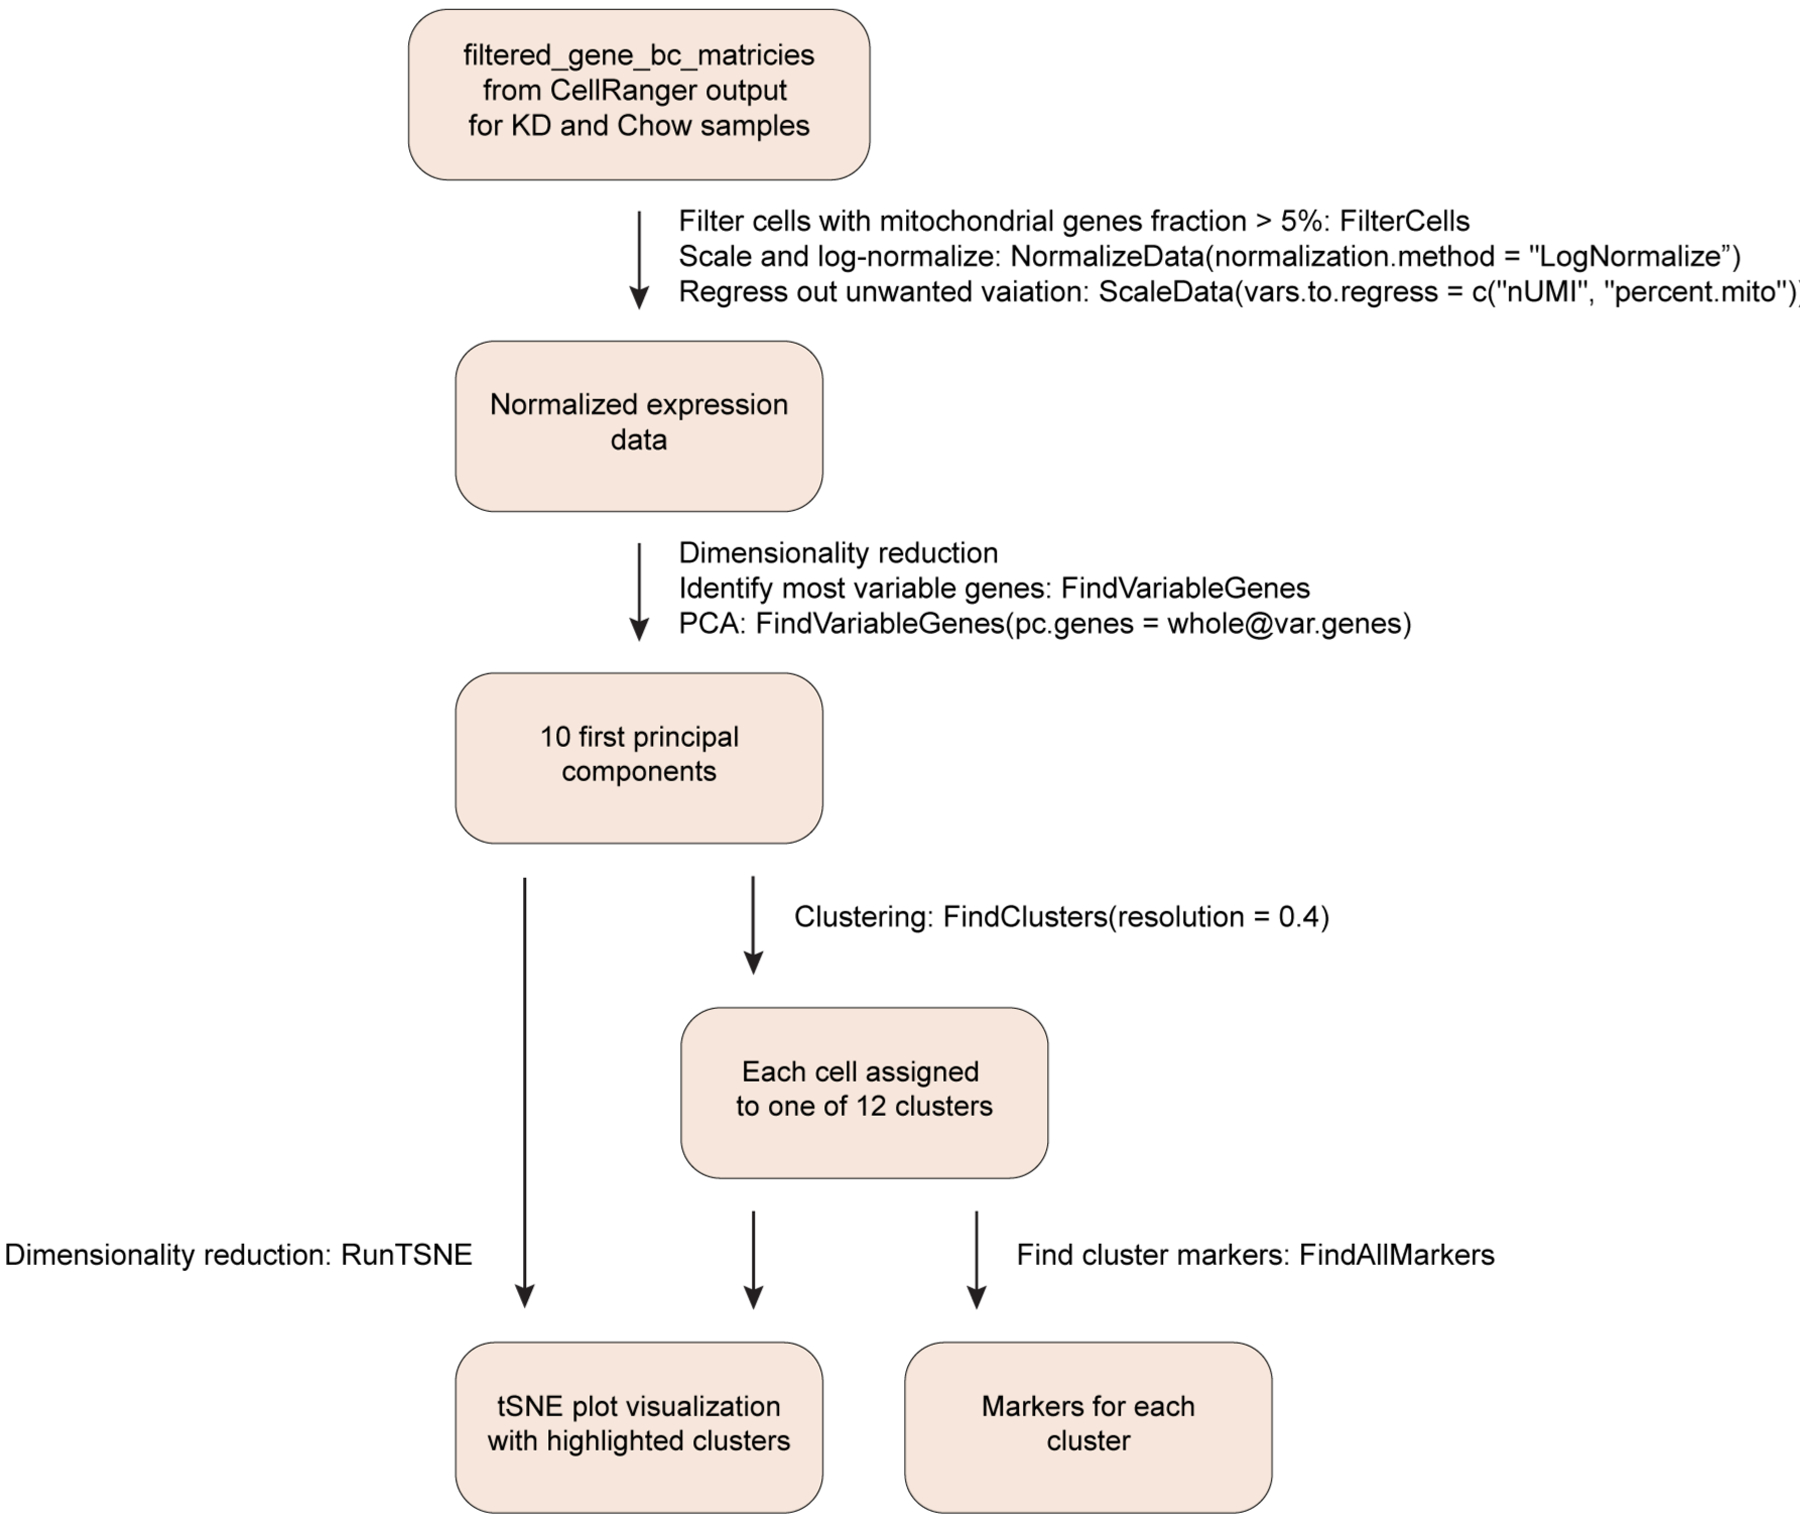
Normalized gene expression from Efat tissue-resident CD45+ cells was used to identify most variable genes for principal component analysis. Data were visualized by tSNE plots. Unique markers were used to identify the cell type/lineage represented within each cluster.
Extended Data Fig. 2 |. Further identification of tissue-resident populations.
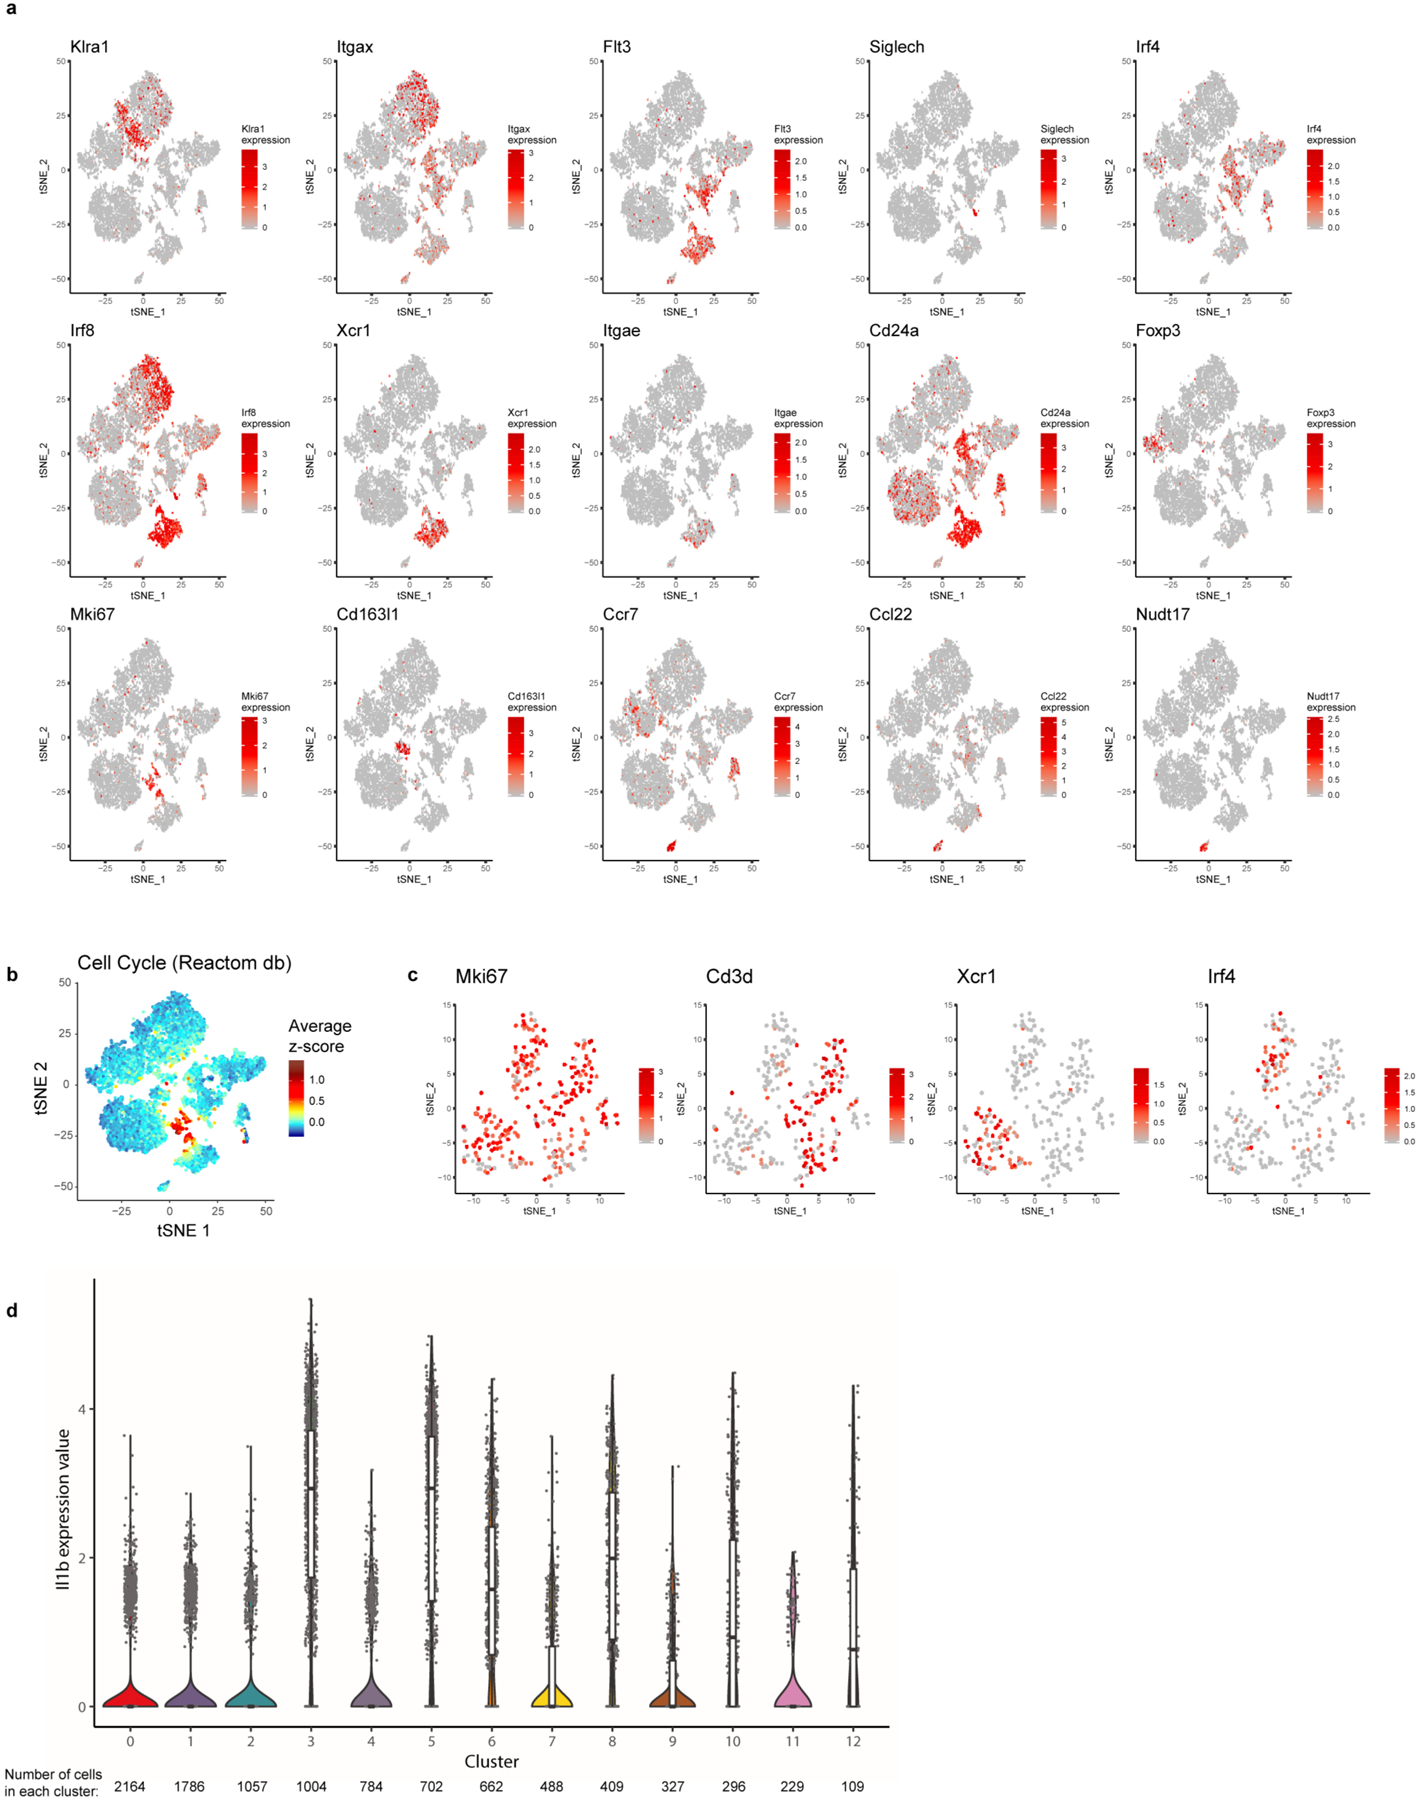
(a) tSNE plot of tissue-resident immune cells from chow- and KD-fed samples merged displaying expression of selected genes. (b) tSNE plot as in S2A showing average z-scores of genes in cell cycle pathway (Reactome database). (c) tSNE plot of proliferating cells only (cluster 10). Expression of selected markers is displayed. For (a-c) expression is based on pooled data from chow and KD samples (each containing n=3 pooled biological samples into 1 technical sample for each diet). (d) Violin plots of Il1b expression within all cells from each cluster. Expression is pooled from chow (n=4 pooled biological samples into 1 technical sample) and KD (n=3 pooled biological samples into 1 technical sample) and total number of cells in each cluster is indicated on the figure. Overlaid box plots indicate median and 25th–75th percentiles; whiskers extend no further than 1.5×IQR from either upper or lower hinge, as described in Materials and Methods.
Extended Data Fig. 3 |. Adipose immune compartment changes induced by 1 week of KD feeding.
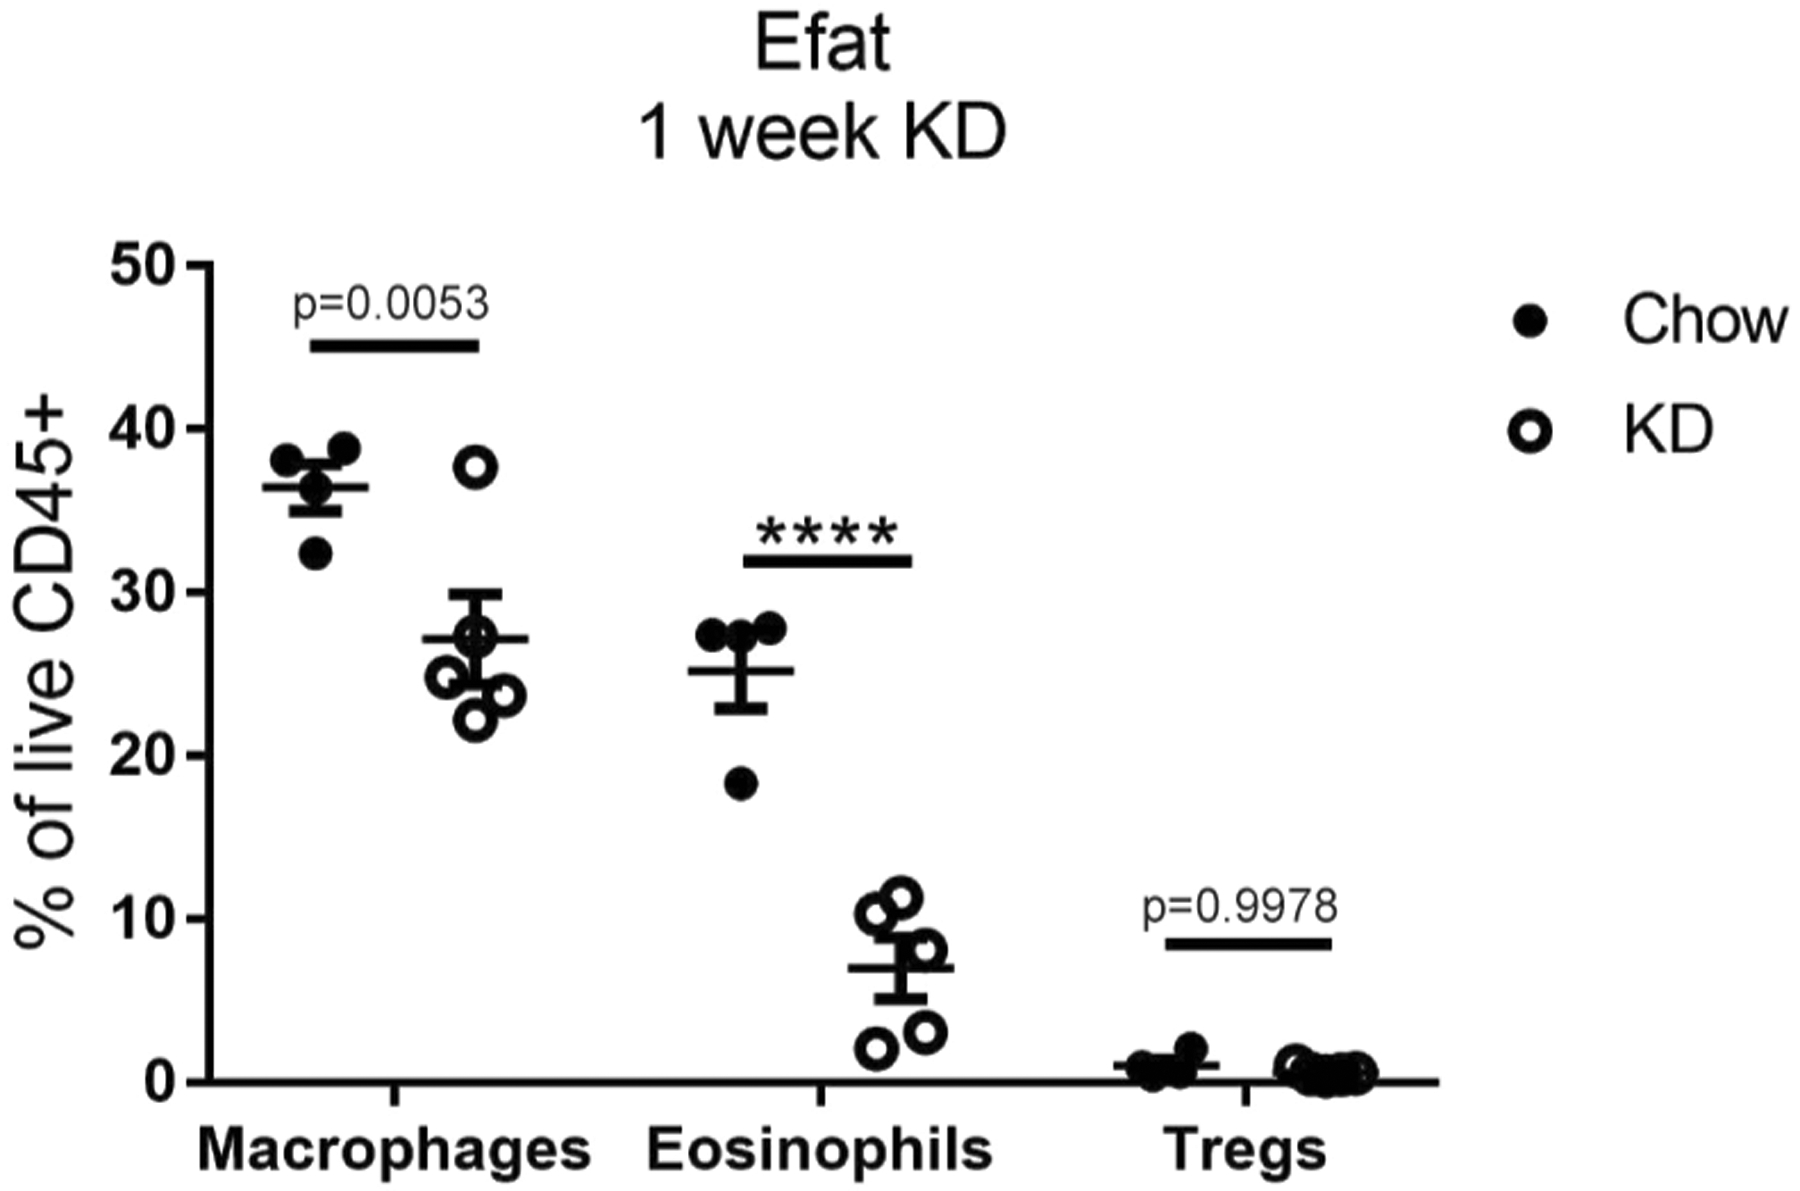
Abundance of macrophages, eosinophils, and Tregs in Efat of chow (n=4) vs KD-fed (n=5) mice. Statistical differences were calculated by 2-way ANOVA with Sidak’s correction for multiple comparisons. Each symbol represents an individual mouse and all data are expressed as mean±SEM. Data are representative of at least 2 independent experiments. Exact p-values are shown whenever possible, ****p<0.0001.
Extended Data Fig. 4 |. γδ T cell expansion induced by KD is independent of NLrP3 and FGF21.
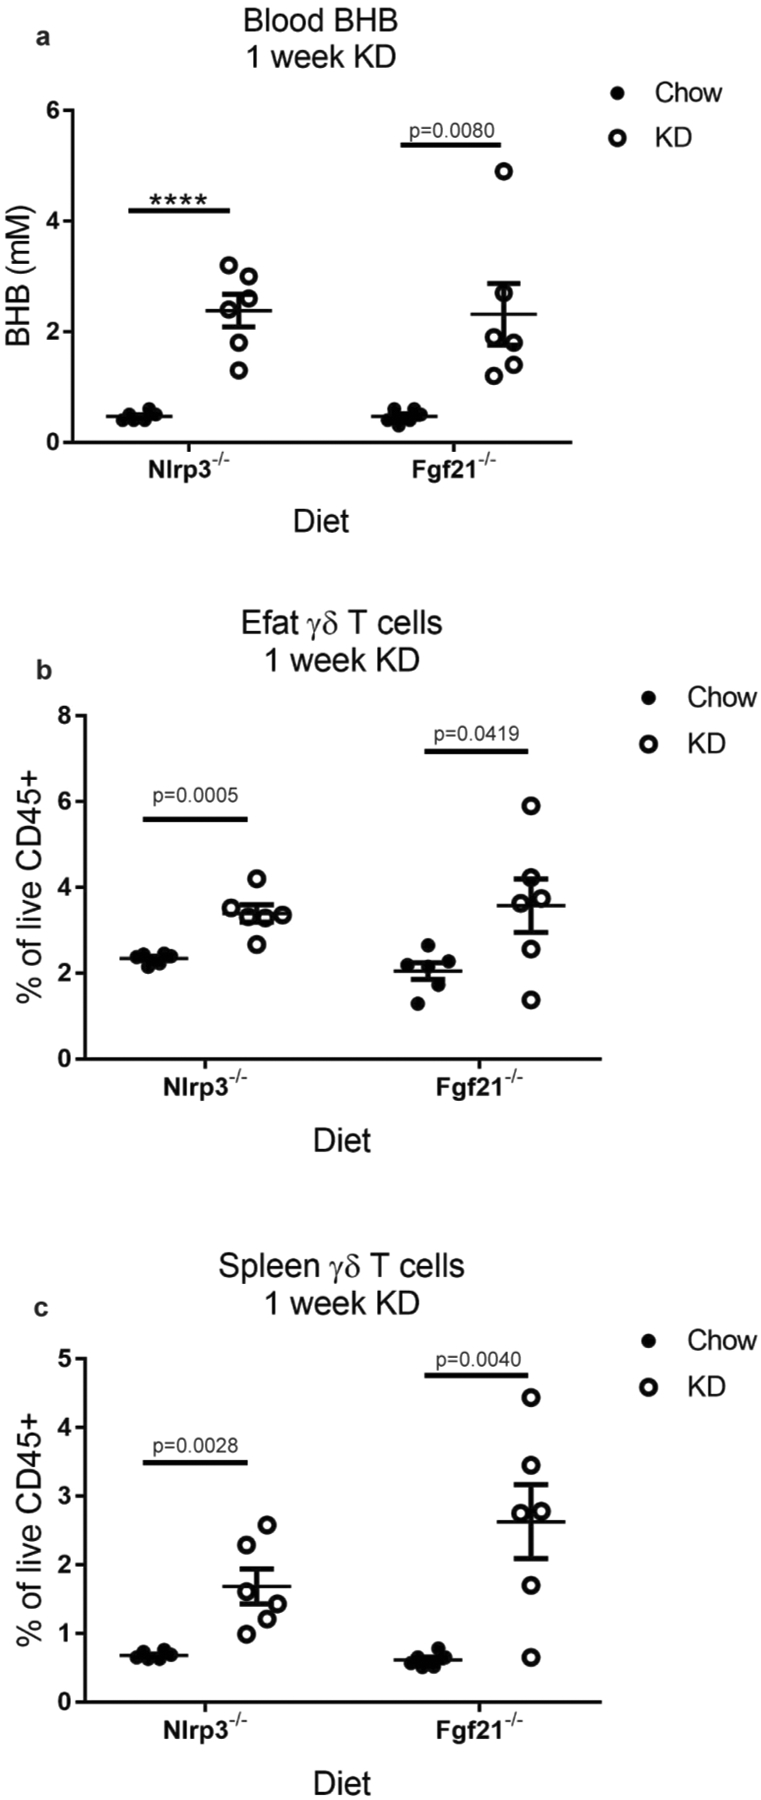
(a) Blood BHB levels, (b) Efat γδ T cells, and (c) spleen γδ T cells in Nlrp3−/− and Fgf21−/− mice after 1 week of KD feeding (n=6 biological independent mice per group). Statistical differences were calculated by unpaired 2-tailed t-tests within each genotype for each graph. All data are represented as mean±SEM and each symbol represents an individual mouse. Exact p-values are shown whenever possible, ****p<0.0001.
Extended Data Fig. 5 |. Workflow of bulk γδ T cell rNAseq analysis.
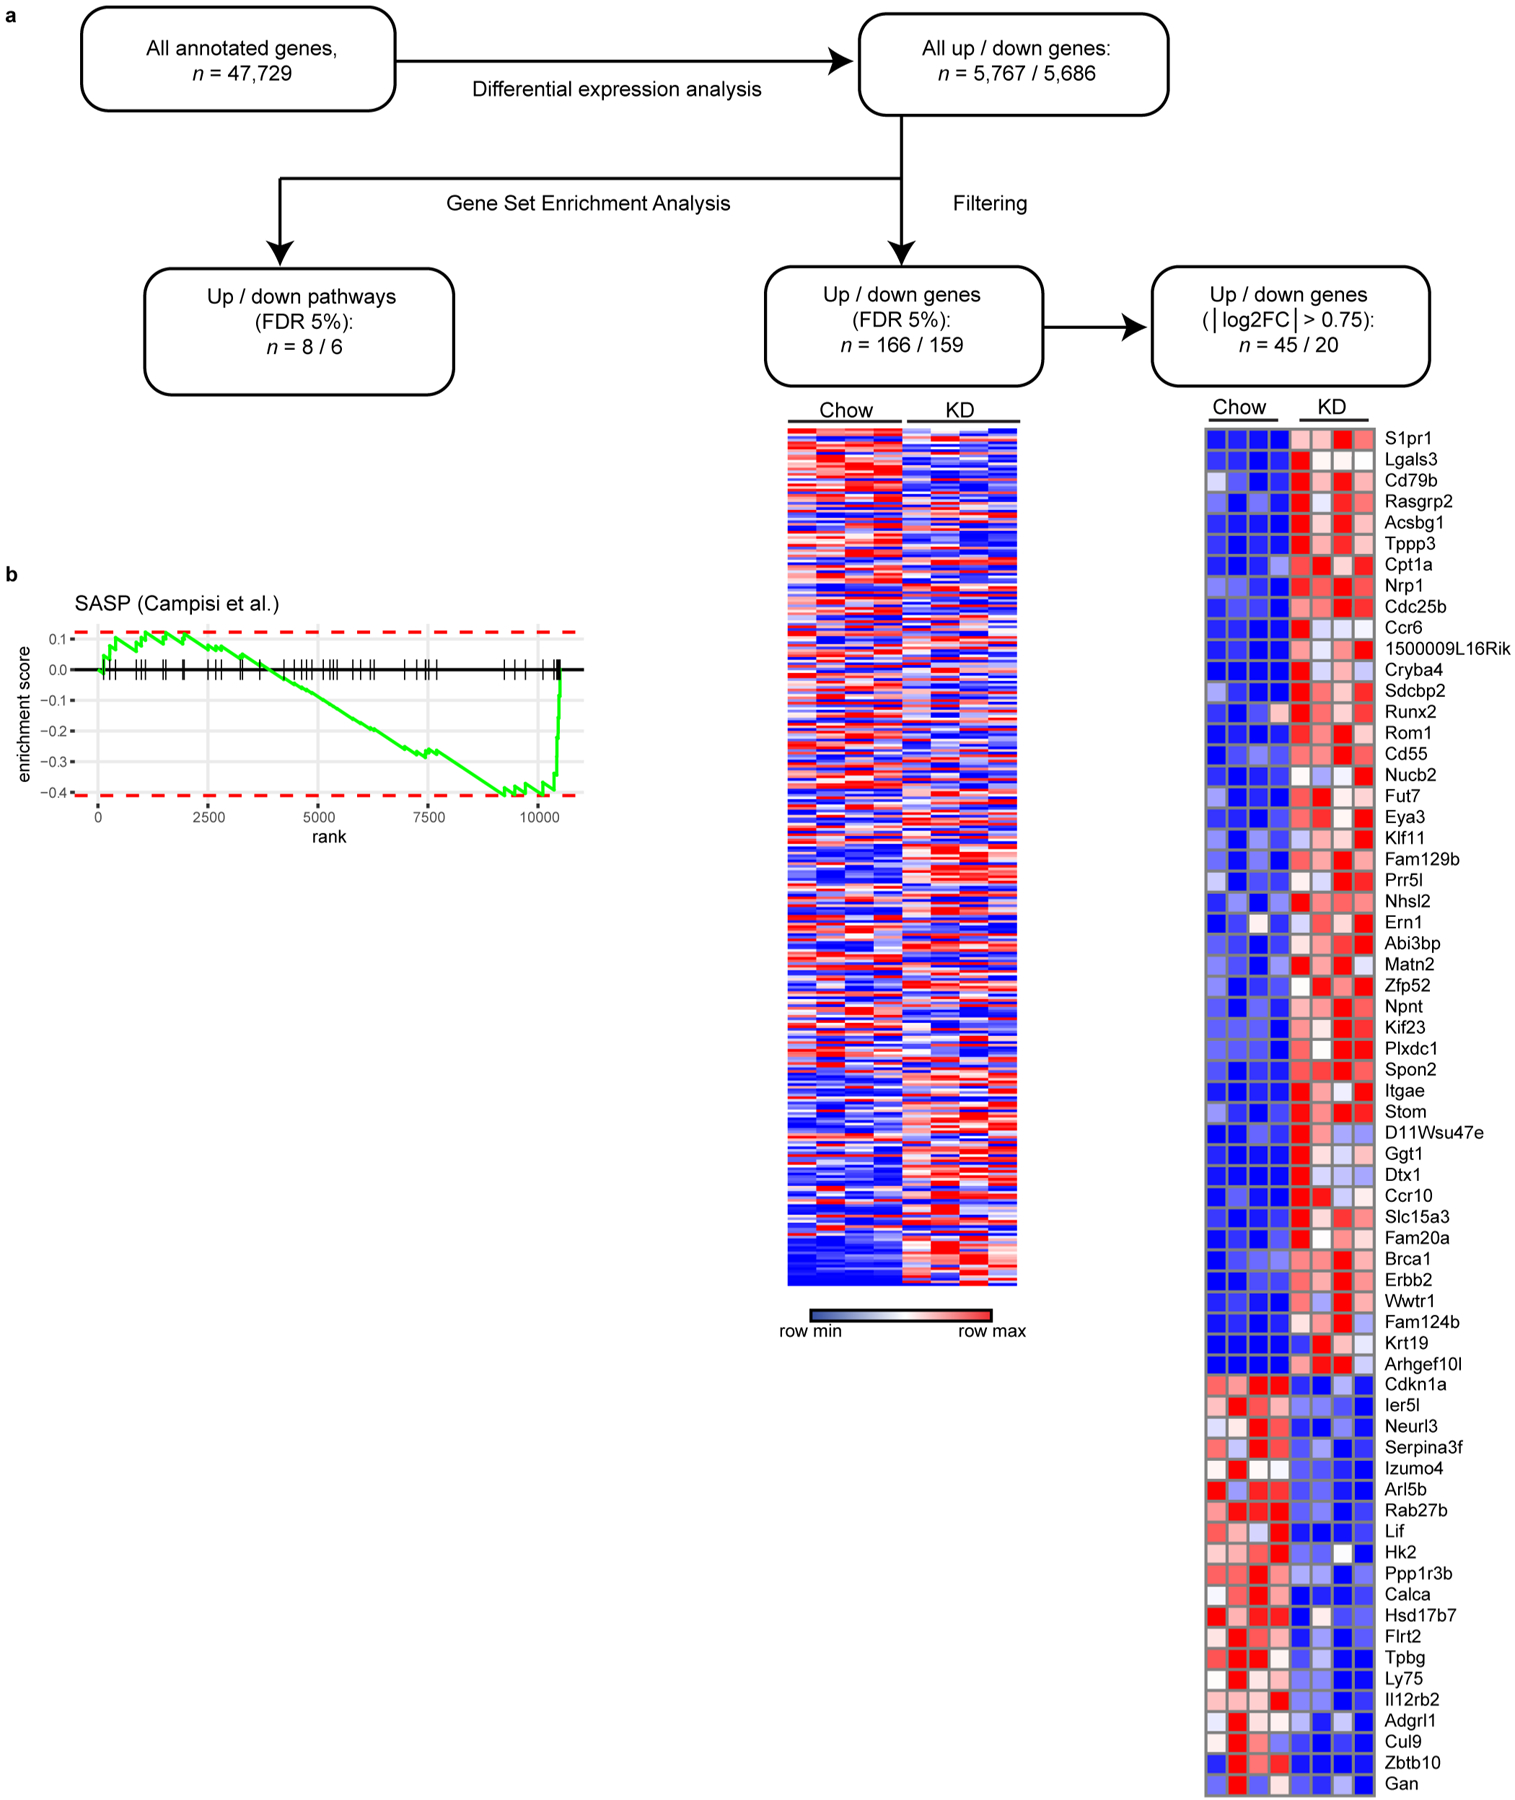
(a) Differentially-expressed genes were identified within all annotated transcribed murine gene loci. From this gene list we performed GSEA to distinguish pathways significantly altered by KD within epididymal adipose tissue γδ T cells. Differential expression gene list was further filtered to identify genes of interest. (b) GSEA enrichment score curve of SASP-related genes.
Extended Data Fig. 6 |. Long term KD feeding causes obesity in mice.
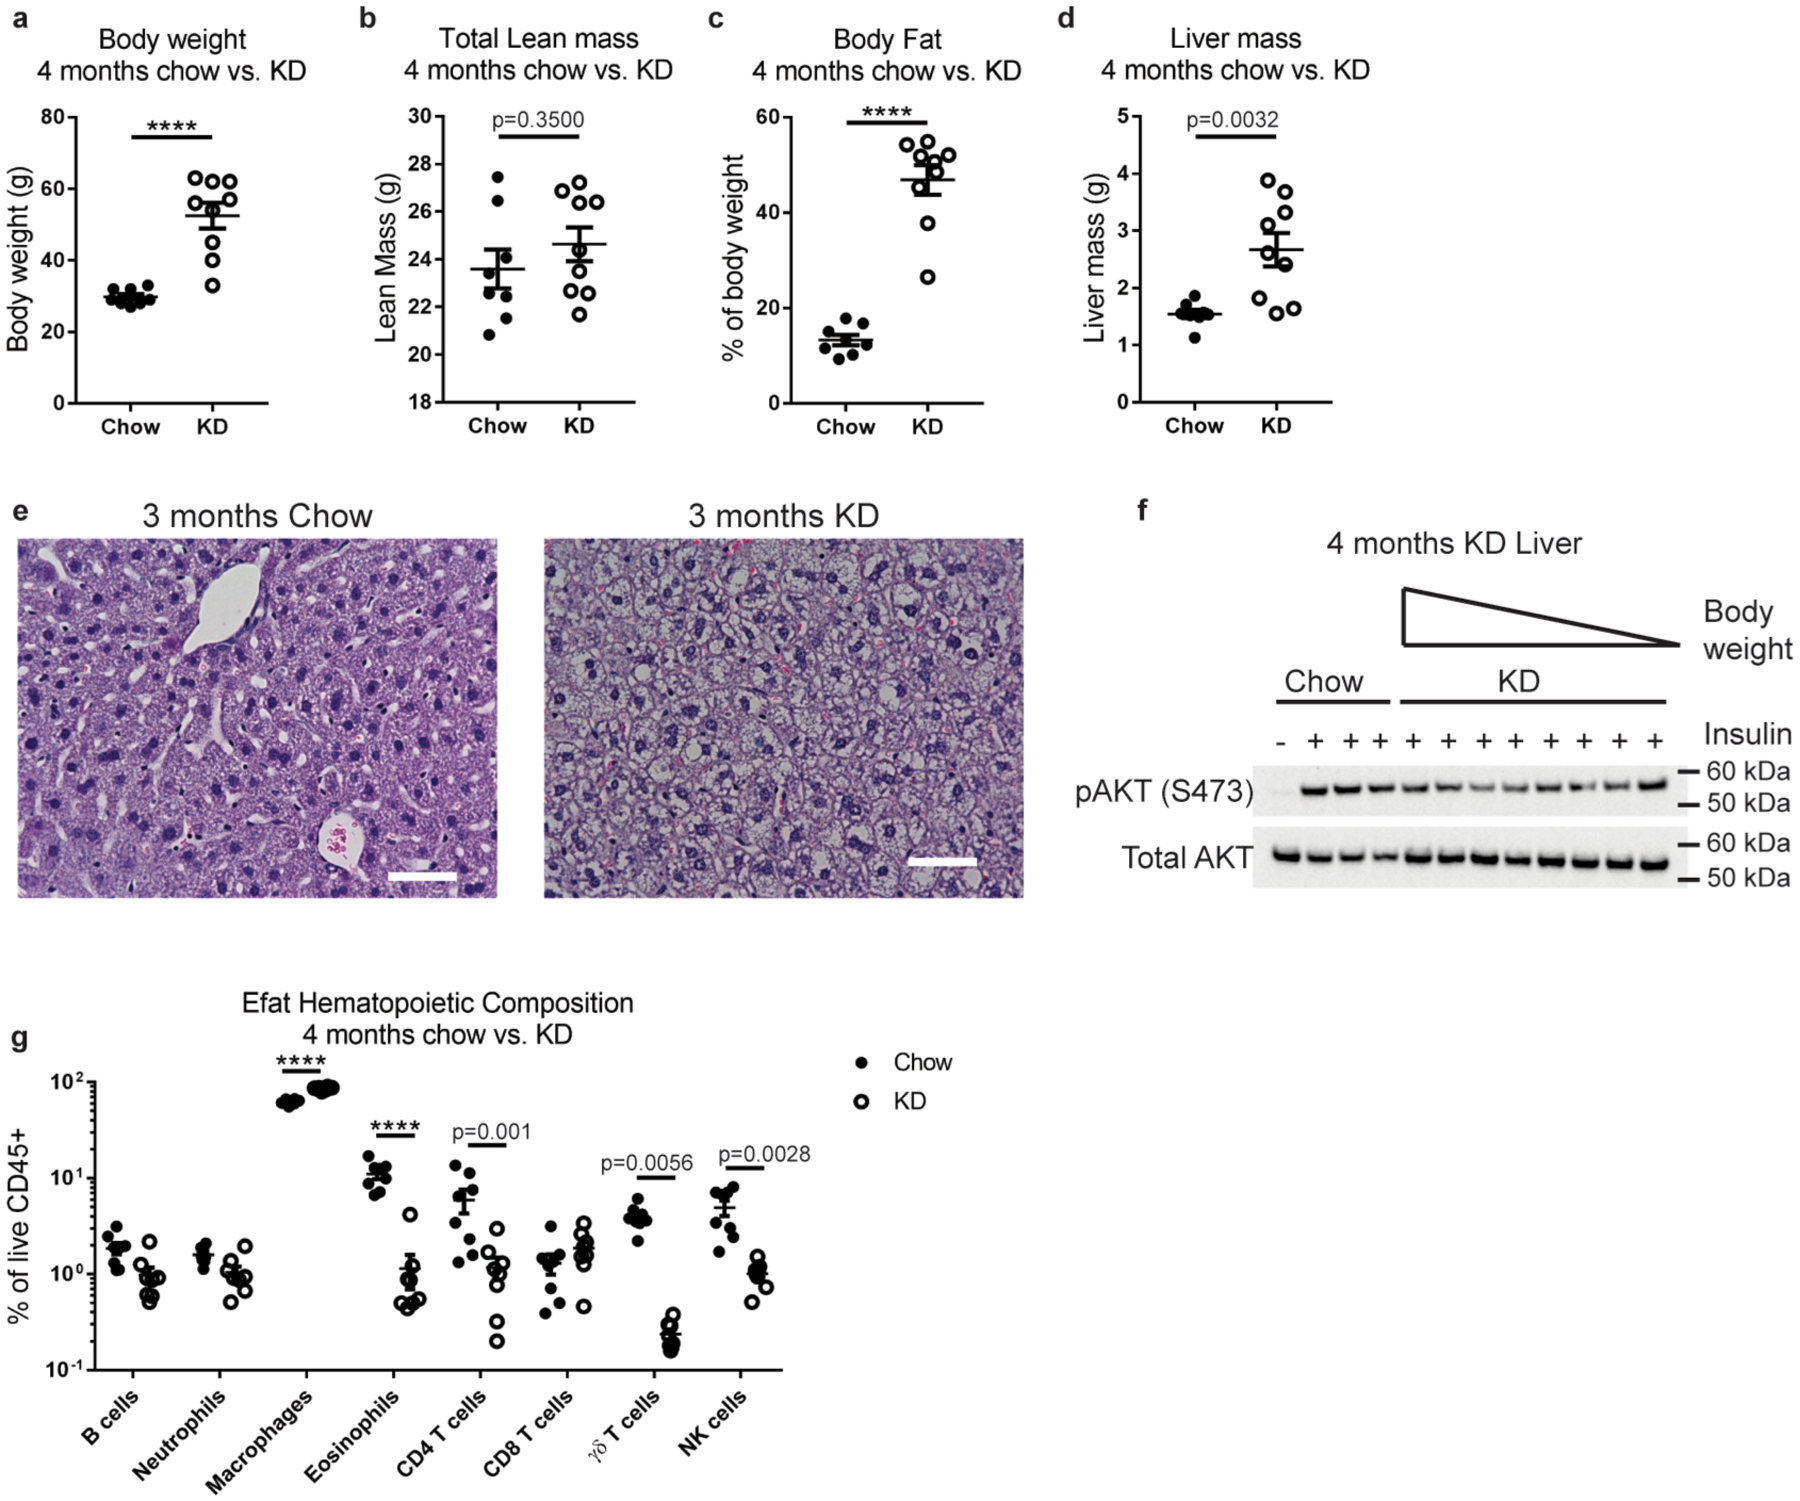
(a) Body weight, (b) lean mass, (c) fat mass, and (d) liver mass were measured in WT mice fed chow (n=8) or KD (n=9) for 4 months. For (a-d) Statistical differences were calculated by unpaired 2-tailed t-tests. Data are representative of 3 independent experiments. (e) Representative H&E-stained liver sections after long-term KD. Sections are representative of 2 independent experiments each with n=5 mice/group. (f) Western blot of liver AKT phosphorylation after insulin injection into fasted mice. Each lane represents an individual mouse. In KD group mice are ordered from greatest to smallest body weight (ranging from 59–37g). (g) Profile of visceral adipose hematopoietic compartment after 4 months chow (n=8) vs KD (n=8) feeding. Statistical differences were calculated by 2-way ANOVA with Sidak’s correction for multiple comparisons. All data are expressed as mean±SEM and each symbol represents an individual mouse. Exact p-values are shown whenever possible, ****p<0.0001.
Extended Data Fig. 7 |. Metabolic profiling of Tcrd−/− mice after long-term KD feeding.
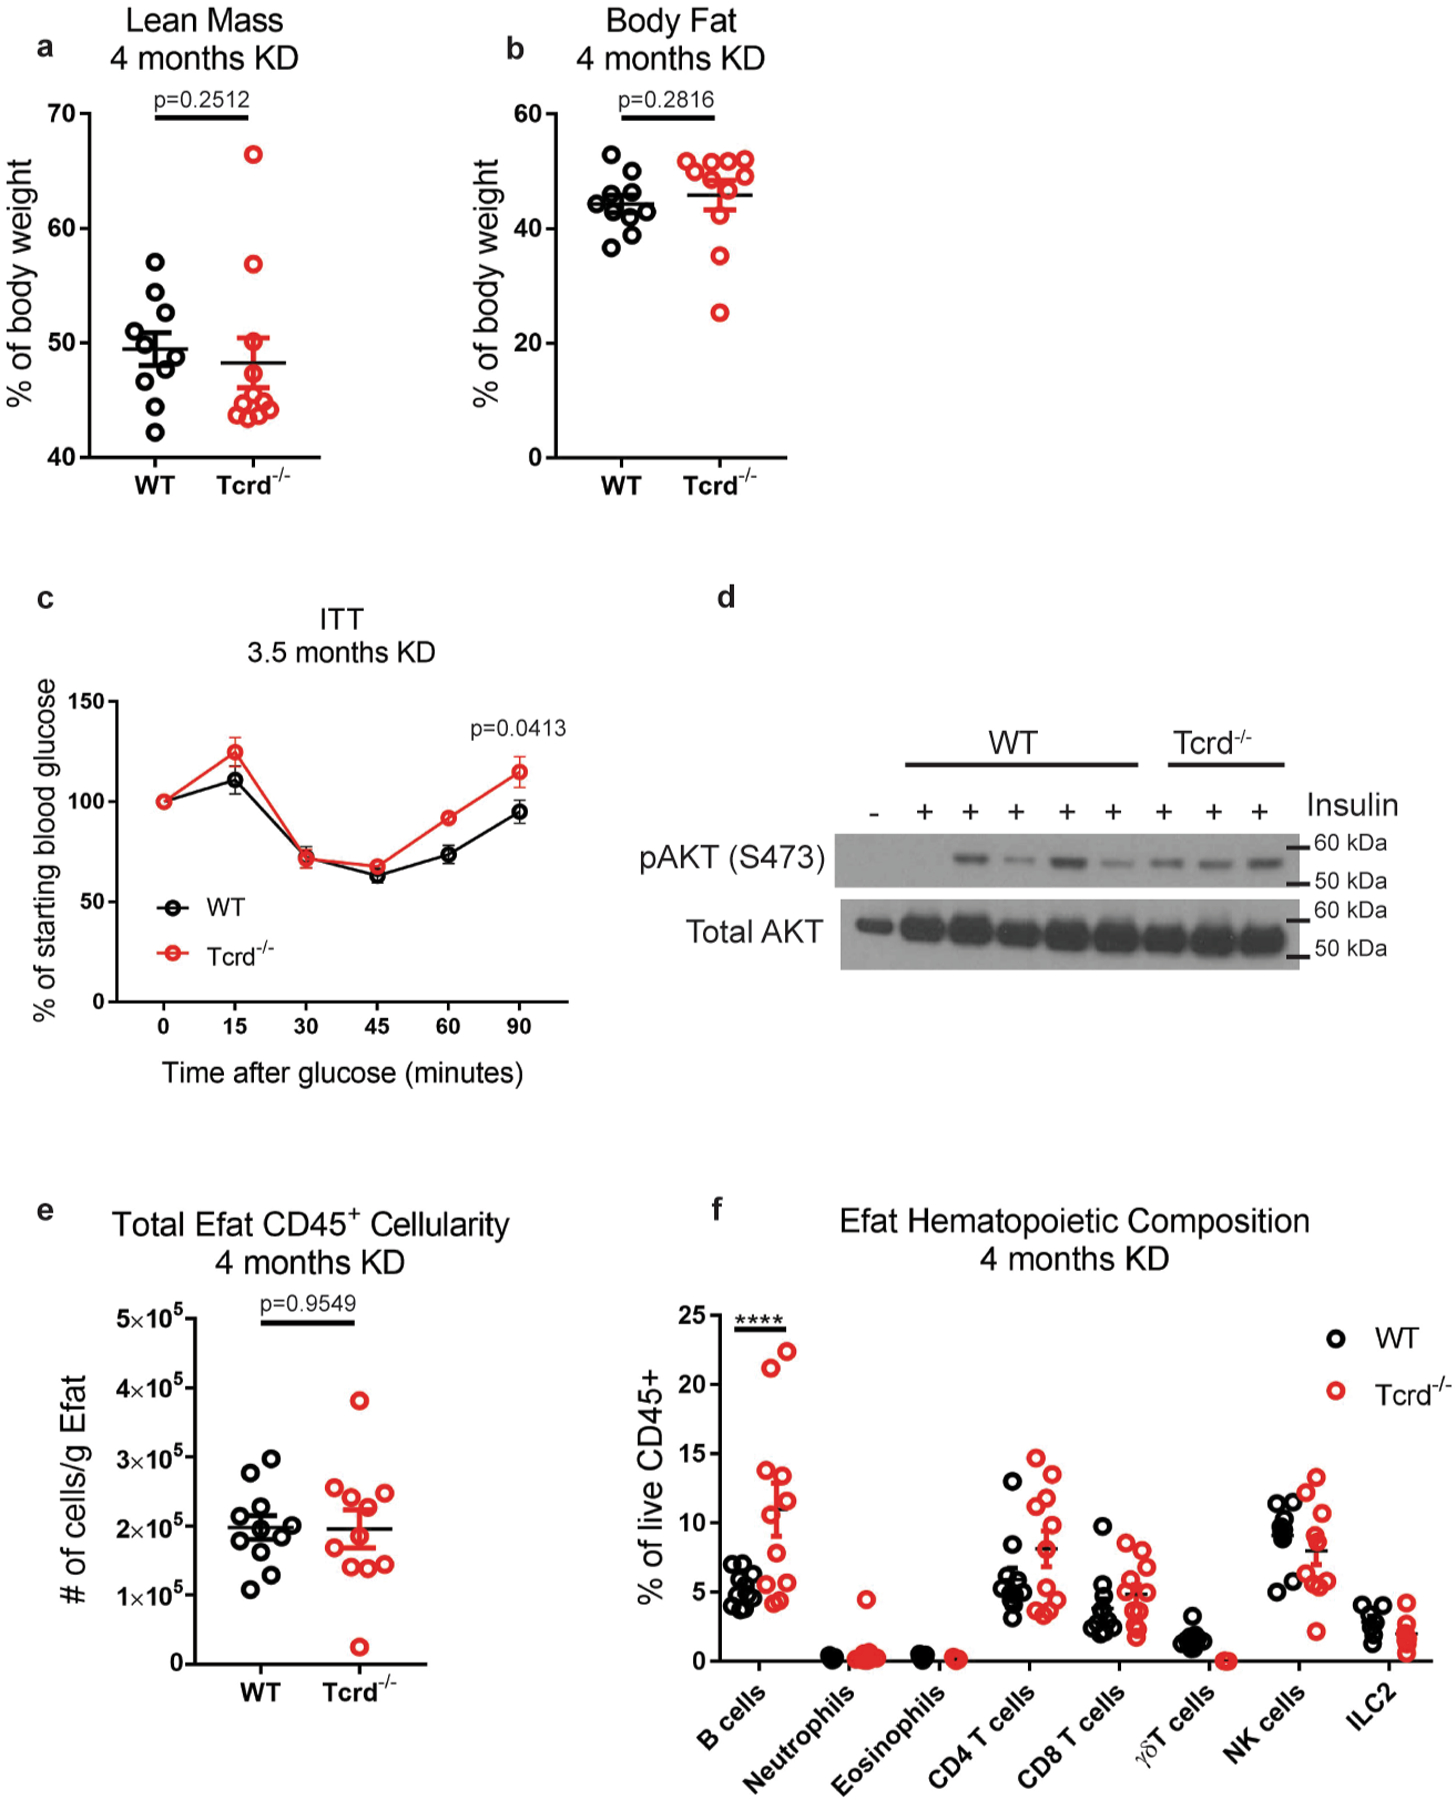
(a) Lean mass and (b) body fat in WT (n=10) vs Tcrd−/− (n=11) mice after 4 months KD. Statistical differences were calculated by nonparametric Mann-Whitney 2-tailed test because the Tcrd−/− data are not normally distributed. Data are representative of 3 independent experiments. (c) Insulin tolerance test of WT (n=10) vs Tcrd−/− (n=7) mice after 3.5 months KD. Statistical differences were calculated by paired 2-way ANOVA. (d) Western blot of liver AKT phosphorylation after insulin injection into fasted mice. Each lane represents an individual mouse. (e) Total CD45+ cellularity in Efat from WT (n=11) vs Tcrd−/− (n=11) KD-fed mice. Statistical differences were determined by unpaired 2-tailed t-test. (f) CD45+ composition in epidydimal adipose tissue in WT (n=11) vs Tcrd−/− (n=11) mice after 4 months KD. Data are pooled from 2 independent experiments with a total of n=11 WT and n=11 Tcrd−/− mice analyzed. Statistical differences were calculated by 2-way ANOVA with Sidak’s correction for multiple comparisons. Each symbol represents an individual mouse and data are represented as mean±SEM. Exact p-values are shown whenever possible, ****p<0.0001.
Extended Data Fig. 8 |. Flow cytometry gating strategies.
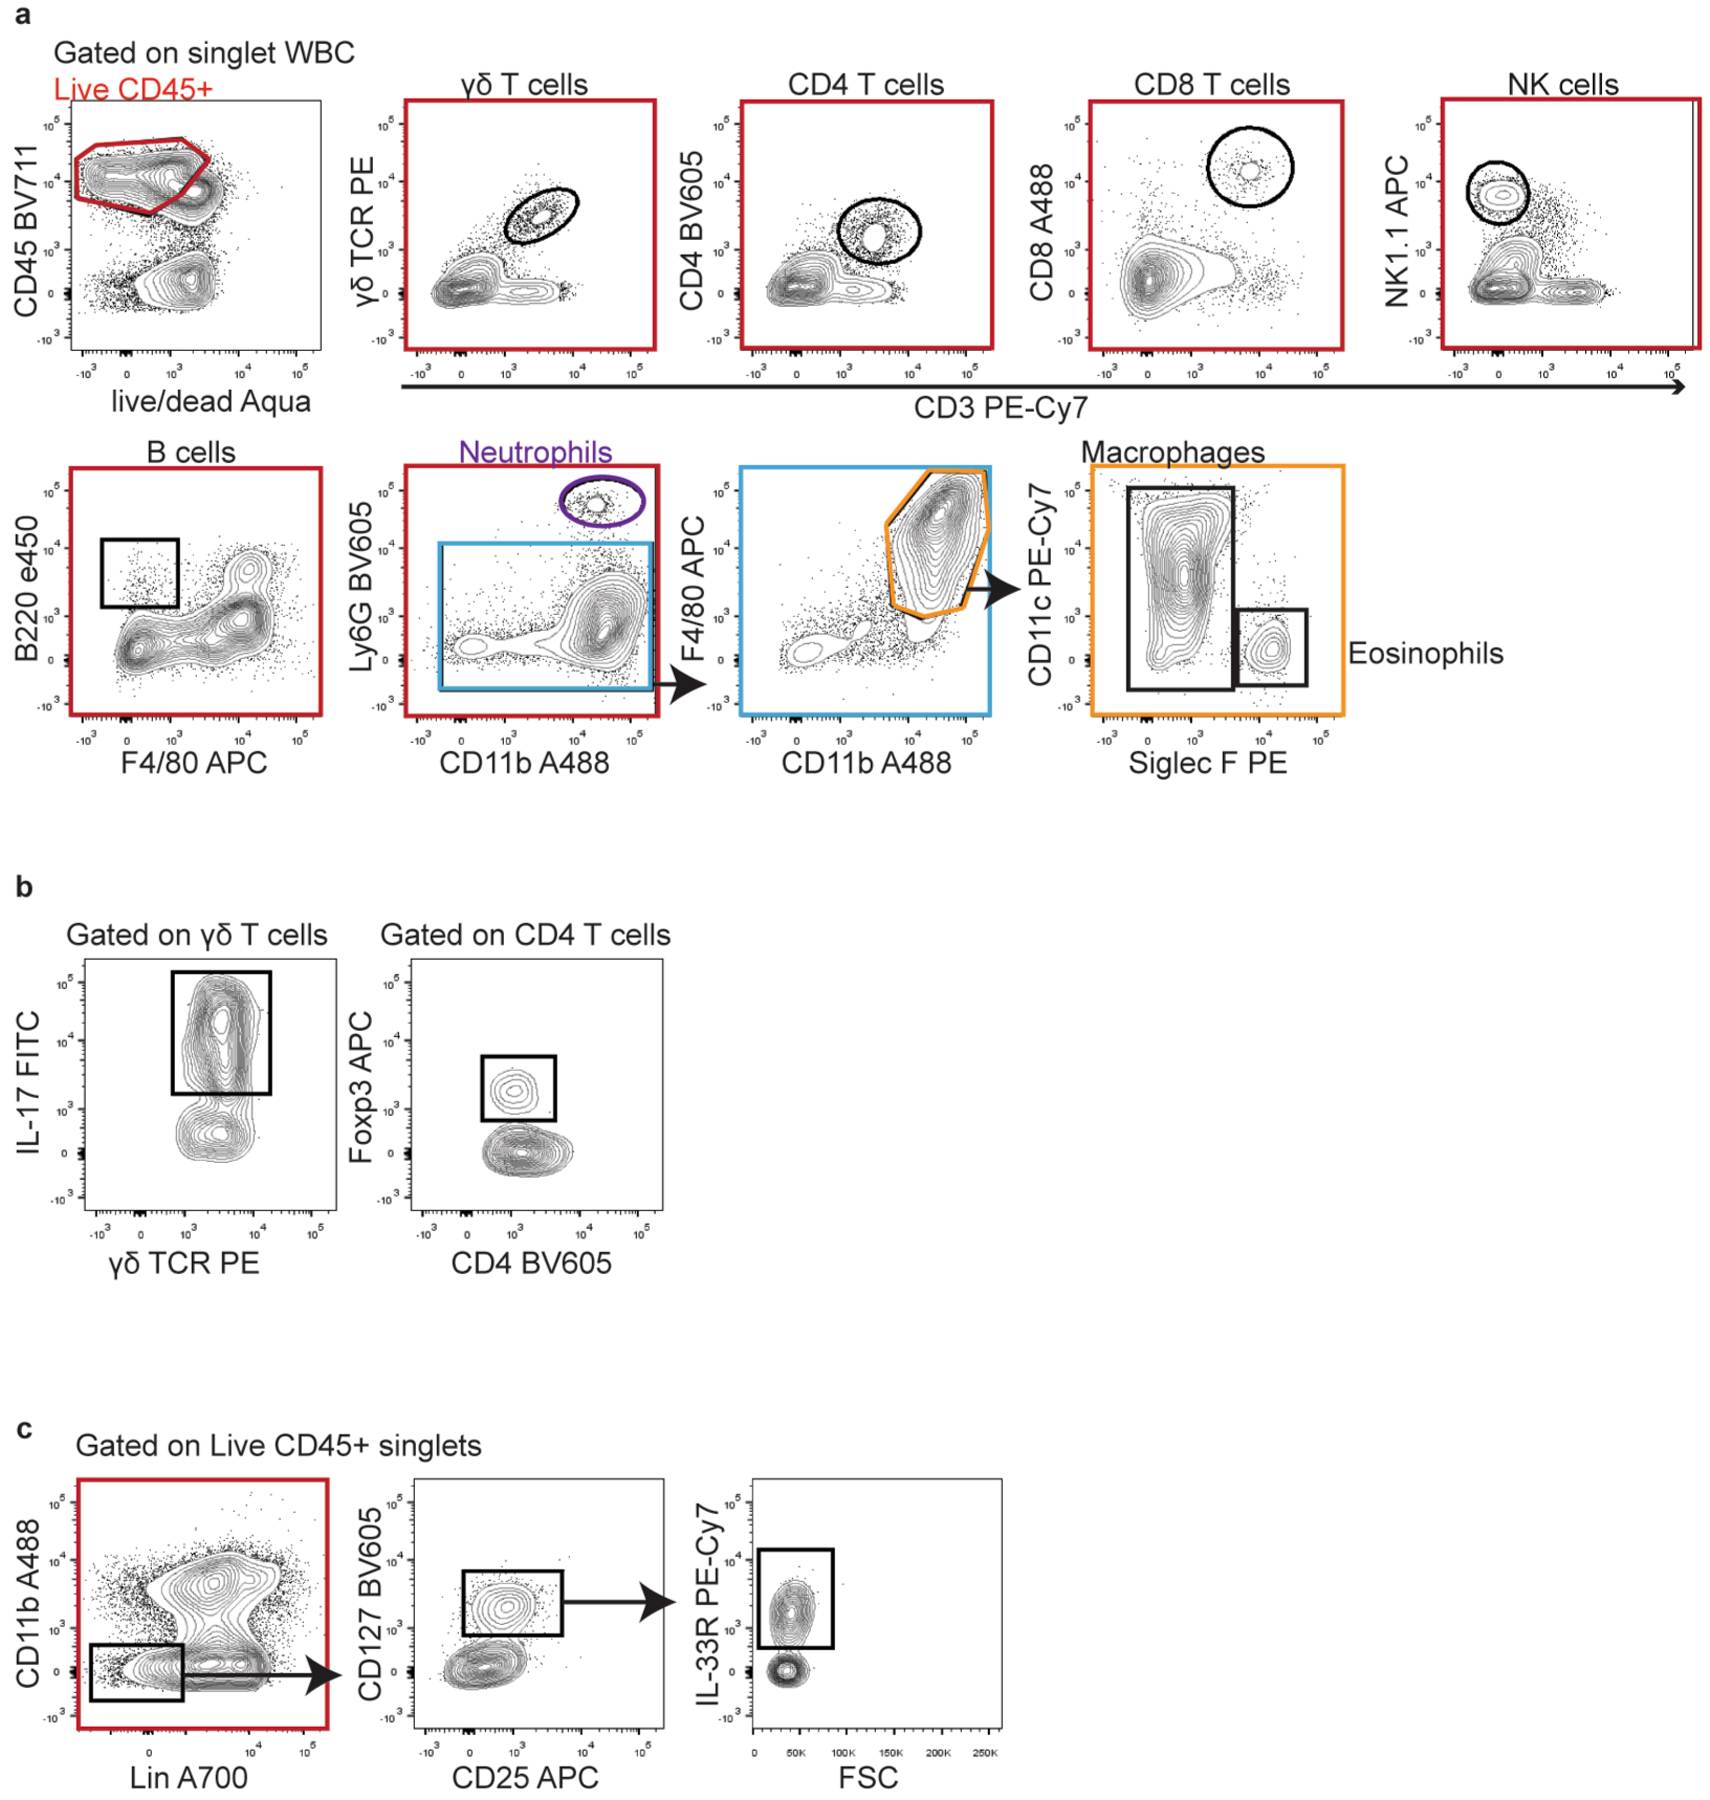
Representative gating strategies are shown for each cell population analyzed throughout the experiments. (a) Gating strategy used to define all cell lineages analyzed in Fig. 4d, Fig. 6e, f, o, Extended Data Fig. 3, Extended Data Fig. 4b, c, Extended Data Fig. 6g, Extended Data Fig. 7e, f. (b) Gating strategy used to identify IL-17-producing γδ T cells and Tregs analyzed in Fig. 4h, Fig. 6p. (c) Gating strategy used to identify ILC2 analyzed in Extended Data Fig. 7c.
Extended Data Fig. 9 |. Comparison of bulk sorted γδ T cell rNAseq with scrNAseq dataset.
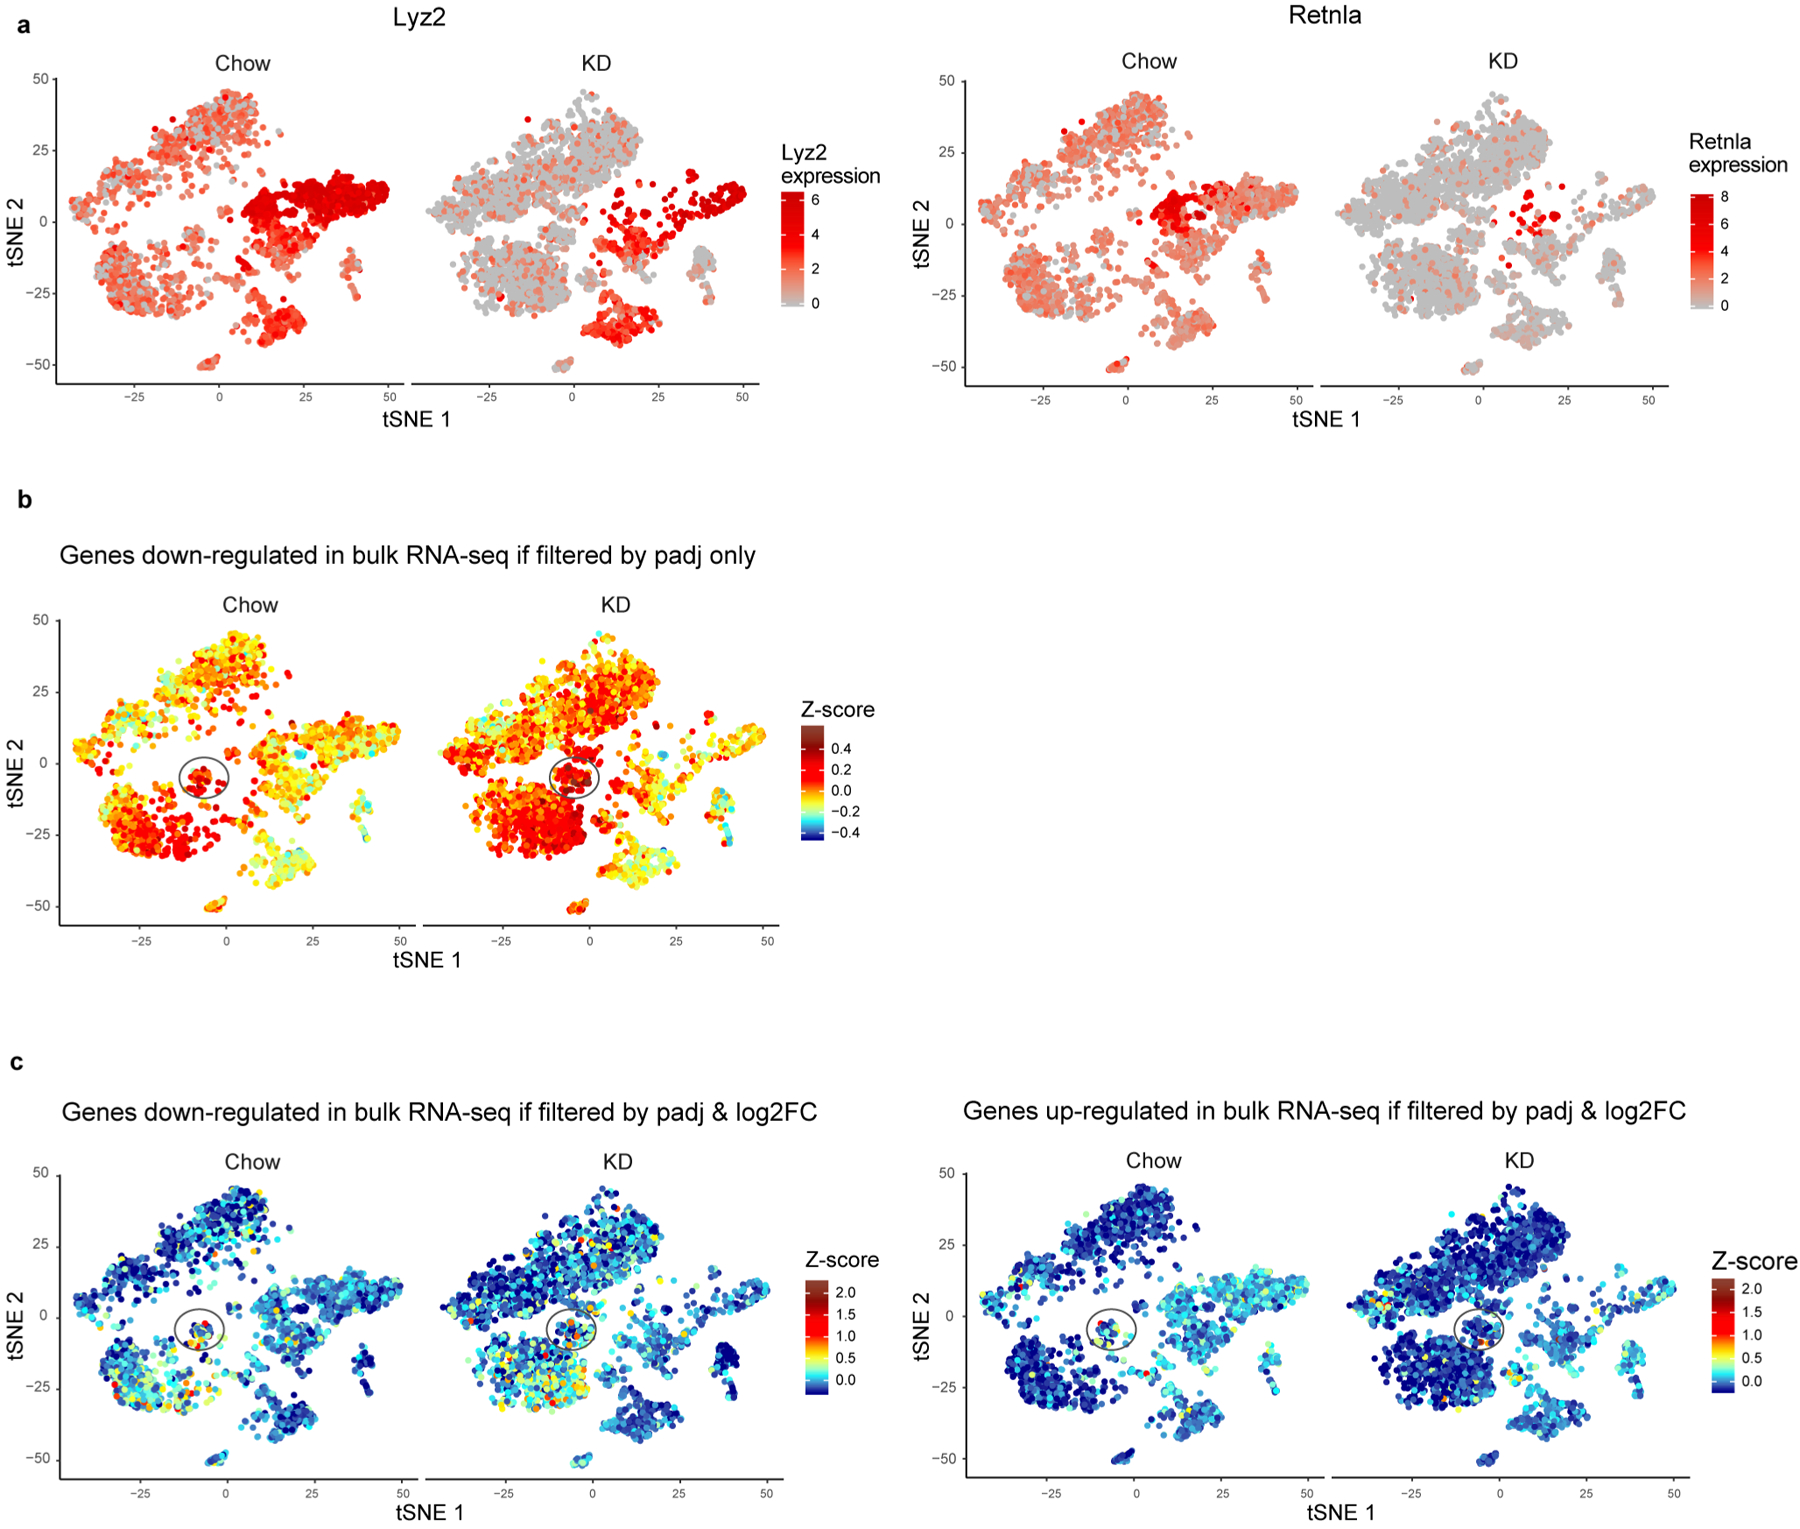
(a) tSNE plot of tissue-resident immune cells from chow- and KD-fed samples shown separately to demonstrate macrophage-specific genes differentially expressed in multiple lymphoid clusters as a result of macrophage frequency change (b) tSNE plot with overlaid color that represents expression of down-regulated genes identified from bulk RNAseq data if filtered only by padj. (c) tSNE plot with overlaid color that represents expression of down-regulated (left panel) and up-regulated (right panel) genes identified from bulk RNAseq data when filtered by padj and log2FC. For all plots (a-c) data are derived from a single technical sample generated by pooling n=3 independent samples prior to sequencing for each diet group.
Supplementary Material
Acknowledgements
We thank Y. Zhuang from the Duke University Medical School for providing the adipose tissue from Tcrd-/- reporter mice. We thank D. Gonzalez and A. Haberman for assistance with two-photon microscopy. E.L.G is funded by grant no. K99AG058801. The Dixit laboratory is supported in part by NIH grant nos. P01AG051459, AI105097, AR070811 and AG043608.
Footnotes
Competing interests
The authors declare no competing interests.
Reporting Summary. Further information on research design is available in the Nature Research Reporting Summary linked to this article.
Code availability
Codes are publicly available in the relevant citations and custom script is available on request.
Extended data is available for this paper at https://doi.org/10.1038/s42255-019-0160-6.
Supplementary information is available for this paper at https://doi.org/10.1038/s42255-019-0160-6.
Data availability
Sequencing data associated with this study have been deposited to the Gene Expression Omnibus with accession numbers GSE137073 and GSE137076. The source data for Extended Data Figs. 6 and 7 are provided with the paper.
References
- 1.Moreno B et al. Comparison of a very low-calorie-ketogenic diet with a standard low-calorie diet in the treatment of obesity. Endocrine 47, 793–805 (2014). [DOI] [PubMed] [Google Scholar]
- 2.Moreno B, Crujeiras AB, Bellido D, Sajoux I & Casanueva FF Obesity treatment by very low-calorie-ketogenic diet at two years: reduction in visceral fat and on the burden of disease. Endocrine 54, 681–690 (2016). [DOI] [PubMed] [Google Scholar]
- 3.Shimazu T et al. Suppression of oxidative stress by beta-hydroxybutyrate, an endogenous histone deacetylase inhibitor. Science 339, 211–214 (2013). [DOI] [PMC free article] [PubMed] [Google Scholar]
- 4.Goldberg EL et al. Beta-hydroxybutyrate deactivates neutrophil NLRP3 inflammasome to relieve gout flares. Cell Rep. 18, 2077–2087 (2017). [DOI] [PMC free article] [PubMed] [Google Scholar]
- 5.Lu Y et al. Ketogenic diet attenuates oxidative stress and inflammation after spinal cord injury by activating Nrf2 and suppressing the NF-kappaB signaling pathways. Neurosci. Lett 683, 13–18 (2018). [DOI] [PubMed] [Google Scholar]
- 6.Hotamisligil GS Inflammation and metabolic disorders. Nature 444, 860–867 (2006). [DOI] [PubMed] [Google Scholar]
- 7.Ageing and Health Fact Sheet 404 (World Health Organization, 2015). [Google Scholar]
- 8.Kanneganti TD & Dixit VD Immunological complications of obesity. Nat. Immunol 13, 707–712 (2012). [DOI] [PubMed] [Google Scholar]
- 9.Lumeng CN, Bodzin JL & Saltiel AR Obesity induces a phenotypic switch in adipose tissue macrophage polarization. J. Clin. Invest 117, 175–184 (2007). [DOI] [PMC free article] [PubMed] [Google Scholar]
- 10.Weisberg SP et al. Obesity is associated with macrophage accumulation in adipose tissue. J. Clin. Invest 112, 1796–1808 (2003). [DOI] [PMC free article] [PubMed] [Google Scholar]
- 11.Yang H et al. Obesity increases the production of proinflammatory mediators from adipose tissue T cells and compromises TCR repertoire diversity: implications for systemic inflammation and insulin resistance. J. Immunol 185, 1836–1845 (2010). [DOI] [PMC free article] [PubMed] [Google Scholar]
- 12.Uysal KT, Wiesbrock SM, Marino MW & Hotamisligil GS Protection from obesity-induced insulin resistance in mice lacking TNF-alpha function. Nature 389, 610–614 (1997). [DOI] [PubMed] [Google Scholar]
- 13.Xu H et al. Chronic inflammation in fat plays a crucial role in the development of obesity-related insulin resistance. J. Clin. Invest 112, 1821–1830 (2003). [DOI] [PMC free article] [PubMed] [Google Scholar]
- 14.Nishimura S et al. CD8+ effector T cells contribute to macrophage recruitment and adipose tissue inflammation in obesity. Nat. Med 15, 914–920 (2009). [DOI] [PubMed] [Google Scholar]
- 15.Wu D et al. Eosinophils sustain adipose alternatively activated macrophages associated with glucose homeostasis. Science 332, 243–247 (2011). [DOI] [PMC free article] [PubMed] [Google Scholar]
- 16.Vandanmagsar B et al. The NLRP3 inflammasome instigates obesity-induced inflammation and insulin resistance. Nat. Med 17, 179–188 (2011). [DOI] [PMC free article] [PubMed] [Google Scholar]
- 17.Youm YH et al. The ketone metabolite beta-hydroxybutyrate blocks NLRP3 inflammasome-mediated inflammatory disease. Nat. Med 21, 263–269 (2015). [DOI] [PMC free article] [PubMed] [Google Scholar]
- 18.Cahill GF Jr. Fuel metabolism in starvation. Annu. Rev. Nutr 26, 1–22 (2006). [DOI] [PubMed] [Google Scholar]
- 19.Simeone TA, Simeone KA & Rho JM Ketone bodies as anti-seizure agents. Neurochem. Res 42, 2011–2018 (2017). [DOI] [PMC free article] [PubMed] [Google Scholar]
- 20.Newman JC et al. Ketogenic diet reduces midlife mortality and improves memory in aging mice. Cell Metab. 26, 547–557 e548 (2017). [DOI] [PMC free article] [PubMed] [Google Scholar]
- 21.Roberts MN et al. A ketogenic diet extends longevity and healthspan in adult mice. Cell Metab. 26, 539–546 e535 (2017). [DOI] [PMC free article] [PubMed] [Google Scholar]
- 22.Camell CD et al. Inflammasome-driven catecholamine catabolism in macrophages blunts lipolysis during ageing. Nature 550, 119–123 (2017). [DOI] [PMC free article] [PubMed] [Google Scholar]
- 23.Youm YH et al. Canonical Nlrp3 inflammasome links systemic low-grade inflammation to functional decline in aging. Cell Metab. 18, 519–532 (2013). [DOI] [PMC free article] [PubMed] [Google Scholar]
- 24.Puchalska P et al. Hepatocyte-macrophage acetoacetate shuttle protects against tissue fibrosis. Cell Metab. 29, 383–398 (2018). [DOI] [PMC free article] [PubMed] [Google Scholar]
- 25.Kennedy AR et al. A high-fat, ketogenic diet induces a unique metabolic state in mice. Am. J. Physiol. Endocrinol. Metab 292, E1724–E1739 (2007). [DOI] [PubMed] [Google Scholar]
- 26.Srivastava S, Baxa U, Niu G, Chen X & Veech RL A ketogenic diet increases brown adipose tissue mitochondrial proteins and UCP1 levels in mice. IUBMB Life 65, 58–66 (2013). [DOI] [PMC free article] [PubMed] [Google Scholar]
- 27.Kohlgruber AC et al. Gammadelta T cells producing interleukin-17A regulate adipose regulatory T cell homeostasis and thermogenesis. Nat. Immunol 19, 464–474 (2018). [DOI] [PMC free article] [PubMed] [Google Scholar]
- 28.Badman MK et al. Hepatic fibroblast growth factor 21 is regulated by PPARalpha and is a key mediator of hepatic lipid metabolism in ketotic states. Cell Metab. 5, 426–437 (2007). [DOI] [PubMed] [Google Scholar]
- 29.Zhang Y et al. The starvation hormone, fibroblast growth factor-21, extends lifespan in mice. eLife 1, e00065 (2012). [DOI] [PMC free article] [PubMed] [Google Scholar]
- 30.Paget C et al. CD3bright signals on gammadelta T cells identify IL-17A-producing Vgamma6Vdelta1+ T cells. Immunol. Cell Biol 93, 198–212 (2015). [DOI] [PubMed] [Google Scholar]
- 31.Coppe JP, Desprez PY, Krtolica A & Campisi J The senescence-associated secretory phenotype: the dark side of tumor suppression. Ann. Rev. Pathol 5, 99–118 (2010). [DOI] [PMC free article] [PubMed] [Google Scholar]
- 32.Wiley CD et al. Analysis of individual cells identifies cell-to-cell variability following induction of cellular senescence. Aging Cell 16, 1043–1050 (2017). [DOI] [PMC free article] [PubMed] [Google Scholar]
- 33.Costanzo AE et al. Obesity impairs gammadelta T cell homeostasis and antiviral function in humans. PLoS ONE 10, e0120918 (2015). [DOI] [PMC free article] [PubMed] [Google Scholar]
- 34.Taylor KR, Mills RE, Costanzo AE & Jameson JM Gammadelta T cells are reduced and rendered unresponsive by hyperglycemia and chronic TNFalpha in mouse models of obesity and metabolic disease. PLoS ONE 5, e11422 (2010). [DOI] [PMC free article] [PubMed] [Google Scholar]
- 35.Feuerer M et al. Lean, but not obese, fat is enriched for a unique population of regulatory T cells that affect metabolic parameters. Nat. Med 15, 930–939 (2009). [DOI] [PMC free article] [PubMed] [Google Scholar]
- 36.Edwards C et al. d-beta-hydroxybutyrate extends lifespan in C. elegans. Aging 6, 621–644 (2014). [DOI] [PMC free article] [PubMed] [Google Scholar]
- 37.Xie Z et al. Metabolic regulation of gene expression by histone lysine beta-hydroxybutyrylation. Mol. Cell 62, 194–206 (2016). [DOI] [PMC free article] [PubMed] [Google Scholar]
- 38.Garbow JR et al. Hepatic steatosis, inflammation, and ER stress in mice maintained long term on a very low-carbohydrate ketogenic diet. Am. J. Physiol. Gastrointest. Liver Physiol 300, G956–G967 (2011). [DOI] [PMC free article] [PubMed] [Google Scholar]
- 39.Ellenbroek JH et al. Long-term ketogenic diet causes glucose intolerance and reduced beta- and alpha-cell mass but no weight loss in mice. Am. J. Physiol. Endocrinol. Metab 306, E552–E558 (2014). [DOI] [PubMed] [Google Scholar]
- 40.Rosenbaum M et al. Glucose and lipid homeostasis and inflammation in humans following an isocaloric ketogenic diet. Obesity 27, 971–981 (2019). [DOI] [PMC free article] [PubMed] [Google Scholar]
- 41.Sastre J et al. Aging of the liver: age-associated mitochondrial damage in intact hepatocytes. Hepatology 24, 1199–1205 (1996). [DOI] [PubMed] [Google Scholar]
- 42.Wang W et al. A PRDM16-driven metabolic signal from adipocytes regulates precursor cell fate. Cell Metab. 30, 174–189 e175 (2019). [DOI] [PMC free article] [PubMed] [Google Scholar]
- 43.Cheng CW et al. Ketone body signaling mediates intestinal stem cell homeostasis and adaptation to diet. Cell 178, 1115–1131 e1115 (2019). [DOI] [PMC free article] [PubMed] [Google Scholar]
- 44.Wencker M et al. Innate-like T cells straddle innate and adaptive immunity by altering antigen-receptor responsiveness. Nat. Immunol 15, 80–87 (2014). [DOI] [PMC free article] [PubMed] [Google Scholar]
- 45.Guo XJ et al. Lung gammadelta T cells mediate protective responses during neonatal influenza infection that are associated with type 2 immunity. Immunity 49, 531–544 e536 (2018). [DOI] [PMC free article] [PubMed] [Google Scholar]
- 46.Nielsen MM, Witherden DA & Havran WL Gammadelta T cells in homeostasis and host defence of epithelial barrier tissues. Nat. Rev. Immunol 17, 733–745 (2017). [DOI] [PMC free article] [PubMed] [Google Scholar]
- 47.Mehta P, Nuotio-Antar AM & Smith CW Gammadelta T cells promote inflammation and insulin resistance during high fat diet-induced obesity in mice. J. Leukoc. Biol 97, 121–134 (2015). [DOI] [PMC free article] [PubMed] [Google Scholar]
- 48.Zuniga LA et al. IL-17 regulates adipogenesis, glucose homeostasis, and obesity. J. Immunol 185, 6947–6959 (2010). [DOI] [PMC free article] [PubMed] [Google Scholar]
- 49.Gentles AJ et al. The prognostic landscape of genes and infiltrating immune cells across human cancers. Nat. Med 21, 938–945 (2015). [DOI] [PMC free article] [PubMed] [Google Scholar]
- 50.Zhang B et al. Differential requirements of TCR signaling in homeostatic maintenance and function of dendritic epidermal T cells. J. Immunol 195, 4282–4291 (2015). [DOI] [PMC free article] [PubMed] [Google Scholar]
- 51.Mariathasan S et al. Cryopyrin activates the inflammasome in response to toxins and ATP. Nature 440, 228–232 (2006). [DOI] [PubMed] [Google Scholar]
- 52.Schindelin J et al. Fiji: an open-source platform for biological-image analysis. Nat. Meth 9, 676–682 (2012). [DOI] [PMC free article] [PubMed] [Google Scholar]
- 53.Schneider CA, Rasband WS & Eliceiri KW NIH Image to ImageJ: 25 years of image analysis. Nat. Meth 9, 671–675 (2012). [DOI] [PMC free article] [PubMed] [Google Scholar]
- 54.Butler A, Hoffman P, Smibert P, Papalexi E & Satija R Integrating single-cell transcriptomic data across different conditions, technologies, and species. Nat. Biotechnol 36, 411–420 (2018). [DOI] [PMC free article] [PubMed] [Google Scholar]
- 55.Finak G et al. MAST: a flexible statistical framework for assessing transcriptional changes and characterizing heterogeneity in single-cell RNA sequencing data. Genome Biol. 16, 278 (2015). [DOI] [PMC free article] [PubMed] [Google Scholar]
- 56.Wickham H ggplot2: Elegant Graphics for Data Analysis (Springer, 2016). [Google Scholar]
- 57.Mudge JM & Harrow J Creating reference gene annotation for the mouse C57BL6/J genome assembly. Mamm. Genome 26, 366–378 (2015). [DOI] [PMC free article] [PubMed] [Google Scholar]
- 58.Dobin A et al. STAR: ultrafast universal RNA-seq aligner. Bioinformatics 29, 15–21 (2013). [DOI] [PMC free article] [PubMed] [Google Scholar]
- 59.Karolchik D et al. The UCSC table browser data retrieval tool. Nucleic Acids Res. 32, D493–D496 (2004). (Database issue). [DOI] [PMC free article] [PubMed] [Google Scholar]
- 60.Li B & Dewey CN RSEM: accurate transcript quantification from RNA-Seq data with or without a reference genome. BMC Bioinformatics 12, 323 (2011). [DOI] [PMC free article] [PubMed] [Google Scholar]
- 61.Love MI, Huber W & Anders S Moderated estimation of fold change and dispersion for RNA-seq data with DESeq2. Genome Biol. 15, 550 (2014). [DOI] [PMC free article] [PubMed] [Google Scholar]
- 62.Sergushichev A An algorithm for fast preranked gene set enrichment analysis using cumulative statistic calculation. Preprint at bioRxiv 10.1101/060012 (2016). [DOI] [Google Scholar]
- 63.Subramanian A et al. Gene set enrichment analysis: a knowledge-based approach for interpreting genome-wide expression profiles. Proc. Natl Acad. Sci. USA 102, 15545–15550 (2005). [DOI] [PMC free article] [PubMed] [Google Scholar]
- 64.Liberzon A et al. Molecular signatures database (MSigDB) 3.0. Bioinformatics 27, 1739–1740 (2011). [DOI] [PMC free article] [PubMed] [Google Scholar]
Associated Data
This section collects any data citations, data availability statements, or supplementary materials included in this article.
Supplementary Materials
Data Availability Statement
Sequencing data associated with this study have been deposited to the Gene Expression Omnibus with accession numbers GSE137073 and GSE137076. The source data for Extended Data Figs. 6 and 7 are provided with the paper.


