

Abstract
Despite tumor-associated macrophages (TAMs) playing a key role in shaping the tumor microenvironment (TME), the mechanisms by which TAMs influence the TME and contribute to cancer progression remain unclear. Here, we show that the N6-methyladenosine reader YTHDF2 regulates the antitumor functions of TAMs. YTHDF2 deficiency in TAMs suppressed tumor growth by reprogramming TAMs toward an antitumoral phenotype and increasing their antigen cross-presentation ability, which in turn enhanced CD8+ T cell-mediated antitumor immunity. YTHDF2 deficiency facilitated the reprogramming of TAMs by targeting interferon-γ–STAT1 signaling. The expression of YTHDF2 in TAMs was regulated by interleukin-10–STAT3 signaling. Selectively targeting YTHDF2 in TAMs using a Toll-like receptor 9 agonist-conjugated small interfering RNA reprogrammed TAMs toward an antitumoral phenotype, restrained tumor growth and enhanced the efficacy of PD-L1 antibody therapy. Collectively, our findings describe the role of YTHDF2 in orchestrating TAMs and suggest that YTHDF2 inhibition is an effective approach to enhance cancer immunotherapy.
The tumor microenvironment (TME) is a complex system where malignant cells interact with immune and non-immune cells individually or in combination to affect sensitivity to immunotherapy1. Tumors recruit and/or reshape myeloid cells to tumor-associated macrophages (TAMs), dendritic cells (DCs), myeloid-derived suppressor cells (MDSCs) and tumor-associated neutrophils to trigger an immunosuppressive environment2. Tumor-infiltrating myeloid cells (TIMs) directly stimulate tumor cell proliferation and enhance tumor vascularization3 and also promote cancer progression by suppressing antitumor T cell or natural killer (NK) cell function through secreting regulatory cytokines, including transforming growth factor-β (TGFβ), interleukin-10 (IL-10) and arginase 1 (Arg1), or overexpressing inhibitory ligands, such as PD-L1 (refs.3,4). However, some types of TIMs, including antitumoral TAMs and CD103+ DCs, have antitumor functions5,6.
RNA N6-methyladenosine (m6A) methylation is the most common type of RNA methylation that occurs at the N6 position of adenosine and can shape the TME7. Depletion of m6A RNA methyltransferases, such as METTL3/METTL14, in tumor cells enhances immune responses to PD-1 antibody therapy8, while inhibition of the m6A RNA demethylase FTO or ALKBH5 sensitizes tumor cells to T cell cytotoxicity dependent or independent of PD-1/PD-L1 antibody treatment9–12. m6A modifiers in TIMs were reported to have substantial roles in shaping tumor immunity and immunotherapy13–16. TAMs are potent regulators of tumor-associated immune suppression in the TME2; however, the mechanisms for this effect remain to be fully elucidated, including the roles of m6A readers in this setting. YTHDF proteins function as the main m6A readers through binding to the methylated RNA and mediating specific functions7. YTHDF1 enhances mRNA translation17, YTHDF2 regulates mRNA stability18 and YTHDF3 promotes the translation and degradation of mRNA19,20. Defining the roles of m6A readers in TAMs could provide opportunities for cancer immunotherapy.
In this study, we showed that the antitumor immunity of TAMs was controlled by the m6A reader protein YTHDF2, and CD8+ T cells were involved in the process. Using CpG oligodeoxynucleotide (CpG ODN)-conjugated Ythdf2 small interfering RNA (siRNA) to target YTHDF2 specifically in TAMs in combination with PD-L1 antibody therapy resulted in strong antitumor effects, suggesting that YTHDF2 in TAMs reduces antitumor innate and adaptive immunity.
Results
YTHDF2 is upregulated in TIMs
We screened the expression of YTHDF2 in tumor samples and adjacent normal tissues from RNA sequencing (RNA-seq) results of The Cancer Genome Atlas (TCGA) database and the Genotype–Tissue Expression (GTEx) database. The expression of YTHDF2 mRNA was significantly upregulated in 14 of 31 types of tumor tissues, including breast cancer (BRCA), colon adenocarcinoma (COAD), glioblastoma (GBM), rectum adenocarcinoma (READ), skin cutaneous melanoma (SKCM) and uterine corpus endometrial carcinoma (UCEC; Extended Data Fig. 1a), in agreement with previous reports21,22. Using the estimation of stromal and immune cells in malignant tumor tissues using expression data (ESTIMATE) algorithm23, we found a negative correlation between the expression of YTHDF2 mRNA and immune scores in BRCA, GBM, READ, SKCM and UCEC (Extended Data Fig. 1b). By leveraging the TIMER 2.0 website, expression of YTHDF2 was positively correlated with the expression of myeloid-related genes, including REL (encoding C-Rel) and fucosyltransferase 4 (FUT4, encoding CD15; Extended Data Fig. 1c). The expression of YTHDF2 was also positively correlated with the expression of immune checkpoint genes, such as CD274 (encoding PD-L1), TIGIT, LAG3, CTLA4 and PDCD1 (encoding PD-1) in several types of cancers (Extended Data Fig. 1c). Analysis of public single-cell RNA-seq (scRNA-seq) data indicated that expression of YTHDF2 was higher in TIMs than in myeloid cells in adjacent or normal tissues in individuals with GBM24, COAD25 or BRCA26 (Extended Data Fig. 1d–f). These results suggested that YTHDF2 was upregulated in TIMs.
YTHDF2 deficiency in TAMs suppresses tumor growth and metastasis
To address the role of YTHDF2 expressed in myeloid cells in tumor development, we crossed Ythdf2f/f mice with lysozyme 2-Cre (Lyz2Cre) mice to generate Ythdf2f/fLyz2Cre mice (hereafter, Ythdf2cKO; Extended Data Fig. 2a–d). The frequency or composition of myeloid cells in the spleen at a steady state was similar in age- and sex-matched Ythdf2cKO and Ythdf2f/f mice (Extended Data Fig. 2e–g). On day 15 after subcutaneous (s.c.) injection of ovalbumin (OVA)-expressing B16 (B16-OVA) melanoma cells or MC38 colorectal cancer cells into the flanks of syngeneic Ythdf2f/f and Ythdf2cKO mice, we observed a significant reduction in tumor volume and tumor weight in Ythdf2cKO mice compared to in Ythdf2f/f mice (Fig. 1a,b). In a melanoma lung metastatic model, on day 14 after intravenous (i.v.) injection of B16F10 melanoma cells, Ythdf2cKO mice had a lower burden of metastatic nodules than Ythdf2f/f mice (Fig. 1c). Moreover, B16F10 tumor-bearing Ythdf2cKO mice had significantly longer survival than Ythdf2f/f mice (Fig. 1d). These data suggested that YTHDF2 deficiency in myeloid cells suppressed tumor growth and metastasis in mice.
Fig. 1 |. YTHDF2 deficiency in macrophages suppresses tumor growth.
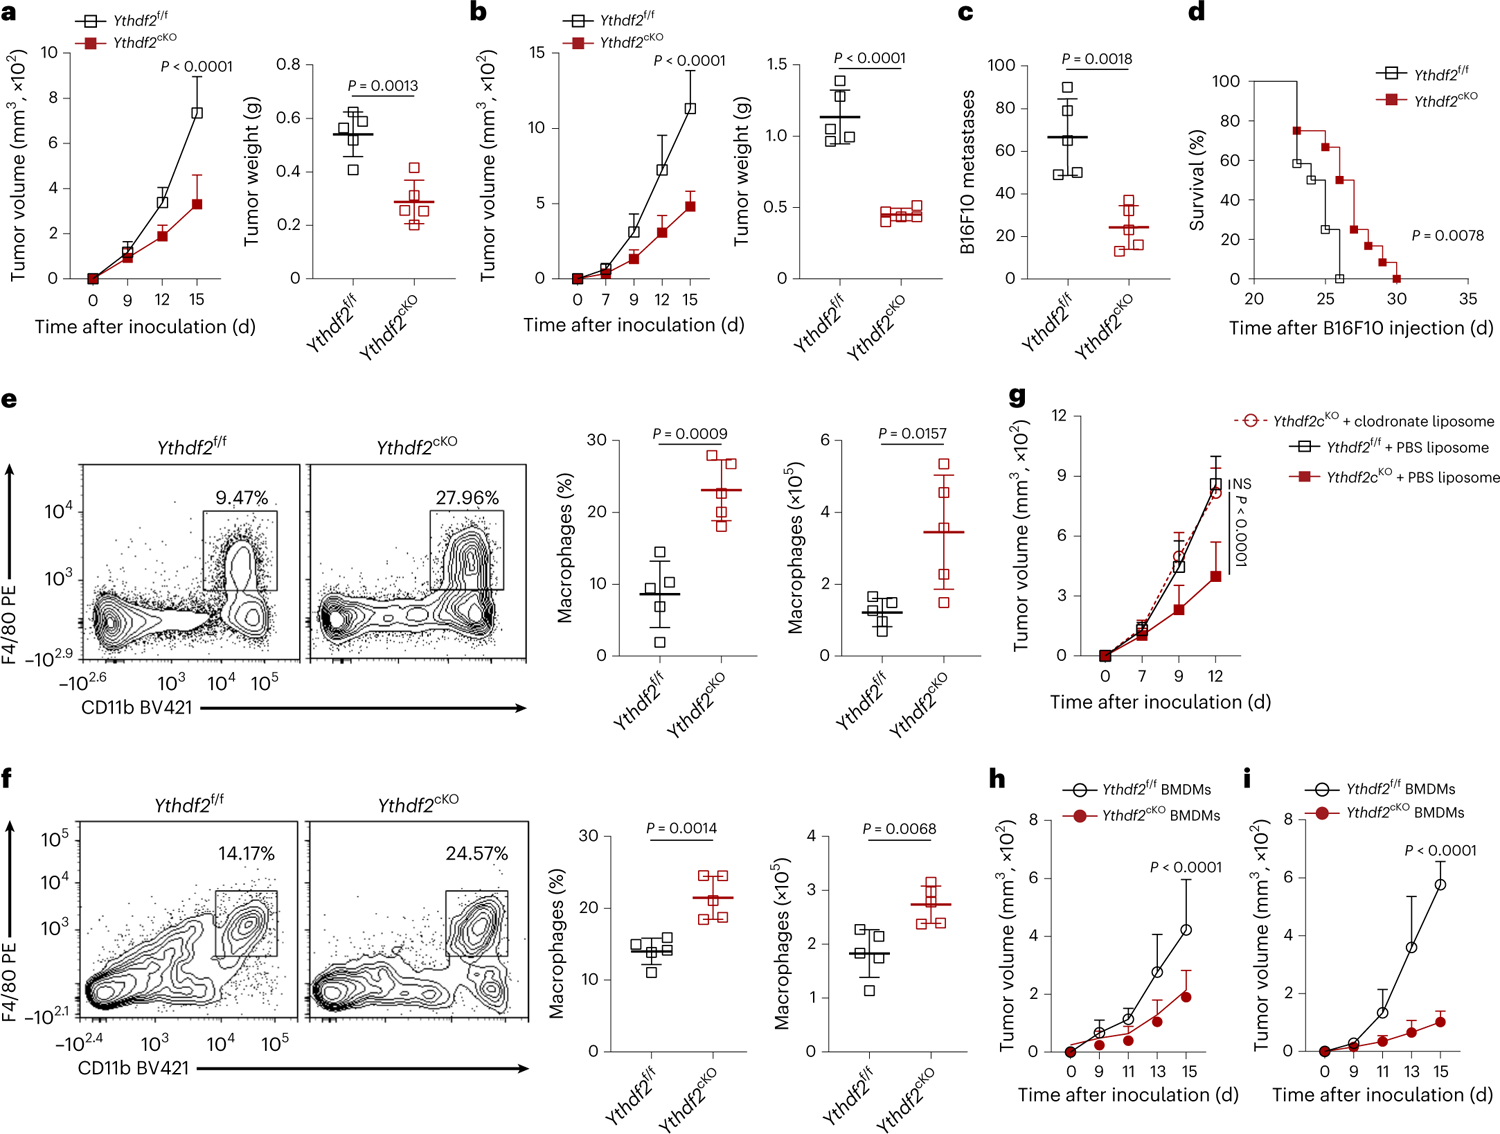
a,b, B16-OVA (a) or MC38 (b) tumor growth and tumor weight on day 15 after tumor inoculation in Ythdf2f/f and Ythdf2cKO mice (n = 5 per group). c,d, B16F10 lung metastases (c; n = 5) on day 14 after i.v. injection of B16F10 melanoma cells and mouse survival (d; n = 12) in Ythdf2f/f and Ythdf2cKO mice. e,f, Representative plots, percentages and absolute numbers of TAMs from Ythdf2f/f and Ythdf2cKO mice on day 14 after B16-OVA (e) or MC38 (f) tumor inoculation (n = 5). g, B16-OVA tumor growth in Ythdf2f/f and Ythdf2cKO mice treated with clodronate liposomes or PBS liposomes (Ythdf2f/f + PBS liposome, n = 6; Ythdf2cKO + PBS liposome, n = 5; Ythdf2cKO + clodronate liposome, n = 4). h,i, B16-OVA (h; n = 6) or MC38 (i; n = 4) tumor growth on day 15 after tumor inoculation in immunocompetent CD45.1 recipient mice transplanted with Ythdf2f/f or Ythdf2cKO BMDMs. Data are shown as mean ± s.d. and were analyzed by two-way ANOVA with a mixed-effects model followed by a Holm–Šídák post test (a left, b left, g, h and i) or unpaired two-tailed t-test (a right, b right, c, e and f) or Kaplan–Meier survival analysis and log-rank test (d). Data in a–h are representative of at least two independent experiments; NS, not significant.
Next, we profiled the myeloid cell populations in the B16-OVA melanoma and MC38 colorectal tumors on day 14 after inoculation. Ythdf2f/f and Ythdf2cKO mice had comparable percentages and absolute numbers of tumor-infiltrating CD11b+Gr-1+ MDSCs and CD11b+CD11c+MHC-II+ DCs (Extended Data Fig. 2h–k). Production of interferon-γ (IFNγ) was similar when naive OT-I CD8+ T cells, which specifically recognize the OVA-derived SIINFEKL peptide, were cocultured with B16-OVA tumor-derived Ythdf2cKO MDSCs or DCs preloaded with the SIINFEKL peptide or were cocultured with OVA protein as their Ythdf2f/f counterpart (Extended Data Fig. 2l–o), suggesting that YTHDF2 deficiency did not affect the inhibitory activity of MDSCs or the cross-priming capacity of DCs. The Lyz2Cre-mediated genetic deletion is mainly detected in monocytes, macrophages and granulocytes but rarely in DCs27. We found comparable expression of YTHDF2 in bone marrow-derived DCs and splenic DCs in Ythdf2f/f and Ythdf2cKO mice (Extended Data Fig. 2p,q), suggesting that the function of DCs may not be affected by YTHDF2 in our model.
We observed a significant increase in the percentage and absolute number of CD11b+F4/80+ macrophages in the B16-OVA melanoma and MC38 colorectal tumors on day 14 after inoculation in Ythdf2cKO mice compared to in Ythdf2f/f mice (Fig. 1e,f). Systemic depletion of macrophages by i.v. injection of clodronate liposomes on days 0 and 7 after tumor inoculation (Extended Data Fig. 2r) abrogated the differences in tumor growth between Ythdf2f/f and Ythdf2cKO mice (Fig. 1g). In addition, co-inoculation of B16-OVA or MC38 cells with bone marrow-derived macrophages (BMDMs) from Ythdf2cKO mice significantly reduced tumor growth compared to co-inoculation of BMDMs from Ythdf2f/f mice on day 15 after inoculation (Fig. 1h,i). Cotransferred BMDMs persisted in the tumors for at least 2 weeks (Extended Data Fig. 2s). Together, these data suggested that YTHDF2 deficiency in TAMs contributed to suppression of tumor growth.
YTHDF2 deficiency in TAMs enhances CD8+ T cell antitumor response
Macrophages can control tumor progression through phagocytosis28. We did not detect significant differences in the phagocytic ability of Ythdf2f/f and Ythdf2cKO BMDMs (Extended Data Fig. 3a,b). Co-inoculation of B16-OVA cells with BMDMs from Ythdf2cKO mice in Rag1–/– mice, which lack T and B cells, showed similar tumor growth as co-inoculation of BMDMs from Ythdf2f/f mice (Extended Data Fig. 3c). However, co-inoculation of B16-OVA cells with BMDMs from Ythdf2cKO mice in Rag1–/– mice that received CD3+ T cells from C57BL/6 mice i.v. on day 0 of tumor inoculation significantly reduced tumor growth on day 13 after inoculation compared to co-inoculation of BMDMs from Ythdf2f/f mice (Extended Data Fig. 3d), suggesting that T cells were required for control of tumor growth by YTHDF2-deficient macrophages. There were no significant differences in percentages and absolute numbers of tumor-infiltrating CD4+ T cells, CD8+ T cells and CD3–NK1.1+ NK cells between Ythdf2f/f and Ythdf2cKO mice s.c. injected with B16-OVA or MC38 cells (Extended Data Fig. 3e–h). The percentages of B16-OVA or MC38 tumor-infiltrating CD4+IFNγ+ type 1 helper T (TH1) cells, CD4+IL-17A+ TH17 cells and CD4+Foxp3+ regulatory T (Treg) cells and granzyme B-producing NK cells were comparable between Ythdf2f/f and Ythdf2cKO mice (Extended Data Fig. 3i,j). However, we observed higher percentages of tumor-infiltrating IFNγ-producing CD8+ T cells in Ythdf2cKO mice than in Ythdf2f/f mice (Fig. 2a,b) and a significant increase in the percentages of tumor-infiltrating CD62LloCD44hiCD8+ effector memory T (TEM) cells in Ythdf2cKO mice compared to in Ythdf2f/f mice (Fig. 2c,d). The frequencies of B16-OVA tumor-infiltrating SIINFEKL-specific CD8+ T cells (Fig. 2e) and MC38 tumor-infiltrating KSPWFTTL-specific CD8+ T cells (Fig. 2f) were significantly higher in Ythdf2cKO mice than in Ythdf2f/f mice. Using an IFNγ enzyme-linked immunosorbent spot assay (ELISpot), we found that SIINFEKL-specific CD8+ T cells in the B16-OVA tumor draining lymph nodes in Ythdf2cKO mice produced more IFNγ than their Ythdf2f/f counterparts (Fig. 2g). The increased antitumor response in the Ythdf2cKO mice was completely lost when mice received an intraperitoneal (i.p.) injection of CD8 antibody, which induced systemic depletion of CD8+ T cells (Fig. 2h), while Rag1−/− mice that were i.v. injected with wild-type OT-I T cells and Ythdf2cKO BMDMs had significantly smaller tumors than Rag1−/− mice that received wild-type OT-I T cells and Ythdf2f/f BMDMs (Fig. 2i). Collectively, these data suggested that tumor suppression in mice with a myeloid cell-specific YTHDF2 deficiency required CD8+ T cells.
Fig. 2 |. YTHDF2 deficiency enhances CD8+ T cell-mediated antitumor immunity.
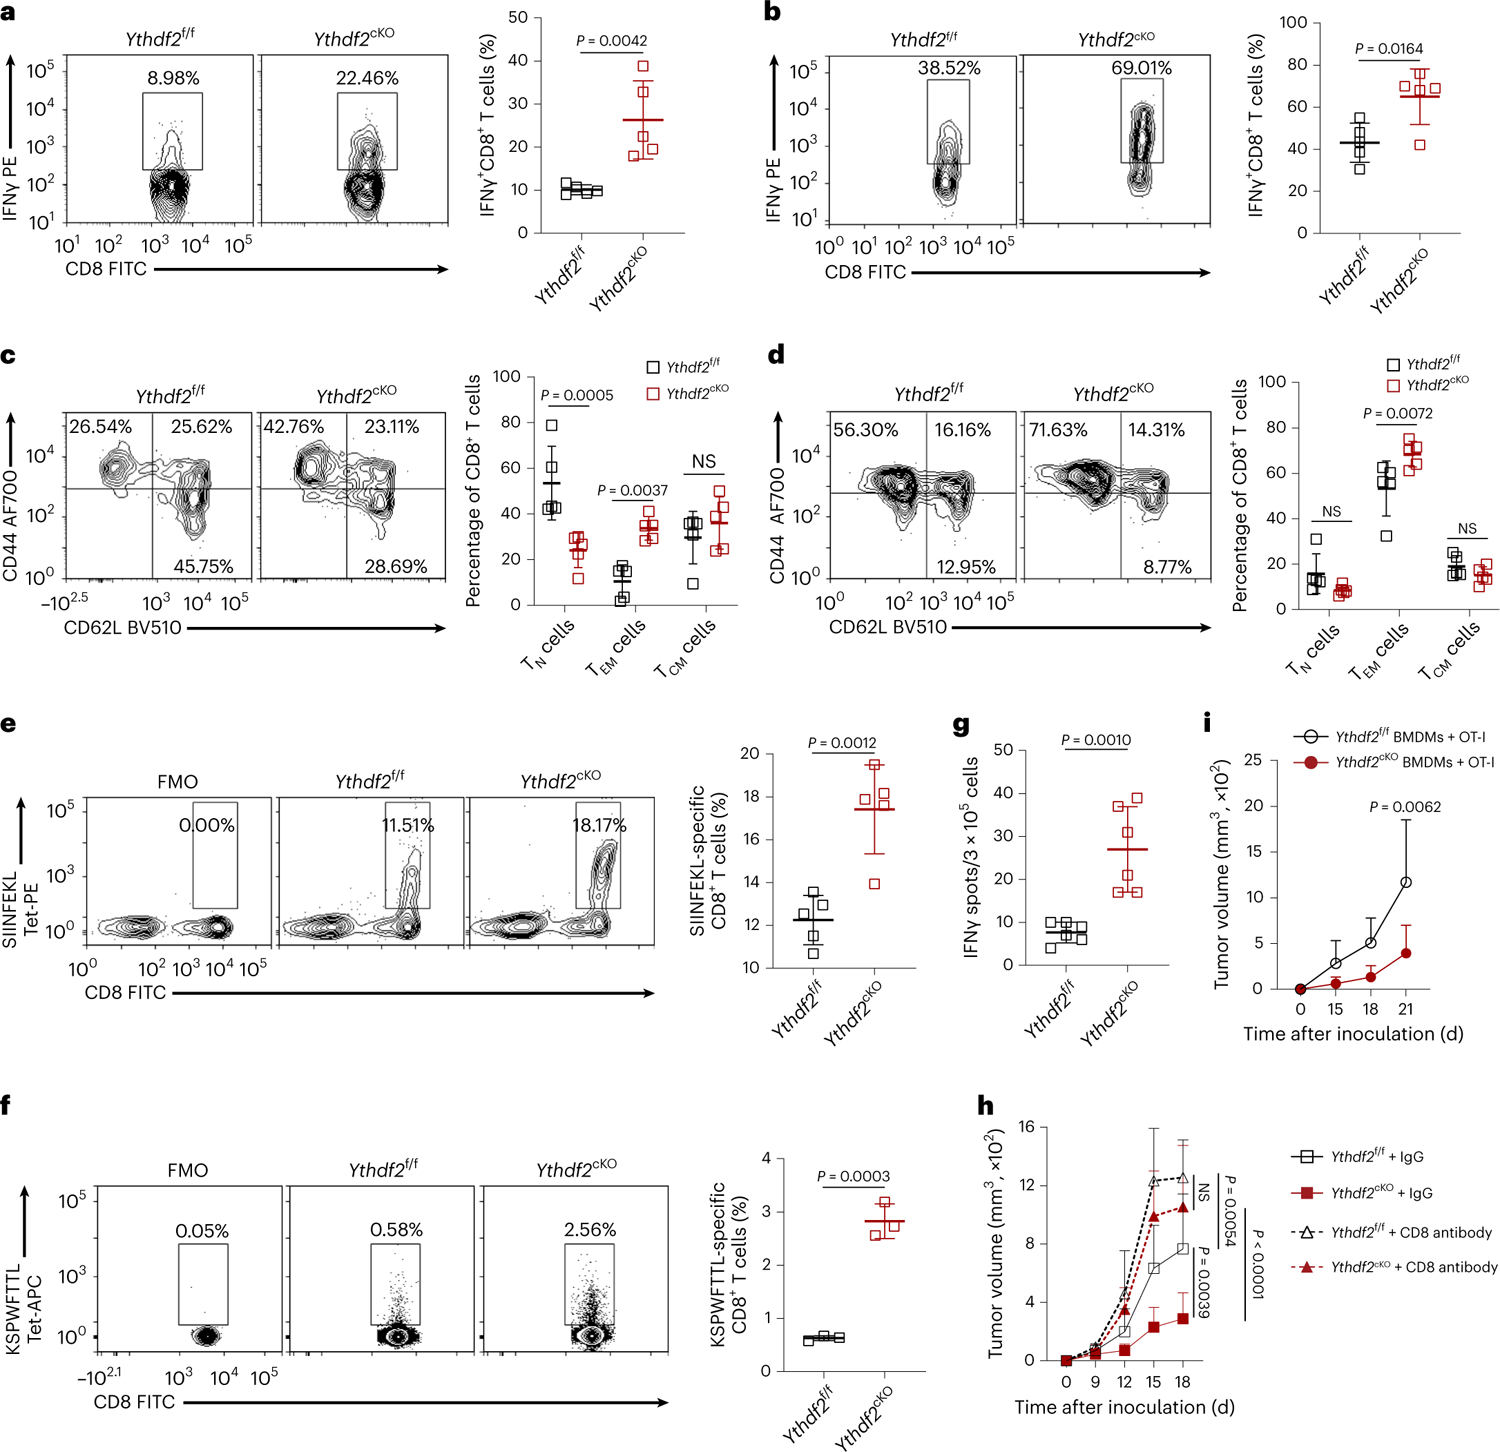
a,b, Representative plots and percentages of tumor-infiltrating IFNγ-producing CD8+ T cells from Ythdf2f/f and Ythdf2cKOmice on day 14 after B16-OVA (a) or MC38 (b) tumor inoculation (n = 5). c,d, Representative plots and percentages of tumor-infiltrating effector memory (TEM), central memory (TCM) and naive (TN) CD8+ T cells from Ythdf2f/f and Ythdf2cKO mice on day 14 after B16-OVA (c) or MC38 (d) tumor inoculation (n = 5). e,f, Representative plots and percentages of SIINFEKL-specific CD8+ T cells (e) or KSPWFTTL-specific CD8+ T cells (f) from Ythdf2f/f and Ythdf2cKO mice on day 14 after B16-OVA (e) or MC38 (f) tumor inoculation (n = 5). g, IFNγ-producing CD8+ T cells in the draining lymph nodes from Ythdf2f/f and Ythdf2cKO mice on day 14 after B16-OVA tumor inoculation. Cytokine levels are expressed as the number of spot-forming cells out of 3 × 10⁵ draining lymph nodes cells (n = 6). h, B16-OVA tumor growth on day 18 after tumor inoculation in Ythdf2f/f and Ythdf2cKO mice treated with IgG or CD8 antibody (Ab; Ythdf2f/f + IgG, n = 6; Ythdf2cKO + IgG, n = 6; Ythdf2f/f + CD8 Ab, n = 5; Ythdf2cKO + CD8 Ab, n = 5). i, B16-OVA tumor growth on day 21 after tumor inoculation in Rag1−/− mice s.c. implanted with BMDMs from Ythdf2f/f and Ythdf2cKO mice together with i.v. injection of CD8+ T cells from OT-I mice (Ythdf2f/f BMDMs + OT-I, n = 4; Ythdf2cKO BMDMs + OT-I, n = 5). Data are shown as mean ± s.d. and were analyzed by two-way ANOVA with a mixed-effects model and adjusted by Holm–Šídák post test (h and i) or unpaired two-tailed t-test (a–g). Data in a–i are representative of at least two independent experiments.
YTHDF2 deficiency improves macrophage antitumoral polarization
As TAMs comprise both antitumoral and protumoral cells, we further characterized this heterogeneous population. First, we performed scRNA-seq on CD45+ cells isolated from B16-OVA tumors in Ythdf2f/f and Ythdf2cKO mice. Unsupervised cluster analysis using the two-dimensional t-distributed stochastic neighbor embedding (t-SNE) algorithm identified 15 clusters of cells with unique expression features (Fig. 3a). Cell types for these clusters were then identified based on canonical markers, which included three monocyte/macrophage clusters, two CD8+ T cell clusters, three DC clusters and single clusters of B cells, naive T cells, Treg cells, γδ T cells, NK cells, neutrophils and mast cells in both Ythdf2f/f and Ythdf2cKO mice (Fig. 3b and Extended Data Fig. 4a). Of note, the proportion of protumoral macrophages (characterized by expression of Pf4, Apoe, Arg1, Mrc1, Il10, Spp1, Ccl9, C1qa and C1qb) was lower in tumors from Ythdf2cKO mice than in tumors from Ythdf2f/f mice (Fig. 3c–e). By contrast, the proportion of antitumoral macrophages (characterized by H2-Aa, H2-Ab1, Il1b, Il15, Il18, Tnf, Cd40, Cd74, Ptgs2, Cxcl9 and Cxcl10) was higher in tumors from Ythdf2cKO mice than in tumors from Ythdf2f/f mice (Fig. 3c–e), indicating a switch from protumoral to antitumoral macrophages in Ythdf2cKO mice. Quantitative PCR (qPCR) analysis validated that the mRNA expression of antitumoral markers, including Nos2, Il1b, Il6, Il12 and Il15, was significantly upregulated (Fig. 3f), while the expression of protumoral markers, including Arg1, Mrc1 and Ym1, was significantly decreased (Fig. 3g) in CD11b+F4/80+ macrophages isolated from B16-OVA tumors in Ythdf2cKO compared to in Ythdf2f/f mice. An immunoblotting assay indicated that antitumoral BMDMs from Ythdf2cKO mice had increased expression of inducible nitric oxide synthase (iNOS; Extended Data Fig. 4b), whereas protumoral BMDMs from Ythdf2cKO mice had decreased expression of Arg1 compared to those from Ythdf2f/f mice (Extended Data Fig. 4b). Flow cytometry indicated that the percentage of CD11b+F4/80+iNOS+ antitumoral macrophages was significantly increased, whereas the percentage of CD11b+F4/80+Arg1+ protumoral macrophages was markedly decreased in B16-OVA tumors from Ythdf2cKO mice compared to Ythdf2f/f mice (Fig. 3h,i). These observations indicated that deficiency of YTHDF2 in macrophages induced an antitumoral program in TAMs.
Fig. 3 |. YTHDF2 deficiency reprograms TAMs by promoting polarization of antitumoral macrophages.
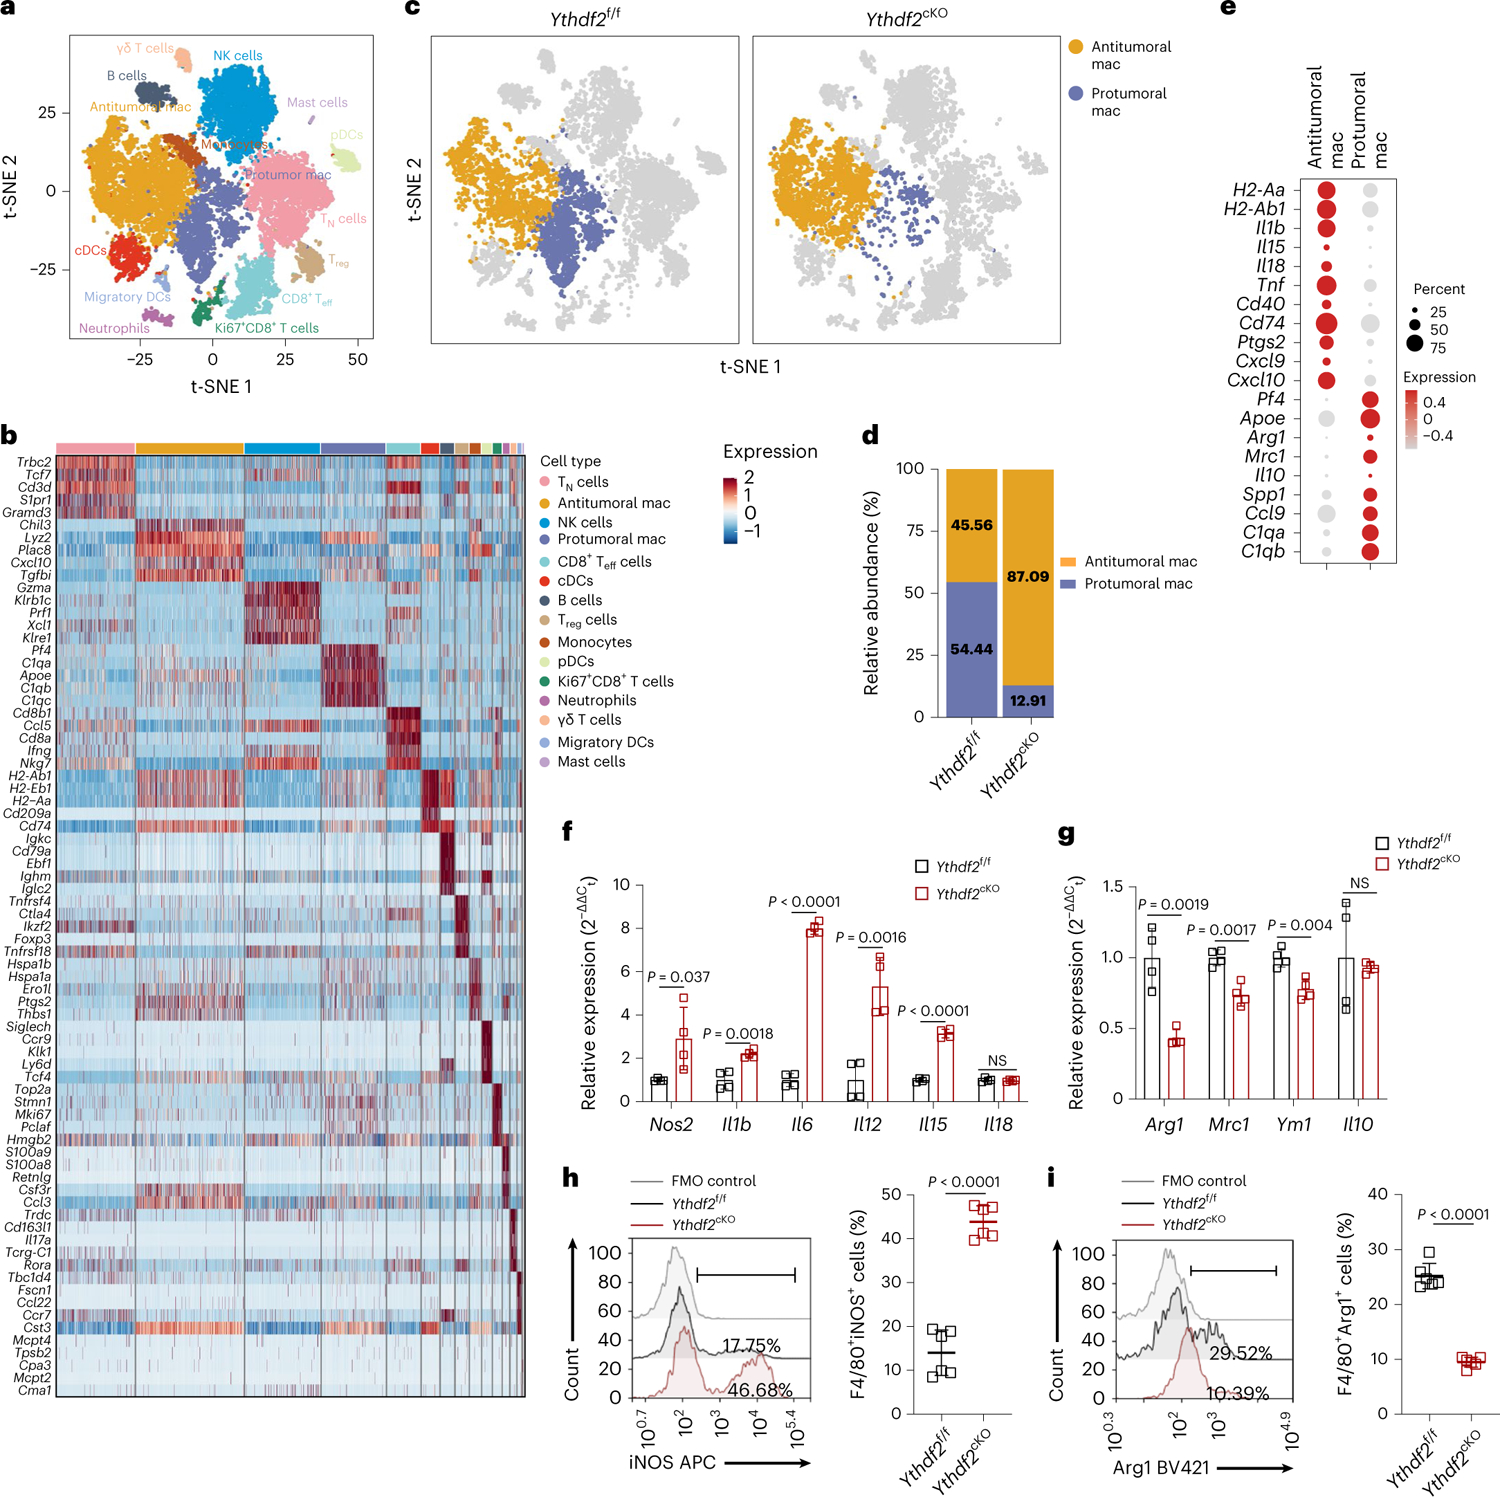
a, A t-SNE plot from scRNA-seq data showing 15 cell clusters of CD45+ tumor-infiltrating immune cells sorted from B16-OVA-bearing Ythdf2f/f and Ythdf2cKO mice on day 14 after B16-OVA tumor inoculation; mac, macrophages; pDC, plasmacytoid DC. b, Gene expression heatmap for 15 assigned cell clusters from the scRNA-seq data, as in a. Each column group is one cell, and each row represents one gene. Five representative marker genes of each cluster are labeled. c,d, t-SNE plots (c) and the proportions (d) of antitumoral and protumoral macrophages from scRNA-seq data, as in a. e, Dot plots showing the expression of representative marker genes of antitumoral and protumoral macrophages, as in a. Dot size indicates the percentage of cells expressing the indicated gene, and color intensity represents the relative gene expression level. f,g, qPCR showing mRNA expression of antitumoral macrophage-related genes (f; Nos2, Il1b, Il6, Il12, Il15 and Il18; n = 4) or protumoral macrophage-related genes (g; Arg1, Mrc1, Ym1 and Il10; n = 4) in CD11b+F4/80+ TAMs isolated from tumors of B16-OVA-bearing Ythdf2f/f and Ythdf2cKO mice. h,i, Representative histograms and percentages of CD11b+F4/80+iNOS+ antitumoral macrophages (h; n = 6) or CD11b+F4/80+Arg1+ protumoral macrophages (i; n = 6) in tumors from B16-OVA-bearing Ythdf2f/f and Ythdf2cKO mice. Data are shown as mean ± s.d. and were analyzed with an unpaired two-tailed t-test (f–i). Data in f–i are representative of at least two independent experiments.
YTHDF2 regulates the antigen cross-presentation of macrophages
Macrophages can favor T cell-mediated antitumor responses not only by secreting proinflammatory cytokines but also by presenting tumor antigens on major histocompatibility complex class I (MHC class I) and MHC class II to CD8+ and CD4+ T cells, respectively29. We found a larger proportion of B16-OVA tumor-infiltrating effector CD8+ T cells (CD8+ Teff cells; expressing Cd8a, Cd8b1, Cd3g, Ifng, Gzmb, Gzma and Prf1) in Ythdf2cKO mice than in Ythdf2f/f mice (Fig. 4a). In addition, we observed that the CD8+ T cell cluster from Ythdf2cKO mice had higher expression of gene signatures specific for early activated, cytokine/effector, memory and memory precursor states30 (Fig. 4b), indicating that YTHDF2-deficient macrophages correlated with CD8+ T cell activation and effector functions in the TME.
Fig. 4 |. YTHDF2 deficiency enhances antigen cross-presentation ability of antitumoral macrophages.
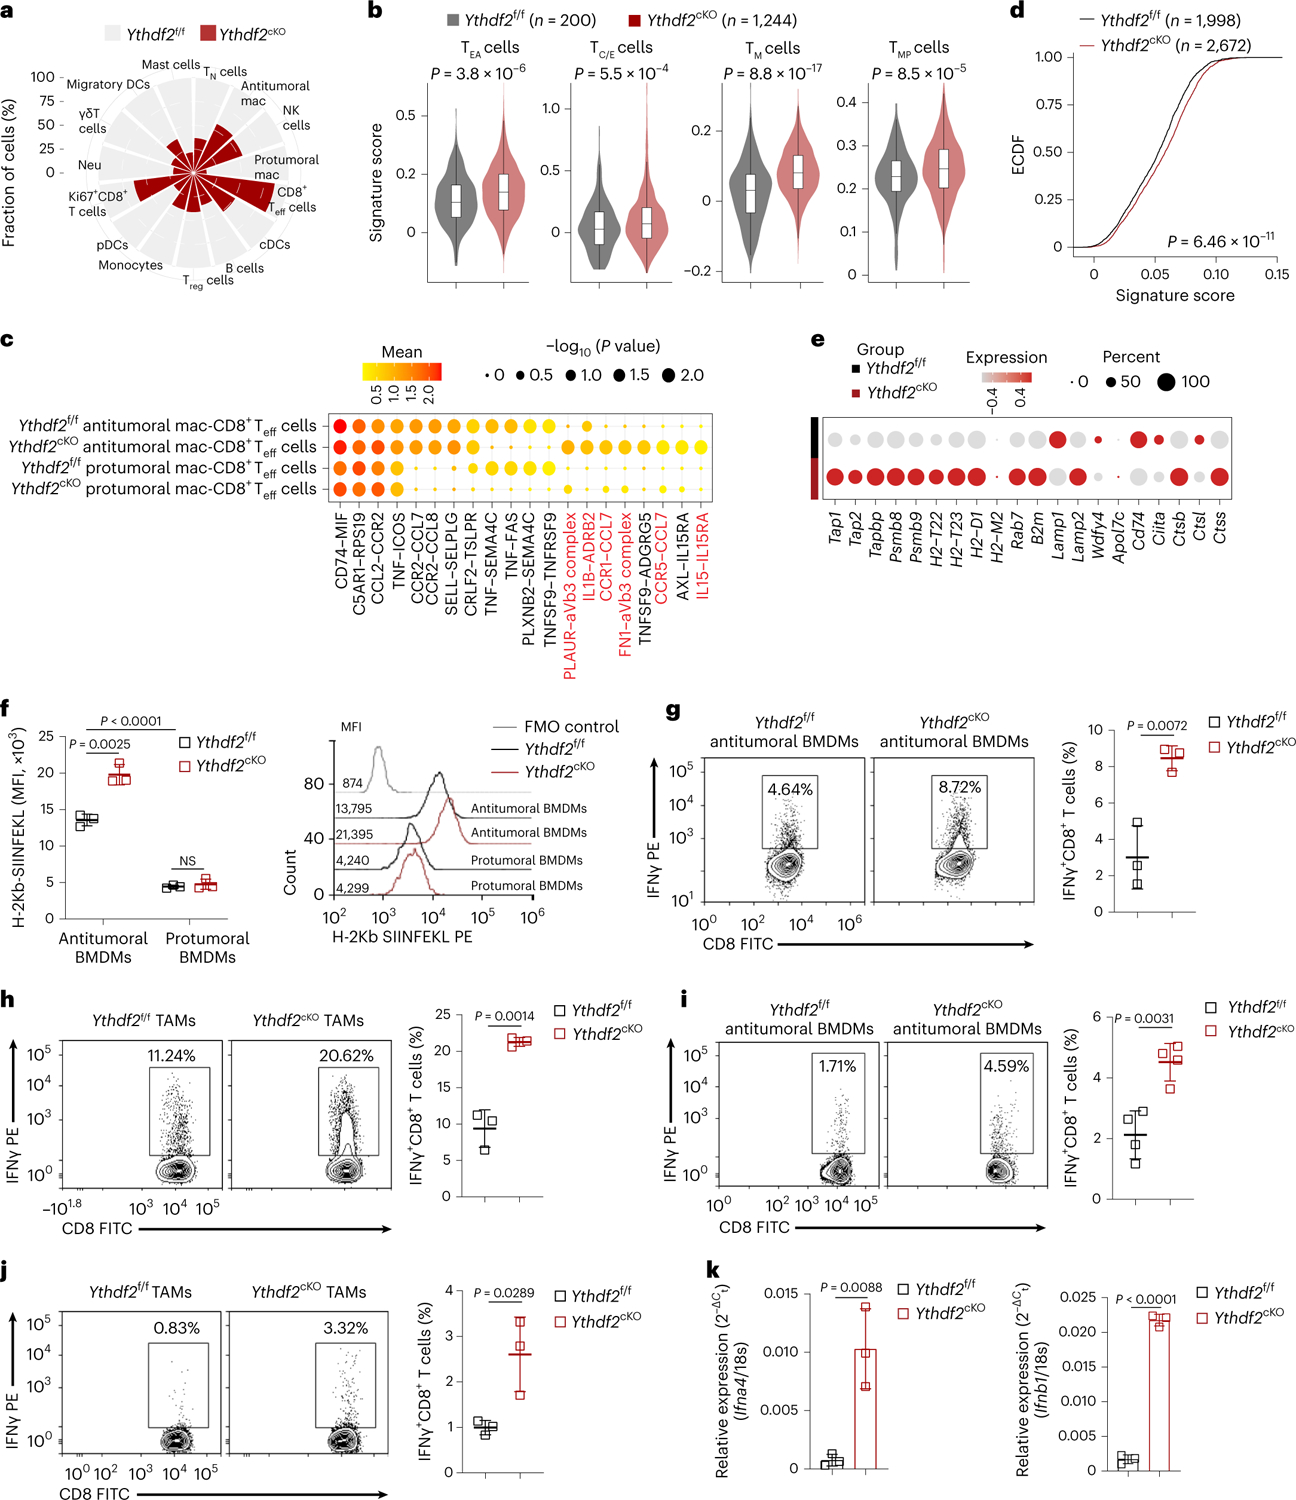
a, Rose diagram showing the proportions of 15 cell types in Ythdf2f/f and Ythdf2cKO mice. b, Violin plots showing the enrichment of signatures of early activated (TEA), cytokine/effector (TC/E), memory (TM) and memory precursor (TMP) CD8+ T cells in scRNA-seq data from CD45+ tumor-infiltrating immune cells sorted from Ythdf2f/f and Ythdf2cKO mice on day 14 after B16-OVA tumor inoculation. The horizontal line indicates the median value, and the box represents the first and third quartiles. P values were calculated by two-sided Wilcoxon rank-sum test. c, Dot plots showing mean strength of selected ligand–receptor pairs of antitumoral and CD8+ Teff cells. Dot size indicates the mean strength level, and color shows the P values calculated by the permutation test. d, Empirical cumulative distribution function (ECDF) plot of enrichment score for the MHC class I gene signature in antitumoral macrophages from Ythdf2f/f and Ythdf2cKO mice in scRNA-seq. Data were analyzed by two-sided unpaired Wilcoxon test. e, Dot plots showing expression features of selected genes from the MHC class I presentation signature in antitumoral macrophages from Ythdf2f/f and Ythdf2cKO mice in scRNA-seq. Dot size indicates the percentage of cells expressing the indicated gene, and color intensity represents the relative gene expression level. f, Representative histograms and percentages of H-2Kb SIINFEKL-positive antitumoral or protumoral macrophages in tumor tissues from Ythdf2f/f and Ythdf2cKO mice on day 14 after B16-OVA tumor inoculation (n = 3). g–j, Representative plots and percentages of IFNγ-producing OT-I CD8+ T cells cocultured with the SIINFEKEL peptide (g and i) or the OVA protein (h and j)-loaded antitumoral BMDMs (g, n = 3; h, n = 4) or CD11b+F4/80+ TAMs isolated from B16-OVA tumor-bearing mice on day 14 after B16-OVA tumor inoculation (i, n = 3; j, n = 3). k, qPCR showing the expression of Ifng4 and Ifnb1 from CD11b+F4/80+ macrophages isolated from B16-OVA tumor-bearing Ythdf2f/f and Ythdf2cKO mice on day 14 after B16-OVA tumor inoculation (n = 3). Data are representative of at least three independent experiments, are shown as mean ± s.d. and were analyzed by unpaired two-tailed t-test (f–k).
Using the cell–cell communication analytical tool in CellPhoneDB31, we found some unique interactions between tumor-infiltrating Ythdf2cKO antitumoral macrophages and CD8+ Teff cells that were strongly associated with MHC class I cross-presentation, leukocyte recruitment and T cell activation (PLAUR–αVβ3, CCR1–CCL7, IL-1β–ADRB2 and IL-15–IL-15RA; Fig. 4c). Ythdf2cKO macrophages also exhibited a higher MHC class I gene signature score (Fig. 4d), in which several genes related to MHC class I antigen presentation30 (including Tap1, Tap2, Tapbp, Psmb8, Psmb9, H2-T22, H2-T23, H2-D1, Rab7, B2m, Lamp2, Ctsb and Ctss) were upregulated compared to in Ythdf2f/f macrophages (Fig. 4e). Flow cytometric analysis showed that antitumoral macrophages presented more H-2Kb-SIINFEKL complexes than protumoral macrophages, regardless of the Ythdf2f/f or Ythdf2cKO genotype (Fig. 4f), consistent with reports that antitumoral macrophages can cross present antigen29. Expression of H-2Kb-SIINFEKL complexes was higher in Ythdf2cKO antitumoral macrophages than in Ythdf2f/f antitumoral macrophages (Fig. 4f). Moreover, an in vitro antigen presentation assay showed that Ythdf2cKO antitumoral BMDMs or TAMs isolated from B16-OVA Ythdf2cKO mice cross-primed CD8+ T cells for both the SIINFEKL peptide and the OVA protein better than their Ythdf2f/f counterparts, as evidenced by their greater production of IFNγ (Fig. 4g–j). Type I IFNs (IFNα/IFNβ) are key for the induction of antigen cross-presentation32. TAMs isolated from B16-OVA tumor-bearing Ythdf2cKO mice expressed more Ifna4 and Ifnb1 mRNA than their Ythdf2f/f counterparts (Fig. 4k). These results suggested that YTHDF2-deficient macrophages had increased abilities for antigen cross-presentation and activation of CD8+ T cells.
YTHDF2 deficiency reprograms macrophages through IFNγ–STAT1 signaling
The transcription factors STAT1 and NF-κB are downstream of IFNγ receptor and lipopolysaccharide (LPS)/Toll-like receptor 4 (TLR4) signaling, respectively, and contribute to the induction of an antitumoral phenotype in macrophages33. Ingenuity Pathway Analysis showed that the IFN signaling pathway and activation of IFN regulatory factors by cytosolic pattern recognition receptors rather than the TLR4–NF-κB pathway were enriched in B16-OVA tumor-infiltrating Ythdf2cKO antitumoral macrophages (Extended Data Fig. 5a). Gene set enrichment analysis (GSEA) of scRNA-seq data indicated that IFNγ response genes, including transcripts encoding IFNγ signaling transduction (Stat1 and Irf1), IFN-stimulated genes (Isg15, Isg20, Ifit1, Ifit2 and Ifit3), antigen presentation genes (B2m, Tap1 and Tapbp) and function genes (Ccl2, Cxcl9, Cxcl10, Il15 and Il18), were enriched and significantly upregulated in B16-OVA tumor-infiltrating Ythdf2cKO antitumoral macrophages compared to in their Ythdf2f/f counterparts (Fig. 5a–c). qPCR confirmed that most of those genes were significantly upregulated in IFNγ-treated BMDMs from Ythdf2cKO mice compared to those from Ythdf2f/f mice (Extended Data Fig. 5b). B16-OVA tumor TAMs from Ythdf2cKO mice had higher expression of Stat1 mRNA and higher STAT1 phosphorylation than Ythdf2f/f mice (Extended Data Fig. 5c,d). Ythdf2cKO BMDMs had higher STAT1 phosphorylation and quicker responses to IFNγ stimulation than Ythdf2f/f BMDMs (Fig. 5d). Knockdown of Stat1 by siRNA in Ythdf2cKO BMDMs (Extended Data Fig. 5e) abolished the difference in the expression of Il15 and Cxcl9 (two important antitumoral macrophage signature genes downstream of IFNγ) observed in Ythdf2f/f and Ythdf2cKO BMDMs in vitro (Fig. 5e). We also knocked out Stat1 in Ythdf2f/f and Ythdf2cKO BMDMs by CRISPR–Cas9. Co-inoculation of Ythdf2cKO BMDMs (in which Stat1 mRNA was knocked down with siRNA (Fig. 5f) or knocked out with CRISPR–Cas9 (Fig. 5g and Extended Data Fig. 5f)) with B16-OVA cells in C57BL/6 mice showed similar tumor growth on day 15 after inoculation as mice co-inoculated with Ythdf2f/f BMDMs. The increased antitumor response in the Ythdf2cKO mice was completely lost in Ythdf2cKO mice i.p. injected with an IFNγ antibody (Fig. 5h). Co-inoculation of Ythdf2cKO BMDMs (in which Ifngr1 was disrupted with CRISPR–Cas9 (Extended Data Fig. 5g)) with B16-OVA cells in C57BL/6 mice showed similar tumor growth on day 13 after inoculation as mice co-inoculated with Ythdf2f/f BMDMs (Fig. 5i). Rag1−/− mice that were i.v. injected with Ifng−/−CD8+ T cells and Ythdf2cKO BMDMs had similar tumor growth as Rag1−/− mice that received Ifng−/−CD8+ T cells and Ythdf2f/f BMDMs (Extended Data Fig. 5h). Collectively, these results suggested that YTHDF2 deficiency induced an antitumoral phenotype by regulating the IFNγ–STAT1 signaling pathway in macrophages.
Fig. 5 |. YTHDF2 deficiency drives antitumoral macrophage polarization via IFNγ–STAT1 signaling.
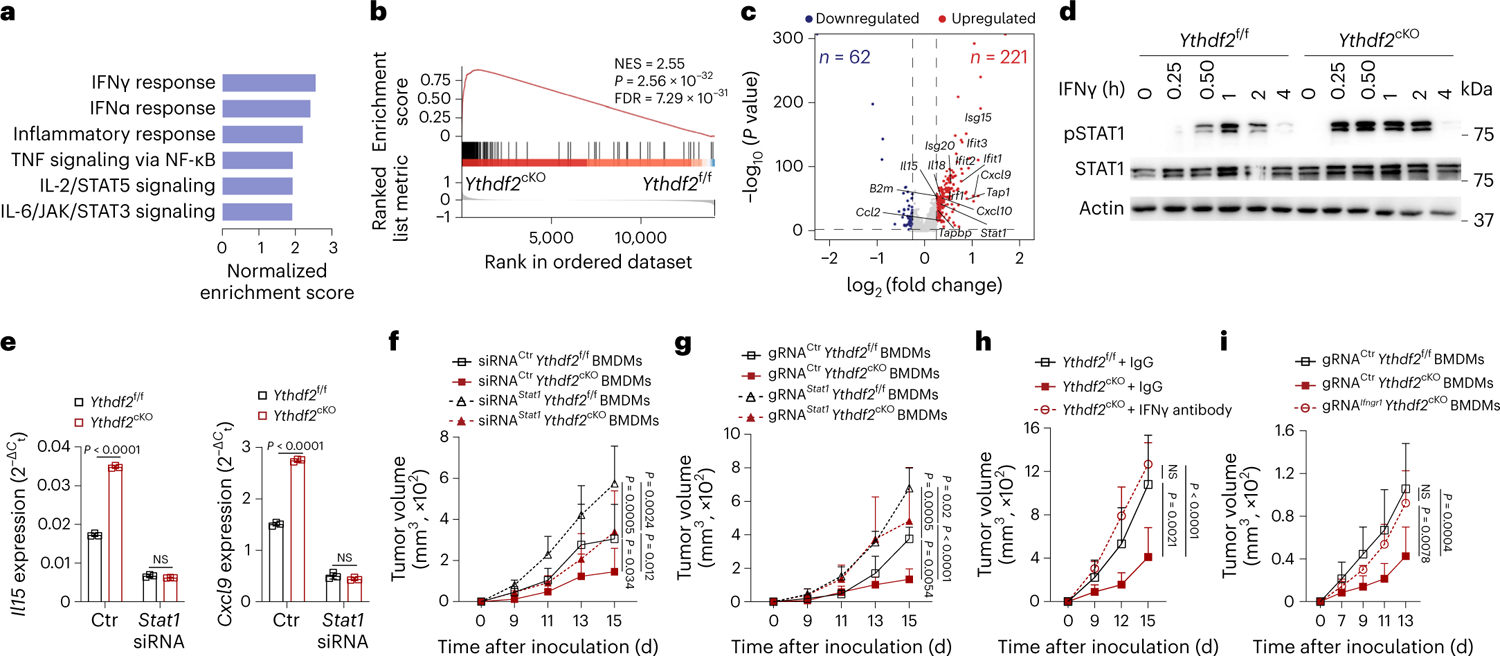
a, Top six enriched pathways in Ythdf2cKO antitumoral macrophages compared to the Ythdf2f/f macrophages from GSEA. b, Enrichment of the IFNγ response in antitumoral macrophages from Ythdf2cKO mice compared to those from Ythdf2f/f mice; NES, normalized enrichment score; FDR, false discovery rate. c, Volcano plot showing the DEGs between antitumoral macrophages from Ythdf2f/f mice and those from Ythdf2cKO mice. DEGs (differentially expressed genes) with an absolute log-transformed fold change of >0.25 and adjusted P value of <0.05 (determined by two-sided Wilcoxon rank-sum test and adjusted using the Bonferroni correction) were defined as significant. d, Immunoblotting assay of STAT1 phosphorylation (pSTAT1) in IFNγ-treated BMDMs from Ythdf2f/f and Ythdf2cKO mice. e, qPCR of Il15 and Cxcl9 mRNA expression in antitumoral macrophages transfected with Stat1 siRNA or control siRNA (n = 3). f, B16-OVA tumor growth on day 15 after tumor inoculation in immunocompetent C57BL/6 mice transplanted with Stat1-knockdown (siRNAStat1) or control (siRNACtr) BMDMs from Ythdf2f/f or Ythdf2cKO mice (n = 5). g, B16-OVA tumor growth on day 15 after tumor inoculation in immunocompetent C57BL/6 mice transplanted with Stat1-knockout (gRNAStat1) or control (gRNACtr) BMDMs from Ythdf2f/f or Ythdf2cKO mice (n = 5); gRNA, guide RNA. h, B16-OVA tumor growth on day 15 after tumor inoculation in Ythdf2f/f and Ythdf2cKO mice treated with IgG or IFNγ antibody (Ythdf2f/f + IgG, n = 5; Ythdf2cKO + IFNγ antibody, n = 5; Ythdf2cKO + IgG, n = 4). i, B16-OVA tumor growth on day 13 after tumor inoculation in immunocompetent C57BL/6 mice transplanted with Ifngr1-knockout BMDMs (gRNAIfngr1) from Ythdf2cKO mice (n = 5) or control (gRNACtr) BMDMs from Ythdf2f/f or Ythdf2cKO mice (n = 5). Data are shown as mean ± s.d. and were analyzed by one-way ANOVA with a Holm–Šídák post test (e) or two-way ANOVA with mixed-effects model followed by a Holm–Šídák post test (f–i). Data in d–i are representative of at least two independent experiments.
YTHDF2 decreases the stability of Stat1 mRNA in macrophages
m6A sequencing and m6A peak calling and motif enrichment analysis identified the m6A consensus motif GGAC in BMDMs from both Ythdf2f/f and Ythdf2cKO mice (Extended Data Fig. 6a), indicating successful enrichment of m6A. The m6A modifications were mainly in protein-coding transcripts and were abundant in coding sequences and 3′ untranslated regions (UTRs) and were near stop codons (Extended Data Fig. 6b,c). RNA-seq indicated that 213 genes, including Stat1, were upregulated, and 72 genes were downregulated in antitumoral BMDMs from Ythdf2cKO mice compared to those from Ythdf2f/f mice (Extended Data Fig. 6d). GSEA showed significant enrichment of the IFNγ response (Extended Data Fig. 6e,f). YTHDF2-deficient hematopoietic stem cells display activated proinflammatory pathways34, and proinflammatory signals are known to drive the activation and polarization of macrophages35. Ythdf2cKO BMDMs showed upregulation of transcripts involved in multiple proinflammatory pathways, such as Ifng, Tnf, Ifna, Irf7, Tlr4 and Stat1, compared to those from Ythdf2f/f mice (Extended Data Fig. 6g), and 49% of these upregulated transcripts were m6A modified (Extended Data Fig. 6g), indicating that YTHDF2 acted as a repressor of the inflammatory response in macrophages.
Next, we performed RNA immunoprecipitation sequencing (RIP–seq) using a YTHDF2 antibody to map direct target transcripts bound by YTHDF2 in antitumoral BMDMs. The results were highly reproducible between two biological replicates (Extended Data Fig. 6h). The YTHDF2-binding peaks were predominantly in the coding region, the 3′ UTR and the stop codon (Extended Data Fig. 6i,j). Integrative Genomics Viewer indicated a good fit between the m6A peaks and the YTHDF2-binding peaks in the 3′ UTR of Stat1 (Fig. 6a). There were two m6A modification sites within the 3′ UTR of Stat1 (Fig. 6b). qPCR and RIP with either anti-m6A or anti-YTHDF2 indicated that two Stat1 sites in the 3′ UTR were m6A methylated and enriched in YTHDF2 binding in antitumoral BMDMs compared to RIP with IgG (Fig. 6c,d). mRNA stability assays showed that the half-life of Stat1 mRNA was increased in antitumoral BMDMs from Ythdf2cKO mice compared to those from Ythdf2f/f mice (Fig. 6e). A firefly luciferase reporter assay using a construct containing the wild-type Stat1 m6A methylation sites (GGAC) or mutant sites (GGGC) of each or both at 3′ UTR showed that the normalized luciferase activity of the reporter containing the wild-type site in Ythdf2cKO BMDMs was significantly higher than in Ythdf2f/f BMDMs, but mutations in either one or both of the Stat1 m6A motifs abolished the increased luciferase activity observed in Ythdf2cKO BMDMs (Fig. 6f), suggesting that m6A methylation in the Stat1 3′ UTR could be responsible for the stability of Stat1 mRNA. These observations indicated that YTHDF2 deficiency induced an antitumoral phenotype at least in part by reducing the stability of Stat1 mRNA in macrophages.
Fig. 6 |. YTHDF2 decreases stability of Stat1 mRNA in macrophages.

a, Integrative Genomics Viewer tracks displaying the distribution of m6A peaks and YTHDF2-binding peaks across the Stat1 transcripts. b, Schematic representation of m6A positions and mutations within the Stat1 3′ UTR; Mut, mutant; chr, chromosome. c,d, RIP using either an antibody to m6A (c; n = 3) or to YTHDF2 (d; n = 3) followed by qPCR in antitumoral macrophages showing that the two Stat1 sites in the 3′ UTR region were m6A methylated and enriched in YTHDF2 binding. Rabbit IgG served as a control. Enrichment of the indicated genes was normalized to the input level. e, mRNA half-life (t1/2) of Stat1 transcripts in antitumoral macrophages from Ythdf2f/f and Ythdf2cKO mice. The two slopes for the two groups were compared by t-test under the linear regression model frame taking into account the time by group interaction. f, Relative luciferase activity of firefly luciferase (F-Luc)/Renilla luciferase (R-Luc) of pmirGLO-3′UTR-WT, pmirGLO-3′UTR-Mut-1, pmirGLO-3′UTR-Mut-2 or pmirGLO-3′UTR-Mut-1 plus pmirGLO-3′UTR-Mut-2 in Ythdf2f/f and Ythdf2cKO BMDMs (n = 3). Data are shown as mean ± s.d. and were analyzed by unpaired two-tailed t-test (c, d and f). Data in c, d, e and f are representative of at least two independent experiments.
IL-10–STAT3 signaling regulates YTHDF2 expression in TAMs
Next, we investigated how factors in the TME could regulate the expression of YTHDF2 in TAMs. CD11b+F4/80+ TAMs isolated from MC38 tumors had a moderately higher expression level of YTHDF2 than those isolated from the spleens of MC38 tumor-bearing Ythdf2f/f mice (Extended Data Fig. 7a). The polarization of TAMs is directly controlled by cytokines within the TME36. Stimulation of BMDMs from Ythdf2f/f mice with IFNγ, IL-4, IL-10 and TGF-β indicated that IL-10 had the strongest effect in inducing YTHDF2 expression compared to other cytokines and acted in a dose-dependent manner (Extended Data Fig. 7b,c). Binding of IL-10 to the IL-10 receptor activates the JAK1–STAT3 cascade37. Analysis of the Encyclopedia of DNA Elements (ENCODE) chromatin immunoprecipitation sequencing (ChIP–seq) data in ChIP-Base and the Animal Transcription Factor DataBase to identify putative transcription factors that directly regulated YTHDF2 expression indicated that STAT3 bound to YTHDF2. Of note, JASPAR (http://jaspar.genereg.net) predicted three binding sites for STAT3 in the promoter regions of the mouse Ythdf2 gene (Extended Data Fig. 7d), and STAT3 directly activated a Ythdf2 luciferase reporter expressed in BMDMs (Extended Data Fig. 7e). ChIP–qPCR showed significant enrichment of STAT3 in the Ythdf2 gene promoter in IL-10-stimulated BMDMs compared to IgG control (Extended Data Fig. 7f). In addition, YTHDF2 was significantly decreased in IL-10-stimulated BMDMs from Stat3f/fLyz2Cre mice (hereafter, Stat3cKO mice) compared to those from Stat3f/f mice (Extended Data Fig. 7g). These findings indicated that IL-10–STAT3 signaling modulated YTHDF2 expression in TAMs.
YTHDF2 is a therapeutic target for cancer immunotherapy
Although as of yet there are no small-molecule inhibitors of YTHDF2, gene silencing using oligonucleotide-based therapeutics, such as siRNA, is showing promise against cancers and other diseases38. CpG ODN, a TLR9 agonist, can be efficiently internalized by antigen-presenting cells, such as DCs and macrophages, through binding to TLR9 (refs.39,40). We evaluated whether TLR9-targeted Ythdf2 silencing could reprogram TAMs, promote antitumor immunity and suppress tumor growth. Based on our scRNA-seq data, Tlr9 was mainly expressed by protumoral macrophages within the TME (Extended Data Fig. 8a). Using a synthetic carbon linker, we conjugated Ythdf2 siRNA to single-stranded CpG1668 ODN labeled with Cy3 dye (hereafter, Cy3–CpG–siRNAYthdf2; Extended Data Fig. 8b). In vitro and in vivo uptake assays showed that BMDMs and TAMs in B16-OVA tumors from Ythdf2f/f mice could efficiently take up Cy3–CpG–siRNAYthdf2 (Extended Data Fig. 8c–e). qPCR in TAMs sorted from B16-OVA tumors in Ythdf2f/f mice that received intratumoral (i.t.) injection of CpG–siRNAYthdf2 showed that Ythdf2 mRNA was significantly lower than in cells isolated from B16-OVA-bearing Ythdf2f/f mice injected with CpG–control siRNA (hereafter, CpG–siRNACtrl; Extended Data Fig. 8f). CpG–siRNAYthdf2 injection i.t. resulted in a 2.5-fold increase in CD11b+F4/80+iNOS+ antitumoral macrophages and a 1-fold decrease in CD11b+F4/80+Arg1+ protumorigenic macrophages in B16-OVA-bearing Ythdf2f/f mice compared to those treated with CpG–siRNACtrl (Extended Data Fig. 8g,h).
Delivery of CpG–siRNAYthdf2 i.t. on days 7, 9, 11 and 13 after tumor inoculation in C57BL/6 mice bearing B16-OVA and MC38 tumors significantly inhibited tumor growth compared to delivery of CpG–siRNACtrl (Fig. 7a). Similarly, i.v. injection of CpG–siRNAYthdf2 on days 7, 9, 11 and 13 in C57BL/6 mice that received i.v. injection of B16F10 melanoma cells inhibited tumor lung metastasis compared to mice injected with CpG–siRNACtrl (Extended Data Fig. 8i,j). A significantly higher percentage of intratumoral IFNγ-producing CD8+ T cells was detected in mice treated with CpG–siRNAYthdf2 than in mice treated with CpG–siRNACtrl in B16-OVA, MC38 and B16F10 tumor models (Fig. 7b and Extended Data Fig. 8k). DCs express TLR9 (Extended Data Fig. 8a) and can be activated by CpG41. Compared to CpG–siRNACtrl, treatment with CpG–siRNAYthdf2 inhibited tumor growth in B16-OVA tumor-bearing Batf3−/−mice, which lack conventional type 1 DCs (cDC1s42; Extended Data Fig. 8l), indicating that cDC1s are not essential for tumor regression induced by CpG–siRNAYthdf2. A relatively high expression of TLR9 in TAMs in some cancers was found by leveraging scRNA-seq datasets24,43 (Extended Data Fig. 8m,n). Continuous IFNγ stimulation can upregulate PD-L1 in cancer cells and macrophages and inactivate the antitumor T cell responses44. PD-L1 expression was significantly upregulated in B16-OVA cells and BMDMs treated with IFNγ (Extended Data Fig. 8o,p). B16-OVA tumor-bearing mice treated with a combination of CpG–siRNAYthdf2 and anti-PD-L1 had reduced tumor growth and increased CD8+ cytotoxic T cell responses compared to treatment with CpG–siRNAYthdf2 alone or anti-PD-L1 alone (Fig. 7c). As such, silencing YTHDF2 by targeted delivery of CpG–siRNAYthdf2 to TAMs promoted antitumor immunity and inhibited tumor growth.
Fig. 7 |. TLR9-targeted YTHDF2 silencing in TAMs suppresses tumor growth and displays a better effect when combined with anti-PD-L1.
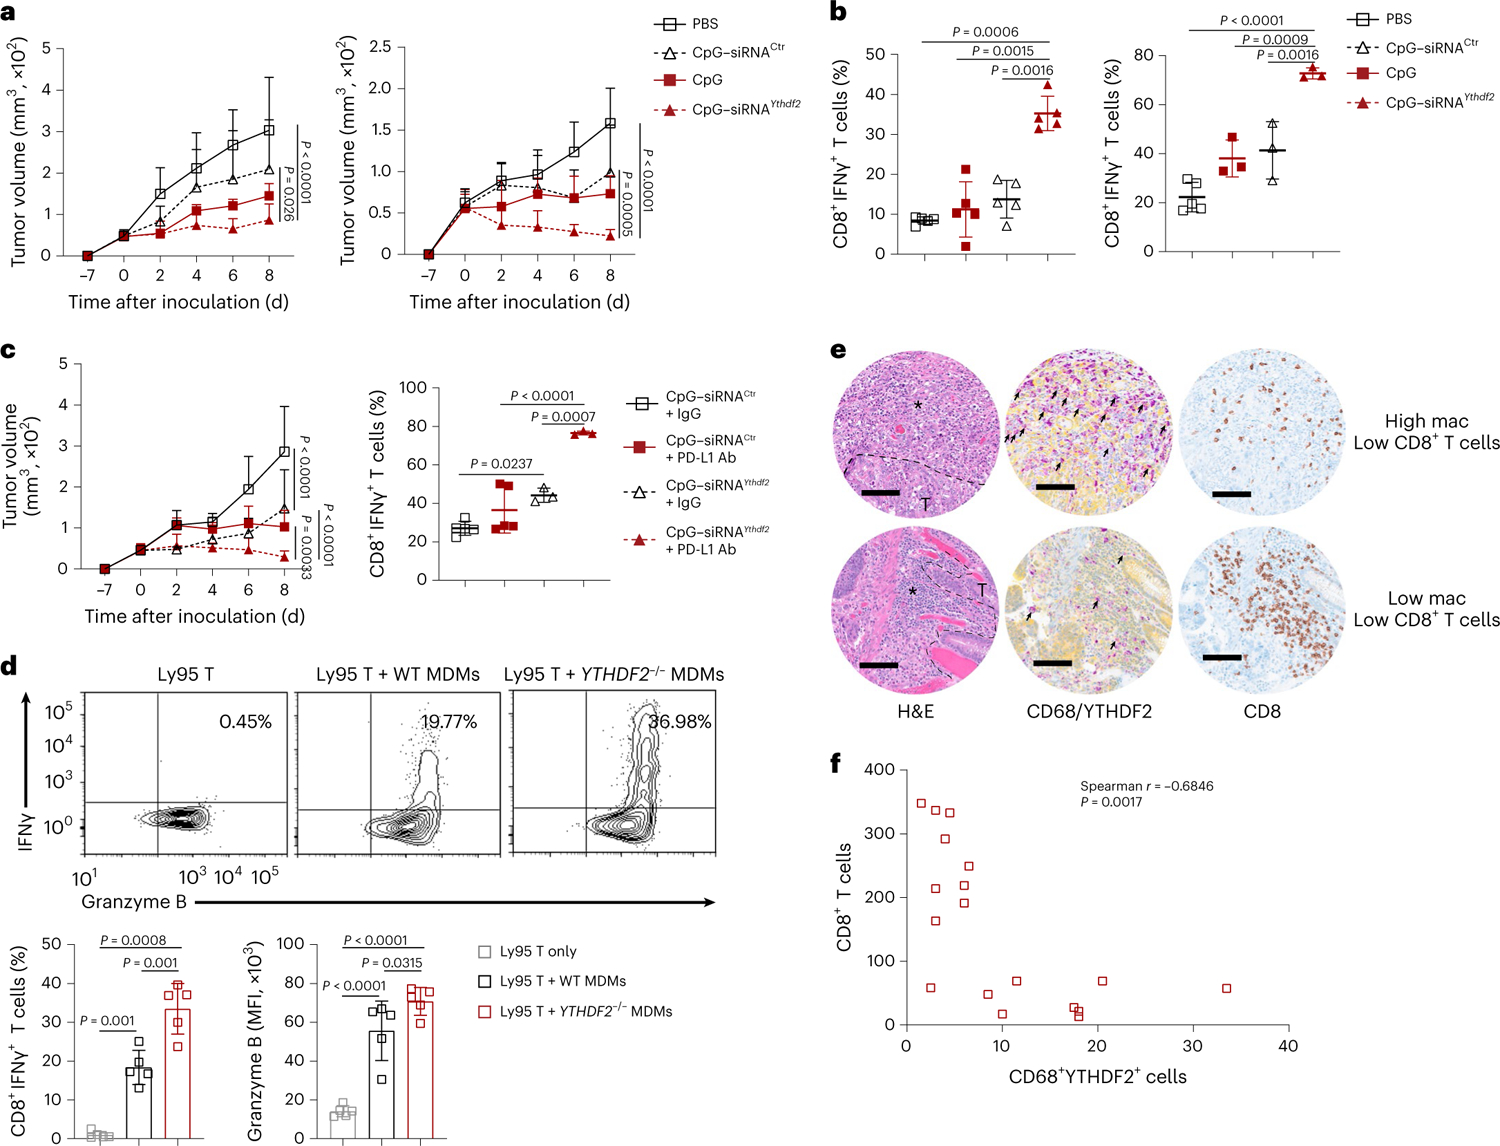
a, B16-OVA (left; n = 5) or MC38 (right; n = 5) tumor growth in mice i.t. injected with CpG–siRNAYthdf2, CpG–siRNACtrl, CpG or PBS 7, 9, 11 and 13 days after tumor inoculation on day −7. Data on day 8 were used for statistical analysis. b, Percentages of tumor-infiltrating IFNγ-producing CD8+ T cells on day 8 in B16-OVA (n = 5) or MC38 tumor models (PBS, n = 5; CpG, n = 3; CpG–siRNACtrl, n = 3; CpG–siRNAYthdf2, n = 3), as described in a. c, B16-OVA tumor growth in mice treated with CpG–siRNAYthdf2, CpG–siRNACtrl or in combination with anti-PD-L1 (left; CpG–siRNACtrl + IgG, n = 5; CpG–siRNAYthdf2 + IgG, n = 5; CpG–siRNACtrl + PD-L1 antibody, n = 6; siRNAYthdf2 + PD-L1 antibody, n = 6) and percentages of tumor-infiltrating IFNγ-producing CD8+ T cells (right; CpG–siRNACtrl + IgG, n = 5; CpG–siRNAYthdf2 + IgG, n = 3; CpG–siRNACtrl + PD-L1 antibody, n = 5; siRNAYthdf2 + PD-L1 antibody, n = 3). CpG–siRNACtrl and CpG–siRNAYthdf2 were treated as in a, while PD-L1 antibody was injected on days −7 and 0. Data on day 8 were used for statistical analysis. d, Representative plots and percentages of IFNγ and granzyme B expression in Ly95 T cells when cocultured with wild-type (WT) or YTHDF2−/− MDMs preloaded with NY-ESO157-C165 peptide (n = 5); MFI, median fluorescence intensity. e, Hematoxylin and eosin (H&E) staining and immunohistochemical staining of YTHDF2 (yellow) plus CD68 (purple) or CD8 (brown) in tumor tissues from individuals with COAD. Dashed lines outline the edge of tumor (T) zones. Asterisks mark the stroma tissues. A representative specimen of YTHDF2+CD68+ (double positive) with a high (top) or low (bottom) number of cells is shown (f); scale bars, 100 μm. Black arrows mark YTHDF2+CD68+ cells. f, Correlations between YTHDF2+CD68+ cells and CD8+ T cells in the stroma area as in e are shown (n = 18). Data are shown as mean ± s.d. and were analyzed by one-way ANOVA with a Holm–Šídák post test (b, c right and d) or two-way ANOVA with mixed-effects model (a and c left) and were adjusted by a Holm–Šídák post test or Spearman correlation (f). Data in a, b, c and d are representative of at least two independent experiments.
Knockdown of YTHDF2 in human monocyte-derived macrophages (MDMs) using siRNA targeting human YTHDF2 (YTHDF2−/− MDMs) enhanced the expression of proinflammatory cytokines, such as IL1B, IL6 and IL12, compared to control MDMs (Extended Data Fig. 9a). To test the ability of YTHDF2-deficient human macrophages to stimulate tumor-specific T cell responses, we used T cell antigen receptor (TCR)-transduced human T cells (Ly95 T cells) that recognize the HLA-A*0201-restricted human testis cancer antigen (NY-ESO-1)45,46. Ly95 T cells incubated with YTHDF2−/− MDMs preloaded with a NY-ESO157–165 peptide had significantly increased IFNγ and granzyme B expression compared to Ly95 T cells cocultured with peptide-preloaded wild-type MDMs (Fig. 7d), suggesting that the role of YTHDF2 in macrophages is conserved between humans and mice.
Next, we examined the expression of YTHDF2 protein by using immunohistochemical staining of tumor tissues from individuals with colon cancer or lung cancer. The number of YTHDF2+CD68+ macrophages in the tumor stroma tissues was inversely correlated with the number of tumor-infiltrating CD8+ T cells in these individuals (Fig. 7e,f and Extended Data Fig. 9b,c). In addition, analysis of human samples derived from SKCM from TCGA database revealed that low expression of YTHDF2 in tumor-infiltrating CD68+ macrophages is correlated with better overall survival than high expression of YTHDF2 in those cells (Extended Data Fig. 9d). Based on our mouse scRNA-seq, m6A-seq and RIP–seq datasets, we generated a signature of YTHDF2 target genes including 12 of them (TNFSF10, IFIT1, RSAD2, IFIT3, GBP3, CXCL10, STAT1, IL7R, CLEC4E, CCRL2, CD180 and CSF1; Extended Data Fig. 9e). High expression of the YTHDF2 signature genes was correlated with better overall survival than low expression of the YTHDF2 signature genes in individuals with SKCM (Extended Data Fig. 9f). Moreover, high expression of each gene in the YTHDF2 signature correlated with better overall survival than low expression of each of the 12 genes in individuals with SKCM (Extended Data Fig. 9g). Collectively, our findings indicate that YTHDF2 might represent a therapeutic target for cancer immunotherapy (Extended Data Fig. 10).
Discussion
Here, we have identified YTHDF2 as a regulator of antitumoral polarization in macrophages. We found that genetic deletion of YTHDF2 induced an antitumoral polarization in macrophages, thereby enhancing CD8+ T cell-mediated antitumor immunity. TLR9-targeted YTHDF2 silencing in macrophages suppressed tumor growth and showed a better effect when combined with PD-L1 blockade, indicating that YTHDF2 is a promising target for cancer immunotherapy.
A more specific mouse model may be needed to better characterize the role of YTHDF2 in macrophages. Lyz2Cre genetically targets gene deletion in myeloid lineage cells, mainly monocytes, macrophages and granulocytes27. However, only about 16% of splenic DCs express Lyz2 (refs.27,47). In our model, total splenic DCs had similar expression of YTHDF2 in Ythdf2f/f and Ythdf2cKO mice. Given that DCs, and cDC1s specifically, are specialized for priming CD8+ T cell responses through antigen cross-presentation42, further studies are warranted to explore the role of YTHDF2 in DCs using appropriate Cre models. In addition, because we documented leaky expression of YTHDF2 in BMDMs (5%) in Ythdf2cKO mice compared to those in Ythdf2f/f mice, more dramatic effects may be observed if complete deletion of YTHDF2 is achieved.
Small-molecule inhibitors targeting m6A modifiers, such as FTO, ALKBH5 and METTL3, were reported as a promising strategy for cancer therapy11,12,48. However, specific inhibitors for m6A readers, including YTHDF2, have not been reported. One possible reason is that the readers may share the same or overlapping binding sites of the target gene but exert opposite functions, which can result in beneficial and detrimental effects simultaneously. Here, we targeted YTHDF2 in TAMs by using TLR9-targeted CpG–siRNA. Our use of CpG–siRNAYthdf2 showed profound antitumor effects in mice and could be used as a potential clinical strategy alone for in situ immunotherapy against cancer or in combination with PD-L1 antibody therapy. Our study provides proof-of-concept evidence that targeting YTHDF2 in macrophages can reshape the TME to be more inflammatory. However, expression of TLR9 is not restricted to TAMs. DCs and B cells also express TLR9 (ref.39). The observations that CpG–siRNAYthdf2 inhibited tumor growth in Batf3−/− mice, which lack cDC1s, suggested that cDC1s are not essential in mediating the in vivo antitumor effect of CpG–siRNAYthdf2. Thus, although our data suggested that knockdown of YTHDF2 in macrophages had a tumor suppressor role, we cannot exclude a similar contribution in B cells.
Immune checkpoint inhibitors have revolutionized cancer treatment and improved the survival of individuals in the clinic. However, individuals with cancer can quickly develop resistance, such that only approximately 30% of individuals benefit from immune checkpoint therapy44,49,50. Combinational therapies usually result in better outcomes than monotherapies, and this can be the case for checkpoint blockade-based cancer immunotherapy1. Elucidation of an epigenetic mechanism (for example, m6A modifications) in tumor cells and immune cells may help to better understand the immune resistance mechanisms of immune checkpoint therapy and provide us with superior opportunities for combinational therapies7. In the current study, we showed that targeting the m6A reader YTHDF2 in TAMs enhanced both innate and adaptive immune responses to tumor cells, which reversed the immunosuppressive TME. Further optimizing this combination therapy may overcome the resistance of immune checkpoint therapy and increase the survival of individuals treated with the inhibitors.
Method
Mice
Ythdf2f/f mice, generated as previously described51, were crossed with Lyz2Cre mice (The Jackson Laboratory) to generate Ythdf2cKO mice. Rag1−/− mice were kindly provided by Z. Sun (City of Hope National Medical Center). Stat3f/fLyz2Cre mice were kindly provided by H. Yu (City of Hope National Medical Center). NCI B6-Ly5.1/Cr mice (CD45.1 mice) were purchased from Charles River Laboratories. OT-I (003831) and Ifng−/− (002287) mice were purchased from The Jackson Laboratory. Wild-type C57BL/6 mice were purchased from The Jackson Laboratory. Batf3−/− mice were kindly provided by M. Kortylewski (City of Hope National Medical Center). All experimental mice were bred and maintained under specific pathogen-free conditions. Six- to 12-week-old mice of both sexes were used for the experiments. Cre– littermates were used as controls. Mice were housed in the City of Hope Animal Facility with a 12-h light/12-h dark cycle and temperatures of ~18–23 °C with 40–60% air humidity. All animal experiments were approved by the City of Hope Institutional Animal Care and Use Committee under protocol number 20003.
Cell lines
The mouse melanoma cell line B16F10 was provided by H. Yu (City of Hope National Medical Center). B16-OVA cells were provided by M. Kortylewski (City of Hope National Medical Center). The mouse colon adenocarcinoma cell line MC38 was provided by S. Priceman (City of Hope National Medical Center). HEK293T cells were purchased from ATCC. All cell lines were cultured in Dulbecco’s modified Eagle medium (Gibco) supplemented with 10% fetal bovine serum (FBS; Gibco). Cells were incubated at 37 °C with 5% CO2.
Human samples
Peripheral blood samples from deidentified healthy donors who consented to an Institutional Review Board-approved protocol (IRB 18238) were obtained from the Michael Amini Transfusion Medicine Center of City of Hope National Medical Center. Tumor biopsies from 18 individuals with colorectal cancer were previously described and obtained from the University of Chicago with informed consent14. The tissue microarray with 32 lung cancer tissues was provided by the pathology core at the City of Hope National Medical Center.
Tumor models and treatments
B16-OVA (2 × 10⁵) or MC38 (2 × 10⁵) cells were implanted s.c. into the flanks of 6- to 12-week-old male and female mice. The length (a) and width (b) of the tumors were measured starting on day 7 or 9 and every other day thereafter, and the tumor volume was calculated with the formula a × b2/2. The maximal tumor size was not over 15 mm in diameter, which complied with our approved animal protocol. For the lung metastatic melanoma model, B16F10 cells (1 × 10⁵) were injected i.v. into the mice. Fourteen days after injection, mice were killed for postmortem analysis. Metastatic nodules in the lung were analyzed macroscopically and counted. For CD8+ T cell depletion, mice were injected i.p. with 200 μg of anti-CD8 (clone 2.43, BioXcell) on days 0 and 7 after tumor inoculation. For macrophage depletion, mice were injected i.p. with 200 μl of liposomal clodronate (Encapsula NanoSciences) on days 0 and 7 after tumor inoculation. For neutralizing IFNγ in vivo, mice were injected i.p. with 200 μg of anti-IFNγ (clone XMG1.2, BioXcell) on days 0 and 7 after tumor inoculation. For cotransferring with macrophages, B16-OVA (2 × 10⁵) or MC38 (2 × 10⁵) cells were mixed with an equal number of BMDMs from Ythdf2f/f or Ythdf2cKO mice and implanted s.c. into the flanks of wild-type C57BL/6 mice or Rag1−/− mice injected i.v. with or without CD3+ T cells (5 × 10⁶). For knocking down Stat1 using siRNA, BMDMs were transfected with siGENOME mouse Stat1 siRNA (M-058881-02-0005, Horizon) at 100 nM using Lipofectamine 3000 (Invitrogen). Forty-eight hours later, cells were collected and mixed with an equal number of B16-OVA cells (2 × 10⁵) and were s.c. implanted into the flanks of wild-type mice.
Flow cytometry
Single-cell suspensions were prepared from the spleens and tumor tissues of Ythdf2f/f and Ythdf2cKO mice, as described previously51. Flow cytometry analysis and cell sorting were performed on a BD LSR-Fortessa X-20 and FACSAria Fusion flow cytometers (BD Biosciences), respectively. Data were analyzed using NovoExpress software (Agilent Technologies). The following fluorescent dye-labeled antibodies purchased from BD Biosciences, Biolegend or MBL were used in this study: CD3ε (145–2C11), CD4 (GK1.5), CD8 (53–6.7), CD8 (KT15), NK1.1 (PK136), CD11b (M1/70), CD11c (N418), CD45 (30-F11), CD45.1 (A20), CD45.2 (104), CD62L (MEL-14), CD44 (IM7), CD119 (GR20), Ly6C (HK1.4), Ly6G (IA8), F4/80 (BM8), MHC class II (M5/114.15.2), PD-L1 (MIH7), Gr-1 (RB6–8C5), IFNγ (XMG1.2), iNOS (CXNFT), Arg1 (A1exF5), anti-mouse H-2Kb bound to SIINFEKL (25-D1.16) and H-2Kb MuLV p15E tetramer-KSPWFTTL. H-2Kb SIINFEKL-PE was kindly provided by the NIH Tetramer Core Facility. For examining IFNγ production from T cells, cells were first stimulated with a leukocyte activation cocktail (50583, BD Biosciences) in the presence of the protein transport inhibitor brefeldin A for 6 h. Cells were stained with the indicated cell surface markers and fixed/permeabilized using a fixation/permeabilization kit (eBioscience). Cell pellets were resuspended in PBS with 2% FBS for fluorescence-activated cell sorting analysis. For isolating macrophages from spleens and tumor tissues from MC38-bearing mice, MC38 cells (2 × 10⁵) were s.c. implanted into the flanks of wild-type C57BL/6 mice. Fourteen days after tumor inoculation, single-cell suspensions were prepared from the spleens and pooled tumor tissues. Macrophages (CD11b+F4/80+) were sorted using a FACSAria Fusion flow cytometer (BD Biosciences). The gating strategy for DCs, TAMs and MDSCs from tumor tissues is shown in Supplementary Fig. 1.
Differentiation and polarization of BMDMs
Bone marrow was extracted from the femurs and tibias of Ythdf2f/f and Ythdf2cKO mice. All bone marrow cells were flushed out and filtered through a 70-μm cell strainer. After centrifugation, red blood cells were lysed. The resultant bone marrow cells were resuspended in RPMI 1640 (Gibco) supplemented with 10% FBS (Gibco), 1% penicillin/streptomycin (Gibco) and 50 μM 2-mercaptoethanol (Sigma) in the presence of 20 ng ml–1 macrophage colony-stimulating factor (M-CSF; PeproTech) for 5–7 d. BMDMs were stimulated with 100 ng ml–1 LPS (Sigma) plus 20 ng ml–1 IFNγ (PeproTech) or 20 ng ml–1 IL-4 (PeproTech) separately for 24 h to obtain antitumoral- or protumoral-type macrophages, respectively. In some experiments, BMDMs were starved for M-CSF in RPMI 1640 with 10% FBS for 24 h before stimulation. The starved BMDMs were then treated with IL-4 (10 ng ml–1), TGFβ (10 ng ml–1; PeproTech), IL-10 (10 ng ml–; PeproTech) or IFNγ (10 ng ml–1) for 24 h.
Antigen presentation assay
BMDMs from Ythdf2f/f and Ythdf2cKO mice were collected on day 6 and stimulated for 24 h with 100 ng ml–1 LPS plus 20 ng ml–1 IFNγ for antitumoral polarization or 20 ng ml–1 IL-4 for protumoral polarization. The antitumoral or protumoral BMDMs were then washed and cocultured with the SIINFEKEL peptide (10 μg ml–1; InvivoGen) or OVA protein (0.2 mg ml–1; InvivoGen) for 6 h. Cells were washed and cocultured with naive CD8+ T cells from OT-I mice for 3 d. Brefeldin A was added to the cocultures 4 h before the end of incubation. The cross-priming capacity of macrophages was then evaluated by flow cytometry as IFNγ production by CD8+ T cells.
IFNγ ELISpot assay
B16-OVA cells were injected s.c. into the right flanks of Ythdf2f/f and Ythdf2cKO mice. Fourteen days later, 3 × 10⁵ lymphocytes were isolated from draining lymph nodes and restimulated with 10 μg ml–1 SIINFEKEL for 48 h. IFNγ production was determined with an IFNγ single-color ELISpot kit (Cellular Technology) according to the manufacturer’s protocol (Cellular Technology). The visualized spots were counted with a CTL-ImmunoSpot S6 analyzer (Cellular Technology).
qPCR
RNA was isolated using an RNeasy mini kit (QIAGEN) and then reverse transcribed to cDNA with a PrimeScript RT reagent kit with gDNA Eraser (Takara Bio) following the manufacturer’s instructions. mRNA expression levels were analyzed using SYBR Green PCR master mix and a QuantStudio 12K Flex real-time PCR system (both from Thermo Fisher Scientific). Primer sequences are listed in Supplementary Table 1.
Immunoblotting
Immunoblotting was performed according to standard procedures, as previously described52,53. The following antibodies were used: YTHDF2 (MBL, RN123PW), iNOS (Cell Signaling Technology, 13120S), Arg1 (Cell Signaling Technology, 93668S), STAT1 (Cell Signaling Technology, 9172), phospho-STAT1 (Tyr 701; Cell Signaling Technology, 9167), phospho-STAT3 (Tyr 705; Cell Signaling Technology, 9145) and β-actin (Proteintech, 66009–1-Ig). Immunoblots were visualized with Super-Signal West Femto Maximum Sensitivity Substrate (34096, Thermo Fisher Scientific). Densitometric analysis was performed to quantify the intensity of gel bands with ImageJ. Target protein levels were normalized to the expression of β-actin.
scRNA-seq
B16-OVA tumors from Ythdf2f/f and Ythdf2cKO mice were extracted and digested with collagenase type IV (1 mg ml–1) and DNase type I (30 U ml–1) for 30 min at 37 °C. The resulting cells were filtered through 70-μm cell strainers, washed with PBS, lysed in red blood cell buffer and resuspended in PBS. Tumor-infiltrating immune cells (CD45+ cells) were sorted in a FACSAria Fusion flow cytometer (BD Biosciences). The cell suspension (300–600 living cells per ml) was loaded onto a Chromium Single Cell Controller (10x Genomics) to generate single-cell gel beads in the emulsion according to the manufacturer’s protocol. Libraries were subsequently prepared using a Single Cell 5′ Library and Gel Bead kit and sequenced on an Illumina NovaSeq 6000 instrument with a paired-end 100-base pair (PE100) reading strategy.
scRNA-seq analysis
CellRanger (version 5.0.0) was used to process raw data, demultiplex cellular barcodes, map reads to the mouse genome (mm10) and generate digital gene expression matrices; 14,404 single cells from Ythdf2f/f mice and 11,398 from Ythdf2cKO mice were detected. The data were then read into the Seurat R package (version 4.0.4) for further processing54. Less prevalent genes (<3) and cells with less prevalent genes (<200) were removed. Low-quality cells were removed if the number of expressed genes was <200 or >5,000. Cells were also removed if their proportion of mitochondrial gene expression was >7.5%. The remaining 19,530 single cells were used in downstream analyses. The top 2,500 variable genes identified by the ‘vst’ method were used in principal-component analysis; 1–30 principal components (PCs) were used in the Find-Neighbors function. The FindClusters function was used to identify clusters (res = 0.7), which were then visualized with two-dimensional t-SNE plots. Marker genes and differentially expressed genes (DEGs) were identified using the FindMarkers function, and only genes with adjusted P values of <0.05 and log fold changes of >0.25 (determined by two-sided Wilcoxon rank-sum test and adjusted using Bonferroni correction) were considered. To identify specific ligand–receptor pairs between antitumoral macrophages and CD8+ Teff cells, CellPhoneDB software (version 2.1.7)31 was used based on the scRNA-seq data. Receptors and ligands expressed in at least 10% of cells were analyzed. Gene ontology analysis of marker genes derived from scRNA-seq was performed using DAVID (https://david.ncifcrf.gov/). GSEA was applied to identify a priori-defined gene sets that show statistically significant differences between two given clusters, with the permutation number set to 1,000 (ref.55). The networks and pathway analyses were performed using Ingenuity Pathway Analysis (IPA QIAGEN)56.
m6A-seq
Total RNA was isolated with TRIzol reagent (Thermo Fisher Scientific) from 50 million antitumoral-type BMDMs of Ythdf2f/f and Ythdf2cKO mice. m6A immunoprecipitation was performed according to standard procedures, as previously described51. Sequencing was performed at the Translational Genomics Research Institute (TGen) on an Illumina NovaSeq 6000 platform with 100-base pair paired-end reads (PE100). Sequencing reads were mapped to the mouse genome (mm10) using HISAT2 (version v2.1.0)57. m6A-enriched peaks from m6A-seq samples were identified by MACS2 peak-calling software (version 2.2.6) with the corresponding input sample serving as control58. MACS2 was run with default options except for ‘–nomodel, –keepdup all’ to turn off fragment size estimation and to keep all uniquely mapped reads, respectively. m6A peaks were visualized using Integrative Genomics Viewer software (version 2.8.13). The motifs enriched in m6A peaks were analyzed by HOMER (version 4.11)59. Each peak was annotated based on Ensembl gene annotation information by applying BEDTools’intersectBed (version 2.30.0). HTSeq (version 0.11.3)60 was used to calculate read counts in input samples. Then, expression levels for genes were determined by calculating fragments per kilobase of exon per million mapped fragments (total exon fragments/mapped reads (millions) × exon length (kilobases))60. The DEGs between Ythdf2f/f and Ythdf2cKO mice were detected with the R package DEseq2 (version 1.34.0)61, and genes with a log2 (fold change) of >0.5 or log2 (fold change) of <−0.5 and P values of <0.01 were considered as DEGs.
YTHDF2 RIP–seq
Fifty million antitumoral-type BMDMs from Ythdf2f/f and Ythdf2cKO mice were lysed with two volumes of lysis buffer (10 mM HEPES (pH 7.6), 150 mM KCl, 2 mM EDTA, 0.5% NP-40, 0.5 mM DTT, 1:100 protease inhibitor cocktail (Thermo Fisher Scientific) and 400 U ml–1 SUPERase-In RNase inhibitor (Thermo Fisher Scientific)). YTHDF2 RIP was performed according to the protocol as previously described51. A DNA library was generated with a KAPA RNA HyperPrep kit (Roche) and sequenced on the Illumina NovaSeq 6000 platform. Sequencing reads were mapped to the mouse genome (mm10) using HISAT2 (version v2.1.0)57. The target binding peaks of YTHDF2 were identified using MACS2 software (version 2.2.6)58. HOMER (version 4.11) was used to find motifs enriched in YTHDF2-binding peaks59. The target genes were annotated based on Ensembl gene annotation information by applying BEDTools’intersectBed (version 2.30.0).
mRNA stability assay
Antitumoral BMDMs were treated with actinomycin D (5 μg ml–1, A9415) for the indicated time. Untreated cells were used as 0 h. Cells were collected at the indicated time, and total RNA was extracted from the cells for qPCR. The mRNA half-life (t1/2) was calculated using the method previously described51. Primer sequences are listed in Supplementary Table 1.
Dual-luciferase reporter assays
pmirGLO dual-luciferase miRNA target expression vector was purchased from Promega. Wild-type, mutant 1, mutant 2 or mutant 1 and mutant 2 3′ UTR of Stat1 gene fragments were synthesized by Twist Bioscience and cloned into the pmirGLO vector. Ythdf2f/f and Ythdf2cKO BMDMs were transfected with the pmirGLO reporter plasmids using a mouse macrophage nucleofector kit (VPA-1009, Lonza) with program Y-001 on a Nucleofector I device (Amaxa). The cells were collected for lysis 24 h after transfection. The mouse pGL4-Ythdf2 reporter plasmid was generated as previously described51. Mouse Stat3 pcDNA3 plasmid was purchased from Addgene (8706). BMDMs were cotransfected with the pGL4-Ythdf2 reporter plasmid and Stat3 overexpression plasmids or an empty vector together with a pRL-TK Renilla reporter plasmid (Promega) for normalization of transfection efficiency. The cells were collected for lysis 24 h after transfection. Luciferase activity was quantified fluorimetrically with the dual-luciferase system (Promega).
ChIP assays
ChIP assays were performed using a Pierce magnetic ChIP kit (26157, Thermo Fisher Scientific) according to the manufacturer’s instructions. Briefly, BMDMs were pretreated with IL-10 (10 ng ml–1) for 1 h, and 5 × 10⁶ cells were cross-linked with 1% formaldehyde at 37 °C for 10 min and quenched with 0.125 M glycine. After cell lysis, cross-linked chromatin was sheared using Bioruptor Pico (Diagenode) with 30 s on/30 s off for 30 cycles. Sonicated chromatin was then used for immunoprecipitation with 10 μl of anti-phospho-STAT3 (Tyr 705; 9145, Cell Signaling Technology) or corresponding normal rabbit IgG (2729, Cell Signaling Technology) at 4 °C overnight. Following reversal of cross-linking, the DNA immunoprecipitated by the indicated antibody was tested by qPCR using primers listed in Supplementary Table 1.
Oligonucleotide design, synthesis and treatment
The sequence of mouse cell-specific CpG1668–ODN has been described previously40. The phosphothioate ODN and sense strands (SS) of siRNAs were linked using six units of C3 carbon chain linker, (CH2)3 (Glen Research). The resulting constructs were hybridized to complementary siRNA antisense (AS) strands to generate CpG–siRNA conjugates (asterisks indicate phosphothioation sites). Sequences of single-stranded constructs are listed below: CpG–siRNAYthdf2 (SS): 5′-T*C*C*A*T*G*A*C* G*T*T*C*C*T*G*A*T*G*C*T/linker-G*C*AAACUUGCAGUUUAUGUAU-3′; CpG–siRNAYthdf2 (AS): A*U*ACAUAAACUGCAAGUUUGC*U*U; CpG–siRNACtr (SS): 5′-T*C*C*A*T*G*A*C*G*T*T*C*C*T*G*A*T*G*C*T-lin ker-C*U*UACGCUGAGUACUUCGAUU-3′; CpG–siRNACtr (AS): A*A*UCGAAGUACUCAGCGUAAG*U*U. For the uptake studies, CpG–siRNAYthdf2 (SS) was labeled using fluorescein Cy3. In vivo delivery of CpG–siRNAYthdf2 for treatment began when the largest diameter of the tumors reached 5–8 mm, typically 5–7 d after inoculation. Mice were injected intratumorally every other day with 5 mg kg–1 CpG–siRNAYthdf2, CpG–siRNACtr, CpG alone or PBS in a volume of 20 μl. Tumor growth was monitored every other day.
YTHDF2 siRNA knockdown in human MDMs using nucleofection
HLA-A*02-positive human monocytes were pretested by flow cytometry using anti-HLA-A2 (Biolegend, clone bb7.2) and enriched from peripheral blood mononuclear cells using RosetteSep human monocyte enrichment cocktail (STEMCELL Technologies, 15068) and Ficoll-Paque (GE Healthcare). Freshly isolated monocytes (1 × 10⁶) were transfected with siGENOME Human YTHDF2 siRNA (300 nM, M-021009-01-0005, Horizon) or scramble siRNA in 20 μl per reaction of room temperature P3 primary cell 4D-Nucleofector X solution (Lonza, V4XP-3032) with program EA-100 on a 4D-Nucleofector system (Lonza). Transfected monocytes were seeded in a 24-well plate and cultured in RPMI 1640 with 10% heat-inactivated FBS (Gibco) at 37 °C in a 5% CO2 humidified incubator in the presence of human M-CSF (25 ng ml–1, Proteintech). Half of the culture medium was removed and replaced with fresh medium containing M-CSF on day 3. Cells were collected on day 7, and the knockdown efficiency was determined by qPCR.
CRISPR–Cas9-mediated knockout in BMDMs
Stat1 and Ifng1 were knocked out in BMDMs using the Alt-R CRISPR system (IDT). CRISPR RNAs (crRNAs) were predesigned and purchased from IDT, and the sequences are listed in Supplementary Table 2. To prepare the crRNA–transactivating crRNA (tracrRNA) duplex, the Alt-R crRNA and Alt-R-tracrRNA were reconstituted to 200 μM with nuclease-free duplex buffer (IDT) and mixed at equimolar concentrations in a sterile PCR tube to a final concentration of 100 μM. Oligonucleotides were annealed by heating at 95 °C for 5 min in a PCR thermocycler and allowed to cool to room temperature for 15 min. To form Cas9– ribonucleoprotein (RNP), the annealed crRNA–tracrRNA duplexes were mixed with Cas9 (Alt-R S.p. Cas9 Nuclease V3) at a 1.2:1 molar ratio for each reaction in a sterile PCR tube by incubation at room temperature for 10 min. For maximal knockout efficacy, two crRNA sequences were pooled when preparing the RNP62. Bone marrow cells were collected from Ythdf2f/f and Ythdf2cKO mice and washed twice with 1× PBS; 1 × 10⁶ cells per reaction were resuspended in 20 μl of P3 primary nucleofection solution (Lonza). Five microliters of RNP complex and 1 μl of electroporation enhancer were added to 20 μl of cell/P3 nucleofection solution and pipetted up and down three to five times gently to mix while avoiding bubbles. The cell/RNP mix was then immediately loaded into the supplied nucleofector cassette strip (Lonza). The strip was inserted into the Lonza 4D-Nucleofector and nucleofected with the buffer P3, program CM-137. The cells were cultured in the presence of M-CSF for 5–7 d. BMDMs were collected for subsequent assays or mixed with an equal number of B16-OVA cells (2 × 10⁵) and implanted s.c. into the flanks of wild-type C57BL/6 mice. Knockout efficiency was examined by immunoblotting or flow cytometry.
NY-ESO-1-specific Ly95 T cell response
Human T cells were isolated from peripheral blood mononuclear cells using RosetteSep human T cell enrichment cocktail (STEMCELL Technologies, 15061) and Ficoll-Paque (GE Healthcare). Enriched T cells were stimulated with a magnetic bead coated with anti-CD3/CD28 (11131D, Gibco) and IL-2 (50 U ml–1) for 24 h. Activated T cells were transduced with a high-titer lentiviral vector expressing NY-ESO-1-reactive Ly95 TCR45. To produce lentivirus, NY-ESO-1-reactive Ly95 TCR plasmid DNA together with psPAX2 packaging (Addgene) and pMD2.G envelope plasmid DNA (Addgene) were transfected into HEK293T cells using a polyethyenimine transfection protocol (Polysciences). Transgenic TCR expression was determined by flow cytometric analysis using antibody to human Vβ13.1 TCR chain (Beckman Coulter clone IMMU 222)45,63. Macrophages derived from HLA-A2-positive YTHDF2 knockdown or control monocytes were polarized to antitumoral type using IFNγ (20 ng ml–1) and LPS (100 ng ml–1) for 24 h and were incubated with HLA-A*02-restricted NY-ESO-1 (157–165, SLLMWITQC) peptide (MBL, SP1065; 2 μg ml–1) for 2 h, washed three times with cell culture medium and mixed with autologous Ly95 T cells at a ratio of 1:1 in complete cell culture medium. Eighteen hours later, NY-ESO-specific activation of the Ly95 T cells was assessed by measuring intracellular IFNγ and granzyme B in gated CD8+TCRVβ13.1+ cells.
Immunohistochemistry (IHC) of human biopsies and analysis
Tumor biopsies from 18 individuals with colorectal cancer were previously described and obtained from the University of Chicago with informed consent14. Tissue microarray with 32 lung cancer tissues was obtained from Pathology Cores and Biobanking Shared Resources at the City of Hope National Medical Center with informed consent. Single or double IHC was performed on a Ventana Discovery Ultra IHC autostainer (Ventana Medical Systems, Roche Diagnostics) using the Discovery HQ-HRP-DAB detection system (Ventana). Briefly, samples were sectioned at a thickness of 5 μm and put on positively charged glass slides. The slides were loaded on the machine, and deparaffinization, rehydration, endogenous peroxidase activity inhibition and antigen retrieval were first performed. For single IHC staining, the primary antibody was incubated with DISCOVERY anti-rabbit HQ, followed by DISCOVERY anti-HQ-HRP incubation. For double IHC staining, two antigens were sequentially detected, and heat inactivation was used to prevent antibody cross-reactivity between the same species. Following each primary antibody incubation, DISCOVERY anti-rabbit NP or DISCOVERY anti-rabbit HQ and DISCOVERY anti-NP-AP or DISCOVERY anti-HQ-HRP were incubated. The stains were visualized with a DISCOVERY ChromoMap DAB kit, DISCOVERY yellow kit or DISCOVERY purple kit accordingly and were counterstained with hematoxylin (Ventana) and coverslipped. After staining, whole slide images were acquired with a NanoZoomer S360 digital slide scanner (Hamamatsu) and viewed by NDP.view image viewer software. The following primary antibodies were used in this study: YTHDF2 (ab246514, Abcam, 1:400), CD68 (790–2931, Ventana, ready to use) and CD8 (790–4460, Ventana, ready to use). For counting the cells in the stroma tissues, two random circular regions of interest with a size of 150 mm2 at a magnification of ×20 were analyzed. YTHDF2+CD68+ cells and CD8+ cells were counted and reviewed by an independent pathologist. Correlations between the average infiltration of CD8+ T cells and average numbers of YTHDF2+CD68+ macrophages were evaluated using the Spearman correlation method. Blinded staining and blinded analysis were performed for IHC experiments.
Analysis of data from TCGA
Gene expression and clinical data for TCGA SKCM were downloaded from UCSC Xena (http://xena.ucsc.edu/). Samples without survival information were excluded. Individuals were classified as either CD68high or CD68low based on expression level using a 50% cutoff. CD68high individuals were further stratified into either YTHDF2high or YTHDF2low based on expression level by testing cutoffs using the percentile whose association with overall survival of the whole cohort had the lowest P values. Survival analyses were performed using the ‘survival’ R package (version 3.2–13) and Kaplan–Meier methods with a log-rank test. We generated the YTHDF2 gene signature by overlapping the genes from scRNA–seq, m6A–seq and RIP–seq. For each target gene, individual-wise z scores were calculated for gene signature heat maps, which were plotted using the ‘ComplexHeatmap’ R package (version 2.11.1). Twelve target genes were selected for correlative survival analysis using the Gene Expression Profiling Interactive Analysis 2 (GEPIA2) webserver (http://gepia2.cancer-pku.cn)64 with a 50% cutoff value. P values were calculated using Kaplan–Meier methods with a log-rank test.
Analysis of public scRNA-seq data
All public scRNA-seq data were downloaded from the Gene Expression Omnibus database (GBM: GSE84465; colorectal cancer: GSE146771; BRCA: GSE114725; kidney cancer, GSE127136). For each set of data, the steps of quality control, dimensionality reduction, clustering and cell annotation were performed strictly according to the parameters provided in the corresponding studies. Myeloid cells were then extracted, and expression of YTHDF2 in myeloid cells was compared between the normal and tumor groups.
Statistical analysis
Data are presented by descriptive statistics such as mean ± s.d. Data distribution was assumed to be normal, but this was not formally tested. Data collection and analysis were not performed blind to the conditions of the experiments. For continuous endpoints, such as flow cytometry data or qPCR data, a Student’s t-test or paired t-test was used to compare two independent or matched conditions/groups, and one-way analysis of variance (ANOVA) models were used to compare three or more independent conditions/groups. Linear mixed models (that is, two-way ANOVA with mixed-effects models in PRISM) were used to account for the variance–covariance structure due to repeated measures, such as tumor volume. Mouse survival functions were estimated by the Kaplan–Meier method and compared by log-rank tests. All tests were two sided. P values were adjusted for multiple comparisons by the Holm–Šídák procedure. No statistical methods were used to predetermine sample sizes, but our sample sizes are similar to those reported in previous publications14,51,65. Age- and sex-matched animals were randomly assigned to experimental conditions. Data collection and analysis were not performed blind to the conditions of the experiments. No data exclusion was performed. Prism software v.9.0 (GraphPad) and SAS v.9.4 (SAS Institute) were used to perform statistical analyses.
Extended Data
Extended Data Fig. 1 |. TCGA database and public single-cell RNA-seq data analysis to determine expression pattern of YTHDF2 in cancers and tumor-infiltrating myeloid cells.
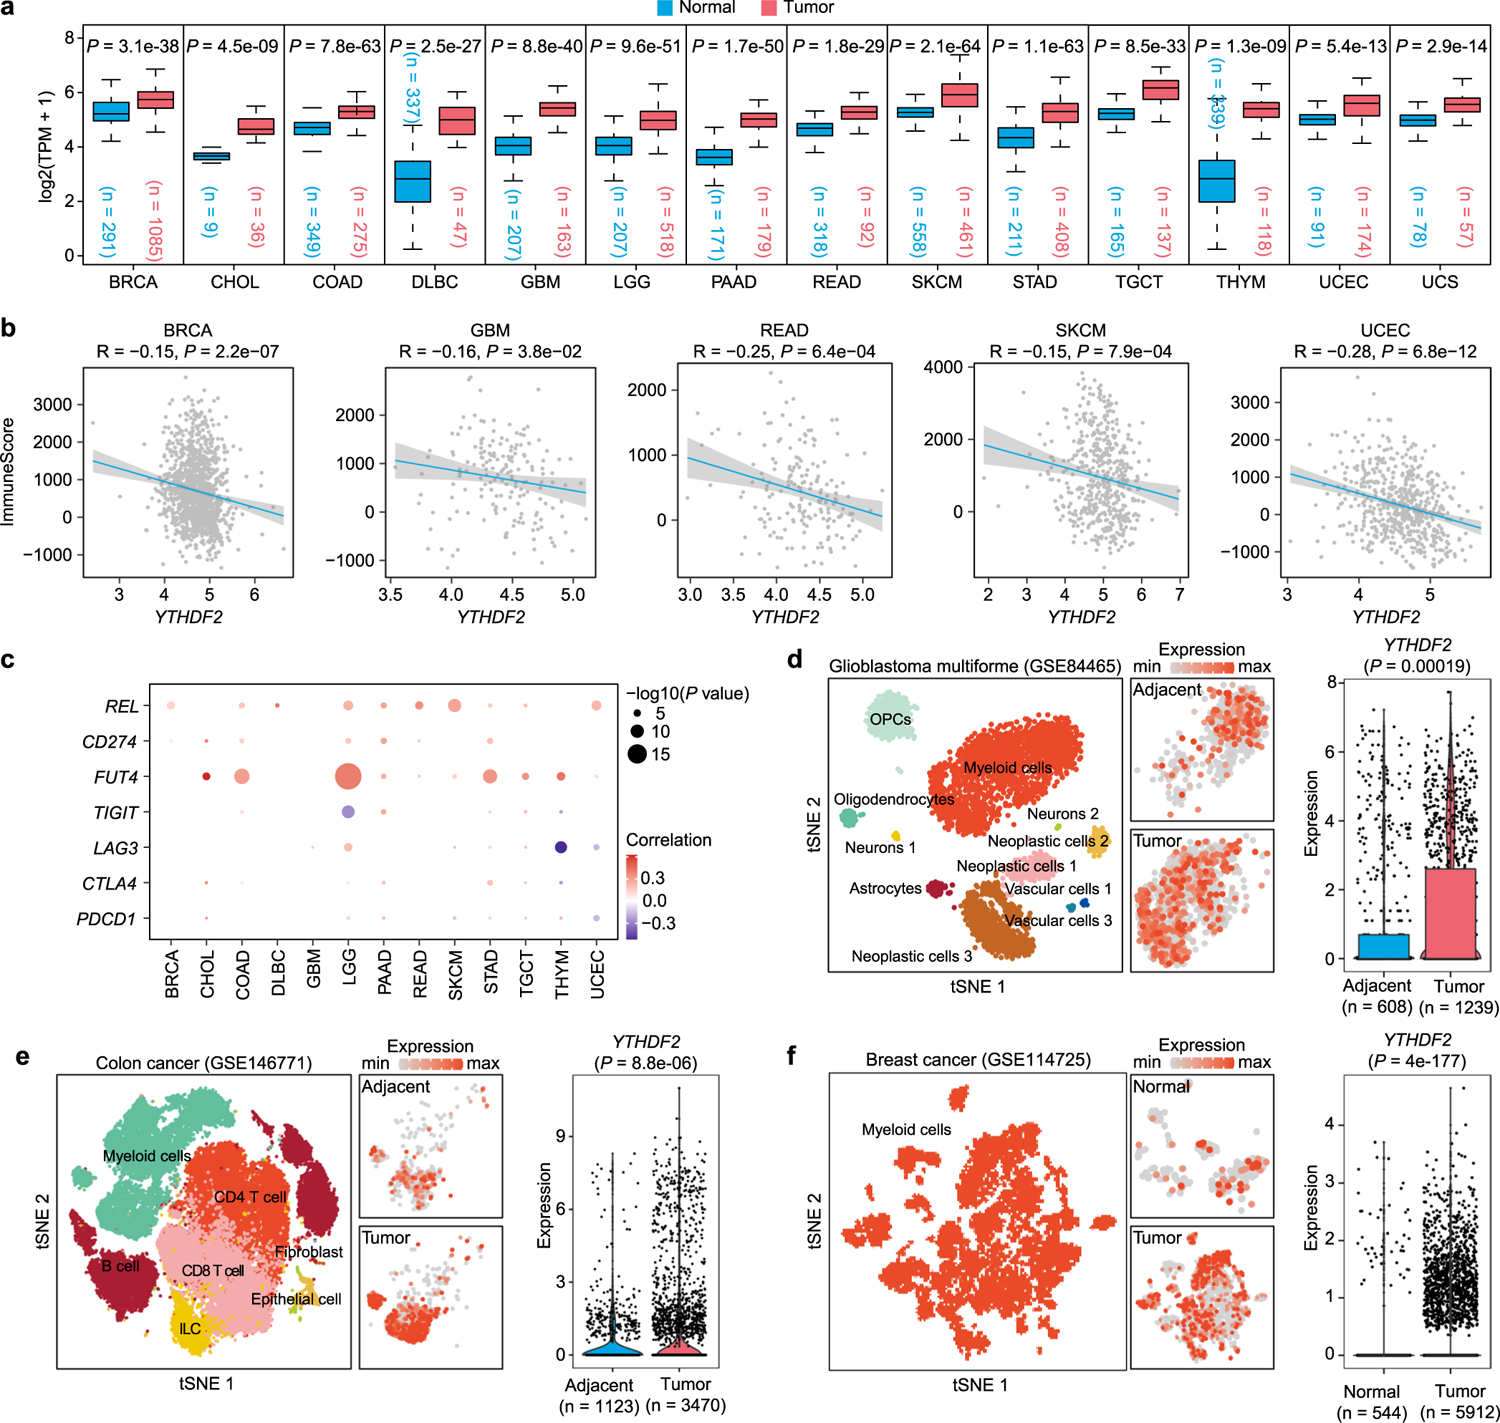
a, Boxplots showing the YTHDF2 expression in multiple types of cancers and corresponding normal tissues from RNA-seq results of the TCGA database. Red and blue boxes indicate the tumor group and normal group, respectively. The horizontal line indicates the median value; the box represents the first and third quartiles. Data were analyzed by two-sided unpaired wilcoxon test. b, Scatter plots showing an inverse Spearman’s correlation betweenYTHDF2 expression and immune scores calculated by the ESTIMATE algorithm from the TCGA database. Data are shown as a fitted line with 95% confidence level and were analyzed by linear model. c, The bubble plots showing the positive correlation of YTHDF2 expression with immune-related markers in each type of cancer. d-f, YTHDF2 expression in tumor-infiltrating myeloid cells and corresponding normal tissues from single-cell RNA-seq datasets of GBM (d), COAD (e), and BRCA (f). P values were calculated by two-sided unpaired wilcoxon test. Abbreviation for TCGA cancer types: BRCA, Breast invasive carcinoma; CHOL, Cholangiocarcinoma; COAD, Colon adenocarcinoma; DLBC, Lymphoid neoplasm diffuse large B-cell lymphoma; GBM, Glioblastoma multiforme; LGG, Brain lower grade glioma; PAAD, Pancreatic adenocarcinoma; READ, Rectum adenocarcinoma; SKCM, Skin cutaneous melanoma; STAD, Stomach adenocarcinoma; TGCT, Testicular germ cell tumors; THYM, Thymoma; UCEC, Uterine corpus endometrial carcinoma; UCS, Uterine carcinosarcoma.
Extended Data Fig. 2 |. YTHDF2 deficiency in myeloid cells does not affect the percentages, absolute numbers, or functions of tumor-infiltrating MDSCs and DCs.
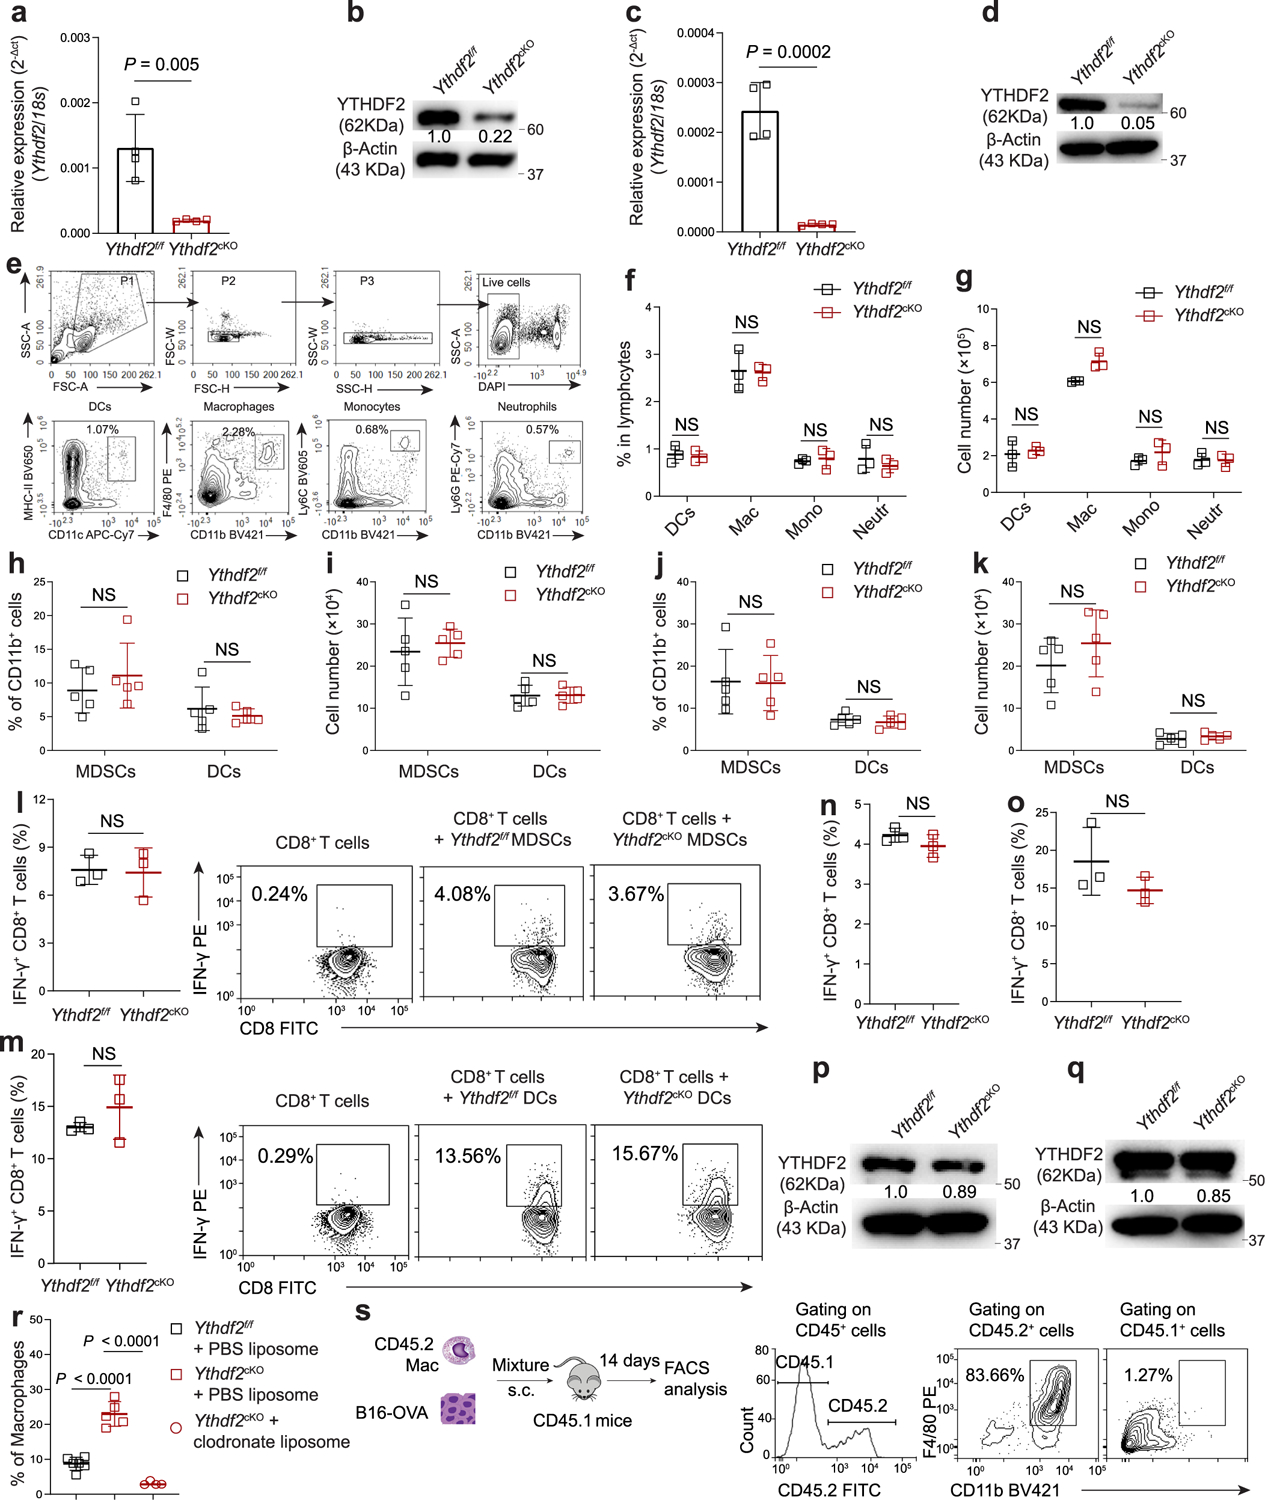
a, b, qPCR (a) (n = 4) and immunoblotting (b) showing the expression of YTHDF2 in splenicCD3−CD19−CD49b−CD11b+ myeloid cells from Ythdf2f/f and Ythdf2cKO mice. c, d, qPCR (c) (n = 4) and immunoblotting (d) showing the expression of YTHDF2 in bone marrow-derived macrophages (BMDMs) from Ythdf2f/f and Ythdf2cKO mice. e-g, Gating strategy (e), percentages (f), and absolute numbers (g) of CD11c+MHC-II+ DCs, CD11b+F4/80+ macrophages, CD11b+Ly6c+ monocytes, and CD11b+Ly6G+ neutrophils in the spleen of Ythdf2f/f and Ythdf2cKO (n = 3). h-k, Percentages (h, j) and absolute numbers (i, k) of tumor-infiltrating CD11b+Gr-1+ MDSCs and CD11b+CD11c+MHC-II+ DCs from Ythdf2f/f and Ythdf2cKO mice on day 14 post-B16-OVA (h, i) or MC38 (j, k) tumor inoculation (n = 5). l, Percentages and representative plots of IFN-γ-producing OT-I CD8+ T cells co-cultured with purified tumor-infiltrated CD11b+Gr-1+ MDSCs from B16-OVA bearing Ythdf2f/f and Ythdf2cKO mice in the presence of SIINFEKEL (n = 3). m, Percentages and representative plots of IFN-γ-producing OT-I CD8+ T cells co-cultured with purified tumor-infiltrated CD11b+CD11c+MHC-II+ DCs from B16-OVA-bearing Ythdf2f/f and Ythdf2cKO mice in the presence of SIINFEKEL (n = 3). n, o, Percentages of IFN-γ-producing OT-I CD8+ T cells co-cultured with purified tumor-infiltrated MDSCs (n) or DCs (o) from B16-OVA-bearing Ythdf2f/f and Ythdf2cKO mice in the presence of ovalbumin protein (n = 3). p, q, Immunoblotting showing the expression of YTHDF2 in BMDCs (p) or splenic DCs (q) from Ythdf2f/f and Ythdf2cKO mice. r, Percentages of tumor-infiltrating CD11b+F4/80+ macrophages after injection with clodronate liposomes or PBS liposomes in B16-OVA-bearing Ythdf2f/f and Ythdf2cKO mice (Ythdf2f/f + PBS liposome, n = 6; Ythdf2cKO + PBS liposome, n = 5; Ythdf2cKO + clodronate liposome, n = 4). s, Schematic diagram showing s.c. co-injection of B16-OVA cells with BMDMs from CD45.2 mice into CD45.1 mice and representative plots of the macrophages in the tumor tissues on day 14 post-B16-OVA tumor inoculation. Data are shown as mean ± SD and were analyzed with an unpaired two-tailed t-test (a-o) or one-way ANOVA with the Holm-Šídák post-test (r). Data in a, b, c, d, f-r are representative of at least two independent experiments. NS, not significant.
Extended Data Fig. 3 |. YTHDF2 deficiency in myeloid cells does not affect phagocytosis by macrophages and CD4+ T and NK cells in the tumor microenvironment.
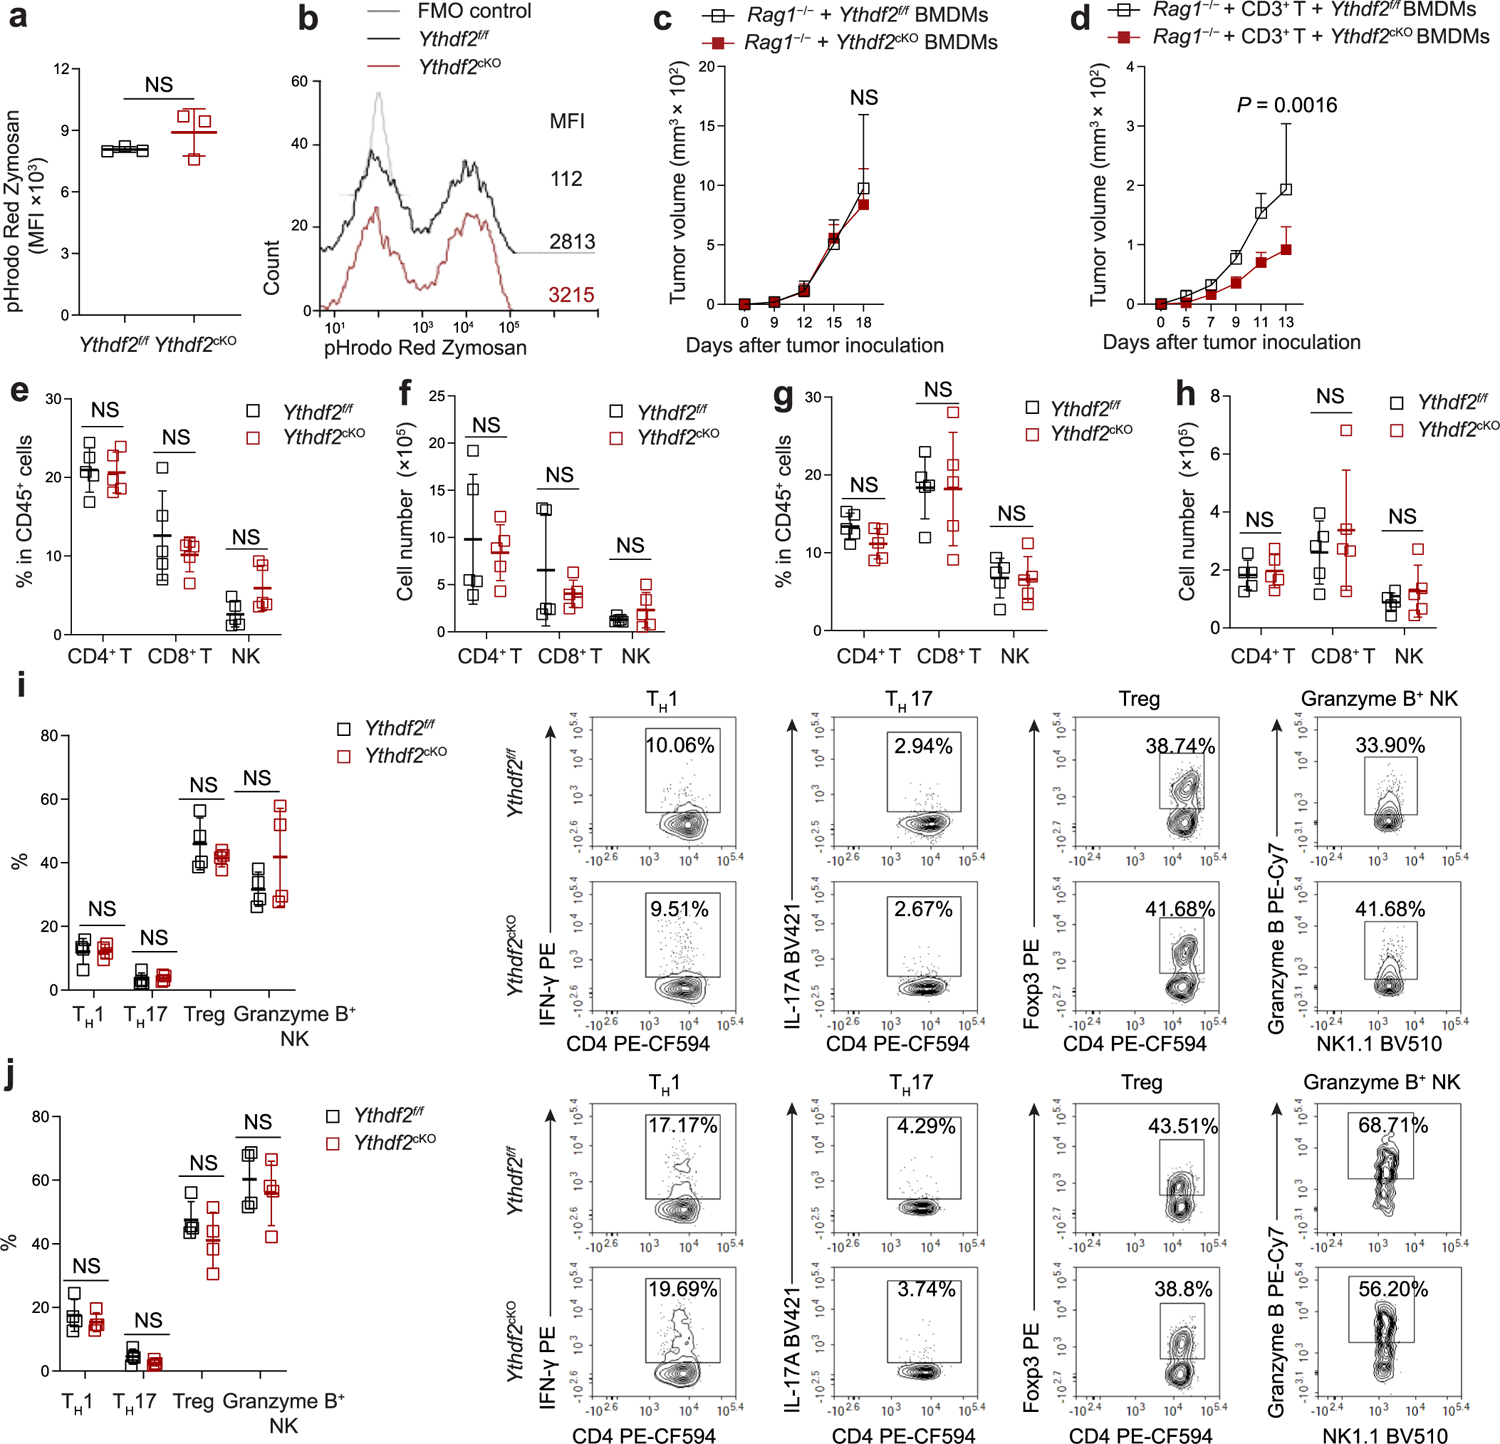
a, b, Median fluorescence intensity (MFI, a) and representative histogram (b) of pHrodo red zymosan bioparticles uptake by anti-tumoral BMDMs from Ythdf2f/f and Ythdf2cKO mice (n = 3). c, B16-OVA tumor growth on day 18 post-B16-OVA tumor inoculation in Rag1−/− mice s.c. transplanted with BMDMs from Ythdf2f/f and Ythdf2cKO mice (n = 3). d, B16-OVA tumor growth on day 13 post-B16-OVA tumor inoculation in Rag1−/− mice that were i.v. injected with CD3+ T cells and s.c. transplanted with BMDMs from Ythdf2f/f and Ythdf2cKO mice (n = 5). e-h, Percentages (e, g) and absolute numbers (f, h) of tumor-infiltrating CD4+ T cells, CD8+ T cells, and CD3−NK1.1+ NK cells from Ythdf2f/f and Ythdf2cKO mice on day 14 post-B16-OVA tumor cell implantation (e, f) or MC38 (g, h) tumor inoculation (n = 5). i, j, Percentages and representative plots of tumor-infiltrating CD4+ IFN-γ+ TH1 cells, CD4+ IL-17A+ TH17 cells, CD4+ Foxp3+ Treg cells, and granzyme B-producing NK cells from Ythdf2f/f and Ythdf2cKO mice on day 14 post B16-OVA (i) or MC38 (j) tumor inoculation (n = 4). Data are shown as mean ± SD and were analyzed with an unpaired two-tailed t-test (a, e-j) or two-way ANOVA with mixed-effects model and adjusted by the Holm-Šídák post-test (c, d). Data in a-j are representative of at least two independent experiments. NS, not significant.
Extended Data Fig. 4 |. scRNA-seq of CD45+ tumor-infiltrating immune cells.
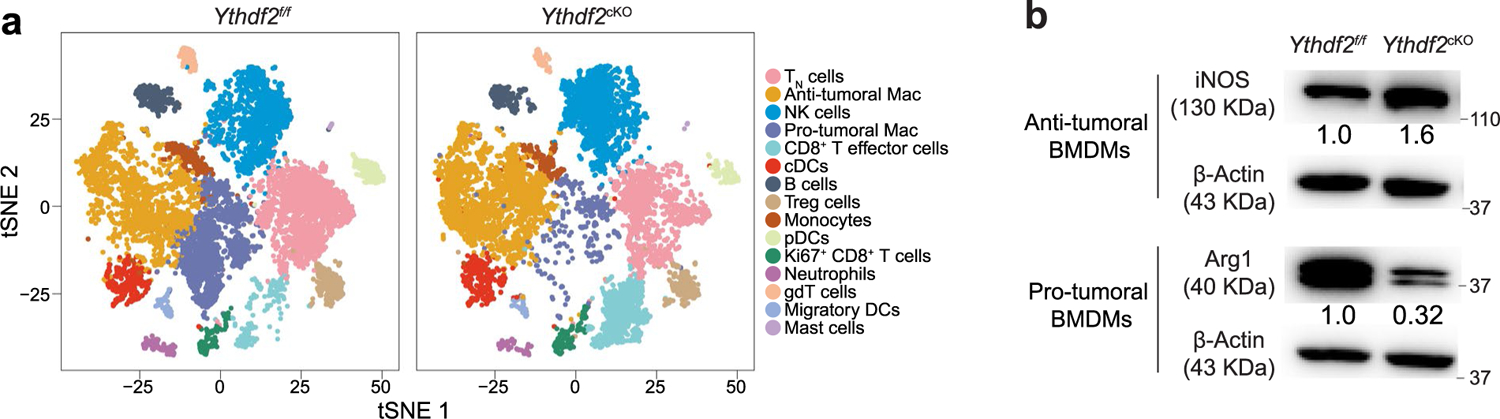
a, A t-distributed stochastic neighbor embedding (t-SNE) plot from scRNA-seq showing 15 cell clusters of CD45+ tumor-infiltrating immune cells that were sorted from B16-OVA tumor-bearing Ythdf2f/f and Ythdf2cKO mice on day 14 post B16-OVA tumor inoculation. b, Immunoblotting showing expression of iNOS in anti-tumoral BMDMs and expression of Arg1 in pro-tumoral BMDMs from Ythdf2f/f and Ythdf2cKO mice. The numbers below a lane indicate expression of target proteins normalized to expression of β-actin. Data in b are representative of at least two independent experiments.
Extended Data Fig. 5 |. YTHDF2 deficiency improves macrophage anti-tumoral polarization by targeting IFN-γ-STAT1 signaling.
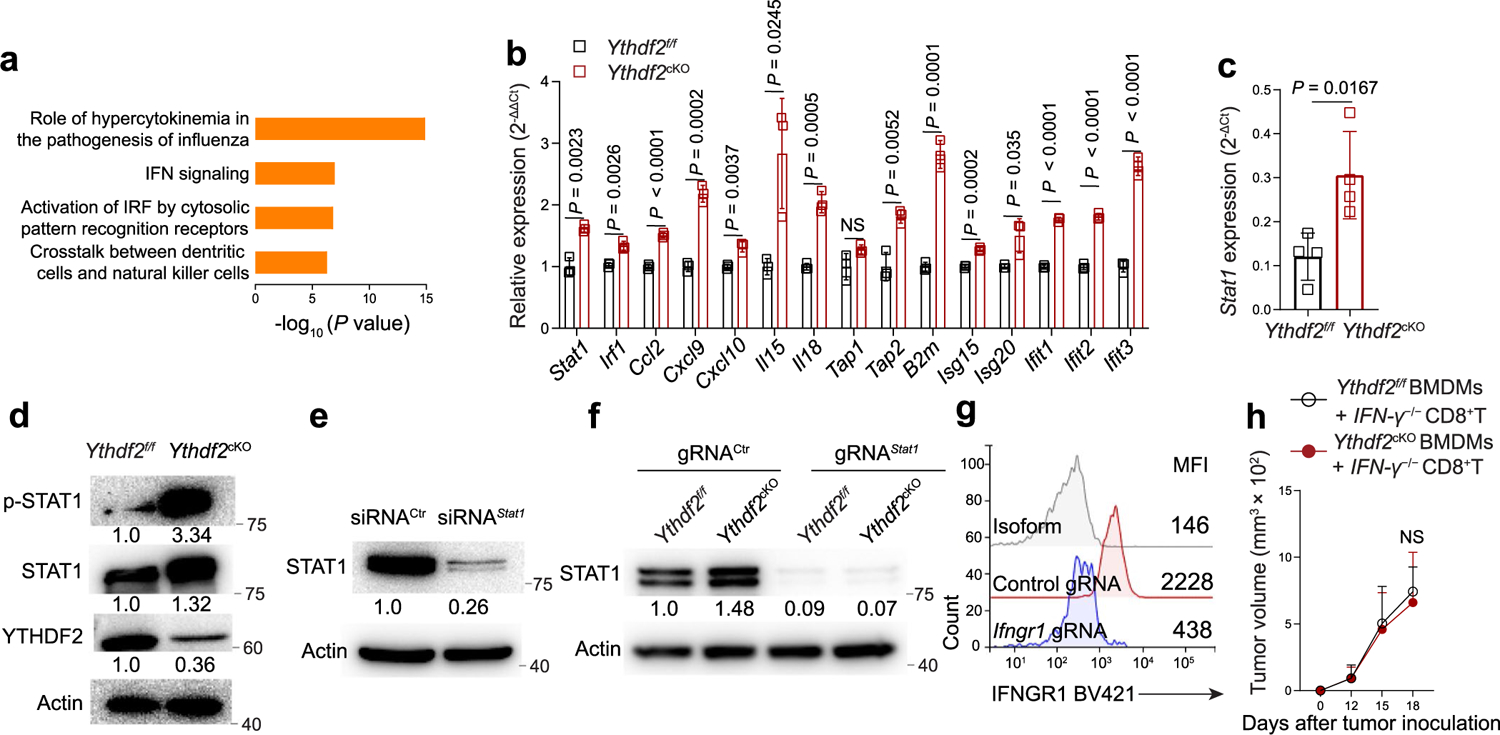
a, Ingenuity pathway analysis showing the top four pathways enriched in Ythdf2cKO anti-tumoral macrophages compared to Ythdf2f/f anti-tumoral macrophages. P values were determined by hypergeometric test and adjusted for multiple testing using the Benjamini–Hochberg method. b, qPCR showing the expression of IFN-γ response genes in BMDMs from Ythdf2f/f and Ythdf2cKO mice that were treated with IFN-γ (100 ng/ml) for 6 h (n = 3). c, qPCR showing the expression of Stat1 in CD11b+F4/80+ TAMs isolated from tumor tissues of B16-OVA tumor-bearing Ythdf2f/f and Ythdf2cKO on day 14 post B16-OVA tumor inoculation (n = 4). d, Immunoblotting showing the expression of phosphor (p)-STAT1 and STAT1 in CD11b+F4/80+ TAMs isolated from tumor tissues of B16-OVA tumor-bearing Ythdf2f/f and Ythdf2cKO mice on day 14 post-B16-OVA tumor inoculation. e, Immunoblotting showing the expression of STAT1 in BMDMs transfected with Stat1 siRNA or control siRNA. f, Immunoblotting showing the expression of STAT1 in BMDMs nucleofected with Stat1 gRNA or control gRNA. g, Representative histogram of the expression of IFNGR1 in BMDMs nucleofected with Ifngr1 gRNA or control gRNA. h, B16-OVA tumor growth on day 18 post-tumor inoculation in Rag1−/− mice s.c. implanted with BMDMs from Ythdf2f/f and Ythdf2cKO mice together with i.v. injection of CD8+ T cells from IFN-γ−/− mice (n = 4). Data are shown as mean ± SD and were analyzed with an unpaired two-tailed t-test (b, c) or two-way ANOVA with mixed-effects model and adjusted by the Holm-Šídák post-test (h). The numbers below a lane indicate relative expression levels of target proteins normalized to the expression of β-actin. Data in b-h are representative of at least two independent experiments. NS, not significant.
Extended Data Fig. 6 |. Transcriptome-wide identification of YTHDF2-binding targets in macrophages using m6A-RIP and YTHDF2 RIP.
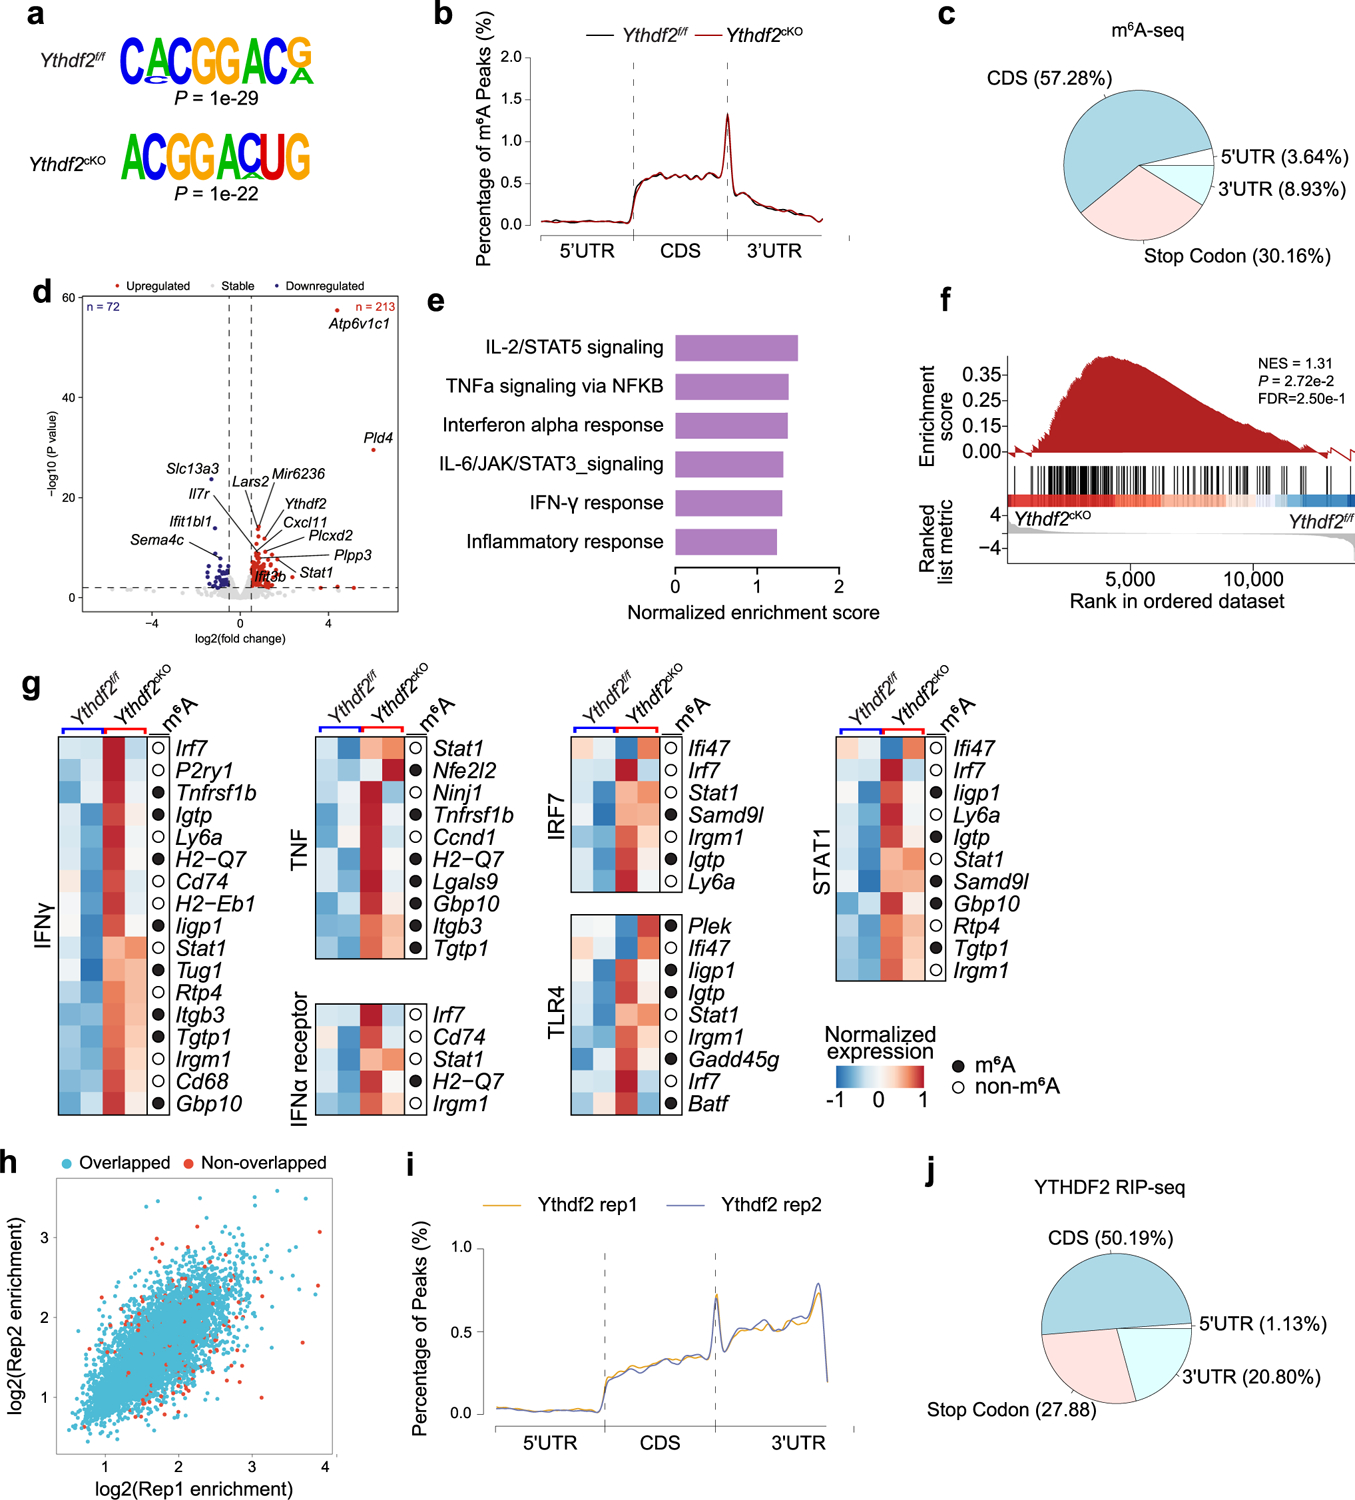
a, HOMER motif discovery tool showing the m6A motif in BMDMs from both Ythdf2f/f and Ythdf2cKO mice. b, Density distribution of m6A peaks across the length of mRNA. c, Pie chart depicting the fraction of m6A peaks in four transcript segments. d, Volcano plot showing the differentially expressed genes in anti-tumoral macrophages from Ythdf2cKO mice compared with those from Ythdf2f/f mice from RNA-seq. DEGs with absolute log-transformed fold change > 0.25 and adjusted P < 0.05 (determined by two-sided Wilcoxon rank sum test and adjusted using Bonferroni correction) were defined as significant. e, GSEA results showing the top six pathways enriched in Ythdf2cKO anti-tumoral macrophages compared to Ythdf2f/f anti-tumoral macrophages. The P values were calculated by a permutation test. f, GSEA results showing enrichment of IFN-γ response sets in Ythdf2cKO anti-tumoral macrophages compared to Ythdf2f/f anti-tumoral macrophages. g, Heatmaps showing the relative expression of representative genes in Ifng, Tnf, Ifna, Irf7, Tlr4, and Stat1 signaling pathways in BMDMs from Ythdf2f/f and Ythdf2cKO mice from RNA-seq data (n = 2). Transcript methylation is depicted by filled (m6A-modified) or unfilled (non-m6A-modified) circles. h, Scatterplot showing the overlap of high confidence YTHDF2-binding peaks between replicate 1 and replicate 2 in YTHDF2 RIP-seq. i, Density distribution of YTHDF2-binding peaks across the length of mRNA. j, Pie chart depicting the fraction of YTHDF2-binding peaks in four transcript segments.
Extended Data Fig. 7 |. YTHDF2 is positively regulated by IL-10–STAT3 signaling in TAMs.
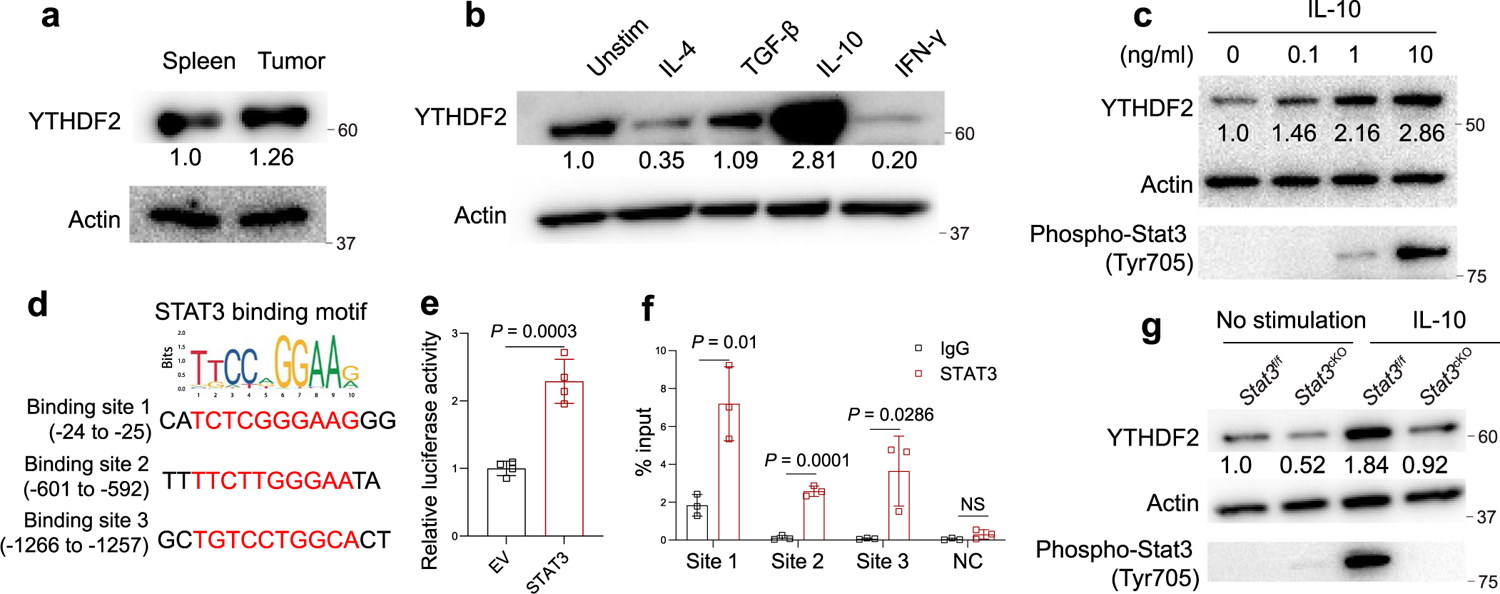
a, Immunoblotting showing the expression of YTHDF2 in CD11b+F4/80+ macrophages isolated from spleen or tumor tissues of B16-OVA tumor-bearing C57BL/6 mice on day 14-post B16-OVA tumor inoculation. b, Immunoblotting showing the expression of YTHDF2 in BMDMs stimulated without or with IL-4, TGF-β, IL-10, or IFN-γ for 24 h. c, Immunoblotting showing the expression of YTHDF2 and phospho-Stat3 in BMDMs stimulated with different doses of IL-10 for 24 h. d, Binding sites for STAT3 in the promoter regions of Ythdf2 (predicted from http://jaspar.genereg.net). e, Luciferase reporter assay showing the luciferase activity of Ythdf2 in BMDMs transfected with STAT3 expressing plasmid or empty vector (n = 3). f, ChIP-qPCR showing the binding of STAT3 to the Ythdf2 promoter in IL-10 (10 ng/ml)–treated BMDMs (n = 3). g, Immunoblotting showing the expression of YTHDF2 and phospho-Stat3 in BMDMs from Stat3f/fand Stat3cKO mice stimulated without or with IL-10 (10 ng/ml). Data are shown as mean ± SD and were analyzed with an unpaired two-tailed t-test (e, f). The numbers below a lane indicate the expression of YTHDF2 normalized to the expression of β-actin. Data in a, b, c, e, f, and g are representative of at least two independent experiments. NS, not significant.
Extended Data Fig. 8 |. TLR9 expression and CpG-Ythdf2 siRNA design as well as its uptake by macrophages associated with anti-tumor effect in vivo.
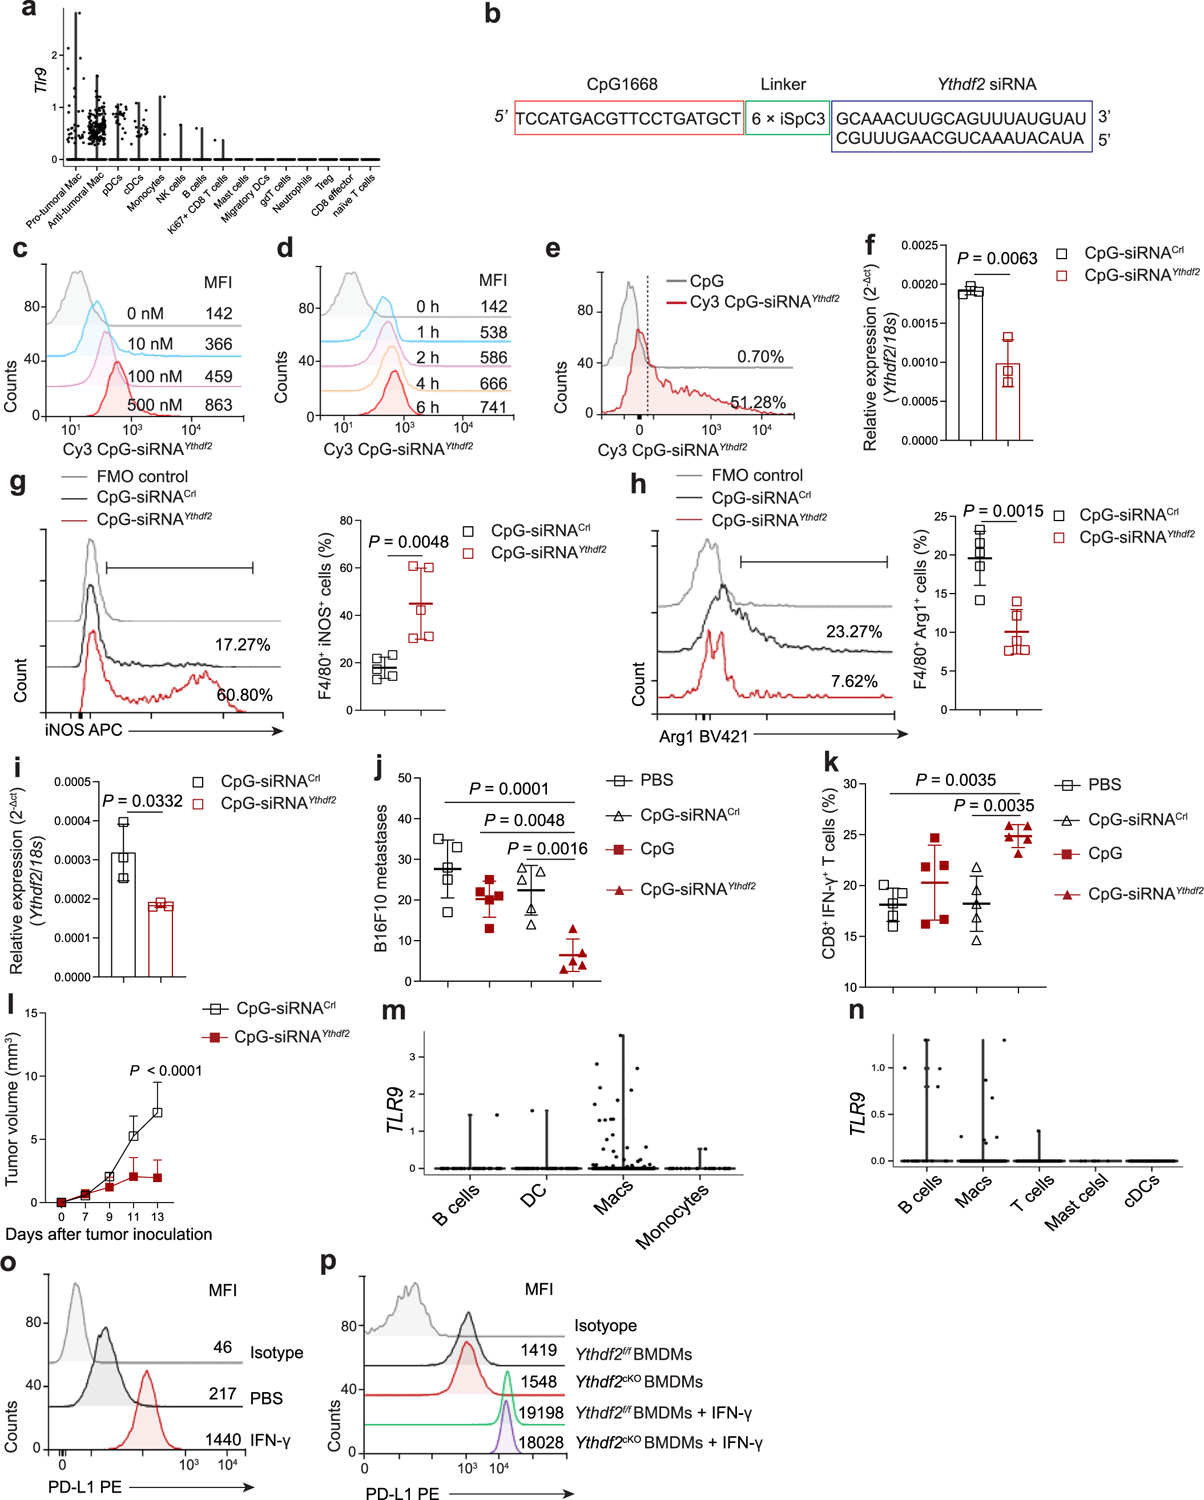
a, Violin plot showing the Tlr9 expression across 15 cell clusters from scRNA-seq data in this study. b, Sequence of the CpG-linked mouse Ythdf2 siRNA conjugate (CpG–siRNAYthdf2). c, d, Representative histograms showing the expression of Cy3-CpG-siRNAYthdf2 in wild-type BMDMs incubated with various doses of Cy3-CpG-siRNAYthdf2 (c) or with 100 nM Cy3-labeled CpG-Ythdf2 siRNA for the indicated times (d). e, Representative histograms showing the uptake of Cy3-CpG-siRNAYthdf2 by CD11b+F4/80+ TAMs isolated from tumor tissues of B16-OVA-bearing wild-type mice that received intratumoral (i.t.) injection of CpG-siRNAYthdf2. f, qPCR showing the mRNA expression of mRNA Ythdf2 in CD11b+F4/80+ TAMs sorted from tumor tissues of B16-OVA-bearing mice i.t. injected with CpG-siRNAYthdf2 or CpG-siRNACtrl (n = 3). g, h, Representative dot plots and percentages of CD11b+F4/80+iNOS+ anti-tumoral macrophages (g) or h, CD11b+F4/80+Arg1+ pro-tumoral macrophages (h) in tumor tissues from B16-OVA-bearing mice that received i.t. injection of CpG-siRNAYthdf2 or CpG-siRNACtrl (n = 5). i, qPCR showing the mRNA expression of Ythdf2 in CD11b+F4/80+ TAMs isolated from lung tissues of B16-F10-bearing mice that received i.v. injected of CpG-siRNAYthdf2 or CpG-siRNACtrl (n = 3). j, k, Metastatic nodules (j) and percentages of tumor-infiltrating IFN-γ producing CD8+ T cells (k) in the lung of B16F10-bearing mice that received i.v. injection of CpG-siRNAYthdf2, CpG-siRNACtrl, CpG, or PBS (n = 5). l, B16-OVA tumor growth on day 13 post-tumor inoculation in Batf3−/− mice treated with CpG-siRNAYthdf2 or CpG-siRNACtrl (n = 5). m, n, Violin plots showing the TLR9 expression across cell clusters in scRNA-seq datasets of patients with glioblastoma (m) or kidney cancer (n). o, p, Representative histograms showing expression levels of PD-L1 in B16-OVA cells (o) or BMDMs (p) after treatment with IFN-γ for 24 h. Median fluorescence intensity (MFI) is shown. Data are shown as mean ± SD and were analyzed with an unpaired two-tailed t-test (f-i) or one-way ANOVA with the Holm-Šídák post-test (j, k) or two-way ANOVA with the mixed-effects model and adjusted by Holm-Šídák post-test (l). Data in c-l, o, and p are representative of at least two independent experiments.
Extended Data Fig. 9 |. The relationship between YTHDF2 expression in TAMs and overall survival in patients with skin cutaneous melanoma.
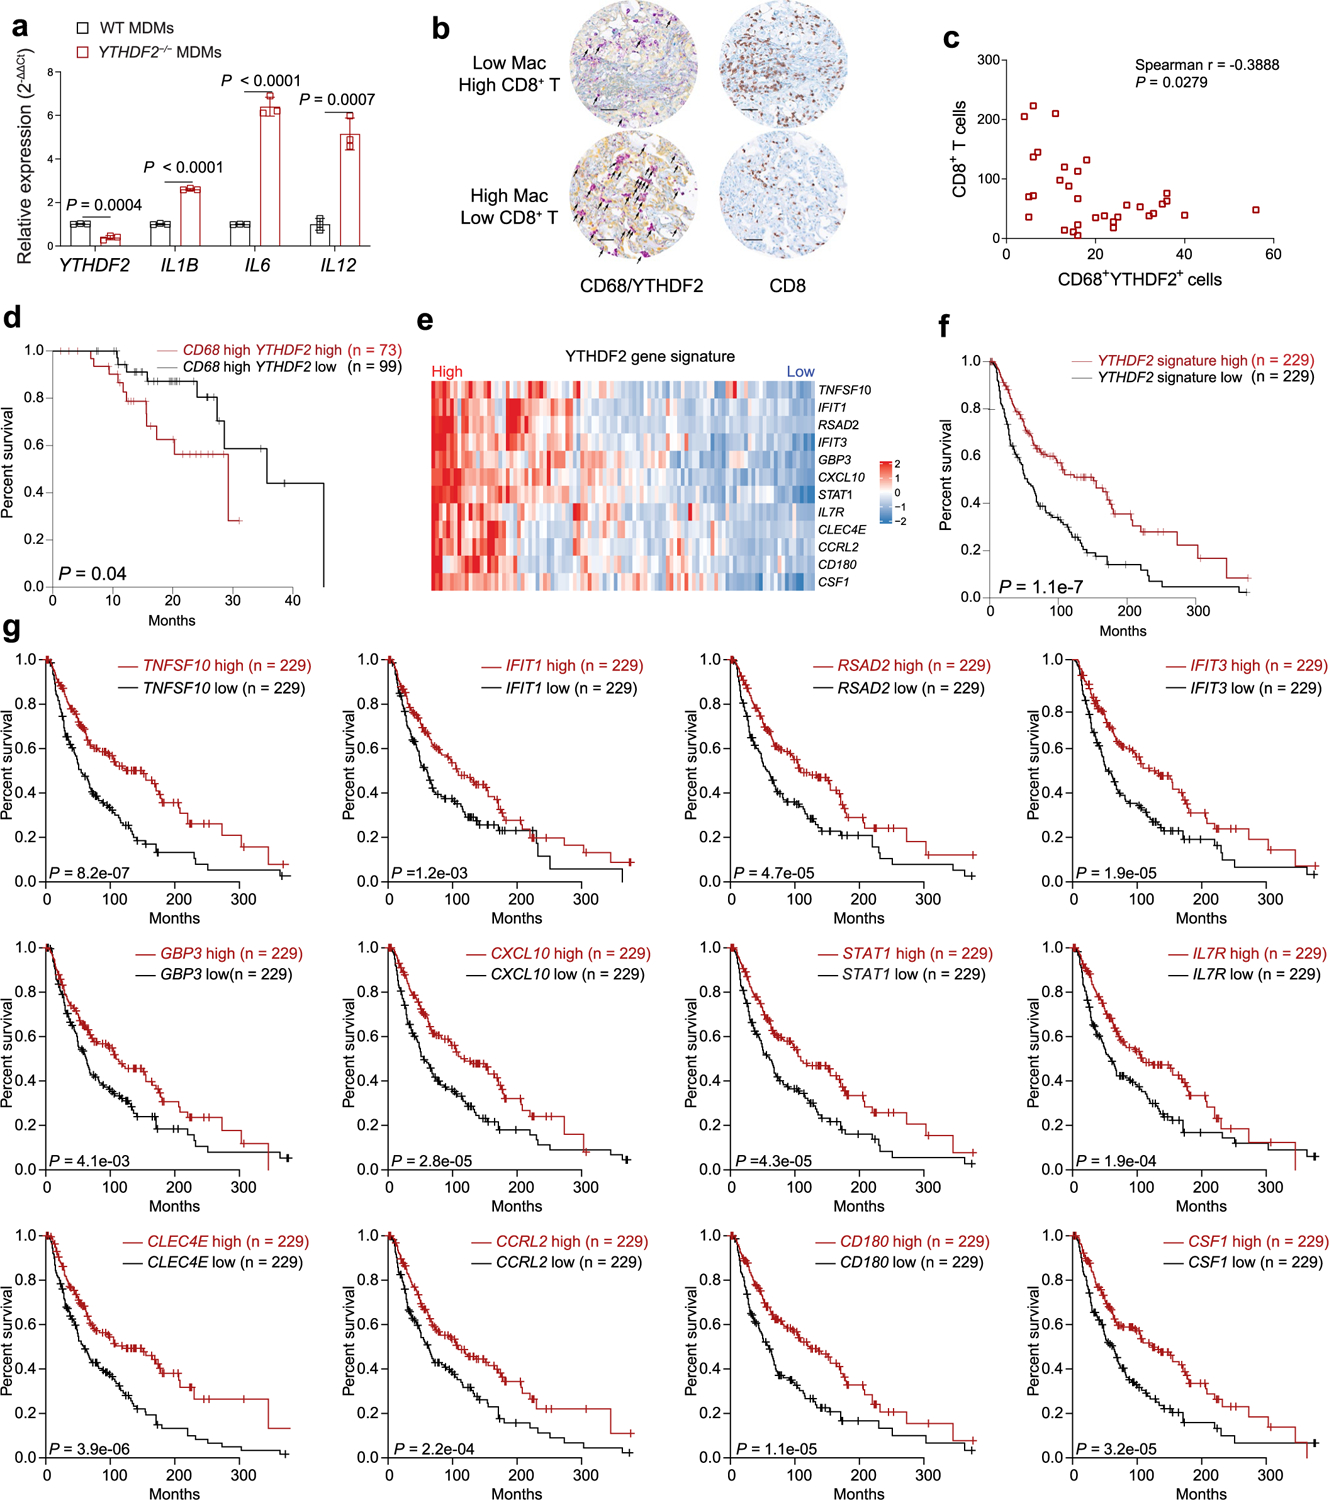
a, qPCR showing the mRNA expression of YTHDF2, IL1B, IL6, and IL12 in human MDMs transfected with YTHDF2 siRNA (YTHDF2−/− MDMs) or control siRNA (WT MDMs). Data are shown as mean ± SD and were analyzed by unpaired two-tailed t-test. b, Immunohistochemical staining of YTHDF2 (yellow) plus CD68 (purple) or CD8 (brown) in tumor tissues from patients with lung cancer. A representative specimen of YTHDF2+CD68+ (double positive) with a high (top panel) or low (bottom panel) number of cells is shown (f). Scale bars = 100 μm. Black arrows mark YTHDF2+CD68+ cells. c, Correlations between YTHDF2+CD68+ cells and CD8+ T cells. Data are analyzed by Spearman correlation (n = 32). d, Kaplan–Meier analysis showing the correlation of the expression of YTHDF2 in tumor infiltrated CD68+ macrophages with overall survival in patients with skin cutaneous melanoma (SKCM) from TCGA dataset. P values were calculated using the log-rank test. e, Heatmap of the ordered, z-transformed expression values for YTHDF2 target genes in patients with SKCM from TCGA dataset. f, Correlation of a YTHDF2 target gene signature with overall survival of patients with SKCM comparing high and low quartiles. P values were calculated using the log-rank test. g, Kaplan–Meier analysis showing the correlation of each of the 12 identified YTHDF2 target genes with overall survival of patients with SKCM comparing high and low expression with a 50% cutoff. P values were calculated using the log-rank test. Data in a are representative of at least two independent experiments.
Extended Data Fig. 10 |. A working model for how reduction in YTHDF2 reprograms tumor-associated macrophages and elicits potent anti-tumor immunity.

TAMs traffic into the TME and respond to IL-10, which upregulates YTHDF2 by IL-10–STAT3 signaling. Ablation of YTHDF2 in TAMs or knock-down of YTHDF2 by CpG-siRNAYthdf2 enhances the stability of STAT1, reprograms TAMs to induce anti-tumoral polarization, thereby facilitating CD8+ T cell anti-tumor response, and eventually suppressing tumor growth.
Supplementary Material
Acknowledgements
We thank the City of Hope Center for Comparative Medicine, Analytical Cytometry Core, Pathology Core, Integrative Genomics Core and DNA/RNA Synthesis Laboratory for performing some work. We thank F. Chiuppesi and V. Karpinski for analyzing the ELISpot data. The following reagents were obtained through the NIH Tetramer Core Facility: H-2Kb SIINFEKL-PE tetramers (contract number 75N93020D00005). We thank A. Li, Z. Yin and A. Misra for IHC staining and reviewing. We thank H. Yu for providing Stat3f/fLyz2Cre mice. We thank S. Albelda for providing the NY-ESO-1-reactive Ly95 TCR plasmid. This work was supported by grants from the National Institutes of Health (CA210087, CA265095 and CA163205 to M.C.; NS106170, AI129582, CA247550, CA264512, CA266457 and CA223400 to J.Y.), the Leukemia and Lymphoma Society (1364-19 to J.Y.) and the 2021 Exceptional Project Award from the Breast Cancer Alliance (to J.Y.). Images were created with BioRender.com.
Footnotes
Extended data is available for this paper at https://doi.org/10.1038/s41590-022-01398-6.
Supplementary information The online version contains supplementary material available at https://doi.org/10.1038/s41590-022-01398-6.
Online content
Any methods, additional references, Nature Portfolio reporting summaries, source data, extended data, supplementary information, acknowledgements, peer review information; details of author contributions and competing interests; and statements of data and code availability are available at https://doi.org/10.1038/s41590-022-01398-6.
Reporting summary
Further information on research design is available in the Nature Portfolio Reporting Summary linked to this article.
Code availability
Publicly available packages were used to perform the analysis of scRNA-seq data. Detailed R scripts for figures are available at https://github.com/ShoubaoMa/scRNA-seq_Ythdf2_Macrophage.
Competing interests
The authors declare no competing interests.
Data availability
The scRNA-seq, m6A-seq and RIP–seq data reported in this paper are deposited in the Gene Expression Omnibus under accession numbers GSE188400 and GSE189193. The remaining data that support our study’s findings are available from the corresponding authors upon request. Source data are provided with this paper.
References
- 1.Murciano-Goroff YR, Warner AB & Wolchok JD The future of cancer immunotherapy: microenvironment-targeting combinations. Cell Res. 30, 507–519 (2020). [DOI] [PMC free article] [PubMed] [Google Scholar]
- 2.Schupp J et al. Targeting myeloid cells in the tumor sustaining microenvironment. Cell Immunol. 343, 103713 (2019). [DOI] [PubMed] [Google Scholar]
- 3.Engblom C, Pfirschke C & Pittet MJ The role of myeloid cells in cancer therapies. Nat. Rev. Cancer 16, 447–462 (2016). [DOI] [PubMed] [Google Scholar]
- 4.Ruffell B et al. Macrophage IL-10 blocks CD8+ T cell-dependent responses to chemotherapy by suppressing IL-12 expression in intratumoral dendritic cells. Cancer Cell 26, 623–637 (2014). [DOI] [PMC free article] [PubMed] [Google Scholar]
- 5.Qian BZ & Pollard JW Macrophage diversity enhances tumor progression and metastasis. Cell 141, 39–51 (2010). [DOI] [PMC free article] [PubMed] [Google Scholar]
- 6.Broz ML et al. Dissecting the tumor myeloid compartment reveals rare activating antigen-presenting cells critical for T cell immunity. Cancer Cell 26, 638–652 (2014). [DOI] [PMC free article] [PubMed] [Google Scholar]
- 7.Li X, Ma S, Deng Y, Yi P & Yu J Targeting the RNA m6A modification for cancer immunotherapy. Mol. Cancer 21, 76 (2022). [DOI] [PMC free article] [PubMed] [Google Scholar]
- 8.Wang L et al. m6A RNA methyltransferases METTL3/14 regulate immune responses to anti-PD-1 therapy. EMBO J. 39, e104514 (2020). [DOI] [PMC free article] [PubMed] [Google Scholar]
- 9.Yang S et al. m6A mRNA demethylase FTO regulates melanoma tumorigenicity and response to anti-PD-1 blockade. Nat. Commun 10, 2782 (2019). [DOI] [PMC free article] [PubMed] [Google Scholar]
- 10.Liu Y et al. Tumors exploit FTO-mediated regulation of glycolytic metabolism to evade immune surveillance. Cell Metab. 33, 1221–1233 (2021). [DOI] [PubMed] [Google Scholar]
- 11.Li N et al. ALKBH5 regulates anti-PD-1 therapy response by modulating lactate and suppressive immune cell accumulation in tumor microenvironment. Proc. Natl Acad. Sci. USA 117, 20159–20170 (2020). [DOI] [PMC free article] [PubMed] [Google Scholar]
- 12.Su R et al. Targeting FTO suppresses cancer stem cell maintenance and immune evasion. Cancer Cell 38, 79–96 (2020). [DOI] [PMC free article] [PubMed] [Google Scholar]
- 13.Yin H et al. RNA m6A methylation orchestrates cancer growth and metastasis via macrophage reprogramming. Nat. Commun 12, 1394 (2021). [DOI] [PMC free article] [PubMed] [Google Scholar]
- 14.Han D et al. Anti-tumour immunity controlled through mRNA m6A methylation and YTHDF1 in dendritic cells. Nature 566, 270–274 (2019). [DOI] [PMC free article] [PubMed] [Google Scholar]
- 15.Dong L et al. The loss of RNA N6-adenosine methyltransferase Mettl14 in tumor-associated macrophages promotes CD8+ T cell dysfunction and tumor growth. Cancer Cell 39, 945–957 (2021). [DOI] [PubMed] [Google Scholar]
- 16.Xiong J et al. Lactylation-driven METTL3-mediated RNA m6A modification promotes immunosuppression of tumor-infiltrating myeloid cells. Mol. Cell 82, 1660–1677 (2022). [DOI] [PubMed] [Google Scholar]
- 17.Wang X et al. N6-methyladenosine modulates messenger RNA translation efficiency. Cell 161, 1388–1399 (2015). [DOI] [PMC free article] [PubMed] [Google Scholar]
- 18.Wang X et al. N6-methyladenosine-dependent regulation of messenger RNA stability. Nature 505, 117–120 (2014). [DOI] [PMC free article] [PubMed] [Google Scholar]
- 19.Li A et al. Cytoplasmic m6A reader YTHDF3 promotes mRNA translation. Cell Res. 27, 444–447 (2017). [DOI] [PMC free article] [PubMed] [Google Scholar]
- 20.Shi H et al. YTHDF3 facilitates translation and decay of N6-methyladenosine-modified RNA. Cell Res. 27, 315–328 (2017). [DOI] [PMC free article] [PubMed] [Google Scholar]
- 21.Dixit D et al. The RNA m6A reader YTHDF2 maintains oncogene expression and is a targetable dependency in glioblastoma stem cells. Cancer Discov. 11, 480–499 (2021). [DOI] [PMC free article] [PubMed] [Google Scholar]
- 22.Einstein JM et al. Inhibition of YTHDF2 triggers proteotoxic cell death in MYC-driven breast cancer. Mol. Cell 81, 3048–3064 (2021). [DOI] [PMC free article] [PubMed] [Google Scholar]
- 23.Yoshihara K et al. Inferring tumour purity and stromal and immune cell admixture from expression data. Nat. Commun 4, 2612 (2013). [DOI] [PMC free article] [PubMed] [Google Scholar]
- 24.Darmanis S et al. Single-cell RNA-seq analysis of infiltrating neoplastic cells at the migrating front of human glioblastoma. Cell Rep. 21, 1399–1410 (2017). [DOI] [PMC free article] [PubMed] [Google Scholar]
- 25.Zhang L et al. Single-cell analyses inform mechanisms of myeloid-targeted therapies in colon cancer. Cell 181, 442–459 (2020). [DOI] [PubMed] [Google Scholar]
- 26.Azizi E et al. Single-cell map of diverse immune phenotypes in the breast tumor microenvironment. Cell 174, 1293–1308 (2018). [DOI] [PMC free article] [PubMed] [Google Scholar]
- 27.Clausen BE, Burkhardt C, Reith W, Renkawitz R & Forster I Conditional gene targeting in macrophages and granulocytes using LysMcre mice. Transgenic Res. 8, 265–277 (1999). [DOI] [PubMed] [Google Scholar]
- 28.Gholamin S et al. Disrupting the CD47-SIRPα anti-phagocytic axis by a humanized anti-CD47 antibody is an efficacious treatment for malignant pediatric brain tumors. Sci. Transl. Med 9, eaaf2968 (2017). [DOI] [PubMed] [Google Scholar]
- 29.Muntjewerff EM, Meesters LD & van den Bogaart G Antigen cross-presentation by macrophages. Front. Immunol 11, 1276 (2020). [DOI] [PMC free article] [PubMed] [Google Scholar]
- 30.Dixon KO et al. TIM-3 restrains anti-tumour immunity by regulating inflammasome activation. Nature 595, 101–106 (2021). [DOI] [PMC free article] [PubMed] [Google Scholar]
- 31.Efremova M, Vento-Tormo M, Teichmann SA & Vento-Tormo R CellPhoneDB: inferring cell-cell communication from combined expression of multi-subunit ligand–receptor complexes. Nat. Protoc 15, 1484–1506 (2020). [DOI] [PubMed] [Google Scholar]
- 32.Le Bon A et al. Cross-priming of CD8+ T cells stimulated by virus-induced type I interferon. Nat. Immunol 4, 1009–1015 (2003). [DOI] [PubMed] [Google Scholar]
- 33.Lawrence T & Natoli G Transcriptional regulation of macrophage polarization: enabling diversity with identity. Nat. Rev. Immunol 11, 750–761 (2011). [DOI] [PubMed] [Google Scholar]
- 34.Mapperley C et al. The mRNA m6A reader YTHDF2 suppresses proinflammatory pathways and sustains hematopoietic stem cell function. J. Exp. Med 218, e20200829 (2021). [DOI] [PMC free article] [PubMed] [Google Scholar]
- 35.Murray PJ et al. Macrophage activation and polarization: nomenclature and experimental guidelines. Immunity 41, 14–20 (2014). [DOI] [PMC free article] [PubMed] [Google Scholar]
- 36.Noy R & Pollard JW Tumor-associated macrophages: from mechanisms to therapy. Immunity 41, 49–61 (2014). [DOI] [PMC free article] [PubMed] [Google Scholar]
- 37.Murray PJ Understanding and exploiting the endogenous interleukin-10/STAT3-mediated anti-inflammatory response. Curr. Opin. Pharmacol 6, 379–386 (2006). [DOI] [PubMed] [Google Scholar]
- 38.Roberts TC, Langer R & Wood MJA Advances in oligonucleotide drug delivery. Nat. Rev. Drug Discov 19, 673–694 (2020). [DOI] [PMC free article] [PubMed] [Google Scholar]
- 39.Krieg AM Development of TLR9 agonists for cancer therapy. J. Clin. Invest 117, 1184–1194 (2007). [DOI] [PMC free article] [PubMed] [Google Scholar]
- 40.Kortylewski M et al. In vivo delivery of siRNA to immune cells by conjugation to a TLR9 agonist enhances antitumor immune responses. Nat. Biotechnol 27, 925–932 (2009). [DOI] [PMC free article] [PubMed] [Google Scholar]
- 41.Maurer T et al. CpG–DNA aided cross-presentation of soluble antigens by dendritic cells. Eur. J. Immunol 32, 2356–2364 (2002). [DOI] [PubMed] [Google Scholar]
- 42.Edelson BT et al. Peripheral CD103+ dendritic cells form a unified subset developmentally related to CD8α+ conventional dendritic cells. J. Exp. Med 207, 823–836 (2010). [DOI] [PMC free article] [PubMed] [Google Scholar]
- 43.Xu J et al. Single-cell profiling reveals transcriptional signatures and cell–cell crosstalk in anti-PLA2R positive idiopathic membranous nephropathy patients. Front. Immunol 12, 683330 (2021). [DOI] [PMC free article] [PubMed] [Google Scholar]
- 44.Sharma P, Hu-Lieskovan S, Wargo JA & Ribas A Primary, adaptive, and acquired resistance to cancer immunotherapy. Cell 168, 707–723 (2017). [DOI] [PMC free article] [PubMed] [Google Scholar]
- 45.Moon EK et al. Blockade of programmed death 1 augments the ability of human T cells engineered to target NY-ESO-1 to control tumor growth after adoptive transfer. Clin. Cancer Res 22, 436–447 (2016). [DOI] [PMC free article] [PubMed] [Google Scholar]
- 46.Robbins PF et al. Single and dual amino acid substitutions in TCR CDRs can enhance antigen-specific T cell functions. J. Immunol 180, 6116–6131 (2008). [DOI] [PMC free article] [PubMed] [Google Scholar]
- 47.Abram CL, Roberge GL, Hu Y & Lowell CA Comparative analysis of the efficiency and specificity of myeloid-Cre deleting strains using ROSA-EYFP reporter mice. J. Immunol. Methods 408, 89–100 (2014). [DOI] [PMC free article] [PubMed] [Google Scholar]
- 48.Yankova E et al. Small-molecule inhibition of METTL3 as a strategy against myeloid leukaemia. Nature 593, 597–601 (2021). [DOI] [PMC free article] [PubMed] [Google Scholar]
- 49.Herbst RS et al. Predictive correlates of response to the anti-PD-L1 antibody MPDL3280A in cancer patients. Nature 515, 563–567 (2014). [DOI] [PMC free article] [PubMed] [Google Scholar]
- 50.Powles T et al. MPDL3280A (anti-PD-L1) treatment leads to clinical activity in metastatic bladder cancer. Nature 515, 558–562 (2014). [DOI] [PubMed] [Google Scholar]
- 51.Ma S et al. The RNA m6A reader YTHDF2 controls NK cell antitumor and antiviral immunity. J. Exp. Med 218, e20210279 (2021). [DOI] [PMC free article] [PubMed] [Google Scholar]
- 52.Wang F et al. Crosstalks between mTORC1 and mTORC2 variagate cytokine signaling to control NK maturation and effector function. Nat. Commun 9, 4874 (2018). [DOI] [PMC free article] [PubMed] [Google Scholar]
- 53.Wang Y et al. The IL-15–AKT–XBP1s signaling pathway contributes to effector functions and survival in human NK cells. Nat. Immunol 20, 10–17 (2019). [DOI] [PMC free article] [PubMed] [Google Scholar]
- 54.Butler A, Hoffman P, Smibert P, Papalexi E & Satija R Integrating single-cell transcriptomic data across different conditions, technologies, and species. Nat. Biotechnol 36, 411–420 (2018). [DOI] [PMC free article] [PubMed] [Google Scholar]
- 55.Subramanian A et al. Gene set enrichment analysis: a knowledge-based approach for interpreting genome-wide expression profiles. Proc. Natl Acad. Sci. USA 102, 15545–15550 (2005). [DOI] [PMC free article] [PubMed] [Google Scholar]
- 56.Kramer A, Green J, Pollard J Jr. & Tugendreich S Causal analysis approaches in Ingenuity Pathway Analysis. Bioinformatics 30, 523–530 (2014). [DOI] [PMC free article] [PubMed] [Google Scholar]
- 57.Kim D, Langmead B & Salzberg SL HISAT: a fast spliced aligner with low memory requirements. Nat. Methods 12, 357–360 (2015). [DOI] [PMC free article] [PubMed] [Google Scholar]
- 58.Zhang Y et al. Model-based analysis of ChIP–seq (MACS). Genome Biol. 9, R137 (2008). [DOI] [PMC free article] [PubMed] [Google Scholar]
- 59.Heinz S et al. Simple combinations of lineage-determining transcription factors prime cis-regulatory elements required for macrophage and B cell identities. Mol. Cell 38, 576–589 (2010). [DOI] [PMC free article] [PubMed] [Google Scholar]
- 60.Anders S, Pyl PT & Huber W HTSeq—a Python framework to work with high-throughput sequencing data. Bioinformatics 31, 166–169 (2015). [DOI] [PMC free article] [PubMed] [Google Scholar]
- 61.Love MI, Huber W & Anders S Moderated estimation of fold change and dispersion for RNA-seq data with DESeq2. Genome Biol. 15, 550 (2014). [DOI] [PMC free article] [PubMed] [Google Scholar]
- 62.Freund EC et al. Efficient gene knockout in primary human and murine myeloid cells by non-viral delivery of CRISPR–Cas9. J. Exp. Med 217, e20191692 (2020). [DOI] [PMC free article] [PubMed] [Google Scholar]
- 63.Singhal S et al. Human tumor-associated monocytes/macrophages and their regulation of T cell responses in early-stage lung cancer. Sci. Transl. Med 11, eaat1500 (2019). [DOI] [PMC free article] [PubMed] [Google Scholar]
- 64.Tang Z, Kang B, Li C, Chen T & Zhang Z GEPIA2: an enhanced web server for large-scale expression profiling and interactive analysis. Nucleic Acids Res. 47, W556–W560 (2019). [DOI] [PMC free article] [PubMed] [Google Scholar]
- 65.He S et al. MicroRNAs activate natural killer cells through Toll-like receptor signaling. Blood 121, 4663–4671 (2013). [DOI] [PMC free article] [PubMed] [Google Scholar]
Associated Data
This section collects any data citations, data availability statements, or supplementary materials included in this article.
Supplementary Materials
Data Availability Statement
The scRNA-seq, m6A-seq and RIP–seq data reported in this paper are deposited in the Gene Expression Omnibus under accession numbers GSE188400 and GSE189193. The remaining data that support our study’s findings are available from the corresponding authors upon request. Source data are provided with this paper.