

Abstract
Background and Aims:
Type 2 diabetes (T2D) is a growing problem in children. Children with NAFLD are at potentially high-risk for developing T2D; however, the incidence of T2D in this population is unknown. This study aimed to determine the incidence of T2D in children with NAFLD and identify associated risk factors.
Methods:
Children with NAFLD enrolled in the Nonalcoholic Steatohepatitis Clinical Research Network were followed longitudinally. Incidence of T2D was determined using clinical history and fasting laboratory values. Cumulative incidence curves were developed for time to T2D. A Cox regression multivariable model was constructed using best subsets Akaike’s Information Criteria selection.
Results:
This study included 892 children with NAFLD and with a mean age of 12.8 (2.7) years followed for 3.8 (2.3) years with a total 3,234 person-years at risk. The incidence rate of T2D was 3,000 new cases per 100,000 person-years at risk. At baseline, 63 children had T2D, and during follow-up, an additional 97 children developed incident T2D, resulting in a period prevalence of 16.8 %. Incident T2D was significantly higher in females versus males (HR 1.8 [1.0–2.8]), associated with BMI z-score (HR 1.8 [1.0–3.0]), and more severe liver histology including steatosis grade (HR 1.3 [ 1.0–1.7]), and fibrosis stage (HR 1.3 [1.0–1.5]).
Conclusions:
Children with NAFLD are at high risk for existing and incident T2D. In addition to known risk factors for T2D (females and BMI z-score), severity of liver histology at the time of NAFLD diagnosis was independently associated with T2D development. Targeted strategies to prevent T2D in children with NAFLD are needed.
Keywords: obesity, gender, Hispanic, steatohepatitis
INTRODUCTION
Type 2 diabetes (T2D) accounts for 90% of all diabetes in adults and is a leading cause of morbidity and mortality. 1 In children, T2D is encountered with increasing frequency with a 95% rise in prevalence from 34 per 100,000 youth in 2001 to 67 per 100,000 youth in 2017. 2 This is alarming as T2D in youth has a more aggressive disease course than in adults; beta-cell function declines more rapidly and complications develop more quickly. 3 Given the increasing prevalence in youth, T2D will continue to grow as a major public health problem in the United States as children mature into adults. 4 Therefore, characterizing factors contributing to development of T2D in the pediatric population is critical.
The liver plays a prominent role in glucose homeostasis by controlling various metabolic pathways such as glycogenesis, glycogenolysis, glycolysis and gluconeogenesis. 5 This relationship is further evident by the frequent coexistence of T2D and nonalcoholic fatty liver disease (NAFLD), which is well-established in adults related to shared risk factors of insulin resistance and visceral adiposity. 6 NAFLD is present in 50 to 75% of adults with T2D, whereas the prevalence of T2D in adults with NAFLD is approximately 20%. 7,8 Moreover, adults with NAFLD are at an increased risk for subsequent T2D. 9 Collectively, data suggest that the pathologic process in the liver that occurs in NAFLD may be a prominent driver of impaired glucose metabolism, and a predisposing risk factor for development of T2D.
NAFLD is the most common chronic liver disease in the pediatric population. 10,11 Children with NAFLD have features of insulin resistance, 12 and thus, may also be at risk for T2D. We have previously shown that approximately one in 15 children with NAFLD have T2D at the time of diagnosis. 13 Although a majority of children with NAFLD do not have T2D at initial diagnosis, we hypothesized they are at increased risk for developing this condition over time, especially considering the increased coexistence of these conditions in adult populations. 14 However, the incidence of T2D in children with NAFLD is not known. Therefore, this study aimed to determine the incidence of T2D in children with NAFLD. An additional aim was to identify demographic, clinical, and histologic risk factors associated with incident T2D in children with NAFLD.
METHODS
Cohort
Participants were children with NAFLD enrolled in prospective cohort studies of the Nonalcoholic Steatohepatitis Clinical Research Network (NASH CRN) between 2004–2017 at 15 participating pediatric clinical centers across the United States (see acknowledgements). Studies were approved by the institutional review board at each participating center. Written consent was obtained from a parent or guardian, and written assent was obtained from all children 8 years or older prior to participation. We included children < 18 years old with biopsy-confirmed NAFLD enrolled in the NASH CRN within 3 months of diagnosis. Exclusion criteria were having < 9 months of follow-up and/or having type 1 or 2 diabetes at enrollment.
NAFLD Diagnosis
NAFLD diagnosis was based on liver histology with ≥ 5% of hepatocytes containing macrovesicular fat, with exclusion of other causes of liver disease by history, laboratories, and histology. Liver biopsy specimens were stained with hematoxylin-eosin and Masson’s trichrome stain and centrally reviewed by the Pathology Committee of the NASH CRN using the NASH CRN scoring system. 15 The Pathology Committee was masked to demographic and clinical data. Consensus histologic assessment was determined for each of the following parameters (with corresponding ordinal scales): steatosis grade (0–3), lobular inflammation (0–3), portal inflammation (0–2), hepatocellular ballooning (0–2) and fibrosis stage (0–4). Steatosis grade was based on the following: grade 0, < 5% steatosis; grade 1, 5 to 33%; grade 2, 34 to 66%; and grade 3, > 66%. Fibrosis was staged based on the following: stage 0 (no fibrosis), stage 1a (mild zone 3 perisinusoidal requiring trichrome stain), stage 1b (moderate zone 3 perisinusoidal fibrosis requiring trichrome stain), stage 1c (portal/periportal fibrosis only), stage 2 (zone 3 perisinusoidal and periportal), stage 3 (bridging fibrosis), and stage 4 (cirrhosis).
Liver biopsies were classified as NASH, borderline NASH, or NAFLD not NASH based on the aggregate presence and degree of individual features of NAFLD. A typical set of minimum criteria to diagnose NASH would include > 5% macrovesicular steatosis, lobular inflammation and hepatocyte injury manifested by ballooning degeneration.
Covariates
Demographic, anthropometric and laboratory data for participants were collected at baseline and annually thereafter. A structured interview was used to obtain demographic data. Weight and height were measured to the nearest 0.1 kg and 0.1 cm respectively. Weight, height, and waist measurements were performed in duplicate while wearing light clothing without shoes. BMI was calculated as weight (kg) divided by height (m) squared. To compare BMI among different ages and in both males and females, the BMI z-score was calculated. Participants fasted overnight before phlebotomy. Laboratory assays included: glucose, insulin, hemoglobin A1C (HbA1C), alanine aminotransferase (ALT), aspartate aminotransferase (AST), gamma glutamyltransferase (GGT), total cholesterol, high-density lipoprotein (HDL) cholesterol, low-density lipoprotein (LDL) cholesterol, and triglycerides.
Type 2 Diabetes Definition
Participants attended a research visit annually. Per research protocol, all participants had annual screening for T2D, with measurement of fasting glucose and HbA1C. In addition, at the annual research visit, interval medical history was reviewed, including any new diagnoses made by the participants’ physician. Case definitions for T2D were assigned based on laboratory parameters as defined by the American Diabetes Association (ADA) as described in other large epidemiologic studies. 16 T2D was defined if children met at least one of the following criteria: 1) fasting serum glucose ≥ 126 mg/dL; 2) HbA1C ≥ 6.5%.; 3) new interval diagnosis of T2D reported by the participant and confirmed by review of medical records.
Data Analysis
Baseline descriptive analysis of the demographic, clinical, and histopathologic characteristics of the patient population was performed. Incidence rates of T2D were calculated with the numerator equal to the number of patients who developed T2D (as defined above), divided by the denominator, which is the number of person-years at risk, with the time at risk beginning with diabetes-free enrollment. Rates were expressed as incident cases per 100,000 person years at risk. Incidence rates overall and by select subgroups were presented. Multivariable analysis used the Cox proportional hazards model of time to incident T2D, with censoring at the end of follow-up for each patient. Risk factors considered were the baseline characteristics shown in Table 1, except for measures of glucose metabolism, as these served as outcome measures; 95% confidence intervals and p-values were determined from the maximum partial likelihood fit.
Table 1.
Baseline characteristics of the study population
| Incident T2D (N=97) | No Incident T2D (N=795) | Total (N=892) | P | |
|---|---|---|---|---|
|
| ||||
| Demographics | ||||
| Age at enrollment (years) | 13.5 (2.6) | 12.8 (2.7) | 12.8 (2.7) | 0.02 |
| Male | 63 (65%) | 587 (74%) | 650 (73%) | 0.06 |
| Hispanic | 62 (64%) | 587 (74%) | 649 (73%) | 0.04 |
| Anthropometrics | ||||
| Weight (kg) | 87.8 (25.3) | 80.5 (25.2) | 81.3 (25.3) | 0.007 |
| Body-mass index (kg/m2) | 33.4 (6.3) | 31.6 (6.1) | 31.8 (6.2) | 0.008 |
| Body-mass index z-score | 2.3 (0.4) | 2.2 (0.4) | 2.2 (0.4) | 0.31 |
| Waist circumference (cm) | 106.9 (14.2) | 102.5 (15.3) | 103.0 (15.2) | 0.007 |
| Waist to hip ratio | 0.994 (0.061) | 0.985 (0.064) | 0.986 (0.064) | 0.22 |
| Systolic blood pressure (mm Hg) | 122.2 (14.5) | 119.8 (13.3) | 120.0 (13.5) | 0.10 |
| Diastolic blood pressure (mm Hg) | 68.8 (9.2) | 67.3 (9.7) | 67.5 (9.6) | 0.17 |
| Pubertal Stage | ||||
| Tanner genital/breast stage | ||||
| Mean (SD) | 2.9 (1.5) | 2.5 (1.5) | 2.5 (1.5) | 0.04 |
| Stage 1, (N [%]) | 18 (23%) | 228 (36%) | 246 (34%) | 0.04 |
| Stage 2–4, (N [%]) | 46 (58%) | 312 (49%) | 358 (50%) | |
| Stage 5, (N [%]) | 16 (20%) | 96 (15%) | 112 (16%) | |
| Tanner pubic hair stage | ||||
| Mean (SD) | 2.8 (1.5) | 2.5 (1.5) | 2.5 (1.5) | 0.06 |
| Stage 1, (N [%]) | 22 (28%) | 250 (39%) | 272 (38%) | 0.10 |
| Stage 2–4, (N [%]) | 43 (54%) | 288 (46%) | 331 (46%) | |
| Stage 5, (N [%]) | 15 (19%) | 95 (15%) | 110 (15%) | |
| Liver enzymes – Geometric means (95% CI) | ||||
| Alanine aminotransferase (U/L) | 98 (85–113) | 80 (76–84) | 82 (78–86) | 0.005 |
| Aspartate aminotransferase (U/L) | 61 (54–68) | 50 (48–52) | 51 (49–53) | 0.001 |
| Alkaline phosphatase (U/L) | 195 (176–216) | 210 (203–217) | 208 (201–215) | 0.17 |
| γ-glutamyl transpeptidase (U/L) | 41 (37–47) | 36 (34–37) | 36 (35–38) | 0.02 |
| Lipids | ||||
| Total cholesterol (mg/dL) | 169.6 (39.9) | 164.4 (36.5) | 165.0 (36.9) | 0.20 |
| HDL cholesterol (mg/dL) | 37.2 (8.5) | 39.7 (9.5) | 39.4 (9.4) | 0.01 |
| LDL cholesterol (mg/dL) | 99.3 (29.8) | 96.8 (29.7) | 97.1 (29.7) | 0.43 |
| Triglycerides (mg/dL) – geometric mean (95% CI) | 147 (132–164) | 126 (121–130) | 128 (123–132) | 0.006 |
| Triglycerides/HDL – geometric mean (95% CI) | 4.1 (3.6–4.6) | 3.3 (3.1–3.4) | 3.3 (3.2–3.5) | 0.001 |
| Measures of glucose metabolism | ||||
| HbA1c (%) | 5.5 (0.4) | 5.3 (0.4) | 5.3 (0.4) | <0.001 |
| Fasting serum glucose (mg/dL) | 89.7 (12.2) | 87.0 (9.8) | 87.3 (10.1) | 0.01 |
| Insulin (μU/mL)‡ – geometric mean (95% CI) | 31 (26–36) | 25 (24–26) | 25 (24–27) | 0.01 |
| HOMA-IR (glucose [mmol/L] x insulin [μU/mL]/22.5)§ – geometric mean (95% CI) | 6.8 (5.8–7.9) | 5.3 (5.0–5.6) | 5.4 (5.2–5.7) | 0.006 |
| Liver histology findings | ||||
| NAFLD activity score‖ | 4.6 (1.6) | 4.0 (1.4) | 4.1 (1.4) | <0.001 |
| Steatosis amount | 0.28 | |||
| <33% | 20 (21%) | 223 (28%) | 243 (27%) | |
| 34–66% | 32 (33%) | 249 (31%) | 281 (32%) | |
| >66% | 45 (46%) | 323 (41%) | 368 (41%) | |
| Lobular inflammation - number of foci under 20x magnification | 0.002 | |||
| <2 | 46 (47%) | 474 (60%) | 520 (58%) | |
| 2–4 | 39 (40%) | 285 (36%) | 324 (36%) | |
| >4 | 12 (12%) | 36 (5%) | 48 (5%) | |
| Hepatocellular ballooning | <0.001 | |||
| None | 49 (51%) | 520 (65%) | 569 (64%) | |
| Few | 25 (26%) | 202 (25%) | 227 (25%) | |
| Many | 23 (24%) | 73 (9%) | 96 (11%) | |
| Portal inflammation | 0.78 | |||
| None | 8 (8%) | 84 (11%) | 92 (10%) | |
| Mild | 74 (76%) | 590 (74%) | 664 (74%) | |
| More than mild | 15 (15%) | 121 (15%) | 136 (15%) | |
| Fibrosis stage | 0.007 | |||
| 0 – None | 26 (27%) | 284 (36%) | 310 (35%) | |
| 1a - Mild, zone 3 perisinusoidal | 4 (4%) | 45 (6%) | 49 (6%) | |
| 1b - Moderate, zone 3 perisinusoidal | 6 (6%) | 25 (3%) | 31 (3%) | |
| 1c - Portal/periportal only | 21 (22%) | 247 (31%) | 268 (30%) | |
| 2 - Zone 3 and periportal, any combination | 21 (22%) | 92 (12%) | 113 (13%) | |
| 3 – Bridging | 18 (19%) | 91 (11%) | 109 (12%) | |
| 4 – Cirrhosis | 1 (1%) | 8 (1%) | 9 (1%) | |
| Steatohepatitis diagnosis | <0.001 | |||
| No | 24 (25%) | 257 (32%) | 281 (32%) | |
| Borderline Zone 3 pattern | 17 (18%) | 117 (15%) | 134 (15%) | |
| Borderline Zone 1 pattern | 21 (22%) | 276 (35%) | 297 (33%) | |
| Definite |
35 (36%) | 145 (18%) | 180 (20%) | |
Data are n (%) or mean (SD), unless otherwise noted. P-values determined from t-tests, chi-square tests, or Fisher’s exact tests.
NAFLD activity score was assessed on a scale of 0–8, with higher scores showing more-severe disease (the components of this measure are steatosis [assessed on a scale of 0–3], lobular inflammation [assessed on a scale of 0–3], and hepatocellular ballooning [assessed on a scale of 0–2]).
We developed a parsimonious model using the best subset based on Akaike’s Information Criterion (AIC), a penalized likelihood method that is a trade-off between goodness of fit versus model size, with smaller AICs corresponding to models with more information about the outcome. An advantage to AIC selection is that it does not depend on p-values. The candidate set of risk factors included: age (years, continuous), sex (binary), ethnicity (binary, Hispanic/Latino vs. not Hispanic/Latino), BMI z-score (continuous), fibrosis stage (binary, stage 2–4 vs. stage 0–1), steatosis grade (binary, steatosis≥33% vs. <33%), lobular inflammation grade (binary, >4 vs. 0–4), ballooning grade (binary, many vs. none/few), and steatohepatitis diagnosis (binary, definite vs. none/borderline). Models were presented both with and without adjustment for metformin use. Proportionality of the model was assessed using Schoenfeld’s test and graphical displays. The assumption of proportionality was sufficiently met. We also used unadjusted Kaplan-Meier plots compared with log-rank tests for risk factors of interest. Missing data were minimal due to the requirement of complete baseline data for study entry. Items with missing data were dropped from the analysis; no imputation methods were used. Two-sided p-values were considered significant if p <0.05. Analyses were performed using SAS statistical software, version 9.4 (SAS Institute Inc., Carey, NC) and Stata, release 15.1 (StataCorp, College Station, TX).
RESULTS
Study population
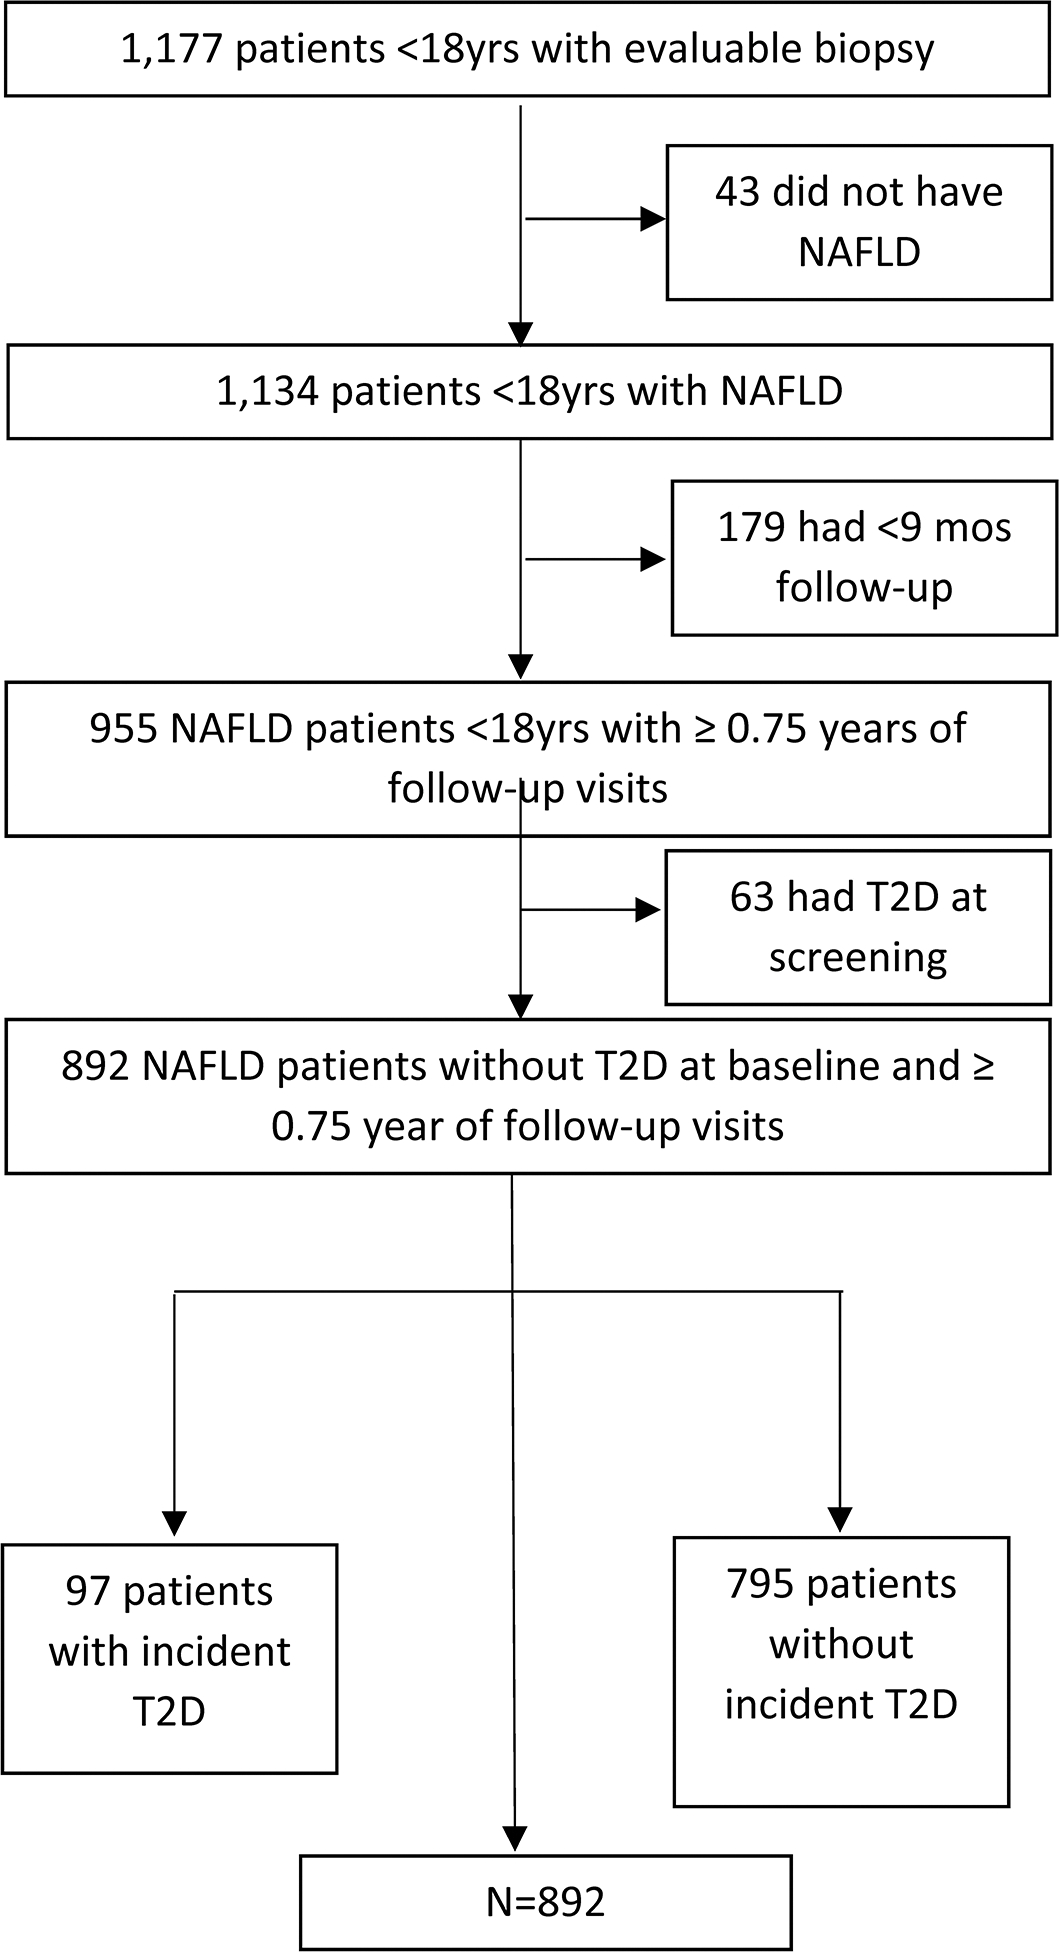
As shown in Figure 1, there were 955 children with NAFLD and sufficient follow-up. Of these, we excluded 6.6% (63/955) because they had T2D at the time of initial evaluation. Therefore, 892 children were included in the evaluation of incident T2D. Demographic and clinical parameters are shown in Table 1. Mean age of participants at baseline was 12.8 (2.7) years with a majority male (73%). Mean BMI was 31.8 (6.2) kg/m2 and mean BMI z-score was 2.2 (0.4). A full range of NAFLD disease severity was represented in this cohort, with 32% (281/892) having mild disease with NAFLD but not NASH, 33% (297/892) having borderline zone 1 NASH, 15% (134/892) having borderline zone 3 NASH, and 20% (180/892) having definite NASH. At baseline, 12% of participants (109/892) had stage 3 fibrosis and 1% (9/892) had cirrhosis (Table 1). Of note, 3.7% (33/892) of children without T2D were taking metformin at baseline: 7 for polycystic ovarian syndrome, and 26 for treatment of NAFLD or insulin resistance.
Figure 1. Flow diagram showing participants evaluated and included in study.
Incidence of Type 2 Diabetes
The mean follow-up time for children with NAFLD in our study cohort was 3.8 (+/− 2.3) years with a total of 3,234 person-years at risk. T2D developed in 97 children (11%) during follow-up. Combined with 63 children having a diagnosis of T2D at the time of NAFLD diagnosis, the period prevalence of T2D was 16.8% of children (63+ 97/955). For those with incident T2D, the mean duration from initial evaluation to onset of T2D was 3.1 years (SD 1.9). The incidence rate of T2D in children with NAFLD was 3,000 new cases per 100,000 person-years at risk (95% CI 2403–3,597) (Table 2). Of note, 9 participants taking metformin at baseline developed incident T2D.
Table 2.
Incidence of T2D in children with nonalcoholic fatty liver disease
| Subgroup | N | T2DM Events | Total PYs | Incidence Rate (95% CI) (per 100,000 PY)* |
|---|---|---|---|---|
|
| ||||
| Overall | 892 | 97 | 3,233 | 3,000 (2,433 – 3,660) |
| Males | 650 | 63 | 2,347 | 2,684 (2,063 – 3,434) |
| Females | 242 | 34 | 887 | 3,833 (2,655 – 5,356) |
| Steatosis <33% | 243 | 20 | 922 | 2,169 (1,325 – 3,350) |
| Steatosis ≥33% | 649 | 77 | 2,311 | 3,332 (2,629 – 4,164) |
| None/borderline NASH | 712 | 62 | 2,599 | 2,386 (1,829 – 3,058) |
| Definite NASH | 180 | 35 | 634 | 5,521 (3,845 – 7,678) |
| Fibrosis stage 0–1† | 658 | 57 | 2,392 | 2,383 (1,805 – 3,087) |
| Fibrosis stage 2–4 | 231 | 40 | 834 | 4,796 (3,426 – 6,531) |
Incident rate = (number that developed T2D in follow-up/person years of follow-up) x 100,000, where person years of follow-up is the total number of years of follow-up for those who did not develop the event, and the time from enrollment to diagnosis, for those that did develop the event. Total person years of follow-up in those with incident T2D=308; total person years of follow-up in those without incident T2D=2926.
Three biopsies were missing fibrosis staging due to insufficient tissue or no Masson’s trichrome slide available for review.
Cumulative Incidence
The association of T2D risk with sex and baseline histologic features is depicted through cumulative incidence curves in Figure 2. Cumulative incidence was examined at a time-point of four years to coincide with the mean follow-up time period for the study population. Children with histologic features of severe lobular inflammation, ballooning, NASH diagnosis and fibrosis stage > 1 at baseline were significantly more likely to develop T2D. Notably, after 4 years of follow-up, the cumulative incidence of T2D in participants with definite NASH at baseline was more than twice that of those without definite NASH (21% versus 10%, HR 2.3 [1.5, 3.5], p< 0.001). Children with fibrosis stages 2–4 were also significantly more likely to develop T2D with a cumulative incidence of T2D in 19%, compared to 10% in those with fibrosis stages 0–1 at 4 years ([HR 2.0 (1.3, 3.0)], p=0.001).
Figure 2. Cumulative incidence of type 2 diabetes.
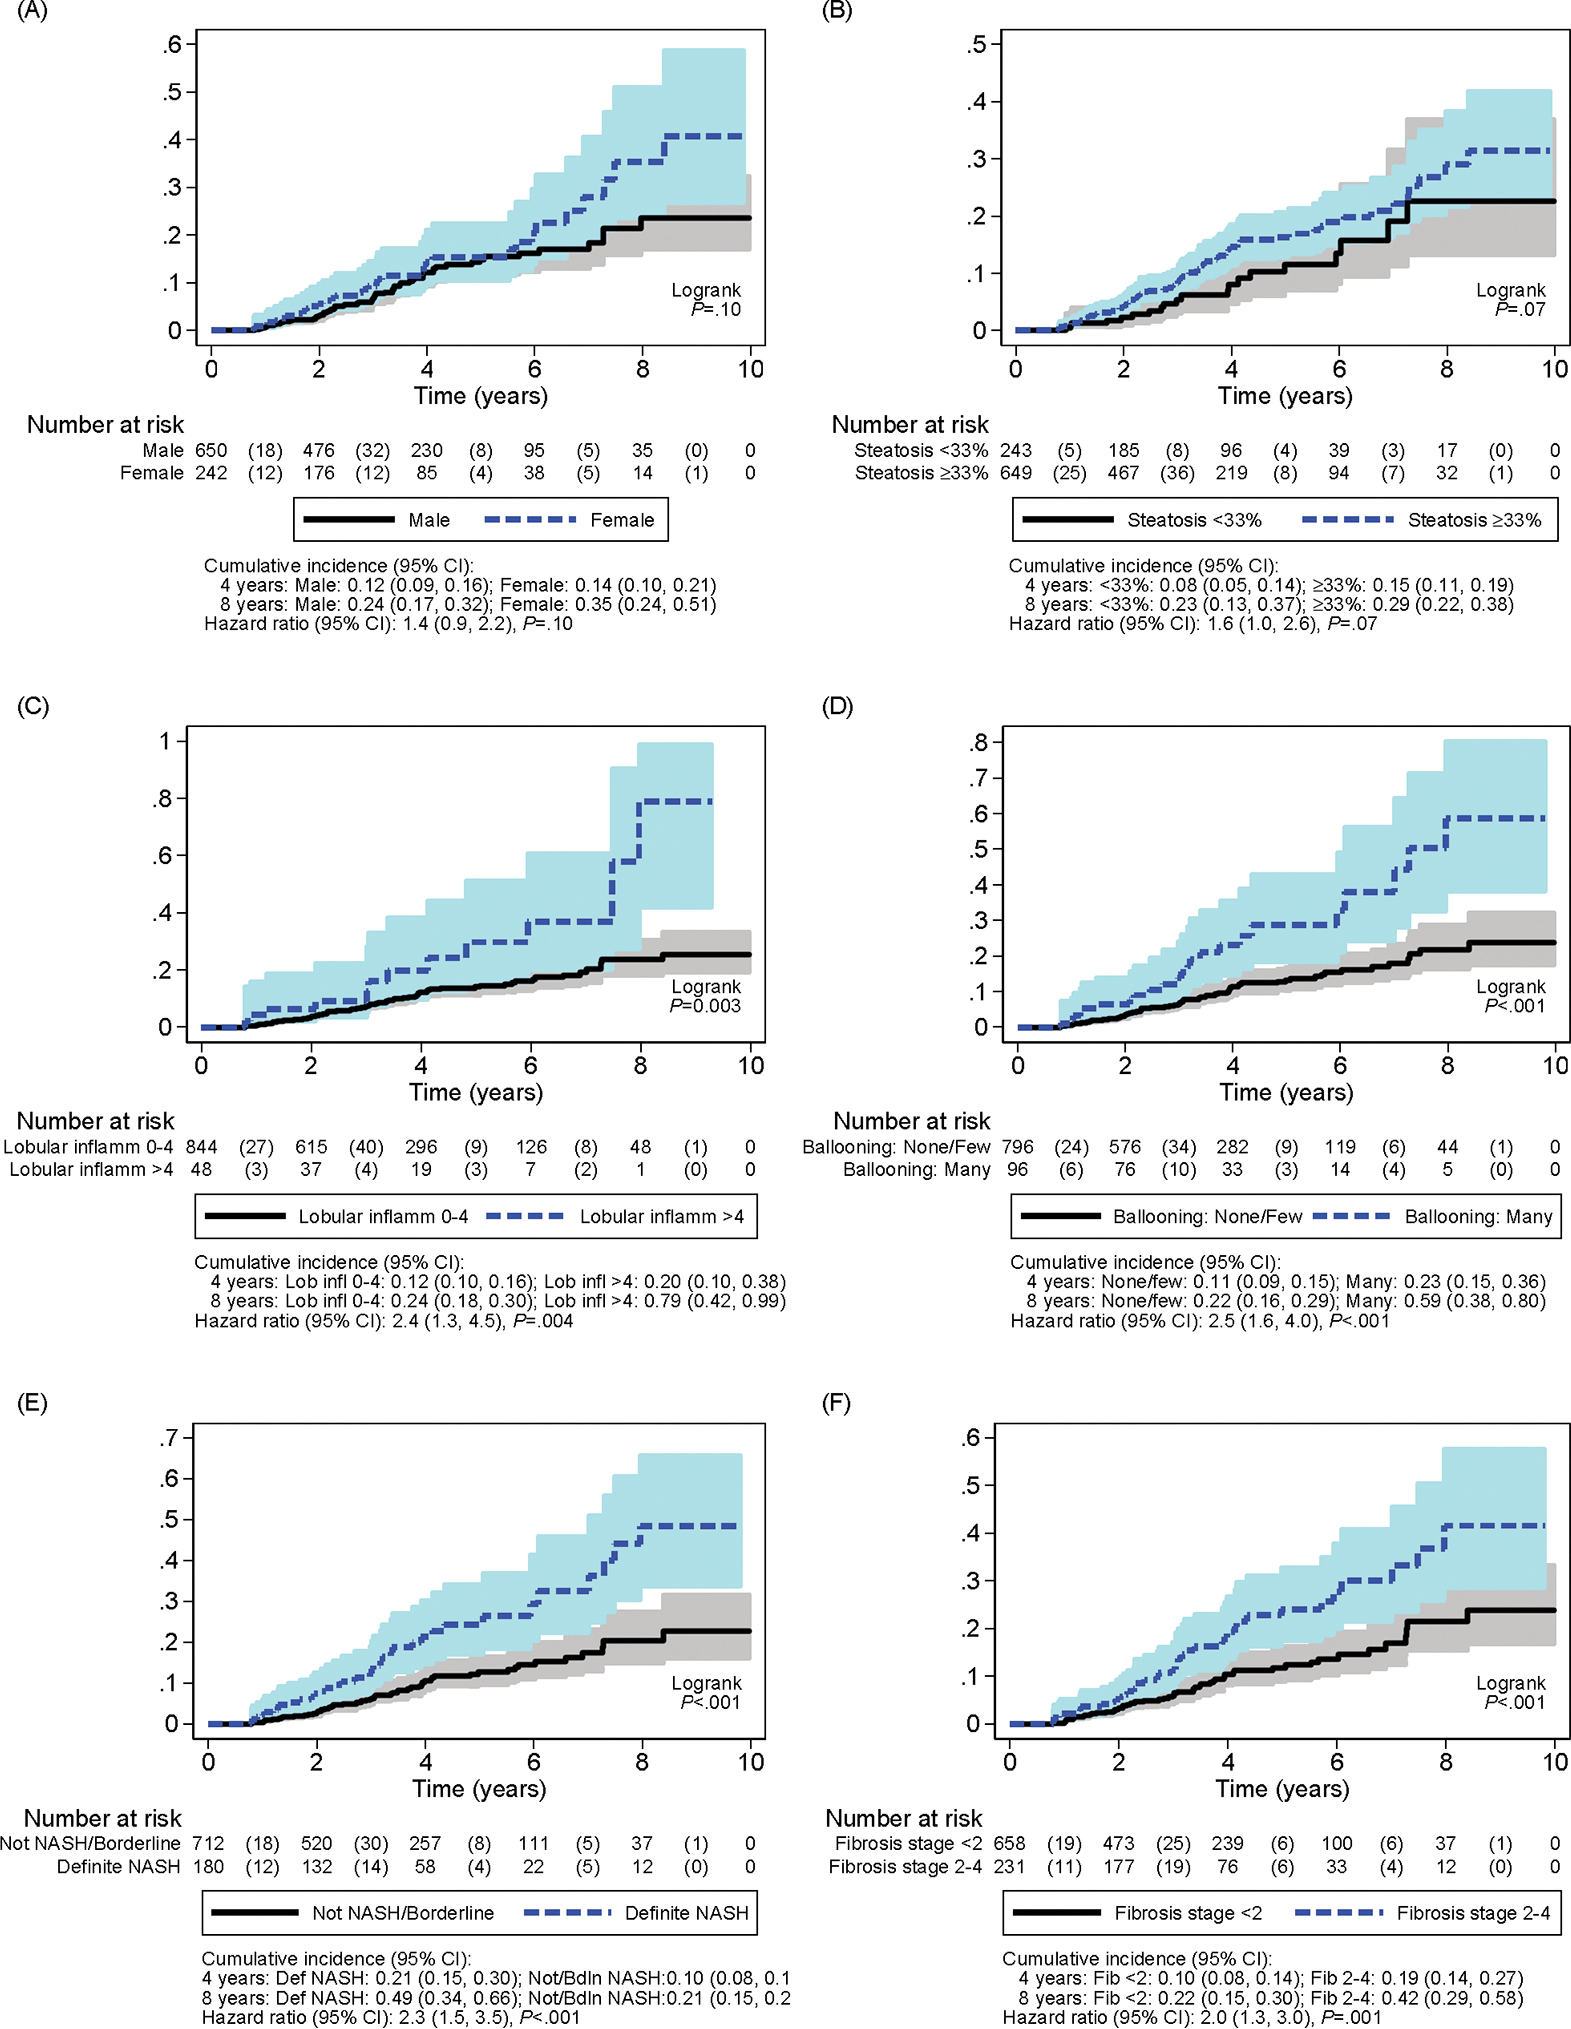
Cumulative incidence curves of type 2 diabetes over 10 years by (A) sex, (B) steatosis grade < 33% versus ≥ 33%, (C) lobular inflammation grade 0–4 versus > 4, (D) ballooning grade none/few versus many, (E) Not NASH/borderline versus definite NASH, and (F) fibrosis stage < 2 versus fibrosis stage 2–4.
Cox Regression of Time to Incident Diabetes
Cox regression models were developed for time to T2D (Table 3). Within the multivariable model, female sex significantly increased risk of developing T2D by 80% (HR 1.8 [1.0–2.8], p=0.007). BMI z-score was significantly positively associated with risk of T2D (HR 1.8 [1.0–3.0], p= 0.03). Notably, there was a significant increased relative hazard of developing T2D based on baseline histologic features of steatosis grade (HR 1.3, [1.0–1.7], p= 0.04), ballooning grade (HR 1.3 [1.0–1.8], p=0.03), and fibrosis stage (HR 1.3 [1.0–1.5], p=0.03). As shown in Table 3, adjusting for baseline metformin use did not change these results.
Table 3.
Multivariable Cox regression of T2D by baseline risk factors, with and without adjustment for baseline metformin use
| Multivariable model* | Multivariable model, adjusting for baseline metformin use | |||||
|---|---|---|---|---|---|---|
|
|
||||||
| HR | 95% CI | P | HR | 95% CI | P | |
|
| ||||||
| Baseline Characteristic | ||||||
| Female vs. male | 1.8 | 1.2 – 2.8 | 0.008 | 1.7 | 1.1 – 2.7 | 0.02 |
| Age at enrollment (years) | 1.2 | 1.1 – 1.3 | <0.001 | 1.2 | 1.1 – 1.3 | <0.001 |
| Body-mass index z-score | 1.8 | 1.0 – 3.0 | 0.04 | 1.7 | 1.0 – 2.9 | 0.05 |
| Steatosis score (≥33% vs. <33%) | 1.7 | 1.0 – 2.8 | 0.04 | 1.7 | 1.0 – 2.8 | 0.03 |
| Ballooning score (many vs. none/few) | 1.7 | 1.0 – 2.9 | 0.04 | 1.7 | 1.0 – 2.8 | 0.04 |
| Fibrosis (stage 2–4 vs. 0–1) | 1.8 | 1.1 – 2.8 | 0.01 | 1.7 | 1.1 – 2.7 | 0.02 |
Multivariable model includes all variables listed in the table, determined from best subsets AIC selection. N=888 due to missing data.
DISCUSSION
We evaluated the incidence of T2D in a cohort of 892 children with NAFLD from 15 centers across the United States followed for an average of four years. T2D was already present in 6.6% of children with NAFLD upon initial assessment. For children with NAFLD that did not have T2D at baseline, the incidence rate of T2D was 3000 cases per 100,000 person-years, for an annual incident rate of 3% in children enrolled in the NASH CRN. Risk factors associated with increased risk of incident T2D included female sex, older age, higher BMI z-score, and more severe histologic liver disease, including steatosis grade, ballooning score, and fibrosis stage.
T2D has emerged as a concerning chronic disease impacting today’s youth4 with a rising incidence in children worldwide.17,18 Recent analysis from a large U.S. population-based registry, SEARCH for Diabetes in Youth Study, demonstrated that the incidence of T2D increased from 9.0 per 100,000 person-years in 2002–2003, to 13.8 per 100,000 person-years in 2014–2015 in children aged 10–19 years old.19 Risk is known to differ by race and ethnicity, with the highest incidence rates reported among American Indian children (46.5/100,000 person-years), non-Hispanic Black children (32.6/100,000 person-years) and Hispanic children (18.2/100,000 person-years) compared to non-Hispanic White children (3.9/100,000 person-years). 20 Moreover, obesity influences risk of T2D; the incidence of T2D in a population of 369,362 children with obesity over 20 years was 103.3 per 100,000 person-years. 21 The incidence of T2D observed in children with NAFLD in this study, 3,000 per 100,000 person-years, was much higher than previously reported. This variation in incidence is not sufficiently explained by confounding factors of race, ethnicity, or obesity, as severity of NAFLD was independently associated with increased risk of incident T2D. This high incidence suggests that a diagnosis of NAFLD identifies children at a particularly increased risk for developing T2D; the pathophysiologic mechanisms that contribute to the development of NAFLD may influence this T2D risk.
Insulin resistance is a key driver of both NAFLD and T2D. 12,22 The sequence of events determining whether NAFLD or T2D develops first is unclear and may differ between each individual child. Of those participants with T2D, approximately 60% developed NAFLD prior to the development of diabetes. Severity of hepatic histology at baseline in children with NAFLD without T2D was shown to be a significant risk factor for subsequent T2D. Both steatosis grade and fibrosis stage independently increased risk for incident T2D. Previous studies in children have demonstrated an association between the degree of hepatic steatosis and severity of insulin resistance. In 118 adolescents with obesity, greater magnetic resonance imaging (MRI) hepatic fat fraction (HFF) was inversely correlated with insulin sensitivity and beta-cell function. 23 The specific role of the liver in this insulin-resistant state has been illustrated in two separate pediatric case-control studies, in which children with high liver fat, measured by MRI (HFF > 5.5%) or magnetic resonance spectroscopy (intrahepatic triglyceride content ≥10%), were found to have impaired action of insulin on both liver and skeletal muscle compared to those with normal liver fat, independent of BMI and visceral fat. 24,25 Multiple adult studies have found that severity of hepatic fibrosis is associated with greater insulin resistance, independent of age, gender, BMI, and steatosis. 26, 27 Moreover, a recent study showed that the severity of liver fibrosis in adults with NAFLD but without T2D was associated with decreased glucose tolerance. 28 This suggests that hepatic fibrosis may impact glucose homeostasis before overt T2D is present. Our study, which followed children longitudinally, provides further support that in the context of NAFLD, the liver may directly promote abnormal glucose metabolism.
Based upon our finding of high incidence of T2D in children with NAFLD, targeted prevention and screening for T2D in youth with NAFLD is important. Progression from normoglycemia to T2D has not been well-studied in children, and limited data exist on treatments to ameliorate progression of dysglycemia in this age group. 29 There is evidence that T2D progression is more aggressive in children than in adults; 3 however, the impact of T2D on the long-term morbidity and mortality in children with NAFLD has yet to be assessed. T2D impacts morbidity and mortality in adults with NAFLD, resulting in significantly higher overall and liver-related mortality, even after adjustment for potential confounders. 30 Therefore, with the risk for T2D in children with NAFLD, research is essential to identify both lifestyle and potential medication strategies to prevent the development of these dual diagnoses that may have synergistic negative implications on long-term health.
This study evaluated a large population of rigorously characterized children with biopsy-proven NAFLD followed by the NASH CRN, a multicenter collaboration with diverse geographic representation. This was a prospective study with a standardized systematic approach to data collection. The cohort had a broad and representative severity of NAFLD, with only 20% having definite NASH and only 13% having advanced fibrosis, similar to other epidemiologic studies of NAFLD in children with histologic data available.10 In further support that these children represent children seen for NAFLD more broadly, the mean ALT in our cohort of 82 U/L was similar to and not worse than that of a study 3608 children diagnosed with NAFLD from a community-based health maintenance organization.31 However, this population of children may not represent the general population of all children with NAFLD, many of whom may be undiagnosed. A limitation of this study is that there was only a single measure of glucose level each year. Utilizing fasting glucose and/or HbA1C parameters for T2D classification is endorsed by the ADA 32 for children; however, studies have shown these markers may underestimate diabetes in children.33, 34 An additional limitation of the study was some loss to follow-up of study participants over time.
In conclusion, children with NAFLD represent a high-risk group for both existing and incident T2D. The incidence rate of T2D in children with NAFLD is 30 times greater than previously reported in other pediatric populations at increased risk for T2D related to overweight/obesity status and/or race or ethnicity. The severity of liver disease at the time of NAFLD diagnosis in children is an independent prognostic factor for T2D risk. Children with NAFLD should be provided anticipatory guidance and closely monitored for T2D development. Targeted prevention strategies of T2D development in children with NAFLD are urgently required.
What You Need to Know:
Background:
Children with nonalcoholic fatty liver disease (NAFLD) are thought to be at increased risk for type 2 diabetes but there are no longitudinal studies, thus the incidence is unknown.
Findings:
In children with NAFLD in the NASH CRN, incidence of type 2 diabetes was 3,000 per 100,000 person-years. Baseline risk factors were female sex, severity of obesity and liver histology.
Implications for Patient Care:
Gastroenterologists caring for children with NAFLD should be aware of the risk for type 2 diabetes and provide anticipatory guidance, lifestyle intervention, and close monitoring.
ACKNOWLEDGMENTS
Members of the Nonalcoholic Steatohepatitis Clinical Research Network
Pediatric Clinical Centers
Baylor College of Medicine, Houston, TX: Donna Garner, CPNP; Paula Hertel, MD; Alicia Lawson, BS; Yen Pham, MD; Nicole Triggs, CPNP
Cincinnati Children’s Hospital Medical Center, Cincinnati, OH: Kristin Bramlage, MD; April Carr, BS, CCRP; Meghan McNeill, MS; Marialena Mouzaki, MD; Stavra Xanthakos, MD
Emory University, Atlanta, GA: Adina Alazraki, MD; Rebecca Cleeton, MPH, CCRP; Maria Cordero, CCRP; Saul Karpen, MD, PhD; Miriam Vos, MD, MSPH, FAHA
Indiana University School of Medicine/Riley Hospital for Children, Indianapolis, IN: Laura Carr, RN; Oscar W. Cummings, MD; Kathryn Harlow, MD; Ann Klipsch, RN; Jean P. Molleston, MD; Wendy Morlan, RN; Emily Ragozzino; Cindy Sawyers
Northwestern University Feinberg School of Medicine/Ann & Robert H. Lurie Children’s
Hospital of Chicago: Angela Anthony, CRC; Mark H. Fishbein, MD
Saint Louis University, St Louis, MO: Danielle Carpenter, MD; Theresa Cattoor, RN; Janet Freebersyser, RN; Ajay K Jain, MD; Susan Torretta
University of California San Diego, San Diego, CA: Cynthia Behling, MD, PhD; Janis Durelle; Nidhi P. Goyal, MD, MPH; Kimberly P. Newton, MD; Jeffrey B. Schwimmer, MD; Patricia Ugalde-Nicalo, MD, Andrew Wang, MD
University of Washington Medical Center and Seattle Children’s Hospital, Seattle, WA: Niviann Blondet, MD; Kara Cooper; Randolph Otto, MD; Matthew Yeh, MD, PhD; Melissa Young
Resource Centers
National Cancer Institute, Bethesda, MD: David E. Kleiner, MD, PhD
National Institute of Diabetes and Digestive and Kidney Diseases, Bethesda, MD: Edward C. Doo, MD; Sherry Hall, MS; Jay H. Hoofnagle, MD; Averell H. Sherker, MD; Rebecca Torrance, RN, MS; Patricia R. Robuck, PhD, MPH (2002–2011)
Data Coordinating Center, Johns Hopkins University, Bloomberg School of Public Health, Baltimore, MD: Peggy Adamo, BS; Patricia Belt, BS; Jeanne M. Clark, MD, MPH; Jill Meinert; Laura Miriel, BS; Carrie Shade; Emily P. Sharkey, MPH, MBA; Jacqueline Smith, AA; Michael Smith, BS; Alice Sternberg, ScM; James Tonascia, PhD; Mark L. Van Natta, MHS; Annette Wagoner; Laura A. Wilson, ScM; Tinsay Woreta, MD, MPH; Katherine P. Yates, ScM; John Dodge (2002–2018); Michele Donithan, MHS (2002–2017); Milana Isaacson, BS (2002–2018)
Funding source:
The Nonalcoholic Steatohepatitis Clinical Research Network (NASH CRN) is supported by the National Institute of Diabetes and Digestive and Kidney Diseases (NIDDK) (grants U01DK061713, U01DK061718, U01DK061728, U01DK061731, U01DK061732, U01DK061734, U01DK061737, U01DK061738, U01DK061730, U24DK061730). Additional support is received from the National Center for Advancing Translational Sciences (NCATS) (grants UL1TR000439, UL1TR000077, UL1TR000436, UL1TR000150, UL1TR000424, UL1TR000006, UL1TR000448, UL1TR000040, UL1TR000100, UL1TR000004, UL1TR000423, UL1TR000058, UL1TR000454).
TONIC:
The TONIC trial was conducted by the NASH CRN and supported in part by the Intramural Research Program of the National Cancer Institute and the Eunice Kennedy Shriver National Institute of Child Health and Human Development. The vitamin E and matching placebo were provided by Pharmavite through a Clinical Trial Agreement with the NIH.
CyNCh:
The CyNCh trial was conducted by the NASH CRN and supported in part by the Intramural Research Program of the National Cancer Institute and by a Collaborative Research and Development Agreement (CRADA) between NIDDK and Raptor Pharmaceuticals.
Abbreviations:
- ADA
American Diabetes Association
- AIC
Akaike’s Information Criterion
- ALT
alanine aminotransferase
- AST
aspartate aminotransferase
- BMI
body mass index
- CI
confidence interval
- GGT
gamma glutamyltransferase
- HbA1C
hemoglobin A1C
- HR
hazard ratio
- HDL
high-density lipoprotein cholesterol
- HFF
hepatic fat fraction
- LDL
low-density lipoprotein cholesterol
- MRI
magnetic resonance imaging
- NAFLD
nonalcoholic fatty liver disease
- NASH
nonalcoholic steatohepatitis
- NASH CRN
Nonalcoholic Steatohepatitis Clinical Research Network
- OGTT
oral glucose tolerance testing type 2 diabetes, T2D
Footnotes
Conflict of Interest Disclosures:
Kimberly P. Newton MD: No conflicts of interest to disclose.
Laura Wilson ScM: No conflicts of interest to disclose.
Nancy A. Crimmins MD, MS: No conflicts of interest to disclose.
Mark Fishbein MD: No conflicts of interest to disclose.
Jean Molleston MD: Research involvement with Gillead, Mirum, Albireo, Abbvie, and Cystic Fibrosis Foundation, not related to current project.
Stavra A. Xanthakos MD: Research funding from TargetRWE and Axcella Health, not related to current project; consultant for Intercept Pharmaceuticals related to pediatric NAFLD trials/treatment.
Cynthia Behling MD, PhD: Consultant for Pfizer.
Jeffrey B. Schwimmer MD: Research grants to UC San Diego from Intercept Pharmaceuticals, Genfit, Seraphina Therapeutics. Consultant for Merck.
REFERENCES
- 1.Zheng Y, Ley SH, Hu FB. Global aetiology and epidemiology of type 2 diabetes mellitus and its complications. Nat Rev Endocrinol. 2018;14(2):88–98. [DOI] [PubMed] [Google Scholar]
- 2.Lawrence JM, Divers J, Isom S, et al. Trends in Prevalence of Type 1 and Type 2 Diabetes in Children and Adolescents in the US, 2001–2017. JAMA. 2021;326(8):717–727. [DOI] [PMC free article] [PubMed] [Google Scholar]
- 3.Barrett T, Jalaludin MY, Turan S, et al. Rapid progression of type 2 diabetes and related complications in children and young people—A literature review. Pediatric Diabetes. 2020;21(2):158–172. [DOI] [PMC free article] [PubMed] [Google Scholar]
- 4.Nadeau KJ, Anderson BJ, Berg EG, et al. Youth-Onset Type 2 Diabetes Consensus Report: Current Status, Challenges, and Priorities. Diabetes Care. 2016;39(9):1635–1642. [DOI] [PMC free article] [PubMed] [Google Scholar]
- 5.Han H-S, Kang G, Kim JS, et al. Regulation of glucose metabolism from a liver-centric perspective. Exp Mol Med. 2016;48:e218. [DOI] [PMC free article] [PubMed] [Google Scholar]
- 6.Gastaldelli A, Cusi K, Pettiti M, et al. Relationship between hepatic/visceral fat and hepatic insulin resistance in nondiabetic and type 2 diabetic subjects. Gastroenterology. 2007;133(2):496–506. [DOI] [PubMed] [Google Scholar]
- 7.Younossi ZM, Koenig AB, Abdelatif D, et al. Global epidemiology of nonalcoholic fatty liver disease-Meta-analytic assessment of prevalence, incidence, and outcomes. Hepatology. 2016;64(1):73–84. [DOI] [PubMed] [Google Scholar]
- 8.Dai W, Ye L, Liu A, et al. Prevalence of nonalcoholic fatty liver disease in patients with type 2 diabetes mellitus: A meta-analysis. Medicine (Baltimore). 2017;96(39):e8179. [DOI] [PMC free article] [PubMed] [Google Scholar]
- 9.Mantovani A, Byrne CD, Bonora E, Targher G. Nonalcoholic Fatty Liver Disease and Risk of Incident Type 2 Diabetes: A Meta-analysis. Diabetes Care. 2018;41(2):372–382. [DOI] [PubMed] [Google Scholar]
- 10.Schwimmer JB, Deutsch R, Kahen T, et al. Prevalence of fatty liver in children and adolescents. Pediatrics. 2006;118(4):1388–1393. [DOI] [PubMed] [Google Scholar]
- 11.Lindbäck SM, Gabbert C, Johnson BL, et al. Pediatric Nonalcoholic Fatty Liver Disease: A Comprehensive Review. Advances in Pediatrics. 2010;57(1):85–140. [DOI] [PubMed] [Google Scholar]
- 12.Schwimmer JB, Deutsch R, Rauch JB, et al. Obesity, insulin resistance, and other clinicopathological correlates of pediatric nonalcoholic fatty liver disease. J Pediatr. 2003;143(4):500–505. [DOI] [PubMed] [Google Scholar]
- 13.Newton KP, Hou J, Crimmins NA, et al. Prevalence of Prediabetes and Type 2 Diabetes in Children With Nonalcoholic Fatty Liver Disease. JAMA Pediatr. 2016;170(10):e161971. [DOI] [PMC free article] [PubMed] [Google Scholar]
- 14.Targher G, Marchesini G, Byrne CD. Risk of type 2 diabetes in patients with non-alcoholic fatty liver disease: Causal association or epiphenomenon? Diabetes & Metabolism. 2016;42(3):142–156. [DOI] [PubMed] [Google Scholar]
- 15.Kleiner DE, Brunt EM, Van Natta M, et al. Design and validation of a histological scoring system for nonalcoholic fatty liver disease. Hepatology. 2005;41(6):1313–1321. [DOI] [PubMed] [Google Scholar]
- 16.Association AD. Standards of Medical Care in Diabetes—2014. Diabetes Care. 2014;37(Supplement 1):S14–S80. [DOI] [PubMed] [Google Scholar]
- 17.Candler TP, Mahmoud O, Lynn RM, et al. Continuing rise of Type 2 diabetes incidence in children and young people in the UK. Diabetic Medicine. 2018;35(6):737–744. [DOI] [PMC free article] [PubMed] [Google Scholar]
- 18.Wu H, Zhong J, Yu M, et al. Incidence and time trends of type 2 diabetes mellitus in youth aged 5–19 years: a population-based registry in Zhejiang, China, 2007 to 2013. BMC Pediatrics. 2017;17(1):85. [DOI] [PMC free article] [PubMed] [Google Scholar]
- 19.Divers J Trends in Incidence of Type 1 and Type 2 Diabetes Among Youths — Selected Counties and Indian Reservations, United States, 2002–2015. MMWR Morb Mortal Wkly Rep. 2020;69. [DOI] [PMC free article] [PubMed] [Google Scholar]
- 20.Mayer-Davis EJ, Lawrence JM, Dabelea D, et al. Incidence Trends of Type 1 and Type 2 Diabetes among Youths, 2002–2012. New England Journal of Medicine. 2017;376(15):1419–1429. [DOI] [PMC free article] [PubMed] [Google Scholar]
- 21.Abbasi A, Juszczyk D, van Jaarsveld CHM, Gulliford MC. Body Mass Index and Incident Type 1 and Type 2 Diabetes in Children and Young Adults: A Retrospective Cohort Study. Journal of the Endocrine Society. 2017;1(5):524–537. [DOI] [PMC free article] [PubMed] [Google Scholar]
- 22.Cree-Green M, Triolo TM, Nadeau KJ. Etiology of Insulin Resistance in Youth with Type 2 Diabetes. Curr Diab Rep. 2013;13(1):81–88. [DOI] [PMC free article] [PubMed] [Google Scholar]
- 23.Cali AMG, De Oliveira AM, Kim H, et al. Glucose dysregulation and hepatic steatosis in obese adolescents: is there a link? Hepatology. 2009;49(6):1896–1903. [DOI] [PMC free article] [PubMed] [Google Scholar]
- 24.D’Adamo E, Cali AMG, Weiss R, et al. Central role of fatty liver in the pathogenesis of insulin resistance in obese adolescents. Diabetes Care. 2010;33(8):1817–1822. [DOI] [PMC free article] [PubMed] [Google Scholar]
- 25.Deivanayagam S, Mohammed BS, Vitola BE, et al. Nonalcoholic fatty liver disease is associated with hepatic and skeletal muscle insulin resistance in overweight adolescents. Am J Clin Nutr. 2008;88(2):257–262. [DOI] [PMC free article] [PubMed] [Google Scholar]
- 26.Svegliati-Baroni G, Bugianesi E, Bouserhal T, et al. Post-load insulin resistance is an independent predictor of hepatic fibrosis in virus C chronic hepatitis and in non-alcoholic fatty liver disease. Gut. 2007;56(9):1296–1301. [DOI] [PMC free article] [PubMed] [Google Scholar]
- 27.Bugianesi E, Manzini P, D’Antico S, et al. Relative contribution of iron burden, HFE mutations, and insulin resistance to fibrosis in nonalcoholic fatty liver. Hepatology. 2004;39(1):179–187. [DOI] [PubMed] [Google Scholar]
- 28.Rosso C, Mezzabotta L, Gaggini M, et al. Peripheral insulin resistance predicts liver damage in nondiabetic subjects with nonalcoholic fatty liver disease. Hepatology. 2016;63(1):107–116. [DOI] [PubMed] [Google Scholar]
- 29.Chatterjee S, Khunti K, Davies MJ. Type 2 diabetes. Lancet. 2017;389(10085):2239–2251. [DOI] [PubMed] [Google Scholar]
- 30.Younossi ZM, Gramlich T, Matteoni CA, et al. Nonalcoholic fatty liver disease in patients with type 2 diabetes. Clin Gastroenterol Hepatol. 2004;2(3):262–265. [DOI] [PubMed] [Google Scholar]
- 31.Sahota AK, Shapiro WL, Newton KP, et al. Incidence of Nonalcoholic Fatty Liver Disease in Children: 2009–2018. Pediatrics 2020;146:e20200771. [DOI] [PMC free article] [PubMed] [Google Scholar]
- 32.Association AD. 2. Classification and Diagnosis of Diabetes: Standards of Medical Care in Diabetes—2020. Diabetes Care. 2020;43(Supplement 1):S14–S31. [DOI] [PubMed] [Google Scholar]
- 33.Nowicka P, Santoro N, Liu H, et al. Utility of Hemoglobin A1c for Diagnosing Prediabetes and Diabetes in Obese Children and Adolescents. Diabetes Care. 2011;34(6):1306–1311. [DOI] [PMC free article] [PubMed] [Google Scholar]
- 34.Weiss R, Santoro N, Giannini C, et al. Prediabetes in youth - mechanisms and biomarkers. Lancet Child Adolesc Health. 2017;1(3):240–248. [DOI] [PMC free article] [PubMed] [Google Scholar]