

Abstract
People can seamlessly integrate a vast array of information from what they see and hear in the noisy and uncertain world. However, the neural underpinnings of audiovisual integration continue to be a topic of debate. Using strict inclusion criteria, we performed an activation likelihood estimation meta-analysis on 121 neuroimaging experiments with a total of 2,092 participants. We found that audiovisual integration is linked with the coexistence of multiple integration sites, including early cortical, subcortical, and higher association areas. Although activity was consistently found within the superior temporal cortex, different portions of this cortical region were identified depending on the analytical contrast used, complexity of the stimuli, and modality within which attention was directed. The context-dependent neural activity related to audiovisual integration suggests a flexible rather than fixed neural pathway for audiovisual integration. Together, our findings highlight a flexible multiple pathways model for audiovisual integration, with superior temporal cortex as the central node in these neural assemblies.
Keywords: audiovisual integration, fMRI, PET, meta-analysis
Introduction
Much of the information we encounter in the environment is noisy and ambiguous. Integrating information from multiple sensory systems allows us to make better inferences about what we are experiencing (Ernst and Bülthoff 2004; Noppeney 2021). For instance, in a busy restaurant, it may be difficult to hear what your friend is saying, but integrating the speech sounds with mouth movements can greatly increase your understanding of the conversation. Although many models with good fit for behavioral indices of audiovisual integration have been developed to explain how information from multiple senses is combined (Miller 1982; Colonius 1990; Ernst and Banks 2002; Deneve and Pouget 2004; Shams et al. 2005; Körding et al. 2007; Shams and Beierholm 2010; Fetsch et al. 2012; Magnotti et al. 2013; Parise and Ernst 2016; Colonius and Diederich 2020), it remains unclear how the efficient combination of audiovisual information is accomplished in the brain. Here, we used a meta-analytic approach to identify the common patterns of brain activity across a wide variety of audiovisual studies.
Different theories on the neural basis of audiovisual integration have been put forth (see Driver and Noesselt 2008; Stein and Stanford 2008 for reviews). In line with a traditional hierarchical route, the “Higher Association Areas” model states that unisensory signals are processed independently in their respective sensory cortices and integration occurs in later association areas such as superior temporal cortex (Fig. 1). However, accumulating evidence indicates that integration might occur at sensory-perceptual (sensory areas model) and subcortical levels (subcortical areas model) prior to any processing in association cortices (Fig. 1). Though these models have been around for many years, it is still unclear which model accurately reflects the neural substrates of audiovisual integration. This lack of consensus across studies could be due to a number of factors, including analytical contrasts, stimulus complexity, and attention. There is a variability in how the audiovisual neural activity is defined and analyzed (Calvert and Thesen 2004; Stein et al. 2010) as well as a wide variety of stimulus types and attentional manipulations used which could influence the patterns of observed brain activities. How much does the neural activity of audiovisual integration overlap across these different factors? If the neural activity is essentially the same irrespective of these factors, it would suggest that audiovisual integration is implemented by a fixed network of brain regions. If, however, audiovisual integration is implemented by different brain regions depending on the experimental and analytical contexts, it would suggest that the neural pathways involved are more flexible and there may not be a single neural network responsible for integration.
Fig. 1.

Possible neural pathways for audiovisual integration. Sensory areas model posits that direct connections between visual cortex (VC) and auditory cortex (AC) are underlying the audiovisual integration process. Subcortical areas model posits that audiovisual integration takes place at subcortical areas such as thalamus or superior colliculus (SC). High association areas model posits that audiovisual integration takes place at higher association areas such as superior temporal cortex (STC) and prefrontal regions (PFC). Multiple pathways model posits coexistence of all the pathways in which sensory areas, subcortical areas, and high association areas are all related to this process.
There are 3 main approaches widely used in examining the neural activity of audiovisual integration. The classic approach to examining audiovisual integration is to compare neural responses to an audiovisual stimulus with the sum of the unisensory responses (i.e. AV > A + V), which is herein referred to as the “Interaction” approach. This approach assumes that audiovisual integration results in an interaction between modalities which is more than the sum of the unisensory parts. Such a pattern has been clearly identified at the cellular level (Meredith and Stein 1983, 1986a, 1986b; Meredith et al. 1987; Wallace et al. 1996; Stein and Stanford 2008) and this interaction approach has subsequently been used to examine the audiovisual integration noninvasively in humans using a number of techniques and paradigms. For example, Calvert et al. (2000) presented subjects with audiovisual speech signals and each modality in isolation. Using this interaction contrast, they found that left superior temporal sulcus exhibited significant supraadditive responses, where the response to the audiovisual speech was greater than the summed unimodal responses. However, a number of limitations to this comparison have been identified, such as being overly conservative when used in neuroimaging studies due to “hemodynamic refractoriness” (Friston et al. 1998; Mechelli et al. 2001), inappropriately double-subtracting activity that is common to both auditory and visual tasks when the unimodal stimuli are summed together (Teder-Sälejärvi et al. 2002), and only producing a reliable interaction effect for weak or subthreshold stimuli (Meredith and Stein 1983; Holmes 2007).
In an attempt to overcome some of the issues with the interaction approach, many studies have used alternative analytical contrasts to identify the brain activity associated with the audiovisual integration. One common approach, herein referred to as the “Conjunction” approach, compares the audiovisual response to each unimodal response and then identifies the overlap between the 2 (i.e. (AV > V)  (AV > A)). This approach is based on similar electrophysiological findings as the “Interaction” approach and is presumably less conservative. For example, 1 study measured functional magnetic resonance imaging (fMRI) signals during presentations of pictures of animals and other objects, environmental sounds, and audiovisual clips. They found overlapping activation in a series of brain areas, such as thalamus, inferior occipital gyrus, and lingual gyrus, that have stronger responses to audiovisual stimuli than either unimodal condition (Belardinelli et al. 2004). One potential limitation of the Conjunction approach is that it can reflect common brain activations across unimodal visual and auditory stimuli but not audiovisual integration per se in which (AV > V)
  (AV > A) would be equal to V
  A (Calvert and Thesen 2004; Ethofer et al. 2006).
A third common approach focuses on comparing the neural responses for congruent and incongruent audiovisual stimuli, herein referred to as the “Congruency” approach (Congruent > Incongruent). This comparison assumes that the congruency of the stimuli can lead to different magnitudes of integration (Wallace et al. 1996; Kadunce et al. 1997). For example, 1 study instructed participants to attend to lip movements that were either congruent or incongruent with spoken words. They found an increased activation in the superior temporal cortex and other brain areas for congruent compared to incongruent conditions (Fairhall and Macaluso 2009). One limitation of this approach is that it can identify brain activations that are related to audiovisual interactions (i.e. modulation effects from one modality on the other) but not necessarily integration.
In addition to the variability in how the audiovisual brain activities are analyzed, stimuli in studies of audiovisual integration vary in terms of complexity from very simple stimuli (e.g. flashes and tones) to complex stimuli (e.g. object images and sounds or speech stimuli). Compared to simple stimuli, complex stimuli may involve the integration of both low-level spatial and temporal (Stein and Stanford 2008) and higher-level semantic information (Doehrmann and Naumer 2008). Though many studies suggest a common cognitive process for the audiovisual integration irrespective of different stimulus types (Stekelenburg and Vroomen 2007; Driver and Noesselt 2008; Hocking and Price 2008; Stevenson and James 2009), there is evidence that suggests the opposite (Tuomainen et al. 2005). It is not yet clear whether the neural mechanisms of audiovisual integration differ depending on the type of stimuli.
Lastly, brain regions engaged by audiovisual integration could also depend on attention. Previous literature has demonstrated the role of top-down attention in modulating audiovisual integration (Talsma et al. 2010; Talsma 2015; Macaluso et al. 2016; Rohe and Noppeney 2018; Noppeney 2021). For example, Talsma et al. (2006) observed a supraadditive effect on neural activity (as measured with event-related potentials) when the stimuli were attended, but this effect reversed when the stimuli were unattended. Across neuroimaging studies of audiovisual integration, a wide variety of tasks have been used which vary in how attention is directed to the stimuli. Some tasks require attention to only 1 of the sensory modalities, while the other is ignored (e.g. Bonath et al. 2007; Green et al. 2009; Noppeney et al. 2010); some require attention to both modalities (e.g. Bushara et al. 2001; Hocking and Price 2008; Benoit et al. 2010); and still others use passive tasks in which none of the stimuli are task relevant (e.g. Holle et al. 2010; Butler et al. 2011; Barrós-Loscertales et al. 2013). With the accumulating evidence that audiovisual integration can be heavily dependent on the attended modality (Talsma 2015), it seems likely that this variability in attention demands across tasks could modify what brain activity is observed.
The present study used a meta-analysis approach with the activation likelihood estimation (ALE) method (Eickhoff et al. 2009; Eickhoff et al. 2012; Turkeltaub et al. 2012) to identify the brain areas associated with audiovisual integration. First, by aggregating neuroimaging studies of audiovisual integration, this meta-analysis study allowed us to identify the brain regions commonly engaged by audiovisual integration while overcoming many of the limitations of individual studies, such as small samples, lack of confirmation for isolated findings, and generalization of context-specific findings. Initially, we aimed to examine whether there is a general multisensory integration network by including the visual, auditory, and tactile modalities (Driver and Noesselt 2008). However, this question could not be addressed due to the limited number of tactile-related integration studies, as detailed in the Materials and methods section. Second, we examined whether there are distinct patterns of activation associated with varying analytical contrasts, stimulus complexities, and attentional demands. By identifying shared and unique voxels across conditions, these analyses enabled us to disentangle areas that have a central role in integration, independent of context, from brain areas that show context-dependent integration activity.
Materials and methods
Study identification
A literature search was conducted across PubMed and Web of Science databases. Search terms included combinations of the 3 descriptors: 1 “mandatory research question descriptor” (“integration”), 1 “research question descriptor” (e.g. “multisensory,” “audiovisual,” and “visuotactile”), and 1 “methodological descriptor” (e.g. “fMRI,” “MRI,” “PET,” and “BOLD”) for studies published until September 2020 (see Supplemental info for specific search terms used in study identification). In PubMed, the search was performed within the title and abstract with preliminary filters, including (i) papers written in English, (ii) papers published in journal articles, and (iii) human adult subjects. In Web of Science, the search was also performed within title and abstract with preliminary filters, including (i) papers written in English, (ii) papers published in journal articles, and (iii) not a study using animal subjects. The overall search revealed a total of 1,118 studies. After removing duplicated records, 741 articles remained. A step-by-step flowchart of the meta-analysis procedure is shown in Supplementary Fig. S1. The meta-analysis was performed with PRISMA standards (Liberati et al. 2009).
Study screening
We then assessed the text of the 741 articles for eligibility with the following criteria: (i) It reported original data, (ii) It is a neuroimaging study using PET or fMRI, (iii) It included healthy subjects, (iv) It included adult subjects ( 18 years old), (v) It included whole brain statistics, (vi) It included coordinates reported in Talairach or Montreal Neurological Institute (MNI) space, and (vii) It included a relevant contrast. To be considered a relevant contrast, the contrast had to involve a multisensory condition and had to be interpretable as multisensory integration and not unimodal sensory differences. For example, the conjunction of visual only and auditory only conditions was excluded, because without an audiovisual comparison, it cannot speak directly to multisensory integration, and a contrast of audiovisual > visual or audiovisual > auditory was excluded when used alone without conjunction because the results could be interpreted as the differences in auditory or visual sensory processing.
After the screening, a total of 98 studies were included. An additional 39 articles were included by tracing the articles cited by the included studies and reading relevant review articles. Thus, the final dataset included 137 papers that reported 139 experiments. The articles were divided into 8 groups that were assessed by 4 independent researchers (CG, JK, SO, and XY). Another independent check of the screening results was also performed in which the assignment was then switched between the 4 researchers. For articles where there was an initial disagreement, a consensus was reached through discussion among all authors.
Data extraction
For each study, we extracted the following data: (i) study ID (first author, publication year, and journal), (ii) imaging modality (magnetic resonance imaging [MRI] or PET), (iii) MRI strength (e.g. 3T), (iv) sample size, (v) sensory modality (visual–auditory and visual-tactile), (vi) stimuli, (vii) task, (viii) contrast, (ix) normalization space (MNI or Talairach), (x) peak coordinates (x/y/z), and (xi) analysis package (Supplemental info, Supplementary Datasets S1 and S2). The data files can be downloaded at https://osf.io/txrfc/.
Statistical methods
Activation likelihood estimation
Coordinate-based meta-analyses were conducted with the revised ALE algorithm, implemented in GingerALE 3.0.2 (BrainMap, http://brainmap.org/ale/). Coordinates reported in Talairach space were transformed into MNI coordinates using a linear transformation to perform analyses in a common stereotactic space (Lancaster et al. 2007). In the ALE analyses, each reported location was taken as the center of a 3D Gaussian probability density distribution. The uncertainty associated with localization of each location was modeled by the full-width at half-maximum of the Gaussian function determined by the number of participants in each study. After that, a modeled activation (MA) map was created for each voxel reflecting the probability of an activation at that location. A 3D ALE map was created by taking the union across all of the MA maps. The voxel-specific ALE scores reflect the consistency of the activation locations. An empirically derived null distribution was achieved by sampling a voxel at random from each of the MA maps and by taking the union of these values in the same manner as the true analysis. A voxel-wise P-map was then created by comparing the ALE scores to the null distribution, which was then submitted to a cluster-level family-wise error correction with a cluster-level threshold of P < 0.05 and a cluster-forming threshold at voxel-level P < 0.001. The significant cluster size was determined by comparison to a null distribution of cluster-sizes derived by simulating 1,000 datasets of randomly distributed foci with a threshold of P < 0.05. Anatomical areas were labeled using the SPM Anatomy Toolbox. Results were visualized using MRIcroGL (https://www.nitrc.org/projects/mricrogl/) for slices and FreeSurfer (https://surfer.nmr.mgh.harvard.edu/) for surface rendering. A nonlinear mapping tool was used to convert volumetric to surface coordinates for display purposes (Wu et al. 2018).
Experiment categorization and analyses
Based on the purpose of the present study, we classified the included experiments in the following way: (i) sensory modality: visual–auditory or visual-tactile; (ii) contrast, for the 2 modalities (unimodal1 and unimodal2): (multisensory congruent > unimodal1)  (multisensory congruent > unimodal2); (multisensory congruent < unimodal1)
  (multisensory congruent < unimodal2); (multisensory incongruent > unimodal1)
  (multisensory incongruent > unimodal2); multisensory congruent > sum of unimodal; multisensory congruent < sum of unimodal; multisensory congruent > max (unimodal1, unimodal2); multisensory incongruent < max (unimodal1, unimodal2); multisensory congruent > mean (unimodal1, unimodal2); integration > no integration; no integration > integration; congruent > incongruent; incongruent > congruent; illusion > no illusion; and no illusion > illusion. Note that “integration > no integration” refers to a comparison of trials in which the audiovisual signals were likely integrated with trials in which audiovisual signals were likely not integrated, such as when unimodal signals were degraded compared with when unimodal signals were intact and reliable. “Illusion > no illusion” refers to a comparison of the condition in which the illusion occurred to the condition in which the illusion did not occur, which is assumed to reflect differences in integration. (iii) Stimuli: simple, complex nonspeech and complex speech; here, the stimuli were coded as simple, such as flashes and pure sounds; complex nonspeech, such as pictures of objects, sounds of objects; and complex speech, such as speech videos and speech sounds. (iv) Attention: audiovisual, visual, auditory, auditory or visual or audiovisual, auditory and visual, visuotactile, tactile, visual or tactile or visuotactile, and passive. Note that “auditory or visual or audiovisual” means that the contrast involves both multisensory and unimodal conditions in which participants were asked to pay attention to both modalities for multisensory condition, and they were asked to pay attention to either of the single modality for unimodal conditions. (v) Correspondence: spatial, temporal, semantic and none. spatial, temporal, and semantic categories indicate that the contrast involved manipulation of the correspondence between the auditory and visual stimuli along that dimension. None refers to that the contrast did not involve any manipulation of correspondence (e.g. only fully congruent and unimodal conditions were compared). (vi) Task: identification, discrimination, detection, localization, and passive. Identification refers to tasks that involved identifying or categorizing either an item itself or intrinsic features of an item (e.g. color and semantic category). Discrimination refers to tasks that involved discriminating certain extrinsic features of an item or items (e.g. motion direction of an item and temporal congruency across 2 items).
Our study screening procedures identified 139 neuroimaging experiments involving healthy adult participants, which directly assessed multisensory integration in their analyses and provided whole-brain results. Of these studies, 121 examined the audiovisual integration, while only 18 examined the visual-tactile integration, and no studies meeting our criteria examined tactile-auditory integration. Because of this bias in the literature, we were unable to address our original question of whether or not there is a general multisensory integration network. Furthermore, because of the small number of visual-tactile studies, further categorizing those studies based on stimulus or task features would increase the risk that the results would be driven by a single experiment (Eickhoff et al. 2016). Thus, all subsequent analyses were based on the 121 audiovisual studies. These analyses are summarized in Table 1. Visual-tactile studies are included in Supplementary materials for completeness (Supplemental info, Supplementary Fig. S2 and Supplementary Table S1).
Table 1.
Meta-analyses performed in the present study.
| Analysis No. | Description | Number of experiments |
|---|---|---|
| 1 | Visual–auditory | 121 |
| 2.1 Contrast | (AV > V)  (AV > A) (AV > A) |
28 |
| 2.2 Contrast | AV > A + V | 23 |
| 2.3 Contrast | Congruent > Incongruent | 44 |
| 2.4 Contrast | Incongruent > Congruent | 39 |
| 3.1 Stimuli | Simple | 24 |
| 3.2 Stimuli | Complex nonspeech | 23 |
| 3.3 Stimuli | Complex speech | 75 |
| 4.1 Attention | Audiovisual | 59 |
| 4.2 Attention | Visual | 14 |
| 4.3 Attention | Auditory | 19 |
| 4.4 Attention | Passive | 27 |
In addition to the analyses described in the Table 1, we also performed analyses on correspondence: (1) spatial, 7 experiments; (2) temporal, 23 experiments; (3) semantic, 53 experiments; and (4) none, 39 experiments. Given the limitation of sample size and the overlapping information with the stimuli dimension, these results are reported in the Supplemental information (Supplemental info, Supplementary Tables S11 and S12). We also conducted analyses on task: (i) identification, 59 experiments; (ii) discrimination, 21 experiments; (iii) detection, 13 experiments; (iv) localization, 3 experiments; and (5) passive, 29 experiments. We combined the identification and discrimination for analyses because of the similarity between the 2 tasks. Similarly, due to the sample size limitation of several tasks, these results are also reported in the Supplemental information (Supplemental info, Supplementary Tables S13–S15).
To determine the overlap in neural activity across conditions, we performed conjunction analyses using the conservative minimum statistic in which the intersection of the thresholded ALE maps of separate meta-analyses were computed (Nichols et al. 2005). That is, any region determined to be significant by the conjunction analysis constitutes a location in the brain which survived the inference corrected for multiple comparison with a cluster-level threshold of P < 0.05 and a cluster-forming threshold at voxel-level P < 0.001. The conjunction analyses were performed as described in previous meta-analyses (Bzdok et al. 2012; Müller et al. 2018).
To statistically test how each factor influenced the identified brain regions, we performed contrast analyses to identify the differences. First, voxel-wise differences of z-scores between 2 nonthresholded ALE maps were computed. Second, all experiments were pooled together and randomly divided into 2 groups of the same size (Eickhoff et al. 2011). Voxel-wise ALE scores for the 2 randomly generated groups were subtracted from each other and recorded. This shuffling procedure was repeated for 10,000 times and produced an empirical null distribution of ALE score differences. Finally, the “true” ALE difference maps were then tested against this null distribution. We then thresholded the ALE difference maps at a conservative threshold of P > 0.99 rather than P > 0.95, given that a statistical method for multiple comparison corrections for ALE difference maps has not yet been established (Eickhoff et al. 2011). Nonetheless, the randomization procedure for the contrast analyses is highly conservative because it estimates the probability for a true difference between 2 datasets (Bzdok et al. 2012).
For both the conjunction and the contrast analyses, an additional extent threshold of 100 mm3 was used to exclude smaller regions of possibly incidental overlap or difference between the thresholded ALE maps of individual analyses (Hardwick et al. 2018; Kogler et al. 2020; Morandini et al. 2020).
Results
Audiovisual integration is linked with multiple integration sites, including early sensory, subcortical, and higher association areas
The meta-analysis of audiovisual integration (n = 121) showed convergence in bilateral superior temporal gyrus, left middle temporal gyrus and fusiform gyrus, left middle temporal gyrus, bilateral middle occipital gyrus, bilateral inferior occipital gyrus, right inferior frontal gyrus, bilateral middle frontal gyrus, left precentral gyrus, bilateral insula, right thalamus, left medial frontal gyrus, left superior frontal gyrus, and right lingual gyrus (Supplemental info, Supplementary Fig. S3 and Supplementary Table S1). These findings suggest that audiovisual integration is associated with multiple integration sites, including early cortical areas, subcortical areas, and higher association areas. The ALE maps can be downloaded at https://osf.io/txrfc/.
Brain regions engaged by audiovisual integration depend on analytical contrast, stimulus complexity, and attention
We further analyzed these audiovisual studies by categorizing the experiments based on key factors that we hypothesized could influence how audiovisual integration is observed in the brain: the contrast used for comparison, the complexity of the stimuli, and how participants’ attention was directed during the task.
Brain regions engaged by audiovisual integration depend on analytical contrast
To explore how the contrasts used to define audiovisual integration influence the brain regions identified, we separated studies into 3 broad categories: (i) “conjunction”: contrasts that focus on the overlap between the audiovisual response and each unimodal response (i.e. (AV > V)  (AV > A); n = 28); (2) “interaction”: contrasts that focus on supraadditive responses, where the audiovisual response is greater than the sum of the unimodal responses (i.e. AV > A + V; n = 23); and (iii) “congruency”: contrasts that focus on comparing congruent and incongruent audiovisual stimuli. We further separated these contrasts by whether they were focused on the congruent stimuli (congruent > incongruent, n = 44) or the incongruent stimuli (incongruent > congruent, n = 39), as these would highlight different cognitive and perceptual processes.
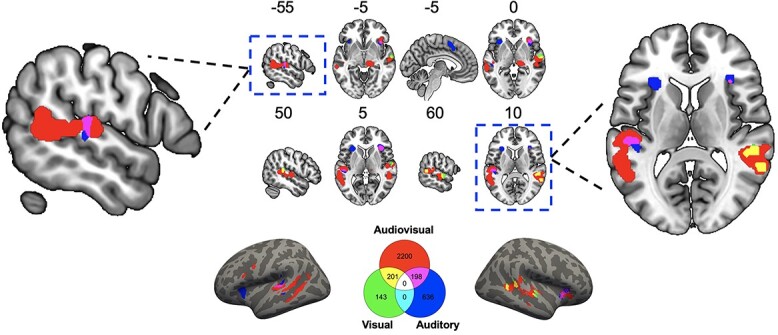
The meta-analysis of the conjunction contrast showed activation in the left and right superior temporal gyrus, left and right thalamus, and right parahippocampal gyrus. The meta-analysis of the interaction contrast showed activation in the left and right superior temporal gyrus, left middle temporal gyrus, and right postcentral gyrus. The meta-analysis of the congruent > incongruent contrast showed activation in the left and right superior temporal gyrus, left inferior temporal gyrus, left inferior occipital gyrus, and left middle occipital gyrus. The meta-analysis of the incongruent > congruent contrast showed activation in the right superior temporal gyrus, left middle frontal gyrus, left superior frontal gyrus, right inferior frontal gyrus, and left middle temporal gyrus (Fig. 2; Supplemental info, Supplementary Table S2). These findings showed that brain regions engaged by audiovisual integration varied to a great extent depending on different analytical contrasts.
Fig. 2.

Significant brain regions from the ALE meta-analyses and number of shared and unique voxels shown by a Venn diagram for effects of analytical contrast. These findings showed that brain regions linked with audiovisual integration varied to a great extent depending on different analytical contrasts. Shared voxels across contrasts were mainly located at superior temporal cortex (see also Supplementary Table S3), suggesting its central role in audiovisual integration. The “Conjunction” contrast refers to (AV > V)  (AV > A). The “Interaction” contrast refers to AV > A + V. The “Congruency” contrast refers to “Congruent > Incongruent.” The legend indicates the number of significant voxels identified for each contrast and their conjunctions, where each voxel is 8 mm3. Surface rendering was created using converted surface coordinates from MNI coordinates for visualization purpose.
The common activation between the conjunction and interaction contrasts included bilateral superior temporal cortices. The common activation between the interaction and congruency (congruent > incongruent) contrasts included bilateral superior temporal cortices (Fig. 2; Supplemental info, Supplementary Table S3). These analyses showed that the pairwise overlapped brain voxels across analytical contrasts were consistently located within the superior temporal cortex, although no voxels were commonly activated by all 3 contrasts.
The conjunction > interaction comparison revealed differences in the right superior temporal gyrus, right thalamus, and substantia nigra. The conjunction > congruency comparison revealed differences in the right middle temporal gyrus, right insula, right substantia nigra, left superior temporal gyrus, and bilateral thalamus. The interaction > congruency comparison revealed differences in the left middle temporal gyrus (Fig. 2; Supplemental info, Supplementary Table S4). Taken together, these results showed that the brain regions engaged by audiovisual integration depend on an analytical contrast.
Brain regions engaged by audiovisual integration depend on stimulus complexity
We then compared how stimulus complexity influences audiovisual integration. As some studies have suggested, there may be differences in how speech is processed compared to other complex nonspeech stimuli, and we categorized studies into those using simple stimuli (e.g. flashes and beeps; n = 24), complex nonspeech (e.g. pictures and sounds of objects; n = 23), and complex speech (e.g. spoken phonemes or words along with visible mouth movements; n = 75).
The meta-analysis of simple stimuli showed activation in the bilateral superior temporal gyrus, right transverse temporal gyrus, and right middle and inferior frontal gyrus. The meta-analysis of complex nonspeech stimuli showed activation in the right superior temporal gyrus. The meta-analysis of complex speech stimuli showed activation in the bilateral superior temporal gyrus, left middle temporal gyrus, left superior, medial, middle and inferior frontal gyrus, right middle and inferior occipital gyrus, right lingual gyrus, and right thalamus (Fig. 3; Supplemental info, Supplementary Table S5). These findings showed that brain regions engaged by audiovisual integration varied to a great extent depending on different stimulus complexity.
Fig. 3.

Significant brain regions from the ALE meta-analyses and number of shared and unique voxels shown by a Venn diagram for effects of stimulus complexity. These findings showed that brain regions linked with audiovisual integration varied to a great extent depending on different stimulus complexity. Shared voxels across contrasts were mainly located at superior temporal cortex (see also Supplementary Table S6), suggesting its central role in audiovisual integration. The legend indicates the number of significant voxels identified for each contrast and their conjunctions, where each voxel is 8 mm3. Surface rendering was created using converted surface coordinates from MNI coordinates for visualization purpose.
The common activation between simple and complex speech included bilateral superior temporal cortices. The common activation between complex nonspeech and complex speech included right superior temporal cortex (Fig. 3; Supplemental info, Supplementary Table S6). These analyses showed that the pairwise overlapped brain voxels across different stimulus complexity were consistently located within the superior temporal cortex, although, as with the comparison of analytical contrasts, no voxels were commonly activated by all 3 stimulus types.
The simple > complex speech comparison revealed differences in the right superior temporal gyrus and right inferior frontal gyrus. The complex speech > simple comparison revealed differences in the bilateral middle temporal gyrus and left superior temporal gyrus. The complex nonspeech > complex speech comparison revealed differences in the right superior temporal gyrus. The complex speech > complex nonspeech comparison revealed differences in the right middle temporal gyrus and bilateral superior temporal gyrus (Fig. 3; Supplemental info, Supplementary Table S7). Taken together, these results showed that brain regions engaged by audiovisual integration depend on the stimulus complexity.
Brain regions engaged by audiovisual integration depend on attention
Lastly, we compared how the modality that participants were instructed to attend to influences the integration activations that are observed. To do this, we categorized studies into those that had participants attend to the audiovisual stimuli (n = 59; this includes studies that have participants attend to both modalities when present but may have them attend to only 1 modality when it is the only 1 presented), those that had participants only attend to the visual information (n = 14), just the auditory information (n = 19), and those in which participants did not actively attend to any of the stimuli (i.e. passive tasks; n = 27).
The meta-analysis of audiovisual attention showed activation in right insula, right middle temporal gyrus, and right superior temporal gyrus. The meta-analysis of visual attention showed activation in right superior temporal gyrus. The meta-analysis of auditory attention showed activation in left superior temporal gyrus, left medial frontal gyrus, left and right insula. The meta-analysis of passive attention showed activation in the bilateral superior temporal gyrus, bilateral middle temporal gyrus, left middle frontal gyrus, right middle occipital gyrus, and right lingual gyrus (Fig. 4; Supplemental info, Supplementary Table S8). These findings showed that brain regions engaged by audiovisual integration varied to a great extent depending on different attention conditions.
Fig. 4.
Significant brain regions from the ALE meta-analyses and number of shared and unique voxels shown by a Venn diagram for effects of attention. These findings showed that brain regions linked with audiovisual integration varied to a great extent depending on different attention conditions. Shared voxels across contrasts were mainly located at superior temporal cortex (see also Supplementary Table S9), suggesting its central role in audiovisual integration. The legend indicates the number of significant voxels identified for each contrast and their conjunctions, where each voxel is 8 mm3. Surface rendering was created using converted surface coordinates from MNI coordinates for visualization purpose.
The common activation between audiovisual attention and visual attention included the right superior temporal cortex. The common activation between audiovisual attention and auditory attention included the right insula and left superior temporal cortex (Fig. 4; Supplemental info, Supplementary Table S9). As with the previous analyses, the pairwise overlapped brain voxels across different attention conditions were consistently located within superior temporal cortex, but there were no voxels commonly activated across the attention conditions.
The audiovisual > auditory comparison revealed differences in the right superior temporal gyrus and right middle temporal gyrus. The auditory > audiovisual comparison revealed differences in the left medial frontal gyrus and left superior frontal gyrus. The auditory > visual comparison revealed differences in the left claustrum and left insula (Fig. 4; Supplemental info, Supplementary Table S10). Taken together, these results showed that brain regions engaged by audiovisual integration depend on attention.
Supplementary analyses were also performed to examine how correspondence (spatial, temporal, or semantic) and task (identification, discrimination, detection, and passive) influence the brain regions engaged by audiovisual integration. In line with previous findings, these supplementary analyses suggest that common brain voxels across different conditions for correspondence and task were consistently located within the superior temporal cortex and that neural correlates of audiovisual integration depend on correspondence and task (Supplemental info, Supplementary Information Text, Supplementary Table S11–S15).
Discussion
What are the brain regions associated with audiovisual integration? This question has been examined for many years without reaching a consensus. Here, we summarized 121 neuroimaging experiments comprised of 2,092 participants; all of these examined the neural basis of audiovisual integration with strict inclusion criteria. Moreover, we examined how the experimental context and analytical choices influence the brain networks identified during audiovisual integration, leading to 3 main findings. First, audiovisual integration is associated with multiple integration sites, including early cortical areas, subcortical areas, and higher association areas, which is consistent with a multiple pathways model. Second, neural assemblies of audiovisual integration varied to a great extent depending on the analytical contrast, stimulus complexity, and attention, suggesting a flexible rather than a fixed neural pathway model for audiovisual integration. Third, neural activity consistently occurred at the superior temporal cortex, albeit in slightly different locations based on context, suggesting its central role in audiovisual integration.
Our results suggest that audiovisual integration occurs at multiple levels: sensory sites, including middle and inferior occipital gyrus, fusiform gyrus and lingual gyrus, and the middle portion of superior temporal gyrus; subcortical sites, including the thalamus; higher association sites, including superior temporal cortex and middle and superior frontal gyrus. Though the evidence is correlational rather than causal, our findings are consistent with a multiple pathways model, as outlined in Fig. 1, in which the audiovisual integration is not restricted to a particular brain area but can occur via engaging a network of brain regions. Based on this model, audiovisual integration may partly occur via direct communication between visual and auditory cortices in which traditional unisensory regions may have multisensory characteristics (Calvert et al. 1997; Foxe et al. 2000; Shams et al. 2001; Falchier et al. 2002; Rockland and Ojima 2003; Brosch et al. 2005; Cappe and Barone 2005; Ghazanfar and Schroeder 2006; Mishra et al. 2007). There may also be a cortical-thalamic-cortical route in which sensory information is sent from sensory cortices, integrated at the thalamus, and sent back to a cortical region such as prefrontal cortex (Cappe et al. 2009a; Cappe et al. 2009b; Hackett et al. 2007). This evidence suggests that the thalamus may have a function of computation (i.e. integration) beyond its role of relaying information (Rikhye et al. 2018). Higher association cortices, including superior temporal cortex and prefrontal cortex, have been shown to connect with visual and auditory sensory cortices (Seltzer and Pandya 1994; Romanski et al. 1999; Fuster et al. 2000) in which there are bidirectional feedforward and feedback communications among these brain regions. Although it is possible that our overall results were influenced by differences in the number of studies across conditions, our separate analyses of each condition with conjunction analyses to identify common loci of activity mitigate this limitation. The results were not driven by a specific type of task, as task types are diverse (Supplemental info, Supplementary Dataset S1). Thus, our results support the idea that audiovisual integration can take place at a myriad of levels throughout the cortex.
Audiovisual integration appears to be context-dependent. Analytical contrasts (i.e. criteria) for defining neural activity as audiovisual integration are diverse and are under debate. This issue is further complicated by different stimulus complexities (simple, complex nonspeech, or complex speech) and attention (attending audiovisual, visual, or auditory). Our analyses revealed that there were no shared brain voxels across all conditions for either analytical contrasts, stimulus complexity, or attention, and there were only a small portion of shared voxels for each pairwise comparison. These findings suggest that the neural correlates of audiovisual integration are highly context-dependent, which is consistent with previous evidence that audiovisual integration is flexible and context-dependent (see Van Atteveldt et al. 2014 for a review).
Our results showed that the “Conjunction” contrast had the largest number of activated voxels and the “Interaction” contrast had the smallest number of activated voxels, which is consistent with previous literature suggesting that the “Interaction” contrast is a very strict criterion that will likely lead to missed activity (Beauchamp 2005). It is possible that the “Interaction” contrast, which was adopted from single-neuron studies examining changes in action potentials, does not accurately capture the integration-related changes in the blood oxygen level–dependent (BOLD) activity, which predominantly reflects postsynaptic activity (Laurienti et al. 2005; Stanford and Stein 2007). Moreover, human neuroimaging studies reflect a heterogeneous population of neurons, which is different from single-unit recordings in animal electrophysiological studies (Laurienti et al. 2005). The absence of a supraadditive effect in a particular study may also be due to ceiling BOLD responses for the unimodal stimuli (Calvert 2001). This difference in the sensitivity of the contrasts might explain why a subcortical node (i.e. thalamus) was only identified for the “Conjunction” contrast. In addition to the thalamus, differences between the analytical contrasts appeared in other regions as well. We observed an anterior–posterior differentiation in the superior temporal cortex across contrasts, with the congruency contrast activity being located more anteriorly compared to the interaction or conjunction contrast activity. It is possible that the congruency contrast reveals modulations of 1 modality on another modality in addition to the integration of inputs. In line with this interpretation, we also found the involvement of visual regions such as occipital lobe and inferior temporal gyrus only for the congruency contrast. Additionally, the inferior frontal cortex was only identified for the “Incongruent > Congruent” contrast. It is likely that the inferior frontal cortex activation reflects conflict resolution rather than an integration-specific process, given previous evidence on the link between inferior frontal cortex and domain-general conflict resolution and cognitive control (Derrfuss et al. 2005; Nelson et al. 2009). Notably, for the analyses regarding the comparison of different analytical contrasts, we only included 3 types of contrasts with sufficient number of studies. Other types of contrasts such as maximum criterion (multisensory congruent > max (unimodal1, unimodal2)) and mean criterion (multisensory congruent > mean (unimodal1, unimodal2)) (Beauchamp 2005; James and Stevenson 2012) could not be compared due to a small number of available studies.
We also found an anterior–posterior distinction between simple/complex nonspeech (anterior) and complex speech stimuli (posterior) in the superior temporal cortex. Posterior superior temporal cortex (traditionally labeled as Wernicke’s area) has been associated with speech perception and comprehension (Lesser et al. 1986; Naeser et al. 1987; but, see also Binder 2017). However, the middle portions of superior temporal cortex have been linked with the processing of auditory inputs or objects (Price 2010). Thus, 1 interpretation of our findings is that brain regions relevant for processing particular stimulus types are directly involved in the audiovisual integration of those specific stimuli. Consistent with this interpretation, we only found the activation of left inferior frontal gyrus (another classical language area, Broca’s area) for the audiovisual integration of speech but not for simple or complex nonspeech stimuli. Moreover, there were more activated voxels in the left than the right hemisphere for the audiovisual integration of speech stimuli, which is consistent with the left–right asymmetries in speech processing (Geschwind and Levitsky 1968; Hickok and Poeppel 2007).
We found more activated voxels for attending to audiovisual stimuli than for attending to either of the unisensory stimuli. This is consistent with previous evidence that modality-specific selective attention can reduce multisensory integration (Mozolic et al. 2008; Badde et al. 2020), though we cannot rule out the possibility that it is due to the difference in the number of studies. Notably, we found overlapping voxels between audiovisual attention with either visual or auditory attention, but there were no overlapping voxels between visual and auditory attention. This finding suggests that modality-specific attention not only possibly attenuates multisensory integration but also involves different neural activities (Chambers et al. 2004; Fairhall and Macaluso 2009; Fernández et al. 2015). We found activation of the insula for auditory attention but not for visual attention. This difference can be interpreted by salience processing in which the insula as a key node in the “salience network” has a central role in detecting behaviorally relevant signals (Menon and Uddin 2010; Uddin 2015).
The present study primarily focused on the context-dependent neural activity of audiovisual integration for 3 factors that had sufficient numbers of studies for a thorough meta-analysis: analytical contrast used, stimulus complexity, and focus of attention. However, we also examined additional factors that may modulate the neural correlates of audiovisual integration, such as correspondence (spatial, temporal, or semantic) and task (identification, discrimination, detection, and passive) (Doehrmann and Naumer 2008; Spence 2011). Although there were too few studies in some conditions to draw firm conclusions, our supplementary analyses suggest that brain regions engaged by audiovisual integration also depend on the correspondence and task. Together with contrast, stimuli, and attention, these findings further support the context-dependent nature of audiovisual integration in the brain (Calvert 2001).
Though there were highly divergent neural activities across contexts, we found that 1 brain region was consistently involved in audiovisual integration: superior temporal cortex. Although this finding is consistent with the extensive prior literature suggesting the importance of superior temporal cortex in audiovisual integration (Beauchamp et al. 2004; Calvert and Thesen 2004; Werner and Noppeney 2010), our results highlight that there is not a singular integration region within the superior temporal cortex. Notably, there was no overlapping neural activity across levels for either analytical contrast, stimulus complexity, or attention, but conjunction analyses showed that pairwise overlapping neural activity was in superior temporal cortex. Despite adjacent regions being activated under different contexts, the superior temporal cortex remains part of each of these distinct integration networks. It is possible that the superior temporal cortex is centrally located among different sites of audiovisual integration (visual cortex, subcortical node, and prefrontal cortex), which has the ease to get involved in all the possible neural pathways. Together, our findings highlight a flexible multiple pathways model for audiovisual integration, with superior temporal cortex as the central node in these neural assemblies.
Conclusion
Our results support the idea that audiovisual integration can take place at a myriad of levels throughout the cortex and the identified areas partially depend on the choices made by researchers as to how they will induce and identify multisensory brain activity in their data. It provides support for the multiple pathways model in which audiovisual integration is associated with early cortical areas, subcortical areas, and higher association areas. The neural pathways for audiovisual integration appear to be a flexible rather than fixed network of brain regions with superior temporal cortex playing a central role. Together, these findings provide insights on the neural mechanisms of audiovisual integration.
Supplementary Material
Acknowledgements
We thank three anonymous reviewers for their helpful comments.
Contributor Information
Chuanji Gao, Donders Institute for Brain, Cognition and Behaviour, Radboud University, Nijmegen, Netherlands.
Jessica J Green, Department of Psychology, Institute for Mind and Brain, University of South Carolina, Columbia, SC 29201, USA.
Xuan Yang, Department of Psychology, Institute for Mind and Brain, University of South Carolina, Columbia, SC 29201, USA.
Sewon Oh, Department of Psychology, Institute for Mind and Brain, University of South Carolina, Columbia, SC 29201, USA.
Jongwan Kim, Department of Psychology, Jeonbuk National University, Jeonju, South Korea.
Svetlana V Shinkareva, Department of Psychology, Institute for Mind and Brain, University of South Carolina, Columbia, SC 29201, USA.
Funding
This work was supported by a Radboud Excellence Fellowship from Radboud University in Nijmegen, the Netherlands to Chuanji Gao and funding from the University of South Carolina Office of the Provost to Svetlana V. Shinkareva.
Conflict of interest statement: None declared.
References
- Badde S, Navarro KT, Landy MS. Modality-specific attention attenuates visual-tactile integration and recalibration effects by reducing prior expectations of a common source for vision and touch. Cognition. 2020:197:104170. [DOI] [PMC free article] [PubMed] [Google Scholar]
- Barrós-Loscertales A, Ventura-Campos N, Visser M, Alsius A, Pallier C, Ávila Rivera C, Soto-Faraco S. Neural correlates of audiovisual speech processing in a second language. Brain Lang. 2013:126(3):253–262. [DOI] [PubMed] [Google Scholar]
- Beauchamp MS. Statistical criteria in FMRI studies of multisensory integration. Neuroinformatics. 2005:3(2):93–113. [DOI] [PMC free article] [PubMed] [Google Scholar]
- Beauchamp MS, Argall BD, Bodurka J, Duyn JH, Martin A. Unraveling multisensory integration: patchy organization within human STS multisensory cortex. Nat Neurosci. 2004:7(11):1190. [DOI] [PubMed] [Google Scholar]
- Belardinelli MO, Sestieri C, Di Matteo R, Delogu F, Del Gratta C, Ferretti A, Caulo M, Tartaro A, Romani GL. Audio-visual crossmodal interactions in environmental perception: an fMRI investigation. Cogn Process. 2004:5(3):167–174. [Google Scholar]
- Benoit MM, Raij T, Lin FH, Jääskeläinen IP, Stufflebeam S. Primary and multisensory cortical activity is correlated with audiovisual percepts. Hum Brain Mapp. 2010:31(4):526–538. [DOI] [PMC free article] [PubMed] [Google Scholar]
- Binder JR. Current controversies on Wernicke’s area and its role in language. Curr Neurol Neurosci Rep. 2017:17(8):1–10. [DOI] [PubMed] [Google Scholar]
- Bonath B, Noesselt T, Martinez A, Mishra J, Schwiecker K, Heinze H-J, Hillyard SA. Neural basis of the ventriloquist illusion. Curr Biol. 2007:17(19):1697–1703. [DOI] [PubMed] [Google Scholar]
- Brosch M, Selezneva E, Scheich H. Nonauditory events of a behavioral procedure activate auditory cortex of highly trained monkeys. J Neurosci. 2005:25(29):6797–6806. [DOI] [PMC free article] [PubMed] [Google Scholar]
- Bushara KO, Grafman J, Hallett M. Neural correlates of auditory–visual stimulus onset asynchrony detection. J Neurosci. 2001:21(1):300–304. [DOI] [PMC free article] [PubMed] [Google Scholar]
- Butler AJ, James TW, James KH. Enhanced multisensory integration and motor reactivation after active motor learning of audiovisual associations. J Cogn Neurosci. 2011:23(11):3515–3528. [DOI] [PubMed] [Google Scholar]
- Bzdok D, Schilbach L, Vogeley K, Schneider K, Laird AR, Langner R, Eickhoff SB. Parsing the neural correlates of moral cognition: ALE meta-analysis on morality, theory of mind, and empathy. Brain Struct Funct. 2012:217(4):783–796. [DOI] [PMC free article] [PubMed] [Google Scholar]
- Calvert GA. Crossmodal processing in the human brain: insights from functional neuroimaging studies. Cereb Cortex. 2001:11(12):1110–1123. [DOI] [PubMed] [Google Scholar]
- Calvert GA, Thesen T. Multisensory integration: methodological approaches and emerging principles in the human brain. J Physiol-Paris. 2004:98(1–3):191–205. [DOI] [PubMed] [Google Scholar]
- Calvert GA, Bullmore ET, Brammer MJ, Campbell R, Williams SC, McGuire PK, Woodruff PW, Iversen SD, David AS. Activation of auditory cortex during silent lipreading. Science. 1997:276(5312):593–596. [DOI] [PubMed] [Google Scholar]
- Calvert GA, Campbell R, Brammer MJ. Evidence from functional magnetic resonance imaging of crossmodal binding in the human heteromodal cortex. Curr Biol. 2000:10(11):649–657. [DOI] [PubMed] [Google Scholar]
- Cappe C, Barone P. Heteromodal connections supporting multisensory integration at low levels of cortical processing in the monkey. Eur J Neurosci. 2005:22(11):2886–2902. [DOI] [PubMed] [Google Scholar]
- Cappe C, Morel A, Barone P, Rouiller EM. The thalamocortical projection systems in primate: an anatomical support for multisensory and sensorimotor interplay. Cereb Cortex. 2009a:19(9):2025–2037. [DOI] [PMC free article] [PubMed] [Google Scholar]
- Cappe C, Rouiller EM, Barone P. Multisensory anatomical pathways. Hear Res. 2009b:258(1–2):28–36. [DOI] [PubMed] [Google Scholar]
- Chambers CD, Stokes MG, Mattingley JB. Modality-specific control of strategic spatial attention in parietal cortex. Neuron. 2004:44(6):925–930. [DOI] [PubMed] [Google Scholar]
- Colonius H. Possibly dependent probability summation of reaction time. J Math Psychol. 1990:34(3):253–275. [Google Scholar]
- Colonius H, Diederich A. Formal models and quantitative measures of multisensory integration: a selective overview. Eur J Neurosci. 2020:51(5):1161–1178. [DOI] [PubMed] [Google Scholar]
- Deneve S, Pouget A. Bayesian multisensory integration and cross-modal spatial links. J Physiol-Paris. 2004:98(1–3):249–258. [DOI] [PubMed] [Google Scholar]
- Derrfuss J, Brass M, Neumann J, Cramon DY. Involvement of the inferior frontal junction in cognitive control: meta-analyses of switching and Stroop studies. Hum Brain Mapp. 2005:25(1):22–34. [DOI] [PMC free article] [PubMed] [Google Scholar]
- Doehrmann O, Naumer MJ. Semantics and the multisensory brain: how meaning modulates processes of audio-visual integration. Brain Res. 2008:1242:136–150. [DOI] [PubMed] [Google Scholar]
- Driver J, Noesselt T. Multisensory interplay reveals crossmodal influences on ‘sensory-specific’brain regions, neural responses, and judgments. Neuron. 2008:57(1):11–23. [DOI] [PMC free article] [PubMed] [Google Scholar]
- Eickhoff SB, Laird AR, Grefkes C, Wang LE, Zilles K, Fox PT. Coordinate-based activation likelihood estimation meta-analysis of neuroimaging data: a random-effects approach based on empirical estimates of spatial uncertainty. Hum Brain Mapp. 2009:30(9):2907–2926. [DOI] [PMC free article] [PubMed] [Google Scholar]
- Eickhoff SB, Bzdok D, Laird AR, Roski C, Caspers S, Zilles K, Fox PT. Co-activation patterns distinguish cortical modules, their connectivity and functional differentiation. NeuroImage. 2011:57(3):938–949. [DOI] [PMC free article] [PubMed] [Google Scholar]
- Eickhoff SB, Bzdok D, Laird AR, Kurth F, Fox PT. Activation likelihood estimation meta-analysis revisited. NeuroImage. 2012:59(3):2349–2361. [DOI] [PMC free article] [PubMed] [Google Scholar]
- Eickhoff SB, Nichols TE, Laird AR, Hoffstaedter F, Amunts K, Fox PT, Bzdok D, Eickhoff CR. Behavior, sensitivity, and power of activation likelihood estimation characterized by massive empirical simulation. NeuroImage. 2016:137:70–85. [DOI] [PMC free article] [PubMed] [Google Scholar]
- Ernst MO, Banks MS. Humans integrate visual and haptic information in a statistically optimal fashion. Nature. 2002:415(6870):429. [DOI] [PubMed] [Google Scholar]
- Ernst MO, Bülthoff HH. Merging the senses into a robust percept. Trends Cogn Sci. 2004:8(4):162–169. [DOI] [PubMed] [Google Scholar]
- Ethofer T, Pourtois G, Wildgruber D. Investigating audiovisual integration of emotional signals in the human brain. Prog Brain Res. 2006:156:345–361. [DOI] [PubMed] [Google Scholar]
- Fairhall S, Macaluso E. Spatial attention can modulate audiovisual integration at multiple cortical and subcortical sites. Eur J Neurosci. 2009:29(6):1247–1257. [DOI] [PubMed] [Google Scholar]
- Falchier A, Clavagnier S, Barone P, Kennedy H. Anatomical evidence of multimodal integration in primate striate cortex. J Neurosci. 2002:22(13):5749–5759. [DOI] [PMC free article] [PubMed] [Google Scholar]
- Fernández LM, Visser M, Ventura-Campos N, Ávila C, Soto-Faraco S. Top-down attention regulates the neural expression of audiovisual integration. NeuroImage. 2015:119:272–285. [DOI] [PubMed] [Google Scholar]
- Fetsch CR, Pouget A, DeAngelis GC, Angelaki DE. Neural correlates of reliability-based cue weighting during multisensory integration. Nat Neurosci. 2012:15(1):146. [DOI] [PMC free article] [PubMed] [Google Scholar]
- Foxe JJ, Morocz IA, Murray MM, Higgins BA, Javitt DC, Schroeder CE. Multisensory auditory–somatosensory interactions in early cortical processing revealed by high-density electrical mapping. Cogn Brain Res. 2000:10(1–2):77–83. [DOI] [PubMed] [Google Scholar]
- Friston KJ, Josephs O, Rees G, Turner R. Nonlinear event-related responses in fMRI. Magn Reson Med. 1998:39(1):41–52. [DOI] [PubMed] [Google Scholar]
- Fuster JM, Bodner M, Kroger JK. Cross-modal and cross-temporal association in neurons of frontal cortex. Nature. 2000:405(6784):347–351. [DOI] [PubMed] [Google Scholar]
- Geschwind N, Levitsky W. Human brain: left-right asymmetries in temporal speech region. Science. 1968:161(3837):186–187. [DOI] [PubMed] [Google Scholar]
- Ghazanfar AA, Schroeder CE. Is neocortex essentially multisensory? Trends Cogn Sci. 2006:10(6):278–285. [DOI] [PubMed] [Google Scholar]
- Green A, Straube B, Weis S, Jansen A, Willmes K, Konrad K, Kircher T. Neural integration of iconic and unrelated coverbal gestures: a functional MRI study. Hum Brain Mapp. 2009:30(10):3309–3324. [DOI] [PMC free article] [PubMed] [Google Scholar]
- Hackett TA, De La Mothe LA, Ulbert I, Karmos G, Smiley J, Schroeder CE. Multisensory convergence in auditory cortex, II. Thalamocortical connections of the caudal superior temporal plane. J Comp Neurol. 2007:502(6):924–952. [DOI] [PubMed] [Google Scholar]
- Hardwick RM, Caspers S, Eickhoff SB, Swinnen SP. Neural correlates of action: comparing meta-analyses of imagery, observation, and execution. Neurosci Biobehav Rev. 2018:94:31–44. [DOI] [PubMed] [Google Scholar]
- Hickok G, Poeppel D. The cortical organization of speech processing. Nat Rev Neurosci. 2007:8(5):393–402. [DOI] [PubMed] [Google Scholar]
- Hocking J, Price CJ. The role of the posterior superior temporal sulcus in audiovisual processing. Cereb Cortex. 2008:18(10):2439–2449. [DOI] [PMC free article] [PubMed] [Google Scholar]
- Holle H, Obleser J, Rueschemeyer S-A, Gunter TC. Integration of iconic gestures and speech in left superior temporal areas boosts speech comprehension under adverse listening conditions. NeuroImage. 2010:49(1):875–884. [DOI] [PubMed] [Google Scholar]
- Holmes NP. The law of inverse effectiveness in neurons and behaviour: multisensory integration versus normal variability. Neuropsychologia. 2007:45(14):3340–3345. [DOI] [PubMed] [Google Scholar]
- James TW, Stevenson RA. The use of fMRI to assess multisensory integration. The neural bases of multisensory processes. Boca Raton (FL): CRC Press/Taylor & Francis; 2012 [PubMed] [Google Scholar]
- Kadunce DC, Vaughan JW, Wallace MT, Benedek G, Stein BE. Mechanisms of within-and cross-modality suppression in the superior colliculus. J Neurophysiol. 1997:78(6):2834–2847. [DOI] [PubMed] [Google Scholar]
- Kogler L, Müller VI, Werminghausen E, Eickhoff SB, Derntl B. Do I feel or do I know? Neuroimaging meta-analyses on the multiple facets of empathy. Cortex. 2020:129:341–355. [DOI] [PMC free article] [PubMed] [Google Scholar]
- Körding KP, Beierholm U, Ma WJ, Quartz S, Tenenbaum JB, Shams L. Causal inference in multisensory perception. PLoS One. 2007:2(9):e943. [DOI] [PMC free article] [PubMed] [Google Scholar]
- Lancaster JL, Tordesillas-Gutiérrez D, Martinez M, Salinas F, Evans A, Zilles K, Mazziotta JC, Fox PT. Bias between MNI and Talairach coordinates analyzed using the ICBM-152 brain template. Hum Brain Mapp. 2007:28(11):1194–1205. [DOI] [PMC free article] [PubMed] [Google Scholar]
- Laurienti PJ, Perrault TJ, Stanford TR, Wallace MT, Stein BE. On the use of superadditivity as a metric for characterizing multisensory integration in functional neuroimaging studies. Exp Brain Res. 2005:166(3):289–297. [DOI] [PubMed] [Google Scholar]
- Lesser R, Lüders H, Morris H, Dinner D, Klem G, Hahn J, Harrison M. Electrical stimulation of Wernicke's area interferes with comprehension. Neurology. 1986:36(5):658–658. [DOI] [PubMed] [Google Scholar]
- Liberati A, Altman DG, Tetzlaff J, Mulrow C, Gøtzsche PC, Ioannidis JP, Clarke M, Devereaux PJ, Kleijnen J, Moher D. The PRISMA statement for reporting systematic reviews and meta-analyses of studies that evaluate health care interventions: explanation and elaboration. J Clin Epidemiol. 2009:62(10):e1–e34. [DOI] [PubMed] [Google Scholar]
- Macaluso E, Noppeney U, Talsma D, Vercillo T, Hartcher-O’Brien J, Adam R. The curious incident of attention in multisensory integration: bottom-up vs. top-down. Multisens Res. 2016:29(6–7):557–583. [Google Scholar]
- Magnotti JF, Ma WJ, Beauchamp MS. Causal inference of asynchronous audiovisual speech. Front Psychol. 2013:4:798. [DOI] [PMC free article] [PubMed] [Google Scholar]
- Mechelli A, Price CJ, Friston KJ. Nonlinear coupling between evoked rCBF and BOLD signals: a simulation study of hemodynamic responses. NeuroImage. 2001:14(4):862–872. [DOI] [PubMed] [Google Scholar]
- Menon V, Uddin LQ. Saliency, switching, attention and control: a network model of insula function. Brain Struct Funct. 2010:214(5):655–667. [DOI] [PMC free article] [PubMed] [Google Scholar]
- Meredith MA, Stein BE. Interactions among converging sensory inputs in the superior colliculus. Science. 1983:221(4608):389–391. [DOI] [PubMed] [Google Scholar]
- Meredith MA, Stein BE. Spatial factors determine the activity of multisensory neurons in cat superior colliculus. Brain Res. 1986a:365(2):350–354. [DOI] [PubMed] [Google Scholar]
- Meredith MA, Stein BE. Visual, auditory, and somatosensory convergence on cells in superior colliculus results in multisensory integration. J Neurophysiol. 1986b:56(3):640–662. [DOI] [PubMed] [Google Scholar]
- Meredith MA, Nemitz JW, Stein BE. Determinants of multisensory integration in superior colliculus neurons. I. Temporal factors. J Neurosci. 1987:7(10):3215–3229. [DOI] [PMC free article] [PubMed] [Google Scholar]
- Miller J. Divided attention: evidence for coactivation with redundant signals. Cogn Psychol. 1982:14(2):247–279. [DOI] [PubMed] [Google Scholar]
- Mishra J, Martinez A, Sejnowski TJ, Hillyard SA. Early cross-modal interactions in auditory and visual cortex underlie a sound-induced visual illusion. J Neurosci. 2007:27(15):4120–4131. [DOI] [PMC free article] [PubMed] [Google Scholar]
- Morandini HA, Silk TJ, Griffiths K, Rao P, Hood SD, Zepf FD. Meta-analysis of the neural correlates of vigilant attention in children and adolescents. Cortex. 2020:132:374–385. [DOI] [PubMed] [Google Scholar]
- Mozolic JL, Hugenschmidt CE, Peiffer AM, Laurienti PJ. Modality-specific selective attention attenuates multisensory integration. Exp Brain Res. 2008:184(1):39–52. [DOI] [PubMed] [Google Scholar]
- Müller VI, Höhner Y, Eickhoff SB. Influence of task instructions and stimuli on the neural network of face processing: an ALE meta-analysis. Cortex. 2018:103:240–255. [DOI] [PMC free article] [PubMed] [Google Scholar]
- Naeser MA, Helm-Estabrooks N, Haas G, Auerbach S, Srinivasan M. Relationship between lesion extent in'Wernicke's area'on computed tomographic scan and predicting recovery of comprehension in Wernicke's aphasia. Arch Neurol. 1987:44(1):73–82. [DOI] [PubMed] [Google Scholar]
- Nelson JK, Reuter-Lorenz PA, Persson J, Sylvester C-YC, Jonides J. Mapping interference resolution across task domains: a shared control process in left inferior frontal gyrus. Brain Res. 2009:1256:92–100. [DOI] [PMC free article] [PubMed] [Google Scholar]
- Nichols T, Brett M, Andersson J, Wager T, Poline J-B. Valid conjunction inference with the minimum statistic. NeuroImage. 2005:25(3):653–660. [DOI] [PubMed] [Google Scholar]
- Noppeney U. Perceptual inference, learning, and attention in a multisensory world. Annu Rev Neurosci. 2021:44:449–473. [DOI] [PubMed] [Google Scholar]
- Noppeney U, Ostwald D, Werner S. Perceptual decisions formed by accumulation of audiovisual evidence in prefrontal cortex. J Neurosci. 2010:30(21):7434–7446. [DOI] [PMC free article] [PubMed] [Google Scholar]
- Parise CV, Ernst MO. Correlation detection as a general mechanism for multisensory integration. Nat Commun. 2016:7:11543. [DOI] [PMC free article] [PubMed] [Google Scholar]
- Price CJ. The anatomy of language: a review of 100 fMRI studies published in 2009. Ann N Y Acad Sci. 2010:1191(1):62–88. [DOI] [PubMed] [Google Scholar]
- Rikhye RV, Wimmer RD, Halassa MM. Toward an integrative theory of thalamic function. Annu Rev Neurosci. 2018:41:163–183. [DOI] [PubMed] [Google Scholar]
- Rockland KS, Ojima H. Multisensory convergence in calcarine visual areas in macaque monkey. Int J Psychophysiol. 2003:50(1–2):19–26. [DOI] [PubMed] [Google Scholar]
- Rohe T, Noppeney U. Reliability-weighted integration of audiovisual signals can be modulated by top-down attention. Eneuro. 2018:5(1):1–20. [DOI] [PMC free article] [PubMed] [Google Scholar]
- Romanski LM, Bates JF, Goldman-Rakic PS. Auditory belt and parabelt projections to the prefrontal cortex in the rhesus monkey. J Comp Neurol. 1999:403(2):141–157. [DOI] [PubMed] [Google Scholar]
- Seltzer B, Pandya DN. Parietal, temporal, and occipita projections to cortex of the superior temporal sulcus in the rhesus monkey: a retrograde tracer study. J Comp Neurol. 1994:343(3):445–463. [DOI] [PubMed] [Google Scholar]
- Shams L, Beierholm UR. Causal inference in perception. Trends Cogn Sci. 2010:14(9):425–432. [DOI] [PubMed] [Google Scholar]
- Shams L, Kamitani Y, Thompson S, Shimojo S. Sound alters visual evoked potentials in humans. Neuroreport. 2001:12(17):3849–3852. [DOI] [PubMed] [Google Scholar]
- Shams L, Ma WJ, Beierholm U. Sound-induced flash illusion as an optimal percept. Neuroreport. 2005:16(17):1923–1927. [DOI] [PubMed] [Google Scholar]
- Spence C. Crossmodal correspondences: a tutorial review. Atten Percept Psychophys. 2011:73(4):971–995. [DOI] [PubMed] [Google Scholar]
- Stanford TR, Stein BE. Superadditivity in multisensory integration: putting the computation in context. Neuroreport. 2007:18(8):787–792. [DOI] [PubMed] [Google Scholar]
- Stein BE, Stanford TR. Multisensory integration: current issues from the perspective of the single neuron. Nat Rev Neurosci. 2008:9(4):255–266. [DOI] [PubMed] [Google Scholar]
- Stein BE, Burr D, Constantinidis C, Laurienti PJ, Alex Meredith M, Perrault TJ Jr, Ramachandran R, Röder B, Rowland BA, Sathian K. Semantic confusion regarding the development of multisensory integration: a practical solution. Eur J Neurosci. 2010:31(10):1713–1720. [DOI] [PMC free article] [PubMed] [Google Scholar]
- Stekelenburg JJ, Vroomen J. Neural correlates of multisensory integration of ecologically valid audiovisual events. J Cogn Neurosci. 2007:19(12):1964–1973. [DOI] [PubMed] [Google Scholar]
- Stevenson RA, James TW. Audiovisual integration in human superior temporal sulcus: inverse effectiveness and the neural processing of speech and object recognition. NeuroImage. 2009:44(3):1210–1223. [DOI] [PubMed] [Google Scholar]
- Talsma D. Predictive coding and multisensory integration: an attentional account of the multisensory mind. Front Integr Neurosci. 2015:9:19. [DOI] [PMC free article] [PubMed] [Google Scholar]
- Talsma D, Doty TJ, Woldorff MG. Selective attention and audiovisual integration: Is attending to both modalities a prerequisite for early integration? Cereb Cortex. 2006:17(3):679–690. [DOI] [PubMed] [Google Scholar]
- Talsma D, Senkowski D, Soto-Faraco S, Woldorff MG. The multifaceted interplay between attention and multisensory integration. Trends Cogn Sci. 2010:14(9):400–410. [DOI] [PMC free article] [PubMed] [Google Scholar]
- Teder-Sälejärvi W, McDonald J, Di Russo F, Hillyard S. An analysis of audio-visual crossmodal integration by means of event-related potential (ERP) recordings. Cogn Brain Res. 2002:14(1):106–114. [DOI] [PubMed] [Google Scholar]
- Tuomainen J, Andersen TS, Tiippana K, Sams M. Audio–visual speech perception is special. Cognition. 2005:96(1):B13–B22. [DOI] [PubMed] [Google Scholar]
- Turkeltaub PE, Eickhoff SB, Laird AR, Fox M, Wiener M, Fox P. Minimizing within-experiment and within-group effects in activation likelihood estimation meta-analyses. Hum Brain Mapp. 2012:33(1):1–13. [DOI] [PMC free article] [PubMed] [Google Scholar]
- Uddin LQ. Salience processing and insular cortical function and dysfunction. Nat Rev Neurosci. 2015:16(1):55–61. [DOI] [PubMed] [Google Scholar]
- Van Atteveldt N, Murray MM, Thut G, Schroeder CE. Multisensory integration: flexible use of general operations. Neuron. 2014:81(6):1240–1253. [DOI] [PMC free article] [PubMed] [Google Scholar]
- Wallace MT, Wilkinson LK, Stein BE. Representation and integration of multiple sensory inputs in primate superior colliculus. J Neurophysiol. 1996:76(2):1246–1266. [DOI] [PubMed] [Google Scholar]
- Werner S, Noppeney U. Superadditive responses in superior temporal sulcus predict audiovisual benefits in object categorization. Cereb Cortex. 2010:20(8):1829–1842. [DOI] [PubMed] [Google Scholar]
- Wu J, Ngo GH, Greve D, Li J, He T, Fischl B, Eickhoff SB, Yeo BT. Accurate nonlinear mapping between MNI volumetric and FreeSurfer surface coordinate systems. Hum Brain Mapp. 2018:39(9):3793–3808. [DOI] [PMC free article] [PubMed] [Google Scholar]
Associated Data
This section collects any data citations, data availability statements, or supplementary materials included in this article.