Abstract
The research team has utilized privacy-protected mobile device location data, integrated with COVID-19 case data and census population data, to produce a COVID-19 impact analysis platform that can inform users about the effects of COVID-19 spread and government orders on mobility and social distancing. The platform is being updated daily, to continuously inform decision-makers about the impacts of COVID-19 on their communities, using an interactive analytical tool. The research team has processed anonymized mobile device location data to identify trips and produced a set of variables, including social distancing index, percentage of people staying at home, visits to work and non-work locations, out-of-town trips, and trip distance. The results are aggregated to county and state levels to protect privacy, and scaled to the entire population of each county and state. The research team is making their data and findings, which are updated daily and go back to January 1, 2020, for benchmarking, available to the public to help public officials make informed decisions. This paper presents a summary of the platform and describes the methodology used to process data and produce the platform metrics.
Informed decision-making requires data. In the case of COVID-19, no previous pandemic has had such a big universal impact on societies in modern history; as a result, historic data lacked key information on how people react to such a universal pandemic and how the virus affects economies and societies. Data-driven decision-making becomes a challenge in such an unprecedented event. Thanks to the technology, there is now an enormous amount of observed data collected by mobile devices amid pandemics. It is now possible to utilize this data to learn more about the various impacts of a pandemic on people’s lives, make informed decisions to fight the current “invisible enemy,” and be better prepared next time such pandemics happen. The research team has utilized a national set of privacy-protected mobile device location data and produced a COVID-19 Impact Analysis Platform to provide comprehensive data and insights on COVID-19’s impact on mobility, economy, and society.
Mobile device location data are becoming popular for studying human behavior, especially mobility behavior. Earlier studies with mobile device location data were mainly using GPS technology, which is capable of recording accurate information, including location, time, speed, and possibly a measure of data quality ( 1 ). Later, mobile phones and smartphones gained popularity, as they could enable researchers to study individual-level mobility patterns ( 2 – 4 ). Other emerging mobile device location data sources, such as call detail record (CDR), cellular network data, and social media location-based services, have also been used by researchers to study mobility behavior ( 5 – 13 ). Mobile device location data has proved to be a great asset for decision-makers amid the current COVID-19 pandemic. Many companies, such as Google and Apple, or Cuebiq, have already utilized location data to produce valuable information about mobility and economic trends ( 14 – 16 ). Researchers have also utilized mobile device location data for studying COVID-19-related behavior ( 17 , 18 ).
The effect of mobility patterns and non-pharmaceutical interventions such as social distancing has been well studied for preventing virus spread ( 19 – 21 ). Empirical analysis utilizing airline travel revealed the significant influence of international air travel on the progress of influenza outbreaks, as well as the impacts of domestic air travel on the evolution of disease spread across the United States (U.S.) ( 20 ). Later on, studies utilized more comprehensive mobility data to investigate the influence of mobility patterns and travel restrictions on containing the epidemic spread ( 21 , 22 ). One of the most recent studies projected that the recurrent outbreaks might be observed in the winter of 2020 based on pharmaceutical estimates of COVID-19 and other coronaviruses, so prolonged or intermittent social distancing may be required until 2022 without any interventions, highlighting the importance of improving understanding of individuals’ reactions to social distancing ( 23 ). Researchers have highlighted the importance of social distancing in disease prevention through modeling and simulation ( 24 – 27 ). The simulation models assume a level of compliance, which can now be validated through observed data. Furthermore, artificial intelligence (AI) techniques, along with big data, have also been largely applied in several different aspects to manage the COVID-19 pandemic, such as early detection and diagnosis, monitoring the treatment, contact tracing of individuals, and projection of cases and mortality ( 28 , 29 ).
The research team’s current platform utilizes mobile device location data to provide observed data and evidence on social distancing behavior and the impact of COVID-19 on mobility. Daily feeds of mobile device location data were used, representing movements of more than 100 million anonymized devices, integrated with COVID-19 case data from John Hopkins University and census population data, to monitor mobility trends in the U.S. and study social distancing behavior ( 30 ). The next section describes the underlying mobile device location data used for constructing the mobility patterns. The methodology used to process the anonymized location data and produce the metrics that are available on the platform is described next. The methodology section is followed by a brief overview of the platform. The last section presents concluding remarks.
Data
The emergence of mobile device location technologies such as cellphone, GPS, and location-based services (LBS) made mobile device location data a prominent asset in various application areas, such as human mobility behavior, marketing, and advertising. A typical mobile device location data record from LBS technology contains information about the timestamp, location of the device (latitude and longitude coordinates), and a measure of spatial accuracy. Because of privacy protection, in some cases, the location information may be reported in an aggregated or transformed form. In the data platform, the research team first integrated and cleaned mobile device location data from multiple leading data vendors including sources representing both person and vehicle movements.
Although mobile device location data are rich in terms of spatio-temporal characteristics, certain treatments and data cleaning steps are needed before extracting information from the data. Removing outliers, checking for potential consistency issues in the data (e.g., unreasonable high-speed records), identifying duplicate observations for the same device, and merging them are among the state-of-practice methods for cleaning raw data and controlling its quality. The data cleaning approach utilized in this study is based on four well-known aspects of data quality assessment framework: consistency, accuracy, completeness, and timeliness ( 31 ).
To ensure the consistency of the data, the research team defined certain semantic rules, such as integrity constraints, to be checked through the entire raw data. At this step, all data entries are evaluated to identify observations with invalid values. For example, the latitude and longitude information of a location should follow a reasonable range, so integrity constraint removes all records with invalid entries. The other check is to identify duplicate records to reduce data redundancy. Since one device should only present in no more than one location at the same time, this procedure keeps only one data entry with the highest spatial accuracy at a certain time for one device.
Accuracy is another important dimension of data quality assessment, covering both syntactic and semantic accuracies. The semantic accuracy evaluates the closeness of a value to its real-world observation, while syntactic accuracy ensures the closeness of a value to the elements of its corresponding definition domain. In the application, a spatial accuracy of 50 m indicates that the device should be within 50 m distance of the reported location with a certain confidence interval, for example, 95%. Thus, entries with extremely poor spatial accuracy, for example, 2 mi, are removed from the dataset based on the semantic accuracy rule.
The completeness aspect requires prior knowledge of the actual movement patterns and mobile device usage, which is not available in the application. Therefore, this dimension has not been incorporated into the data cleaning procedure. For the timeliness dimension, an attempt was made to address it by incorporating daily feeds of location data in the platform.
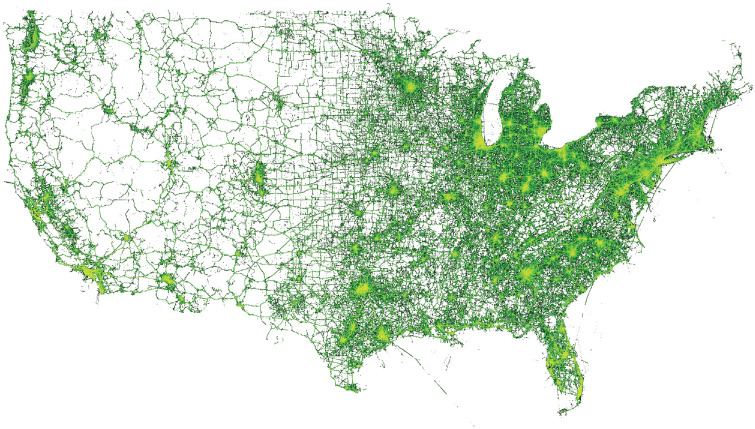
In the final dataset, location-based services technology provides the majority of the observations covering more than 100 million monthly active users across the U.S. On average, the final dataset contains more than 250 sightings per device during a day. Figure 1 demonstrates the heatmap sightings density at the national level.
Figure 1.
The density map of anonymized location data across the nation.
Note: brighter shades = higher density of sightings within a day across the nation.
Methodology
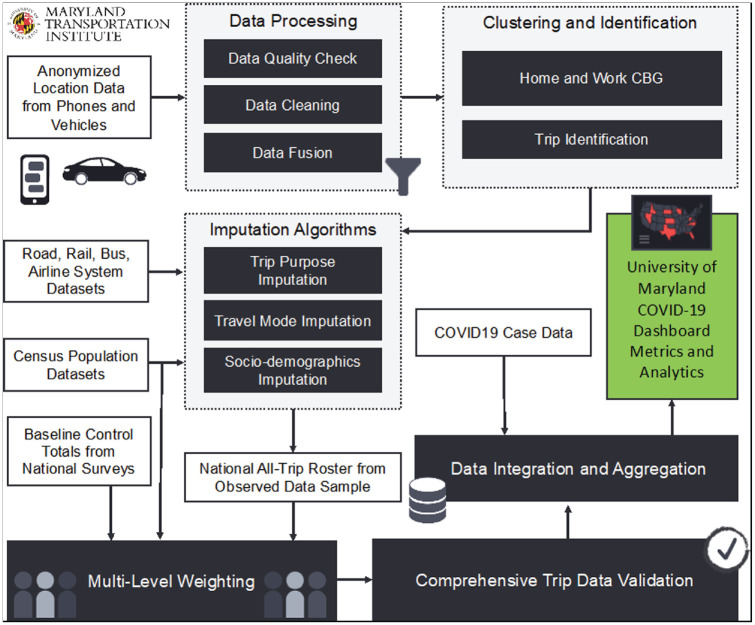
After cleaning and integrating the location data, the location points were then clustered into activity locations, and home and work locations were identified at the census block group (CBG) level to protect privacy. Both temporal and spatial features for the entire activity location list were examined to identify home CBGs and work CBGs for workers with a fixed work location. Next, previously developed and validated algorithms were applied to identify all trips from the cleaned data panel, including trip origin, destination, departure time, and arrival time ( 32 ). Additional steps were taken to impute missing trip information for each trip, such as trip purpose (e.g., work, non-work), point-of-interest (POI) visited (restaurants, shops, etc.), travel mode (air, rail, bus, driving, biking, walking, and others), trip distance (airline and actual distance), and socio-demographics of the travelers (income, age, gender, race, etc.) using advanced artificial intelligence and machine learning algorithms. If an anonymized individual in the sample did not make any trip longer than 1 mi in distance, this anonymized individual was considered as staying at home. A multi-level weighting procedure expanded the sample to the entire population, using device-level and trip-level weights, so the results are representative of the entire population in the nation, a state, or a county. The data sources and computational algorithms have been validated based on a variety of independent datasets, such as the National Household Travel Survey and American Community Survey, and peer reviewed by an external expert panel in a U.S. Department of Transportation (U.S. DOT) Federal Highway Administration’s Exploratory Advanced Research Program project, titled “Data analytics and modeling methods for tracking and predicting origin-destination travel trends based on mobile device data” ( 32 ). Mobility metrics were then integrated with COVID-19 case data, population data, and other data sources. Figure 2 shows a summary of the methodology.
Figure 2.
Methodology.
Trip Identification
Trips are the unit of analysis for almost all transportation applications. Traditional data sources, such as travel surveys, include trip-level information. The mobile device location data, on the other hand, do not directly include trip information. Location sightings can be continuously recorded while a device moves, stops, stays static, or starts a new trip. These changes in status are not recorded in the raw data. As a result, researchers must rely on trip identification algorithms to extract trip information from the raw data. Basically, researchers must identify which locations form a trip together. The following subsections describe the steps the research team took to identify trips. The algorithm runs on the observations of each device separately.
Pre-Processing
First, all device observations are sorted by time. The trip identification algorithm assigns a random ID to every trip it identifies. The location dataset may include many points that do not belong to any trips. The algorithm assigns “0” as the trip ID to these points to identify them as static points. For every observation, the distance, time, and speed between the point and its previous and next points (if they exist) are computed.
The trip identification algorithm has three hyper-parameters: distance threshold, time threshold, and speed threshold. The speed threshold is used to identify if an observation is recorded on the move. The distance and time thresholds are used to identify trip ends. At this step, the algorithm identifies the device’s first observation with . This identified point is on the move, so a random trip ID is generated and assigned to this point. All points recorded before this point (if they exist) are set to have “0” as their trip ID. Next, a recursive algorithm identifies if the next points are on the same trip and should have the same trip ID.
Recursive Algorithm
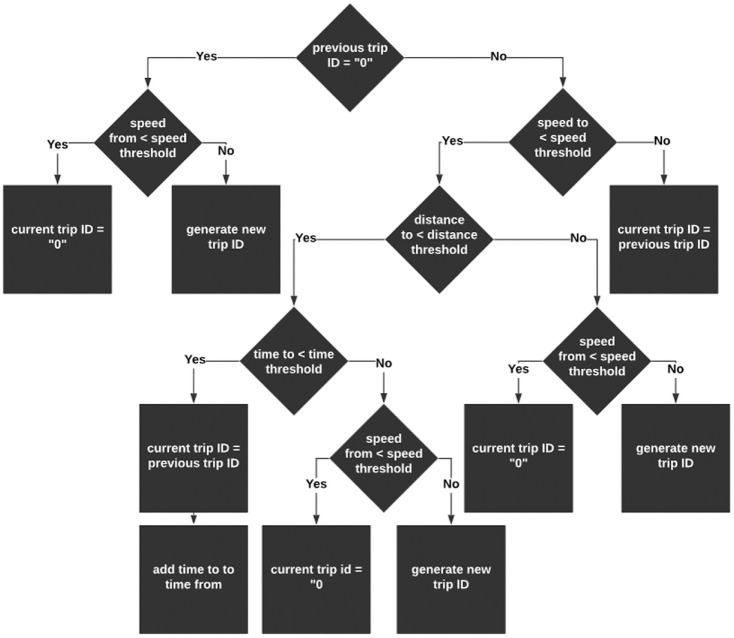
This algorithm checks every point to identify if they belong to the same trip as their previous point (Figure 3). If they do, they are assigned the same trip ID. If they do not, they are either assigned a new random trip ID (when their ) or their trip ID is set to “0” (when their . Identifying if a point belongs to the same trip as its previous point is based on the point’s “speed to,”“distance to,” and “time to” attributes. All the aforementioned attributes are calculated for each individual sighting to compare the measures between every consecutive observation of a device. If a device is seen in a point with but is not observed to move there ( ), the point does not belong to the same trip as its previous point.
Figure 3.
Recursive algorithm for trip identification methodology.
When the device is on the move at a point ( ), the point belongs to the same trip as its previous point; but when the device stops, the algorithm checks the radius and dwell time to identify if the previous trip has ended. If the device stays at the stop (points should be closer than the distance threshold) for a period of time shorter than the time threshold, the points still belong to the previous trip. When the dwell time reaches above the time threshold, the trip ends, and the next points no longer belong to the same trip. The algorithm does this by updating “time from” to be measured from the first observation in the stop, not the point’s previous point. After conducting several rounds of test runs and comparing the results with the national ground truth data sources, such as the 2017 national household travel survey (NHTS), as well as considering the reasonableness of the parameters, the research team has set the speed threshold, time threshold, and distance threshold equal to 3 mph, 300 s, and 300 m, respectively. The algorithm may identify a local movement as a trip if the device moves within a stay location. To filter out such trips, all trips that are within a static cluster and all trips that are shorter than 300 m are removed.
Validation
Figures 4 and 5 show the validation of this algorithm by running the algorithm on a sample of national mobile device location data and comparing the trip lengths and travel times with the reported travel distances and travel times from NHTS 2017. A satisfactory match is observed between the two datasets. A more comprehensive validation result can be found in detailed project report ( 32 ).
Figure 4.
Distance validation of the trip identification algorithm against national household travel survey (NHTS) 2017.
Figure 5.
Travel time validation of the trip identification algorithm against national household travel survey (NHTS) 2017.
Activity Identification
First, all activity points are identified. Then, based on the temporal and spatial distribution of activity points, the home CBG and the work CBG are identified.
Activity Clustering
The algorithm starts by clustering all device observations into activity locations using HDBSCAN clustering algorithm ( 33 ). This step takes the cleaned multi-day location data as input and applies an iterative algorithm until no cluster has a radius larger than 2 mi. The iterative algorithm consists of two parts: HDBSCAN based on a minimum number of point parameters, and filtering non-static clusters based on time and speed checks. After finalizing the potential stay clusters, the framework combines nearby clusters to avoid splitting a single activity (Figure 6).
Figure 6.
Activity clustering methodology.
Home and Work CBG Identification
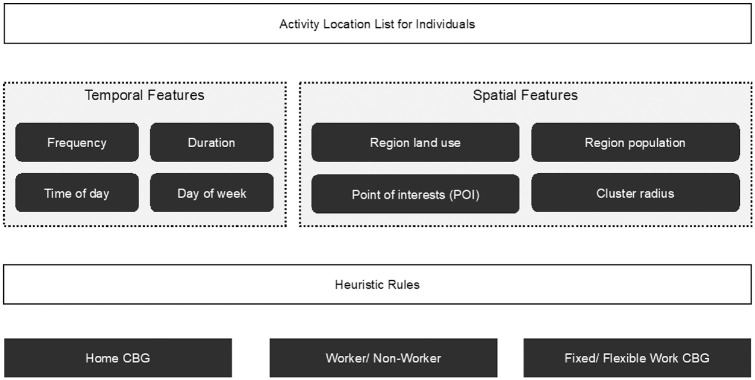
Figure 7 shows the methodology for home and work CBG identification. Instead of setting a fixed time period for each type, for example, 8 p.m. to 8 a.m. as the study period for home CBG identification and the other half day for work CBG identification, the framework examines both temporal and spatial features for the entire activity location list. The benefits are two-fold: the results for workers with flexible or opposite work schedules would be more accurate, and the employment type for each device could be detected simultaneously. The land use information, along with the POI data, also helped avoid identifying home and work locations for devices in pure commercial or pure residential regions, respectively. The POI data also make it possible to further distinguish between different employment categories, which the research team is investigating currently and which will be added to the platform in the near future. Figure 8 shows the validation of home and work location imputations, by comparing the distance from home to work between longitudinal employer-household dynamics (LEHD) data and the imputed locations for a set of mobile device location data for the Baltimore metropolitan area. A satisfactory match can be observed.
Figure 7.
Home/work Census block group (CBG) imputation methodology.
Figure 8.
Validation of home and work imputation against longitudinal employer-household dynamics (LEHD).
Imputation
Mode Imputation
The research team developed a jointly trained single-layer model and deep neural network (DNN) for travel mode detection ( 34 ). This model combines the advantages of both types of model to be able to make sufficient generalizations using a multi-layer DNN and capture the exceptions using the wide single-layer model. An overview of the proposed framework is presented in Figure 9. The datasets used for training the model were collected from the incenTrip mobile phone app (developed by the authors) where the ground truth information for car, bus, rail, bike, walk, and air trips were collected ( 35 ). To effectively detect the travel mode for each trip, feature construction is critical in providing useful information. Travel-mode-specific knowledge is needed to improve the detection accuracy. In addition to the traditional features used in the literature (e.g., average speed, maximum speed, trip distance), the multi-modal transportation network data were also integrated to construct innovative features to improve the detection accuracy based on network data integration. The wide and deep learning method utilized in this study achieved over 95% prediction accuracy for drive, rail, and non-motorized, and over 90% for bus modes on test data. The comprehensive description of the model framework, the training procedure, and result comparison can be found in another paper by the authors ( 36 ).
Figure 9.
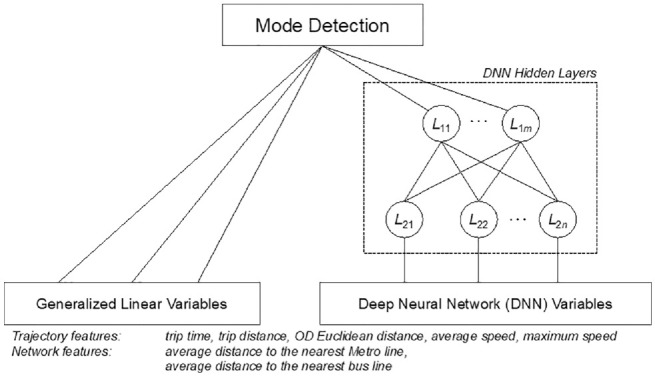
The framework of the mode detection model based on wide and deep learning.
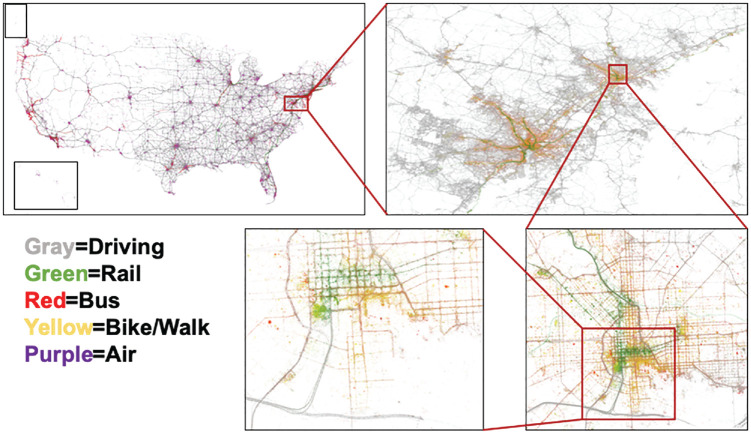
The trained algorithms have been applied on the location dataset to obtain multi-modal trip rosters (see Figure 10 that shows raw location data points by different travel modes). The resulting mode shares show a decent match with the available travel surveys at both national and metropolitan levels.
Figure 10.
Demonstration of the multi-modal travel patterns.
Socio-Demographic Imputation
Because of privacy concerns, mobile device location data contain no information about the device owners. However, it is essential to understand how representative the sample is and how different segments of the population travel. The state-of-the-practice method is to assign either the census population socio-demographic distribution or the public use microdata sample (PUMS) units to the sample devices within the same geographic area based on the imputed home locations. More advanced socio-demographic imputation methods utilize travel patterns and visited POI types to impute the socio-demographics. These methods require a significant amount of computation, as various features from different databases should be calculated and used. To balance the computations and conduct a timely analysis for the pandemic, the state-of-the-practice method has been used, and socio-demographic information has been assigned to the anonymized devices based on the census socio-demographic distribution of their imputed CBG. Five-year American Community Survey (ACS) estimates for 2014–2018 from the U.S. Census Bureau were used to obtain median income, age distribution, gender distribution, and race distribution for each U.S. CBG ( 37 ). For each device, Monte-Carlo simulation was used to draw from the age, gender, and race distribution at the device’s imputed home CBG ( 38 ). The CBG’s median income was also assigned to the device.
Weighting
The sample data needs to be weighted to represent population-level statistics. First, the devices available in the dataset are a sample of all individuals in the population, so it is necessary to apply device-level weights. Second, for an observed device, only a sample of all trips may be recorded, so trip-level weights are also needed. For the sake of timeliness, simple weighting methods have been applied to obtain county-level device weights and state-level trip weights. To obtain device-level weights, the home county has been used, obtained from the imputed home CBG information. The weight for each device is equal to the number of devices observed in the device’s imputed home county divided by the population of the county, so all devices residing in a county would have the same device-level weight. For instance, if the sample includes 100 devices in a county with a population of 2,000, each device would be assigned a weight of 20. The population of each county can be obtained from the U.S. Census Bureau. For trip-level weights, the number of trips per person (trip rate) has been calculated for each state during an average weekday in the first 2 weeks of February from the sample. This trip rate number has also been calculated for each state from NHTS 2017. A single trip rate for all trips generated from each state has been used, equal to the NHTS trip rate divided by the observed trip rate during the pre-pandemic period.
Mobility Metrics
After going through all the aforementioned steps, the research team summarized the weighted trips with the additional imputed information into several core mobility metrics that are critical for a better understanding of the national mobility pattern before and during the pandemic. Table 1 shows the list of metrics available on the platform at the national, state, and county levels, along with a brief description of each metric. In addition to the basic mobility metrics provided in the platform, the research team proposed a score-based social distancing index (SDI) that integrates various aspects of mobility measures into one single index that shows the extent of social distancing practices based on the mobility measures. The index was calculated based on five basic mobility metrics (e.g., percentage of residents staying home, work trip rate, non-work trip rate, miles traveled, and percentage of out-of-county trips) compared with the benchmark values. Benchmark values are also computed based on the weekdays’ measures of the aforementioned five mobility metrics in the first 2 weeks of February 2020. The more detailed information concerning the development of this index and its efficacy to help policymakers and researchers can be found in another paper by the authors ( 39 ).
Table 1.
List of Mobility Metrics Available on the COVID-19 Impact Analysis Platform
| Current metrics | Description |
|---|---|
| Social distancing index (SDI) | An integer from 0–100 that represents the extent residents and visitors are practicing social distancing. “0” indicates no social distancing is observed in the community, while “100” indicates all residents are staying at home and no visitors are entering the county. It is computed by this equation: |
| % staying home | Percentage of residents staying at home (i.e., no trips more than 1 mi away from home) |
| Trips/person | Average number of trips taken per person |
| % out-of-county trips | The percent of all trips taken that travel out of a county. (Additional information on the origins and destinations of these trips at the county-to-county level is available, but not currently shown on the platform.) |
| % out-of-state trips | The percent of all trips taken that travel out of a state. (Additional information on the origins and destinations of these trips at the state-to-state level is available, but not currently shown on the platform.) |
| Miles traveled/person | Average person-miles traveled on all modes per person per day (car, train, bus, plane, bike, walk, etc.) |
| #work trips/person | Number of work trips per person (where a “work trip” is defined as going to or coming home from work) |
| #non-work trips/person | Number of non-work trips per person. (e.g., grocery, restaurant, park) |
| Transit mode share | Percentage of rail and bus transit mode share for the baseline scenario based on American Community Survey (ACS) data |
Platform Overview
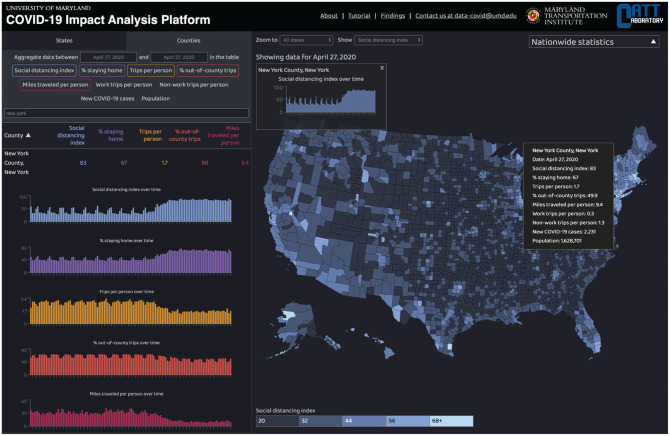
The COVID-19 Impact Analysis Platform (available at data.covid.umd.edu) provides data and insights on COVID-19’s impact, with daily data updates. The research team is exploring how social distancing and stay-at-home orders are affecting travel behavior, the spread of the coronavirus, and local economies. Through this interactive analytics platform, the authors are making thier data and research findings available to other researchers, agencies, non-profits, media, and the general public. The platform has evolved and expanded over time as new data and impact metrics are computed and additional visualizations are developed. Figure 11 illustrates the platform. In addition to the mobility metrics, the platform provides information on other aspects of importance to the pandemic analysis, including COVID and health, economic impact, and vulnerable population, which are not in the scope of this paper.
Figure 11.
Platform illustration.
As shown in Figure 11, users can select the level of analysis they are interested in by choosing either the “States” or “Counties” tab on the platform. For the national level trend and data, the “Show National Statistics” button has been created that summarizes the national data and trend. The time range option facilitates the ease of data inquiry and visualization for a specific time of study. By selecting the desired time range, the platform converts all the mobility metrics to their average values for the specified time. Two of the mobility metrics—for example, social distancing index and % staying home—are presented on the default first page of the platform. For the additional mobility metrics of interest, users can select from the drop-down menu of the mobility and social distancing sector.
Besides the interactive data table presented on the left side of the platform, a national map of the U.S. is depicted on the right side to portray the spatial and temporal trend of all the metrics available in the platform. The platform enables the zoom option to investigate the trend of the selected metrics either at the national level or for a specific state or county. By selecting the time range, the platform provides the animation of the temporal trend using the play button underneath the map along with a date slider.
Discussion
Since the outbreak of the novel coronavirus disease (COVID-19), non-pharmaceutical interventions and mobility restrictions were among the most important mitigation strategies across the world. In this study, the team developed an analytical framework to measure and monitor the mobility patterns of the communities in the U.S. The mobility metrics provided on the platform can be used to track the travel trends to help regions understand factors shaping this pandemic and prepare the decision-makers and public for what might be happening “down the road.” For instance, analysis based on the platform data has quantified the effectiveness of the stay-at-home order, and also reveals that the out-of-county human mobility inflow shows an increasingly strong correlation with the number of COVID-19 infections ( 40 , 41 ). Therefore, the out-of-county and out-of-state trips provided in the platform can alert lawmakers and decision-makers to take precautions on potential outbreaks. Furthermore, the empirical analysis based on the proposed social distancing index (SDI) on the platform, revealed the relationship between the extent people are practicing social distancing and the spread of the COVID-19 virus ( 39 ). It is also worth noting that such metrics can all be provided based on other customized zoning systems, as long as the population size of the regions is sufficient to ensure that the privacy of anonymized mobile device users is protected.
In future research, from the methodological point of view, additional efforts in improving the weighting method based on the imputed socio-demographic information are worth investigating. Further validation and calibration also can be conducted to build more confidence in the mobility pattern products derived from the mobile device location data. Furthermore, as an additional application, the platform can also release the POI-level visits to provide finer-level human mobility patterns to inform the general public and decision-makers about the risks of visiting certain places or POIs. Related research has shown that restricting the maximum occupancy at a small minority of “superspreader” POIs is more effective than uniformly reducing mobility ( 42 ).
Conclusion
The integrated dataset compiled by the research team shows how the nation and different states and counties are affected by COVID-19 and how the communities are conforming with the social distancing and stay-at-home orders issued to prevent the spread of the virus. The platform utilizes privacy-protected anonymized mobile device location data integrated with healthcare system data and population data to assign a social distancing score to each state and county based on derived information such as percentage of people who are staying home, average number of trips per person, and average distance traveled by each person. As the next step, the research team is integrating socio-demographic and economic data into the platform to study the multifaceted impact of COVID-19 on mobility, health, economy, and society.
Acknowledgments
The authors would like to thank and acknowledge their partners and data sources in this effort: 1) Amazon Web Service and its Senior Solutions Architect, Jianjun Xu, for providing cloud computing and technical support; 2) computational algorithms developed and validated in a previous U.S. DOT Federal Highway Administration’s Exploratory Advanced Research Program project; 3) mobile device location data provider partners.
Footnotes
Author Contributions: The authors confirm contribution to the paper as follows: study conception and design: L. Zhang, A. Darzi, M. Pack, S. Ghader; data collection: L. Zhang, A. Darzi, S. Ghader; analysis and interpretation of results: L. Zhang, A. Darzi, S. Ghader, C. Xiong, M. Yang, Q. Sun, A. Kabiri, S. Hu; draft manuscript preparation: L. Zhang, A. Darzi, S. Ghader. All authors reviewed the results and approved the final version of the manuscript.
The author(s) declared no potential conflicts of interest with respect to the research, authorship, and/or publication of this article.
Funding: The author(s) disclosed receipt of the following financial support for the research, authorship, and/or publication of this article: partial financial support from U.S. DOT’s Bureau of Transportation Statistics and the National Science Foundation’s RAPID Program.
ORCID iDs: Lei Zhang  https://orcid.org/0000-0002-3372-6321
Aref Darzi  https://orcid.org/0000-0003-2558-5570
Sepehr Ghader  https://orcid.org/0000-0003-1938-7914
Chenfeng Xiong  https://orcid.org/0000-0003-4237-1750
Mofeng Yang  https://orcid.org/0000-0002-0525-7978
Qianqian Sun  https://orcid.org/0000-0003-3684-4603
Songhua Hu  https://orcid.org/0000-0002-0731-3080
Data Availability: All the aggregated metrics used on the platform are available to the general public on data.covid.umd.edu. Access to the anonymized location data is restricted to the Maryland Transportation Institute. Census population data is available at https://www.census.gov.
References
- 1.Stopher P., Clifford E., Zhang J., FitzGerald C.Deducing Mode and Purpose From GPS Data. Institute of Transport and Logistics Studies, 2008, pp. 1–13. [Google Scholar]
- 2.Bachir D., Khodabandelou G., Gauthier V., El Yacoubi M., Puchinger J.Inferring Dynamic Origin-Destination Flows by Transport Mode Using Mobile Phone Data. Transportation Research Part C: Emerging Technologies, Vol. 101, 2019, pp. 254–275. [Google Scholar]
- 3.Huang Z., Ling X., Wang P., Zhang F., Mao Y., Lin T., Wang F. Y.Modeling Real-Time Human Mobility Based on Mobile Phone and Transportation Data Fusion. Transportation Research Part C: Emerging Technologies, Vol. 96, 2018, pp. 251–269. [Google Scholar]
- 4.Cui Y., Meng C., He Q., Gao J.Forecasting Current and Next Trip Purpose with Social Media Data and Google Places. Transportation Research Part C: Emerging Technologies, Vol. 97, 2018, pp. 159–174. [Google Scholar]
- 5.Pappalardo L., Simini F., Rinzivillo S., Pedreschi D., Giannotti F., Barabási A-L.Returners and Explorers Dichotomy in Human Mobility. Nature Communications, Vol. 6, 2015, p. 8166. [DOI] [PMC free article] [PubMed] [Google Scholar]
- 6.Song C., Koren T., Wang P., Barabási A-L.Modelling the Scaling Properties of Human Mobility. Nature Physics, Vol. 6, No. 10, 2010, p. 818. [Google Scholar]
- 7.Çolak S., Lima A., González M. C.Understanding Congested Travel in Urban Areas. Nature Communications, Vol. 7, 2016, p. 10793. [DOI] [PMC free article] [PubMed] [Google Scholar]
- 8.Nyhan M., Kloog I., Britter R., Ratti C., Koutrakis P.Quantifying Population Exposure to Air Pollution Using Individual Mobility Patterns Inferred from Mobile Phone Data. Journal of Exposure Science & Environmental Epidemiology, Vol. 29, No. 2, 2019, p. 238. [DOI] [PubMed] [Google Scholar]
- 9.Bao J., Lian D., Zhang F., Yuan N. J.Geo-Social Media Data Analytic for User Modeling and Location-Based Services. SIGSPATIAL Special, Vol. 7, No. 3, 2016, pp. 11–18. [Google Scholar]
- 10.Liu Q., Wu S., Wang L., Tan T.Predicting the Next Location: A Recurrent Model with Spatial and Temporal Contexts. Proc., 13th AAAI Conference on Artificial Intelligence, Portland, OR, 2016. [Google Scholar]
- 11.Riederer C. J., Zimmeck S., Phanord C., Chaintreau A., Bellovin S. M.I Don’t Have a Photograph, But You Can Have My Footprints: Revealing the Demographics of Location Data. Proc., 2015 ACM on Conference on Online Social Networks, Palo Alto, CA, 2015. [Google Scholar]
- 12.Gu Y., Yao Y., Liu W., Song J.We Know Where You Are: Home Location Identification in Location-Based Social Networks. Proc., 25th International Conference on Computer Communication and Networks, Waikoloa, HI, IEEE, NewYork, NY, 2016. [Google Scholar]
- 13.Liao Y., Lam W., Jameel S., Schockaert S., Xie X.Who Wants to Join Me? Companion Recommendation in Location Based Social Networks. Proc., 2016 ACM International Conference on the Theory of Information Retrieval, Newark, DE, 2016. [Google Scholar]
- 14.Google. See How Your Community is Moving Around Differently Due to COVID-19 2020. https://www.google.com/covid19/mobility/.
- 15.Apple. Mobility Trends Reports 2020. https://www.apple.com/covid19/mobility.
- 16.Cuebiq. COVID-19 Mobility Insights 2020. https://www.cuebiq.com/visitation-insights-covid19/.
- 17.Gao S., Rao J., Kang Y., Liang Y., Kruse J.Mapping County-Level Mobility Pattern Changes in the United States in Response to COVID-19. SIGSpatial Special, Vol. 12, No. 1, 2020, pp. 16–26. [Google Scholar]
- 18.Warren M. S., Skillman S. W.Mobility Changes in Response to COVID-19. arXiv Preprint arXiv: 200314228, 2020. [Google Scholar]
- 19.World Health Organization Writing Group. Nonpharmaceutical Interventions for Pandemic Influenza, International Measures. Emerging Infectious Diseases, Vol. 12, No. 1, 2006, p. 81. [DOI] [PMC free article] [PubMed] [Google Scholar]
- 20.Brownstein J. S., Wolfe C. J., Mandl K. D.Empirical Evidence for the Effect of Airline Travel on Inter-Regional Influenza Spread in the United States. PLoS Medicine, Vol. 3, No. 10, 2006, p. e401. [DOI] [PMC free article] [PubMed] [Google Scholar]
- 21.Bajardi P., Poletto C., Ramasco J. J., Tizzoni M., Colizza V., Vespignani A.Human Mobility Networks, Travel Restrictions, and the Global Spread of 2009 H1N1 pandemic. PloS One, Vol. 6, No. 1, 2011, p. e16591. [DOI] [PMC free article] [PubMed] [Google Scholar]
- 22.Frias-Martinez E., Williamson G., Frias-Martinez V.An Agent-Based Model of Epidemic Spread Using Human Mobility and Social Network Information. Proc., 2011 IEEE Third International Conference on Privacy, Security, Risk and Trust and 2011 IEEE Third International Conference on Social Computing, Boston, MA, 2011. [Google Scholar]
- 23.Kissler S., Tedijanto C., Goldstein E., Grad Y., Lipsitch M.Projecting the Transmission Dynamics of SARS-CoV-2 Through the Post-Pandemic Period. Science, Vol. 368, No. 6493, 2020, pp. 860–868. [DOI] [PMC free article] [PubMed] [Google Scholar]
- 24.Chinazzi M., Davis J. T., Ajelli M., Gioannini C., Litvinova M., Merler S., Piontti A.P. y, et al. The Effect of Travel Restrictions on the Spread of the 2019 Novel Coronavirus (COVID-19) Outbreak. Science, Vol. 368, No. 6489, 2020, pp. 395–400. [DOI] [PMC free article] [PubMed] [Google Scholar]
- 25.Kelso J. K., Milne G. J., Kelly H.Simulation Suggests that Rapid Activation of Social Distancing Can Arrest Epidemic Development Due to a Novel Strain of Influenza. BMC Public Health, Vol. 9, No. 1, 2009, p. 117. [DOI] [PMC free article] [PubMed] [Google Scholar]
- 26.Greenstone M., Nigam V.Does Social Distancing Matter? University of Chicago, Becker Friedman Institute for Economics Working Paper. 2020. (2020-26). https://ssrn.com/abstract=3561244 or 10.2139/ssrn.3561244. [DOI]
- 27.Li D., Lv J., Botwin G., Braun J., Cao W., Li L., McGovern D. P.Estimating the Scale of COVID-19 Epidemic in the United States: Simulations Based on Air Traffic directly from Wuhan, China. medRxiv, 2020. 10.1101/2020.03.06.20031880. [DOI]
- 28.Vaishya R., Javaid M., Khan I. H., Haleem A.Artificial Intelligence (AI) Applications for COVID-19 Pandemic. Diabetes & Metabolic Syndrome: Clinical Research & Reviews, Vol. 14, No. 4, 2020, pp. 337–339. [DOI] [PMC free article] [PubMed] [Google Scholar]
- 29.Bragazzi N. L., Dai H., Damiani G., Behzadifar M., Martini M., Wu J.How Big Data and Artificial Intelligence Can Help Better Manage the COVID-19 Pandemic. International Journal of Environmental Research and Public Health, Vol. 17, No. 9, 2020, p. 3176. [DOI] [PMC free article] [PubMed] [Google Scholar]
- 30.Dong E., Du H., Gardner L.An Interactive Web-Based Dashboard to Track COVID-19 in Real Time. The Lancet Infectious Diseases, Vol. 20, No. 5, 2020, pp. 533–534. [DOI] [PMC free article] [PubMed] [Google Scholar]
- 31.Batini C., Cappiello C., Francalanci C., Maurino A.Methodologies for Data Quality Assessment and Improvement. ACM Computing Surveys (CSUR), Vol. 41, No. 3, 2009, pp. 1–52. [Google Scholar]
- 32.Zhang L., Ghader S., Darzi A., Pan Y., Yang M., Sun Q., Kabiri A., Zhao G.Data Analytics and Modeling Methods for Tracking and Predicting Origin-Destination Travel Trends Based on Mobile Device Data. FHWA-PROJ-17-0020. Federal Highway Administration Exploratory Advanced Research Program, Federal Highway Administration, Washington, D.C., 2020. [Google Scholar]
- 33.Ester M., Kriegel H-P., Sander J., Xu X.A Density-Based Algorithm for Discovering Clusters in Large Spatial Databases with Noise. Kdd, Vol. 96, No. 34, 1996, pp. 226–231. [Google Scholar]
- 34.LeCun Y., Bengio Y., Hinton G.Deep Learning. Nature, Vol. 521, No. 7553, 2015, pp. 436–444. [DOI] [PubMed] [Google Scholar]
- 35.Xiong C., Shahabi M., Zhao J., Yin Y., Zhou X., Zhang L.An Integrated and Personalized Traveler Information and Incentive Scheme for Energy Efficient Mobility Systems. Transportation Research Part C: Emerging Technologies, Vol. 113, 2019, pp. 57–73. [Google Scholar]
- 36.Xiong C., Darzi A., Pan Y., Ghader S., Zhang L.A Data-Driven Analytical Framework of Estimating Multimodal Travel Demand Patterns using Mobile Device Location Data. arXiv Preprint arXiv: 201204776, 2020. [Google Scholar]
- 37.McMaster R. B., Lindberg M., Van Riper D.The National Historical Geographic Information System (NHGIS). Proc., 21st International Cartographic Conference, Durban, 2003. [Google Scholar]
- 38.Hammersley J.Monte Carlo Methods. Springer Science & Business Media, Dordrecht, 2013. [Google Scholar]
- 39.Pan Y., Darzi A., Kabiri A., Zhao G., Luo W., Xiong C., Zhang L.Quantifying Human Mobility Behaviour Changes During the COVID-19 Outbreak in the United States. Scientific Reports, Vol. 10, No. 1, 2020, pp. 1–9. [DOI] [PMC free article] [PubMed] [Google Scholar]
- 40.Xiong C., Hu S., Yang M., Younes H., Luo W., Ghader S S., Zhang L.Mobile Device Location Data Reveal Human Mobility Response to State-Level Stay-at-Home Orders During the COVID-19 Pandemic in the USA. Journal of the Royal Society Interface, Vol. 17, No. 173, 2020, p. 20200344. [DOI] [PMC free article] [PubMed] [Google Scholar]
- 41.Xiong C., Hu S., Yang M., Luo W., Zhang L.Mobile Device Data Reveal the Dynamics in a Positive Relationship Between Human Mobility and COVID-19 Infections. Proceedings of the National Academy of Sciences, Vol. 117, No. 44, 2020, pp. 27087–27089. [DOI] [PMC free article] [PubMed] [Google Scholar]
- 42.Chang S., Pierson E., Koh P. W., Gerardin J., Redbird B., Grusky D., Leskovec J.Mobility Network Models of COVID-19 Explain Inequities and Inform Reopening. Nature, Vol. 589, No. 7840, 2021, pp. 82–87. [DOI] [PubMed] [Google Scholar]


