

Key Points
Question
What are the speed and prevalence of vascular calcification (VC) progression, and how is VC progression associated with the risk of cardiovascular (CV) events and death among patients in China receiving maintenance dialysis?
Findings
In this cohort study of 1489 adult patients receiving maintenance dialysis, progression of total VC was observed in 86.5% of patients. Coronary artery calcification progression was associated with increases in the risk of CV events and death; consistent achievement of serum calcium, phosphorous, and intact parathyroid hormone target levels was associated with a lower risk of coronary artery calcification progression.
Meaning
These findings may be useful for increasing patient awareness and developing appropriate strategies to improve the management of chronic kidney disease–mineral and bone disorder in patients undergoing dialysis.
Abstract
Importance
Baseline findings from the China Dialysis Calcification Study (CDCS) revealed a high prevalence of vascular calcification (VC) among patients with end-stage kidney disease; however, data on VC progression were limited.
Objectives
To understand the progression of VC at different anatomical sites, identify risk factors for VC progression, and assess the association of VC progression with the risk of cardiovascular events and death among patients receiving maintenance dialysis.
Design, Setting, and Participants
This cohort study was a 4-year follow-up assessment of participants in the CDCS, a nationwide multicenter prospective cohort study involving patients aged 18 to 74 years who were undergoing hemodialysis or peritoneal dialysis. Participants were recruited from 24 centers across China between May 1, 2014, and April 30, 2015, and followed up for 4 years. A total of 1489 patients receiving maintenance dialysis were included in the current analysis. Data were analyzed from September 1 to December 31, 2021.
Exposures
Patient demographic characteristics and medical history; high-sensitivity C-reactive protein laboratory values; serum calcium, phosphorus, and intact parathyroid hormone (iPTH) values; and previous or concomitant use of medications.
Main Outcomes and Measures
The primary outcome was progression of VC at 3 different anatomical sites (coronary artery, abdominal aorta, and cardiac valves) and identification of risk factors for VC progression. Participants received assessments of coronary artery calcification (CAC), abdominal aortic calcification (AAC), and cardiac valve calcification (CVC) at baseline, 24 months, 36 months, and 48 months. Secondary outcomes included (1) the association between VC progression and the risk of all-cause death, cardiovascular (CV)–related death, and a composite of all-cause death and nonfatal CV events and (2) the association between achievement of serum calcium, phosphorus, and iPTH target levels and the risk of VC progression.
Results
Among 1489 patients, the median (IQR) age was 51.0 (41.0-60.0) years; 59.5% of patients were male. By the end of 4-year follow-up, progression of total VC was observed in 86.5% of patients; 69.6% of patients had CAC progression, 72.4% had AAC progression, and 33.4% had CVC progression. Common risk factors for VC progression at the 3 different anatomical sites were older age and higher fibroblast growth factor 23 levels. Progression of CAC was associated with a higher risk of all-cause death (model 1 [adjusted for age, sex, and body mass index]: hazard ratio [HR], 1.97 [95% CI, 1.16-3.33]; model 2 [adjusted for all factors in model 1 plus smoking status, history of diabetes, and mean arterial pressure]: HR, 1.89 [95% CI, 1.11-3.21]; model 3 [adjusted for all factors in model 2 plus calcium, phosphorus, intact parathyroid hormone, and fibroblast growth factor 23 levels and calcium-based phosphate binder use]: HR, 1.92 [95% CI, 1.11-3.31]) and the composite of all-cause death and nonfatal CV events (model 1: HR, 1.98 [95% CI, 1.19-3.31]; model 2: HR, 1.91 [95% CI, 1.14-3.21]; model 3: HR, 1.95 [95% CI, 1.14-3.33]) after adjusting for all confounding factors except the presence of baseline calcification. Among the 3 targets of calcium, phosphorus, and iPTH, patients who achieved no target levels (model 1: odds ratio [OR], 4.75 [95% CI, 2.65-8.52]; model 2: OR, 4.81 [95% CI, 2.67-8.66]; model 3 [for this analysis, adjusted for all factors in model 2 plus fibroblast growth factor 23 level and calcium-based phosphate binder use]: OR, 2.76 [95% CI, 1.48-5.16]), 1 target level (model 1: OR, 3.71 [95% CI, 2.35-5.88]; model 2: OR, 3.62 [95% CI, 2.26-5.78]; model 3: OR, 2.19 [95% CI, 1.33-3.61]), or 2 target levels (model 1: OR, 2.73 [95% CI, 1.74-4.26]; model 2: OR, 2.69 [95% CI, 1.71-4.25]; model 3: OR, 1.72 [95% CI, 1.06-2.79]) had higher odds of CAC progression compared with patients who achieved all 3 target levels.
Conclusions and Relevance
In this study, VC progressed rapidly in patients undergoing dialysis, with different VC types associated with different rates of prevalence and progression. Consistent achievement of serum calcium, phosphorus, and iPTH target levels was associated with a lower risk of CAC progression. These results may be useful for increasing patient awareness and developing appropriate strategies to improve the management of chronic kidney disease–mineral and bone disorder among patients undergoing dialysis.
This cohort study evaluates the progression of vascular calcification at different anatomical sites, identifies risk factors for vascular progression, and assesses the association of vascular progression with the risk of cardiovascular events and death among Chinese patients receiving maintenance dialysis.
Introduction
Cardiovascular (CV) diseases are the major cause of morbidity and mortality in patients with chronic kidney disease (CKD), with 20 to 40 times greater risk in patients undergoing dialysis.1,2 Vascular calcification (VC), either in the coronary arteries or the aorta, is a major factor associated with CV disease in patients with CKD.3,4,5,6 The Kidney Disease Improving Global Outcomes (KDIGO) 2017 guideline suggests that patients with CKD glomerular filtration rate categories 3a to 5D with known vascular or valvular calcification are at the highest risk for CV events.7,8
The baseline findings of the China Dialysis Calcification Study (CDCS) revealed a high prevalence of VC with coronary artery calcification (CAC) to be most common among patients undergoing dialysis.9 However, the results of that study led to several questions that may be considered avenues for future research. First, optimal disease management currently remains uncertain for patients undergoing dialysis who are at highest CV risk. Second, CV calcification progression among these patients is unknown, and how this progression is associated with clinical outcomes remains unanswered.
The KDIGO 2017 guideline suggests the use of lateral abdominal radiography to detect the presence of abdominal aortic calcification (AAC) and echocardiography to detect cardiac valve calcification (CVC) as reasonable alternatives to computed tomography (CT)–based imaging for CAC.7 The guideline does not recommend the use of coronary CT, largely due to economic and operational considerations. Therefore, it is not clear whether the 3 assessments of VC are equivalent in estimating clinical outcomes.
The present study was designed to evaluate VC progression, identify risk factors for VC progression, and assess the association of VC progression at different anatomical sites with clinical outcomes in patients receiving maintenance dialysis over 4 years of follow-up and to explore the feasibility of slowing calcification progression and improving clinical outcomes through disease management. Findings of this study may provide insights into the management of chronic kidney disease–mineral and bone disorder (CKD-MBD) in patients undergoing dialysis.
Methods
Study Design and Participants
The present cohort study was a 4-year follow-up assessment of participants in the CDCS,9,10 which involved patients with end-stage kidney disease in China. Briefly, the CDCS was a nationwide multicenter prospective cohort study with 24-month follow-up that was extended to 48-month follow-up. Patients with end-stage kidney disease aged 18 to 74 years who received stable hemodialysis or peritoneal dialysis for 6 months or more were enrolled across 24 centers in China from May 1, 2014, to April 30, 2015. The current study assessed calcification at 3 different anatomical sites (coronary artery, abdominal aorta, and cardiac valves). Study participants received assessments of CAC, AAC, and CVC at baseline and during 3 follow-up visits at 24 months, 36 months, and 48 months. The method of calcification measurement is described briefly in eMethods in Supplement 1.10 Statistical analysis was performed from September 1 to December 31, 2021. This study was conducted in accordance with the principles of Good Epidemiological Practice11 and the provisions of the Declaration of Helsinki.12 The institutional review boards or ethics committees at each study center approved both the CDCS and this cohort study. All participants provided written informed consent, including consent for follow-up assessments. The study followed the Strengthening the Reporting of Observational Studies Epidemiology (STROBE) guideline for cohort studies.
Definitions of VC Calcification and Progression of Calcification
Total VC was defined as calcification present in any 1 of the 3 measurements (CAC score >0, AAC score >0, and/or CVC detected in 1 or 2 valves). Progression of calcification from baseline was assessed at 24 months, 36 months, and 48 months during the follow-up period. Common approaches to assessing progression have been previously established.13,14 In this study, CAC progression was calculated as the square root of the change in the number of CACs between baseline and follow-up that were greater than 2.5 (based on the Hokanson criterion15), AAC progression was calculated as the absolute change in the number of AACs between baseline and follow-up that were greater than 0, and CVC progression was calculated as the absolute change in the number of CVCs between baseline and follow-up that were greater than 0. Progression of CVC was only evaluated in patients with no valve calcification or single valve calcification at baseline.
Clinical Outcomes
Clinical outcomes included time to the occurrence of all-cause death, CV- related death, and the composite of all-cause death and nonfatal CV events. All events were collected every 6 months during the first 24 months of follow-up and every 12 months during the last 24 months of follow-up.
Risk Factors and Covariates of Interest
All risk factors and covariates were selected based on literature reviews and clinical knowledge.13,16 Patient baseline demographic and clinical characteristics, including age, sex, body mass index (BMI; calculated as weight in kilograms divided by height in meters squared), systolic blood pressure, diastolic blood pressure, mean arterial pressure (MAP), smoking status (never vs former or current), dialysis modality (hemodialysis vs peritoneal dialysis), length of time receiving dialysis, medical history of diabetes (yes vs no), and high-sensitivity C-reactive protein (hs-CRP) laboratory values, were collected.10 Data on race and ethnicity categories were not collected because all participants were Chinese (ie, of Asian race).
The time-averaged laboratory values for total calcium, phosphorus, intact parathyroid hormone (iPTH), fibroblast growth factor 23 (FGF-23), and 25-hydroxyvitamin D were calculated by the area under the curve for each patient using the trapezoidal rule; these values were then standardized by the time between initial and final measurements, which is a general and convenient method that has been established to analyze serial measurements obtained at unequal intervals.17 The values of hs-CRP and FGF-23 were log transformed. Data on previous or concomitant use of medications, including calcium-based phosphate binders (CPBs), non-CPBs, and calcimimetics, were also collected.
Statistical Analysis
All patients who met eligibility criteria and had at least 1 of the 3 calcification measurements at baseline were included in the analysis. The prevalence of calcification and the proportions of calcification progression (with Clopper-Pearson 95% CIs) for CAC, AAC, CVC, and total VC were calculated and stratified by dialysis modality. Cochran-Armitage trend tests were performed to test for trends over the study period.
Odds ratios (ORs) with 95% CIs were calculated to evaluate the association of risk factors with the progression of each type of calcification (CAC, AAC, and CVC). Multivariable analyses were conducted using generalized estimating equation models with a binominal distribution and a logit link to account for the association of repeated binary outcomes (with vs without progression of calcification). The same method was also used to estimate the association of target achievement with the progression of calcification. Target achievement levels based on time-averaged laboratory values were defined as 8.40 to 10.00 mg/dL for total calcium (to convert milligrams per deciliter to millimoles per liter, multiply by 0.25), 2.69 to 4.49 mg/dL for phosphorus (to convert milligrams per deciliter to millimoles per liter, multiply by 0.323), and 150 to 600 pg/mL for iPTH. These values were then classified into 4 categories: (1) values that achieved none of the 3 target levels, (2) values that achieved any 1 of the 3 target levels, (3) values that achieved any 2 of the 3 target levels, and (4) values that achieved all of the 3 target levels.
Cox proportional hazards models with time-dependent covariates were used to estimate the association between progression of calcification and the occurrence of clinical outcomes (from month 24 to study end) and presented using hazard ratios (HRs) with 95% CIs. The progression of calcification and laboratory data for calcium, phosphorus, iPTH, and FGF-23 levels were included as time-dependent covariates. The Schoenfeld residuals approach and supremum tests were conducted to verify the assumption of proportional hazards.
All statistical analyses were performed using the SAS Enterprise Guide 8.3, version 9.4 (SAS Institute, Inc). Statistical significance was set at 2-sided P = .05.
Results
Participant Characteristics
Of 1522 patients screened, 1493 patients were enrolled in the study, and 1489 patients were included in this analysis (eFigure in Supplement 1). Among those included in the analysis, the median (IQR) age was 51.0 (41.0-60.0) years; 886 patients (59.5%) were men, and 603 (40.5%) were women. A total of 1168 patients (78.4%) received hemodialysis and 321 (21.6%) received peritoneal dialysis. The median (IQR) follow-up time was 3.9 (2.9-4.1) years for all patients, 3.9 (2.9-4.1) years for patients receiving hemodialysis, and 3.9 (2.9-4.0) years for patients receiving peritoneal dialysis. A history of diabetes was observed in 302 patients (20.3%), and the median (IQR) length of time receiving dialysis was 3.7 (2.0-6.1) years. A summary of patient demographic and clinical characteristics is provided in Table 1.
Table 1. Baseline Participant Characteristics.
| Characteristic | Participants, No. (%) | P value | ||
|---|---|---|---|---|
| Overall (N = 1489) | Hemodialysis (n = 1168) | Peritoneal dialysis (n = 321) | ||
| Follow-up time, median (IQR), y | 3.9 (2.9-4.1) | 3.9 (2.9-4.1) | 3.9 (2.9-4.0) | .38 |
| Length of time receiving dialysis, median (IQR), y | 3.7 (2.0-6.1) | 3.9 (2.0-6.6) | 3.1 (1.9-4.7) | <.001 |
| Age, median (IQR), y | 51.0 (41.0-60.0) | 52.0 (43.0-61.0) | 47.0 (37.0-57.0) | <.001 |
| Sex | ||||
| Male | 886 (59.5) | 724 (62.0) | 162 (50.5) | <.001 |
| Female | 603 (40.5) | 444 (38.0) | 159 (49.5) | |
| BMI, median (IQR) | 22.1 (19.9-24.4) | 22.2 (19.9-24.7) | 21.7 (19.9-23.7) | .001 |
| MAP, median (IQR), mm Hg | 102.7 (93.7-111.7) | 101.7 (93.0-110.0) | 106.7 (97.7-117.0) | <.001 |
| Smoking status | ||||
| Never | 1055 (70.9) | 804 (68.8) | 251 (78.2) | <.001 |
| Former or current | 434 (29.1) | 364 (31.2) | 70 (21.8) | |
| History of diabetes | 302 (20.3) | 256 (21.9) | 46 (14.3) | .003 |
| Laboratory values | ||||
| hs-CRP at baseline, median (IQR), μg/mL | 2.4 (0.9-5.9) | 2.7 (1.0-6.0) | 1.7 (0.7-4.2) | <.001 |
| Time-averaged serum calcium level, mg/dL | ||||
| <8.40 | 180 (12.1) | 146 (12.5) | 34 (10.6) | .49 |
| 8.40-10.00 | 1135 (76.2) | 886 (75.9) | 249 (77.6) | |
| >10.00 | 174 (11.7) | 136 (11.6) | 38 (11.8) | |
| Time-averaged serum phosphorus level, mg/dL | ||||
| ≤4.49 | 254 (17.1) | 168 (14.4) | 86 (26.8) | <.001 |
| >4.49 | 1235 (82.9) | 1000 (85.6) | 235 (73.2) | |
| Time-averaged iPTH level, pg/mL | ||||
| <150 | 240 (16.1) | 187 (16.0) | 53 (16.5) | .48 |
| 150-600 | 889 (59.7) | 707 (60.5) | 182 (56.7) | |
| >600 | 360 (24.2) | 274 (23.5) | 86 (26.8) | |
| Time-averaged FGF-23 level, median (IQR), pg/mL | 17 795.0 (3993.4-46 042.0) | 17 393.0 (4076.6-45 092.0) | 18 891.2 (3503.0-49 957.9) | .79 |
| Time-averaged 25-hydroxyvitamin D level, median (IQR), ng/mL | 16.0 (10.0-25.2) | 19.4 (12.7-28.1) | 8.0 (5.7-11.3) | <.001 |
| Previous or concomitant medication use | ||||
| CPB | 886 (59.5) | 688 (58.9) | 198 (61.7) | .37 |
| Non-CPB | 227 (15.2) | 148 (12.7) | 79 (24.6) | <.001 |
| Calcimimetics | 82 (5.5) | 66 (5.7) | 16 (5.0) | .64 |
Abbreviations: BMI, body mass index (calculated as weight in kilograms divided by height in meters squared); CPB, calcium-based phosphate binder; FGF-23, fibroblast growth factor 23; hs-CRP, high-sensitivity C-reactive protein; iPTH, intact parathyroid hormone; MAP, mean arterial pressure.
SI conversion factors: To convert serum calcium from milligrams per deciliter to millimoles per liter, multiply by 0.25; to convert serum phosphorus from milligrams per deciliter to millimoles per liter, multiply by 0.323.
Progression of Calcification
At the end of 4-year follow-up, the overall prevalence of calcification was 81.0% for CAC, 74.5% for AAC, 45.8% for CVC, and 90.7% for total VC, which represented significant increases from the baseline values of 68.0% for CAC, 46.2% for AAC, 29.0% for CVC, and 77.1% for total VC (P < .001 for trend for all comparisons). Furthermore, patients undergoing hemodialysis vs peritoneal dialysis had a slightly higher prevalence of CAC (83.7% vs 71.1%), AAC (75.6% vs 70.1%), and CVC (46.7% vs 42.0%) (eTable 1 in Supplement 1). Among patients without calcification at baseline, by the end of 4-year follow-up, 42.7% had CAC progression, 57.5% had AAC progression, 33.5% had CVC progression, and 68.5% had total VC progression, which represented an increasing trend over the study period (P < .001 for trend for all comparisons) (eTable 2 in Supplement 1).
The proportions of patients with calcification progression at the end of 4-year follow-up were 69.6% for CAC, 72.4% for AAC, 33.4% for CVC, and 86.5% for total VC, which represented significant upward trends over the study period (P < .001 for trend for all comparisons). The progression of calcification in patients undergoing hemodialysis (72.2% for CAC, 73.0% for AAC, 32.7% for CVC, and 87.6% for total VC) vs peritoneal dialysis (60.0% for CAC, 70.1% for AAC, 36.2% for CVC, and 81.9% for total VC) was similar at the end of the follow-up period (Figure 1; eTable 3 in Supplement 1).
Figure 1. Proportion of Patients With Progression of Calcification During 4-Year Follow-up.
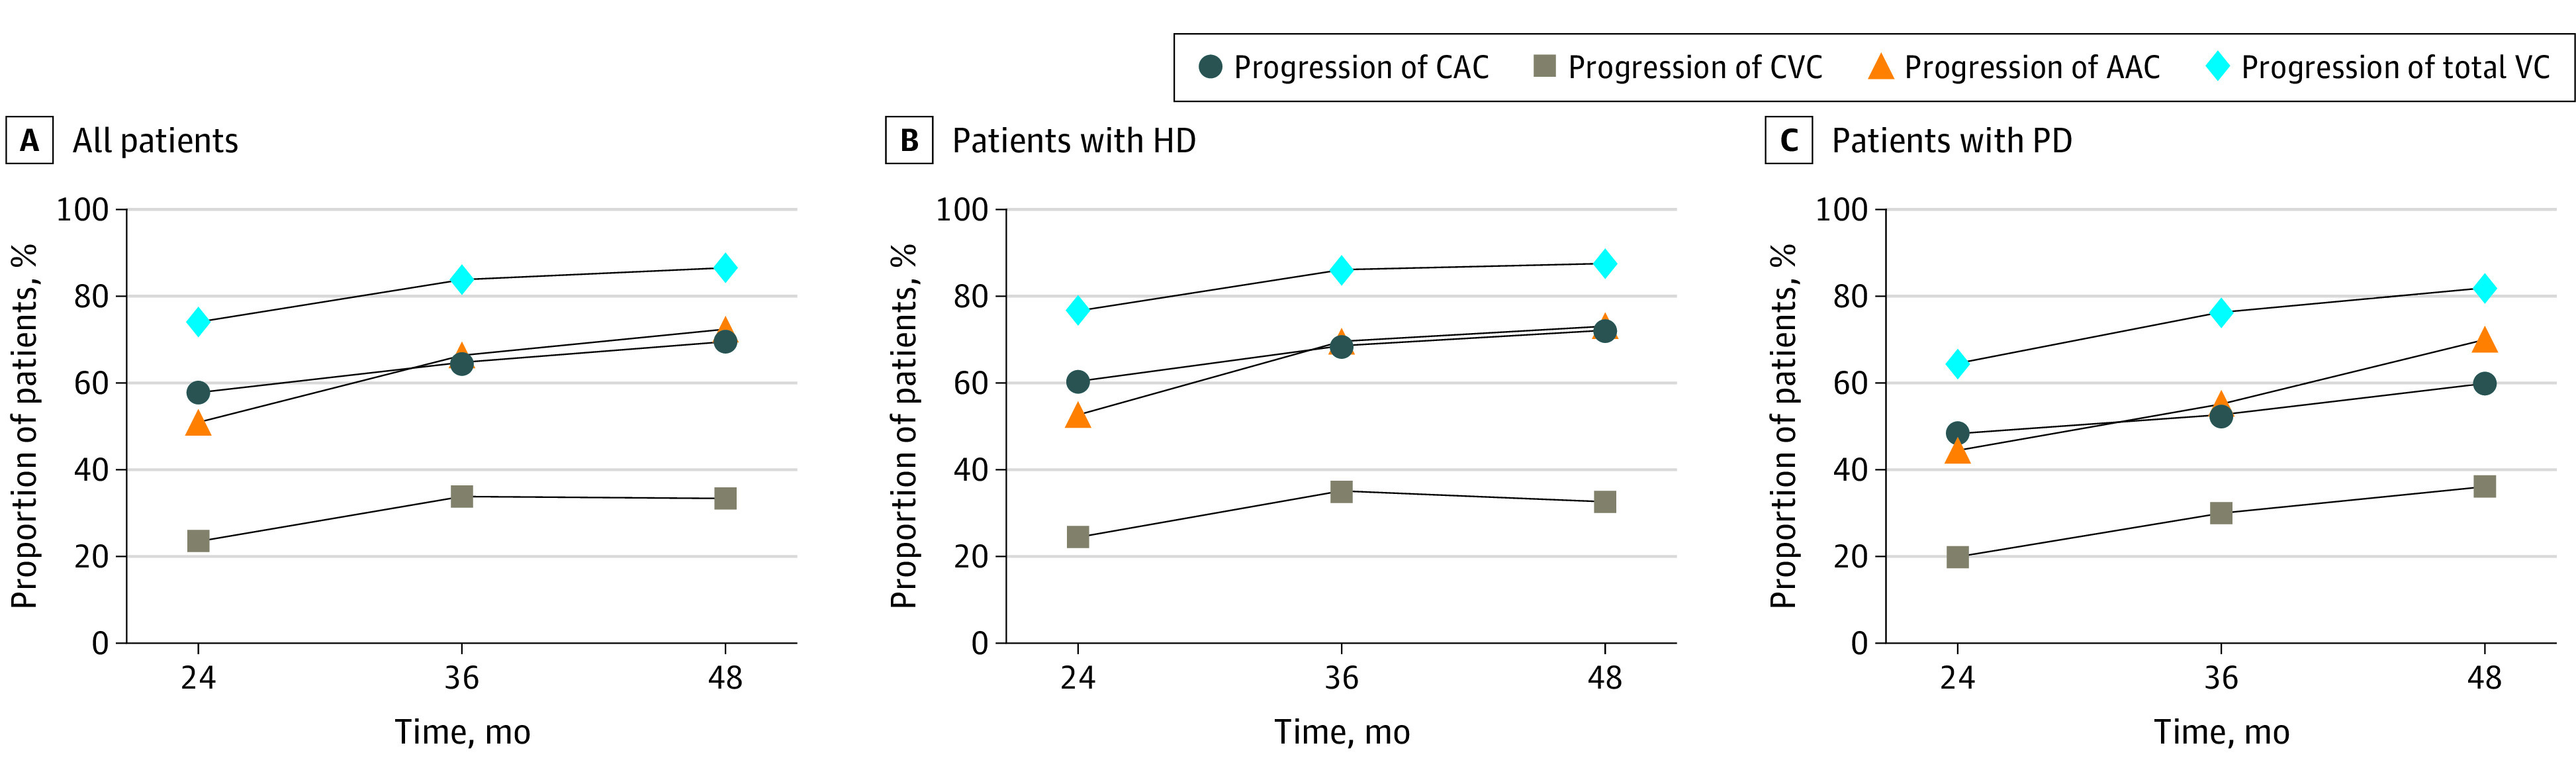
AAC indicates abdominal aortic calcification; CAC, coronary artery calcification; CVC, cardiac valve calcification; HD, hemodialysis; PD, peritoneal dialysis; and VC, vascular calcification.
Risk Factors for Progression of Calcification
The multivariable regression analysis revealed that older age and higher FGF-23 levels were common risk factors for the progression of VC at the 3 different anatomical sites (Table 2). With regard to individual sites, the factors associated with significantly higher odds of CAC progression were BMI, MAP, serum phosphorus level greater than 4.49 mg/dL, iPTH level greater than 600 pg/mL, use of CPBs, and the presence of baseline CAC. The significant risk factors for AAC progression were MAP, former or current smoking, and the presence of baseline AAC. For CVC, baseline hs-CRP level, iPTH level greater than 600 pg/mL, and 25-hydroxyvitamin D level were associated with a significantly greater likelihood of progression.
Table 2. Multivariable Analysis of Factors Associated With Progression of Calcification.
| Factor | Progression of CAC | Progression of AAC | Progression of CVC | |||
|---|---|---|---|---|---|---|
| OR (95% CI) | P value | OR (95% CI) | P value | OR (95% CI) | P value | |
| Dialysis modality (hemodialysis vs peritoneal dialysis) | 1.08 (0.76-1.52) | .67 | 1.11 (0.80-1.55) | .53 | 0.88 (0.62-1.24) | .45 |
| Length of time receiving dialysis per 1 y | 0.93 (0.89-0.97) | .002 | 0.99 (0.96-1.02) | .41 | 0.95 (0.91-1.00) | .04 |
| Age per 10 y | 1.22 (1.07-1.38) | .003 | 1.70 (1.52-1.91) | <.001 | 1.40 (1.25-1.57) | <.001 |
| Sex (male vs female) | 1.00 (0.74-1.36) | >.99 | 0.85 (0.65-1.11) | .24 | 0.92 (0.69-1.23) | .56 |
| BMI per 1 unit | 1.05 (1.01-1.09) | .03 | 1.02 (0.99-1.06) | .18 | 1.00 (0.96-1.03) | .79 |
| MAP per 10 mm Hg | 1.10 (1.01-1.19) | .04 | 1.12 (1.03-1.22) | .006 | 1.02 (0.95-1.11) | .58 |
| Smoking status (former or current vs never) | 1.09 (0.77-1.53) | .63 | 1.59 (1.16-2.19) | .004 | 0.94 (0.68-1.29) | .68 |
| History of diabetes (yes vs no) | 1.22 (0.83-1.78) | .31 | 1.35 (0.93-1.97) | .12 | 1.25 (0.91-1.72) | .16 |
| Laboratory values | ||||||
| Baseline hs-CRP level per log μg/mL | 1.06 (0.95-1.18) | .28 | 1.08 (0.98-1.19) | .14 | 1.15 (1.04-1.27) | .008 |
| Time-averaged serum calcium level, mg/dL | ||||||
| <8.40 vs 8.40-10.00 | 0.76 (0.52-1.11) | .16 | 0.85 (0.59-1.24) | .40 | 1.25 (0.83-1.89) | .29 |
| >10.00 vs 8.40-10.00 | 0.70 (0.46-1.06) | .09 | 1.23 (0.81-1.87) | .32 | 0.72 (0.47-1.09) | .12 |
| Time-averaged serum phosphorus level, mg/dL | ||||||
| >4.49 vs ≤4.49 | 3.11 (2.11-4.60) | <.001 | 1.38 (0.97-1.97) | .07 | 1.39 (0.92-2.08) | .11 |
| Time-averaged iPTH level, pg/mL | ||||||
| <150 vs 150-600 | 0.99 (0.69-1.43) | .97 | 0.84 (0.58-1.20) | .33 | 0.91 (0.63-1.34) | .65 |
| >600 vs 150-600 | 1.90 (1.34-2.68) | <.001 | 1.17 (0.88-1.57) | .28 | 1.38 (1.03-1.85) | .03 |
| Time-averaged FGF-23 level per log pg/mL | 1.13 (1.03-1.23) | .008 | 1.13 (1.04-1.23) | .004 | 1.11 (1.02-1.22) | .02 |
| Time-averaged 25-hydroxyvitamin D level per 10 ng/mL | 1.02 (0.89-1.15) | .81 | 0.89 (0.79-1.01) | .07 | 1.16 (1.03-1.31) | .02 |
| Previous or concomitant medication use | ||||||
| CPB (yes vs no) | 1.33 (1.00-1.76) | .047 | 0.87 (0.68-1.12) | .28 | 0.54 (0.42-0.70) | <.001 |
| Non-CPB (yes vs no) | 0.74 (0.52-1.06) | .10 | 0.88 (0.62-1.25) | .48 | 1.10 (0.76-1.58) | .61 |
| Calcimimetics (yes vs no) | 0.92 (0.51-1.64) | .77 | 1.00 (0.58-1.74) | .99 | 1.16 (0.69-1.94) | .58 |
| Baseline calcificationa | 1.40 (1.31-1.49) | <.001 | 2.25 (1.83-2.77) | <.001 | 0.90 (0.65-1.24) | .51 |
Abbreviations: AAC, abdominal aortic calcification; BMI, body mass index (calculated as weight in kilograms divided by height in meters squared); CAC, coronary artery calcification; CPB, calcium-based phosphate binder; CVC, cardiac valve calcification; FGF-23, fibroblast growth factor 23; hs-CRP, high-sensitivity C-reactive protein; iPTH, intact parathyroid hormone; MAP, mean arterial pressure; OR, odds ratio.
SI conversion factors: To convert serum calcium from milligrams per deciliter to millimoles per liter, multiply by 0.25; to convert serum phosphorus from milligrams per deciliter to millimoles per liter, multiply by 0.323.
For CAC progression, baseline calcification was adjusted as baseline log multiplied by the sum of CAC plus 1. For AAC progression, baseline calcification was adjusted as baseline log multiplied by the sum of AAC plus 1 for AAC progression. For CVC progression, baseline calcification was adjusted by the number of CVCs.
Association of Progression of Calcification With Clinical Outcomes
From 2 years to the end of follow-up, the incidence of all-cause death was 9.1% (51.3 events per 1000 person-years), the incidence of CV-related death was 3.6% (20.5 events per 1000 person-years), and the incidence rate of the composite of all-cause death and nonfatal CV events was 9.6% (54.5 events per 1000 person-years) (eTable 4 in Supplement 1). The multivariable analysis revealed that CAC progression was associated with a significantly increased risk of the occurrence of 2 of the clinical outcomes in models 1 to 3: all-cause death and the composite of all-cause death and nonfatal CV events at 4-year follow-up (Figure 2). However, after adjusting for all factors in model 3 plus baseline calcification scores (model 4), no association was observed between CAC progression and any clinical outcome (eTable 5 in Supplement 1). The progression of AAC and CVC was not associated with any clinical outcome in the multivariable analysis (eTable 5 in Supplement 1).
Figure 2. Multivariable Analysis of the Association Between Progression of Coronary Artery Calcification and Occurrence of Clinical Outcomes.

Model 1 was adjusted for age, sex, and body mass index (calculated as weight in kilograms divided by height in meters squared). Model 2 was adjusted for all factors in model 1 plus smoking status, history of diabetes, and mean arterial pressure. Model 3 was adjusted for all factors in model 2 plus calcium, phosphorus, intact parathyroid hormone, and fibroblast growth factor 23 levels and calcium-based phosphate binder use. CV indicates cardiovascular; HR, hazard ratio.
Association of Target Achievement With Progression of Calcification
In all multivariable models, patients who achieved no target levels (model 1: OR, 4.75 [95% CI, 2.65-8.52; P < .001]; model 2: OR, 4.81 [95% CI, 2.67-8.66; P < .001]; model 3: 2.76 [95% CI, 1.48-5.16; P = .002]; model 4: OR, 2.90 [95% CI, 1.45-5.80; P = .003]), 1 target level (model 1: OR, 3.71 [95% CI, 2.35-5.88; P < .001]; model 2: OR, 3.62 [95% CI, 2.26-5.78; P < .001]; model 3: OR, 2.19 [95% CI, 1.33-3.61; P = .002]; model 4: OR, 2.51 [95% CI, 1.42-4.42; P = .002]), or 2 target levels (model 1: OR, 2.73 [95% CI, 1.74-4.26; P < .001]; model 2, OR, 2.69 [95% CI, 1.71-4.25; P < .001]; model 3: OR, 1.72 [95% CI, 1.06-2.79; P = .03]; model 4: OR, 2.08 [95% CI, 1.19-3.62; P = .01]) were more likely to have CAC progression compared with those who met all 3 calcium, phosphorus, and iPTH target levels. All models revealed that the achievement of no target levels was associated with the highest odds of CAC progression, followed by the achievement of 1 target level and 2 target levels (Figure 3; eTable 6 in Supplement 1). The achievement of no target levels, 1 target level, or 2 target levels also had positive associations with AAC progression and CVC progression but associations were not observed in all multivariable models (eTable 6 in Supplement 1).
Figure 3. Multivariable Analysis of the Association Between Target Achievement and Progression of Coronary Artery Calcification.

Model 1 was adjusted for sex, age, and body mass index (calculated as weight in kilograms divided by height in meters squared). Model 2 was adjusted for all factors in model 1 plus smoking status, history of diabetes, and mean arterial pressure. Model 3 was adjusted for all factors in model 2 plus fibroblast growth factor 23 level and calcium-based phosphate binder use. OR indicates odds ratio.
Discussion
The present cohort study assessed follow-up data from what, to our knowledge, is the first (and longest) large prospective multicenter clinical practice study of Chinese patients undergoing dialysis to date. In this study, measurements of VC calcification were taken continuously from 3 different anatomical sites. The findings of this study revealed that the prevalence of VC at any 1 of the 3 sites increased from 77.1% to 90.7%, whereas the progression of total VC was observed in 86.5% of the patients during the study period. We further identified some common well-established risk factors for the progression of VC, such as older age and higher serum FGF-23 levels. Furthermore, the findings were derived from a young patient population (median age, 51.0 years) with a low prevalence of diabetes (20.3%) who had not been receiving dialysis for a lengthy amount of time (median time receiving dialysis, 3.7 years), which increases the importance of the findings.
The FGF-23 level measures an important hormone regulating phosphorus and vitamin D metabolism, which usually increases before the elevation of blood phosphorus.18 With progression of CKD and elevation of blood phosphorus, FGF-23 levels further increase. As the ability of the kidneys to excrete phosphorus decreases, FGF-23 levels are speculated to increase in patients with CKD as a compensatory response to maintain appropriate phosphate balance.19,20 Because phosphorus metabolism disturbance is an important initiating factor in CKD-MBD, FGF-23 levels roughly reflect the degree of phosphorus metabolism disturbance and even the severity of CKD-MBD. Previous studies21,22 have reported an increase in FGF-23 levels at early stages of CKD. This increase in FGF-23 could be used to accurately identify a patient population with early-stage CKD and normal serum phosphate levels who might benefit from intervention.21 We found FGF-23 levels to be a risk factor for the progression of VC at 3 anatomical sites, which is consistent with the pathophysiological mechanisms of FGF-23 elevation. Interestingly, a previous randomized clinical trial23 showed that cinacalcet therapy did not significantly reduce the risk of death or major CV events. However, treatment with cinacalcet significantly lowered serum FGF-23 levels, and treatment-induced reductions in serum FGF-23 were associated with lower rates of CV-related death and major CV events.23 These findings reflect the important role of FGF-23 in CKD-MBD.
With respect to individual anatomical sites, previous studies24,25,26,27,28 have reported older age,24,28 baseline total iPTH level greater than 9 times the normal value,24 BMI,25 history of diabetes,28 MAP,26 and higher time-averaged serum phosphorus levels27 as independent risk factors for faster CAC progression and death. Our findings are consistent with the results of these studies,24,25,26,27,28 thereby suggesting that age, BMI, MAP, serum phosphorus and iPTH levels, and the presence of baseline CAC may be associated with CAC progression. In addition, the use of CPBs was associated with a higher risk of CAC progression compared with the use of non-CPBs in this study, which is consistent with the findings of previous meta-analyses.29,30
Higher prevalence and progression of AAC have been associated with older age,28 pulse pressure,31 increased serum calcium level,32 and the presence of traditional CV risk factors.28 In the present study, apart from age, significant factors associated with a higher risk of AAC progression were MAP, former or current smoking, FGF-23 levels, and the presence of baseline AAC. Previous studies33,34 have found that elevated serum phosphorus and C-reactive protein levels as well as longer time receiving dialysis and lower albumin levels were associated with de novo CVC in patients undergoing peritoneal dialysis. In addition, elevated iPTH is an independent risk factor for aortic valve and mitral valve calcification. Consistent with previous findings,33,34 our study revealed that older age and higher baseline hs-CRP, iPTH, FGF-23, and 25-hydroxyvitamin D levels were associated with greater odds of CVC progression.
Although the KDIGO 2017 guideline recommends lateral abdominal radiography and echocardiography as reasonable alternatives for CT-based imaging,7 our findings provided evidence that the calcification at 3 sites might be different, with differences between the clinical outcomes at each calcification site. For the 3 types of calcifications, the prevalence of progression in patients undergoing dialysis varied, and the baseline conditions of calcification had differential implications for the association of calcification progression with clinical outcomes (eTable 7 in Supplement 1). Furthermore, with different risk factors identified for progression, the role of baseline conditions in the association between calcification progression and clinical outcomes was different. We speculate that the following reasons may explain these variations. First, the risk of calcification may be different due to the different tissue structure and functions of different anatomical parts. Second, the different evaluation systems for calcification in different sites vary in sensitivity and specificity, resulting in inconsistent occurrence and characteristics of calcification progression in different parts of the body. In particular, the evaluation method for CVC calcification was unable to accurately quantify the occurrence and development of valve calcification (only 0, 1, or 2 valves were distinguished).
As our results revealed, despite the high cost and unsatisfactory operability of CAC evaluation, the presence of CAC was associated with poor clinical outcomes, which is consistent with the results of a recently published study.35 This finding may be related to the special structure and function of coronary arteries or to the relatively precise assessment method for CAC. Hence, we focused on the CAC-related results. When evaluating the association of CAC progression with the clinical outcomes, after sequentially adjusting for multiple factors, models 1 to 3 still revealed associations between CAC progression and higher risks of all-cause death and the composite of all-cause death and nonfatal CV events. However, after adjusting for the presence of baseline calcification, no association between CAC progression and the clinical outcomes was observed, although there was an upward trend. This finding suggests that the presence of baseline CAC may be important for clinical outcomes beyond the progression of CAC. However, the progression of CAC may still have played some role in the clinical outcomes. The number of clinical outcomes in our study was relatively small, and the approximately 2-year follow-up period from CAC progression at month 24 to the occurrence of clinical outcomes or the end of the study was relatively short, which might explain the lack of association between CAC progression and the clinical outcomes. These observations were similar to those of previously published studies.36,37
The treatment guidelines for CKD-MBD emphasize comprehensive management. The achievement of calcium, phosphorus, and iPTH target levels is an important aspect of CKD-MBD treatment. Our results suggest that achievement of the 3 target levels may help slow the progression of CAC, which further supports the findings of a previous study.38 This hypothesis is concordant with results from another study,27 which found that sustaining stable serum phosphorus levels may reduce CAC progression and its associated morbidity and mortality among patients undergoing maintenance hemodialysis and peritoneal dialysis. Thus, keeping serum calcium, phosphorus, and iPTH levels in target ranges may substantially delay the progression of CAC and improve clinical outcomes.
Limitations
This study has limitations. First, it is an observational study, in which unknown confounding factors might not be well controlled and could lead to bias. Second, the study period was extended by 2 years because 2 of the 24 centers withdrew from the study after the initial 24-month observation period, leading to inability to conduct follow-up among patients at those centers. Third, this study was performed among patients who were receiving stable dialysis rather than incident dialysis.
Conclusions
In this cohort study involving 4-year follow-up assessment of CDCS participants, VC progressed rapidly among Chinese patients undergoing dialysis. The risk factors associated with VC progression and their patterns were different for different anatomical sites and were also associated with different clinical outcomes. Progression of CAC was associated with increases in the risk of all-cause death and the composite outcome of all-cause death and nonfatal CV events before adjustment for the presence of baseline CAC. Consistent achievement of serum calcium, phosphorus, and iPTH target levels was associated with a lower risk of CAC progression. These findings suggest that identifying appropriate risk factors for calcification progression at various sites, determining the association of VC with CV events as well as overall and CV-related deaths, and consistently achieving serum calcium, phosphorous, and iPTH target levels are important for delaying VC progression among patients receiving maintenance dialysis. These results may be useful for increasing awareness and developing appropriate strategies to improve CKD-MBD management among patients undergoing dialysis.
eMethods. Eligibility Criteria, Calcification Measurements, and Laboratory Assessments
eFigure. Patient Disposition Flowchart
eTable 1. Prevalence of Calcification at Baseline and During 4-Year Follow-up
eTable 2. Proportions of Patients With Progression of Calcification During 4-Year Follow-up Among Those Without Baseline Calcification
eTable 3. Proportions of Patients With Progression of Calcification During 4-Year Follow-up
eTable 4. Incidence Rates of the Occurrence of Clinical Outcomes
eTable 5. Association of Progression of Calcification With the Occurrence of Clinical Outcomes
eTable 6. Association of Target Achievement With the Progression of Calcification
eTable 7. Association of Baseline Calcification With the Occurrence of Clinical Outcomes
eReferences
Nonauthor Contributors. The China Dialysis Calcification Study Group
Data Sharing Statement
References
- 1.Jankowski J, Floege J, Fliser D, Böhm M, Marx N. Cardiovascular disease in chronic kidney disease: pathophysiological insights and therapeutic options. Circulation. 2021;143(11):1157-1172. doi: 10.1161/CIRCULATIONAHA.120.050686 [DOI] [PMC free article] [PubMed] [Google Scholar]
- 2.Yildiz G, Duman A, Aydin H, et al. Evaluation of association between atherogenic index of plasma and intima-media thickness of the carotid artery for subclinic atherosclerosis in patients on maintenance hemodialysis. Hemodial Int. 2013;17(3):397-405. doi: 10.1111/hdi.12041 [DOI] [PubMed] [Google Scholar]
- 3.Himmelsbach A, Ciliox C, Goettsch C. Cardiovascular calcification in chronic kidney disease—therapeutic opportunities. Toxins (Basel). 2020;12(3):181. doi: 10.3390/toxins12030181 [DOI] [PMC free article] [PubMed] [Google Scholar]
- 4.Liabeuf S, Okazaki H, Desjardins L, et al. Vascular calcification in chronic kidney disease: are biomarkers useful for probing the pathobiology and the health risks of this process in the clinical scenario? Nephrol Dial Transplant. 2014;29(7):1275-1284. doi: 10.1093/ndt/gft368 [DOI] [PubMed] [Google Scholar]
- 5.Chen SC, Huang JC, Su HM, et al. Prognostic cardiovascular markers in chronic kidney disease. Kidney Blood Press Res. 2018;43(4):1388-1407. doi: 10.1159/000492953 [DOI] [PubMed] [Google Scholar]
- 6.Jablonski KL, Chonchol M. Vascular calcification in end-stage renal disease. Hemodial Int. 2013;17(suppl 1):S17-S21. doi: 10.1111/hdi.12084 [DOI] [PMC free article] [PubMed] [Google Scholar]
- 7.Kidney Disease: Improving Global Outcomes (KDIGO) CKD-MBD Update Work Group . KDIGO 2017 clinical practice guideline update for the diagnosis, evaluation, prevention, and treatment of chronic kidney disease–mineral and bone disorder (CKD-MBD). Kidney Int Suppl (2011). 2017;7(1):1-59. doi: 10.1016/j.kisu.2017.04.001 [DOI] [PMC free article] [PubMed] [Google Scholar]
- 8.Liu ZH, Li G, Zhang L, et al. Executive summary: clinical practice guideline of chronic kidney disease–mineral and bone disorder (CKD-MBD) in China. Kidney Dis (Basel). 2019;5(4):197-203. doi: 10.1159/000500053 [DOI] [PMC free article] [PubMed] [Google Scholar]
- 9.Liu ZH, Yu XQ, Yang JW, et al. ; China Dialysis Calcification Study Group . Prevalence and risk factors for vascular calcification in Chinese patients receiving dialysis: baseline results from a prospective cohort study. Curr Med Res Opin. 2018;34(8):1491-1500. doi: 10.1080/03007995.2018.1467886 [DOI] [PubMed] [Google Scholar]
- 10.Liu ZH; China Dialysis Calcification Study (CDCS) Group . Vascular calcification burden of Chinese patients with chronic kidney disease: methodology of a cohort study. BMC Nephrol. 2015;16:129. doi: 10.1186/s12882-015-0132-3 [DOI] [PMC free article] [PubMed] [Google Scholar]
- 11.Hoffmann W, Latza U, Baumeister SE, et al. Guidelines and recommendations for ensuring Good Epidemiological Practice (GEP): a guideline developed by the German Society for Epidemiology. Eur J Epidemiol. 2019;34(3):301-317. doi: 10.1007/s10654-019-00500-x [DOI] [PMC free article] [PubMed] [Google Scholar]
- 12.World Medical Association. World Medical Association Declaration of Helsinki: ethical principles for medical research involving human subjects. JAMA. 2013;310(20):2191-2194. doi: 10.1001/jama.2013.281053 [DOI] [PubMed] [Google Scholar]
- 13.Budoff MJ, Hokanson JE, Nasir K, et al. Progression of coronary artery calcium predicts all-cause mortality. JACC Cardiovasc Imaging. 2010;3(12):1229-1236. doi: 10.1016/j.jcmg.2010.08.018 [DOI] [PubMed] [Google Scholar]
- 14.Yamamoto D, Suzuki S, Ishii H, et al. Predictors of abdominal aortic calcification progression in patients with chronic kidney disease without hemodialysis. Atherosclerosis. 2016;253:15-21. doi: 10.1016/j.atherosclerosis.2016.08.004 [DOI] [PubMed] [Google Scholar]
- 15.Hokanson JE, MacKenzie T, Kinney G, et al. Evaluating changes in coronary artery calcium: an analytic method that accounts for interscan variability. AJR Am J Roentgenol. 2004;182(5):1327-1332. doi: 10.2214/ajr.182.5.1821327 [DOI] [PubMed] [Google Scholar]
- 16.Lehmann N, Erbel R, Mahabadi AA, et al. ; Heinz Nixdorf Recall Study Investigators . Value of progression of coronary artery calcification for risk prediction of coronary and cardiovascular events: result of the HNR study (Heinz Nixdorf Recall). Circulation. 2018;137(7):665-679. doi: 10.1161/CIRCULATIONAHA.116.027034 [DOI] [PMC free article] [PubMed] [Google Scholar]
- 17.Matthews JN, Altman DG, Campbell MJ, Royston P. Analysis of serial measurements in medical research. BMJ. 1990;300(6719):230-235. doi: 10.1136/bmj.300.6719.230 [DOI] [PMC free article] [PubMed] [Google Scholar]
- 18.Isakova T, Wahl P, Vargas GS, et al. Fibroblast growth factor 23 is elevated before parathyroid hormone and phosphate in chronic kidney disease. Kidney Int. 2011;79(12):1370-1378. doi: 10.1038/ki.2011.47 [DOI] [PMC free article] [PubMed] [Google Scholar]
- 19.Heine GH, Seiler S, Fliser D. FGF-23: the rise of a novel cardiovascular risk marker in CKD. Nephrol Dial Transplant. 2012;27(8):3072-3081. doi: 10.1093/ndt/gfs259 [DOI] [PubMed] [Google Scholar]
- 20.Russo D, Battaglia Y. Clinical significance of FGF-23 in patients with CKD. Int J Nephrol. 2011;2011:364890. doi: 10.4061/2011/364890 [DOI] [PMC free article] [PubMed] [Google Scholar]
- 21.Evenepoel P, Meijers B, Viaene L, et al. Fibroblast growth factor-23 in early chronic kidney disease: additional support in favor of a phosphate-centric paradigm for the pathogenesis of secondary hyperparathyroidism. Clin J Am Soc Nephrol. 2010;5(7):1268-1276. doi: 10.2215/CJN.08241109 [DOI] [PMC free article] [PubMed] [Google Scholar]
- 22.Fliser D, Kollerits B, Neyer U, et al. ; MMKD Study Group . Fibroblast growth factor 23 (FGF23) predicts progression of chronic kidney disease: the Mild to Moderate Kidney Disease (MMKD) study. J Am Soc Nephrol. 2007;18(9):2600-2608. doi: 10.1681/ASN.2006080936 [DOI] [PubMed] [Google Scholar]
- 23.Chertow GM, Block GA, Correa-Rotter R, et al. ; EVOLVE Trial Investigators . Effect of cinacalcet on cardiovascular disease in patients undergoing dialysis. N Engl J Med. 2012;367(26):2482-2494. doi: 10.1056/NEJMoa1205624 [DOI] [PubMed] [Google Scholar]
- 24.Malluche HH, Blomquist G, Monier-Faugere MC, Cantor TL, Davenport DL. High parathyroid hormone level and osteoporosis predict progression of coronary artery calcification in patients on dialysis. J Am Soc Nephrol. 2015;26(10):2534-2544. doi: 10.1681/ASN.2014070686 [DOI] [PMC free article] [PubMed] [Google Scholar]
- 25.Jensen JC, Dardari ZA, Blaha MJ, et al. Association of body mass index with coronary artery calcium and subsequent cardiovascular mortality: the Coronary Artery Calcium Consortium. Circ Cardiovasc Imaging. 2020;13(7):e009495. doi: 10.1161/CIRCIMAGING.119.009495 [DOI] [PMC free article] [PubMed] [Google Scholar]
- 26.Jensky NE, Criqui MH, Wright MC, Wassel CL, Brody SA, Allison MA. Blood pressure and vascular calcification. Hypertension. 2010;55(4):990-997. doi: 10.1161/HYPERTENSIONAHA.109.147520 [DOI] [PMC free article] [PubMed] [Google Scholar]
- 27.Shang D, Xie Q, Ge X, et al. Hyperphosphatemia as an independent risk factor for coronary artery calcification progression in peritoneal dialysis patients. BMC Nephrol. 2015;16:107. doi: 10.1186/s12882-015-0103-8 [DOI] [PMC free article] [PubMed] [Google Scholar]
- 28.Onuma OK, Pencina K, Qazi S, et al. Relation of risk factors and abdominal aortic calcium to progression of coronary artery calcium (from the Framingham Heart Study). Am J Cardiol. 2017;119(10):1584-1589. doi: 10.1016/j.amjcard.2017.02.021 [DOI] [PMC free article] [PubMed] [Google Scholar]
- 29.Wang C, Liu X, Zhou Y, et al. New conclusions regarding comparison of sevelamer and calcium-based phosphate binders in coronary-artery calcification for dialysis patients: a meta-analysis of randomized controlled trials. PLoS One. 2015;10(7):e0133938. doi: 10.1371/journal.pone.0133938 [DOI] [PMC free article] [PubMed] [Google Scholar]
- 30.Jamal SA, Vandermeer B, Raggi P, et al. Effect of calcium-based versus non–calcium-based phosphate binders on mortality in patients with chronic kidney disease: an updated systematic review and meta-analysis. Lancet. 2013;382(9900):1268-1277. doi: 10.1016/S0140-6736(13)60897-1 [DOI] [PubMed] [Google Scholar]
- 31.Kraus MA, Kalra PA, Hunter J, Menoyo J, Stankus N. The prevalence of vascular calcification in patients with end-stage renal disease on hemodialysis: a cross-sectional observational study. Ther Adv Chronic Dis. 2015;6(3):84-96. doi: 10.1177/2040622315578654 [DOI] [PMC free article] [PubMed] [Google Scholar]
- 32.Yamada K, Fujimoto S, Nishiura R, et al. Risk factors of the progression of abdominal aortic calcification in patients on chronic haemodialysis. Nephrol Dial Transplant. 2007;22(7):2032-2037. doi: 10.1093/ndt/gfm031 [DOI] [PubMed] [Google Scholar]
- 33.Tian Y, Feng S, Zhan Z, et al. Risk factors for new-onset cardiac valve calcification in patients on maintenance peritoneal dialysis. Cardiorenal Med. 2016;6(2):150-158. doi: 10.1159/000443620 [DOI] [PMC free article] [PubMed] [Google Scholar]
- 34.Avila-Díaz M, Mora-Villalpando C, Prado-Uribe MDC, et al. De novo development of heart valve calcification in incident peritoneal dialysis patients. Arch Med Res. 2013;44(8):638-644. doi: 10.1016/j.arcmed.2013.10.015 [DOI] [PubMed] [Google Scholar]
- 35.Yun HR, Joo YS, Kim HW, et al. ; Korean Cohort Study for Outcomes in Patients With Chronic Kidney Disease (KNOW-CKD) Investigators . Coronary artery calcification score and the progression of chronic kidney disease. J Am Soc Nephrol. 2022;33(8):1590-1601. doi: 10.1681/ASN.2022010080 [DOI] [PMC free article] [PubMed] [Google Scholar]
- 36.Chen J, Budoff MJ, Reilly MP, et al. ; CRIC Investigators . Coronary artery calcification and risk of cardiovascular disease and death among patients with chronic kidney disease. JAMA Cardiol. 2017;2(6):635-643. doi: 10.1001/jamacardio.2017.0363 [DOI] [PMC free article] [PubMed] [Google Scholar]
- 37.Wang XR, Zhang JJ, Xu XX, Wu YG. Prevalence of coronary artery calcification and its association with mortality, cardiovascular events in patients with chronic kidney disease: a systematic review and meta-analysis. Ren Fail. 2019;41(1):244-256. doi: 10.1080/0886022X.2019.1595646 [DOI] [PMC free article] [PubMed] [Google Scholar]
- 38.Danese MD, Belozeroff V, Smirnakis K, Rothman KJ. Consistent control of mineral and bone disorder in incident hemodialysis patients. Clin J Am Soc Nephrol. 2008;3(5):1423-1429. doi: 10.2215/CJN.01060308 [DOI] [PMC free article] [PubMed] [Google Scholar]
Associated Data
This section collects any data citations, data availability statements, or supplementary materials included in this article.
Supplementary Materials
eMethods. Eligibility Criteria, Calcification Measurements, and Laboratory Assessments
eFigure. Patient Disposition Flowchart
eTable 1. Prevalence of Calcification at Baseline and During 4-Year Follow-up
eTable 2. Proportions of Patients With Progression of Calcification During 4-Year Follow-up Among Those Without Baseline Calcification
eTable 3. Proportions of Patients With Progression of Calcification During 4-Year Follow-up
eTable 4. Incidence Rates of the Occurrence of Clinical Outcomes
eTable 5. Association of Progression of Calcification With the Occurrence of Clinical Outcomes
eTable 6. Association of Target Achievement With the Progression of Calcification
eTable 7. Association of Baseline Calcification With the Occurrence of Clinical Outcomes
eReferences
Nonauthor Contributors. The China Dialysis Calcification Study Group
Data Sharing Statement