Abstract
Fiber photometry enables recording of population neuronal calcium dynamics in awake mice. While the popularity of fiber photometry has grown in recent years, it remains unclear whether photometry reflects changes in action potential firing (that is, ‘spiking’) or other changes in neuronal calcium. In microscope-based calcium imaging, optical and analytical approaches can help differentiate somatic from neuropil calcium. However, these approaches cannot be readily applied to fiber photometry. As such, it remains unclear whether the fiber photometry signal reflects changes in somatic calcium, changes in nonsomatic calcium or a combination of the two. Here, using simultaneous in vivo extracellular electrophysiology and fiber photometry, along with in vivo endoscopic one-photon and two-photon calcium imaging, we determined that the striatal fiber photometry does not reflect spiking-related changes in calcium and instead primarily reflects nonsomatic changes in calcium.
To test the relationship between striatal photometry and spiking activity, we expressed GCaMP8f in the dorsomedial striatum (DMS) of 6 wild-type mice (4 males, 2 females) and implanted an array of 32 tungsten microwires surrounding a 200-μm optical fiber for simultaneous collection of photometry and spiking activity (Fig. 1a–c). We recorded mice for 2 h as they pressed a lever to receive a 20-mg food pellet (average trials earned = 47.3 ± 10.7). Both average spiking (n = 140 single units and multiunits from 6 mice, range 12–38 per mouse) and photometry signals (n = 6) increased around the lever press (Fig. 1d). However, while spiking rapidly returned to baseline, the photometry increase persisted for more than 10 s after the lever press (Fig. 1d). We next recorded responses to delivery of sensory stimuli to four of the same mice. First, we delivered air puffs with a duration of ~500 ms at 1- to 3-min intertrial intervals. Both average spiking and photometry signals increased during the air puff. However, while spiking activity rapidly returned to baseline, the photometry increase persisted for ~20 s after the air puff (Fig. 1e). Finally, we delivered foot shocks at 1- to 3-min intertrial intervals (0.7 mA, 500 ms duration). Again, the photometry signal increased rapidly during the foot shock and sustained high levels for ~40 s after the shock (Fig. 1f). In contrast, spiking was inhibited during the foot shock but rebounded to a sustained increase, with a similar timecourse as the photometry signal. The spiking inhibition lasted for ~500 ms longer than the shock itself, demonstrating that it was not caused by a shock-related artifact (Extended Data Fig. 1f).
Fig. 1 |. Photometry and spiking activity show distinct responses to behavioral events.
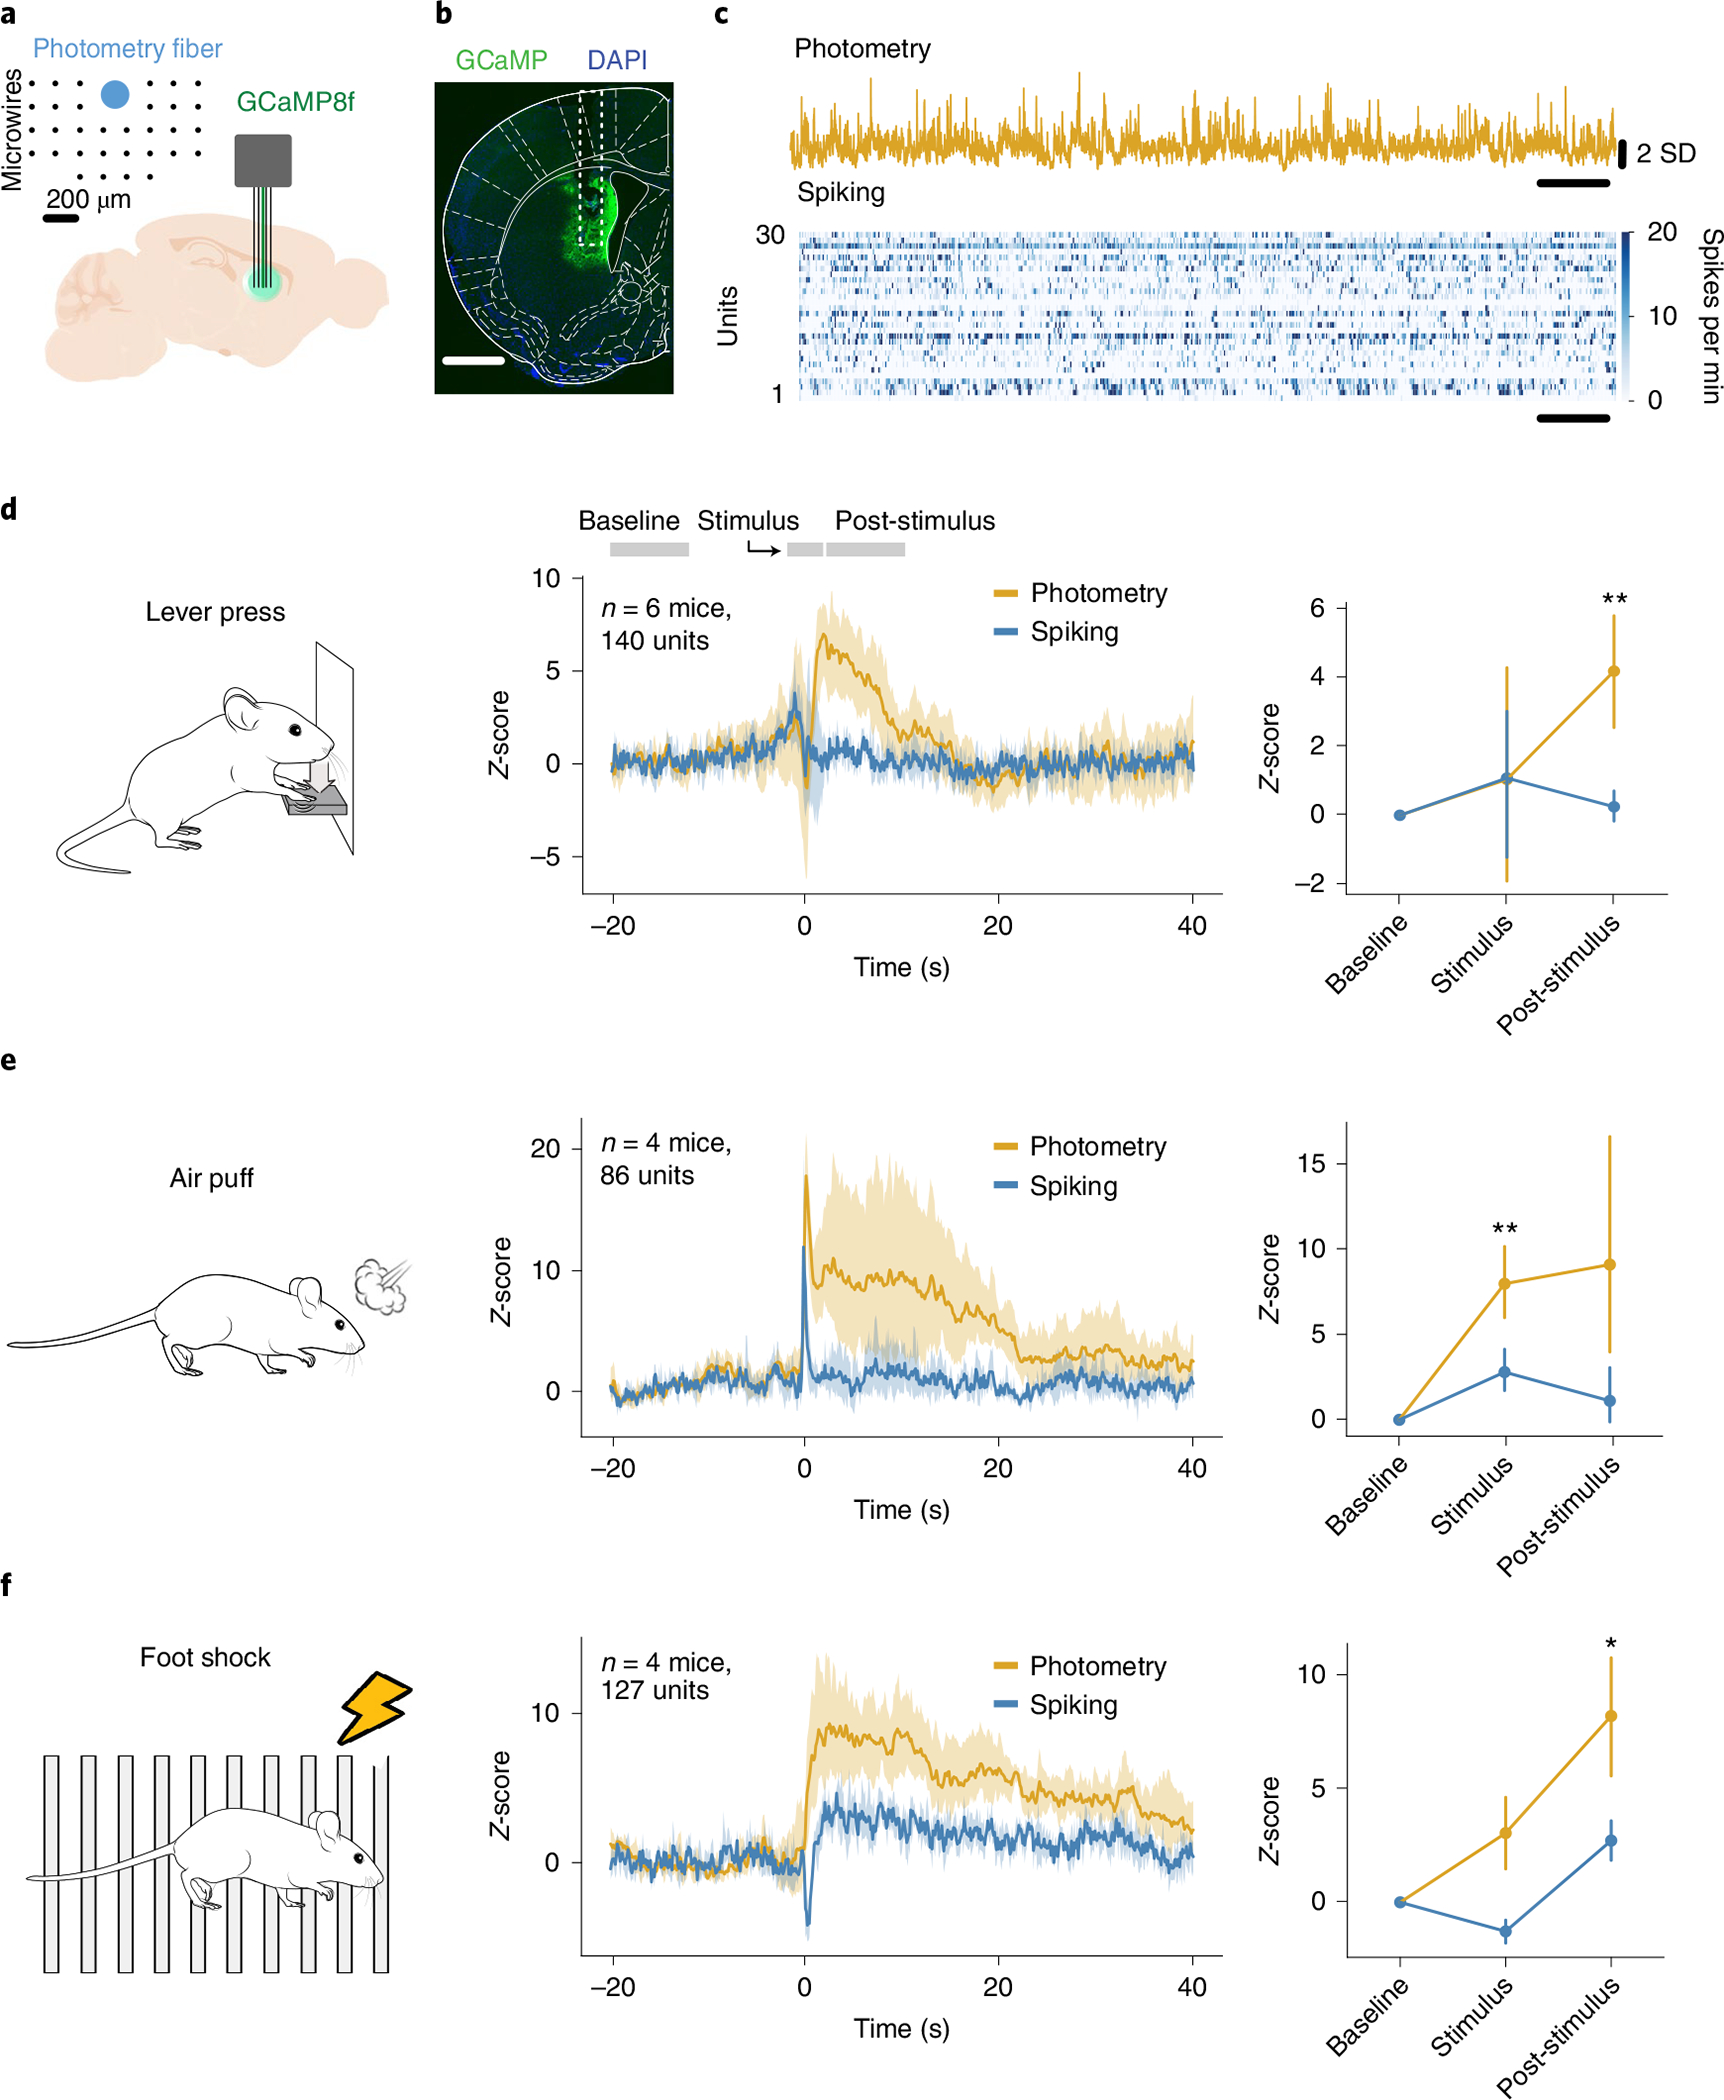
a, Experimental setup: GCaMP8f was injected into the DMS of mice, and an array consisting of 32 microwires with a photometry fiber in the middle was implanted. Inset shows the geometry of the array. b, Representative example of viral injection and optic fiber implant. GCaMP8f expression is in green and DAPI is in blue. Scale bar, 1 mm. c, example of simultaneously collected calcium fiber photometry and spiking data. SD: standard deviation. d, Photometry (yellow) and average spiking (blue) activity around a lever press (n = 6 mice, 140 multiunits and single units). Left: task schematic. Middle: average photometry and spiking response. Right: average response in baseline, stimulus and post-stimulus intervals. Interaction between photometry signal and behavioral period: F = 3.06, P = 0.091. e, Same as d but for air puffs (n = 4 mice, 86 multiunits and single units). Right: Interaction between photometry signal and behavioral period: F = 6.16, P = 0.035. f, Same as d and e for 500 ms foot shocks at 0.7 mA (n = 4 mice, 127 multiunits and single units). Right: Interaction between photometry signal and behavioral period: F = 8.18, P = 0.019. Statistics in d–f, repeated measures ANOVA, with post-hoc two-tailed paired t-tests with Bonferroni corrections. *P < 0.05 and **P < 0.01 after corrections. Shaded regions represent 95% confidence intervals. error bars in d–f are standard deviations.
The time derivative of the photometry signal may better reflect spiking activity than the raw photometry signal1. To test this, we compared average spiking to the derivative of the photometry response around the three behavioral stimuli. Although the time lag to maximum correlation between averages spiking and the photometry derivative was shorter, the cross-correlation strength was lower than for the raw photometry signal (Extended Data Fig. 2). Therefore, the derivative of the photometry signal partially corrects for the kinetics differences between photometry and spiking signals but does not account for all differences between the two signals.
To examine spontaneous correlations between photometry and spiking, we recorded simultaneous spike trains (range 3–41 units per mouse) and photometry signals from seven mice (six from the above experiments) in 1 h sessions without an explicit task. We identified peaks in the photometry signals (transients) and population spiking activity (bursts) (Fig. 2a). Bursts were more frequent than transients (17.3 ± 1.8 bursts per minute, 6.0 ± 2.6 transients per minute, P < 0.001) (Fig. 2b). Despite this, only 33.2 ± 6.9% of the photometry transients occurred within 500 ms of a burst. Conversely, only 11.0 ± 4.0% of spiking bursts occurred within 500 ms of a photometry transient. We quantified the joint overlap between the two signals using the Jaccard Similarity (JS) index, revealing an average JS index of 0.06 ± 0.02 (Fig. 2c), confirming little temporal overlap between bursts and transients. On average, the peak of bursting activity occurred ~200 ms before the photometry transient (Fig. 2d), consistent with the kinetics of spiking versus rises in intracellular calcium2.
Fig. 2 |. Photometry does not reflect spontaneous changes in spiking.
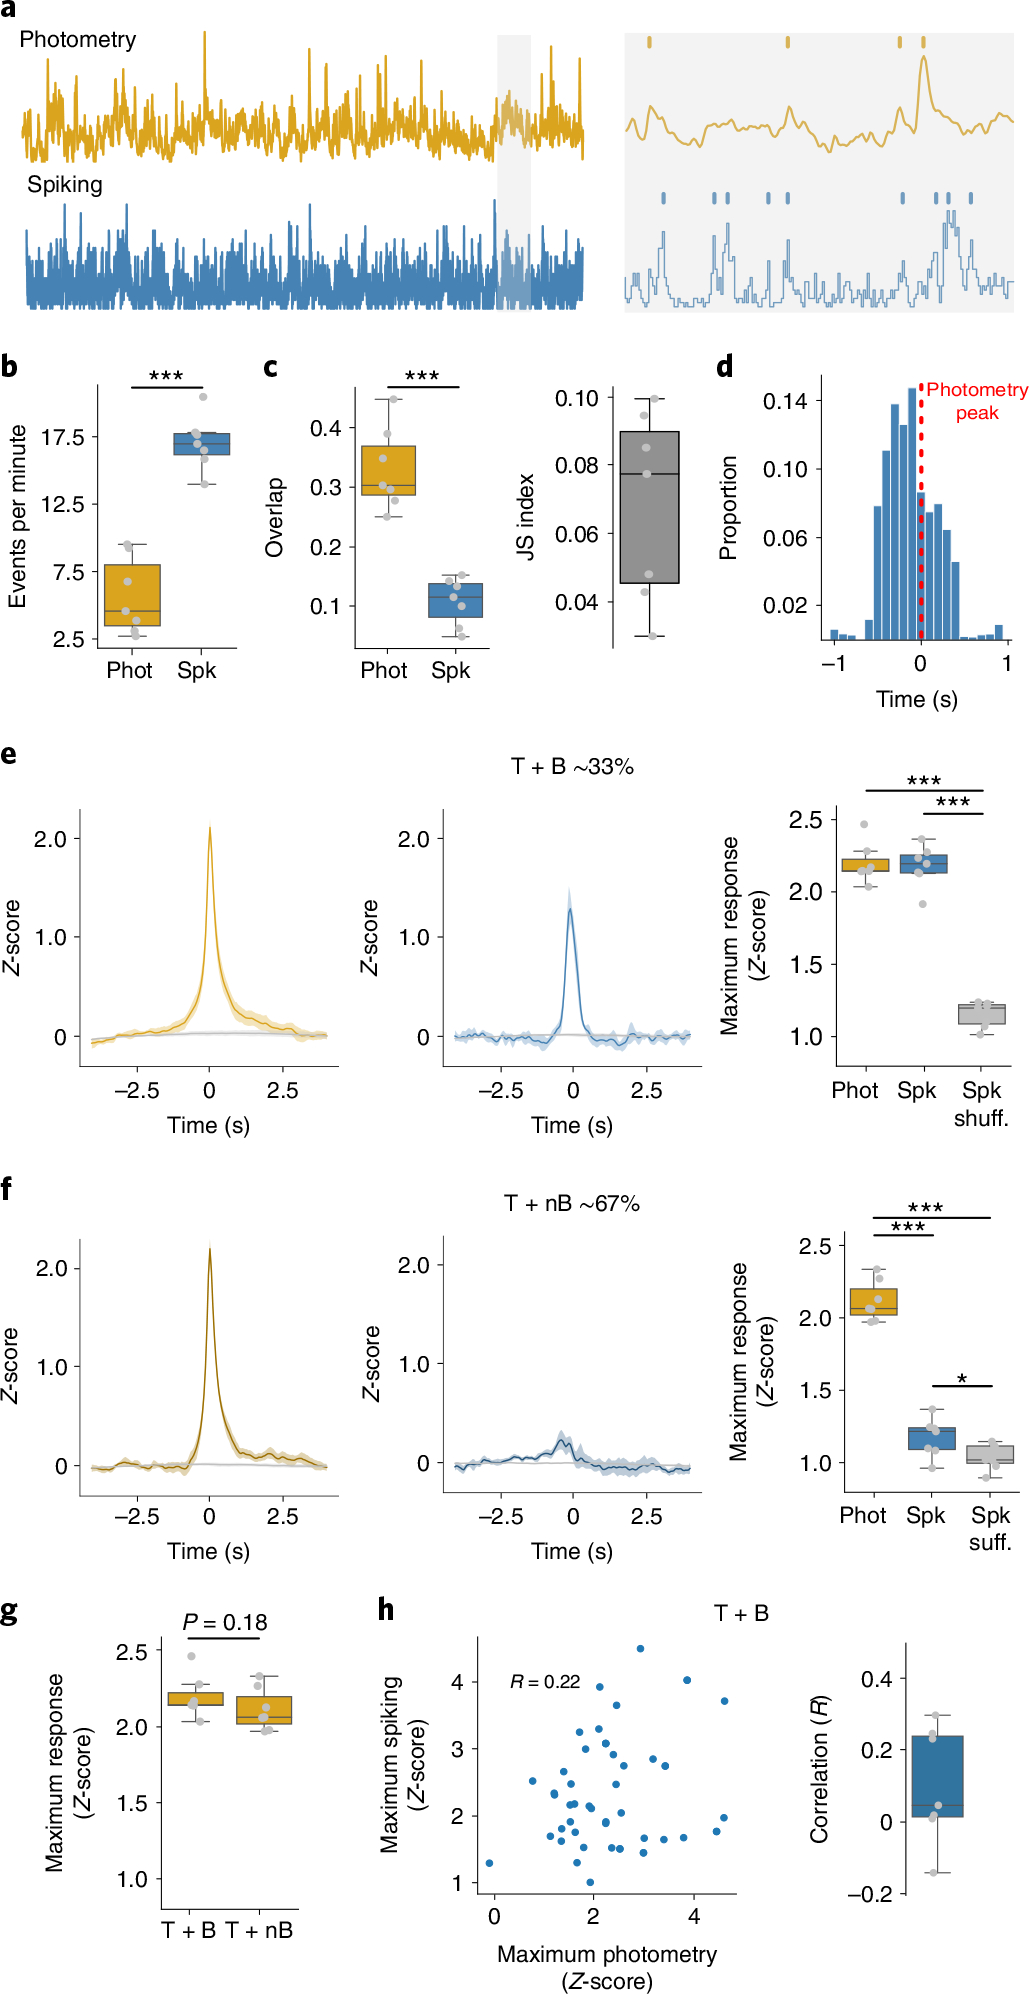
a, Left: example of simultaneously recorded photometry and spiking activity. Right: identification of photometry transients and population bursts. b, Frequency of identified photometry (Phot) and spiking (Spk) events (P = 1.44 × 10⁻⁵). c, Left: similarity of photometry and spiking events (P = 2.58 × 10⁻⁴). Right: JS index. d, Delays to maximum spiking activity versus transients that overlapped with bursts (T + B). e, Left: average photometry response T + B (yellow) or shuffled timestamps (gray). Middle: average spiking response around T + B (blue) or shuffled timestamps (Spk shuff, gray). Right: average maximum photometry/spiking response (F = 213.0, P = 1 × 10⁻⁵). f, Same as e but for transients that did not overlap with a burst (T + nB). Right: F = 261.61, P = 1 × 10⁻⁵. g, Amplitude of photometry response around T + B and T + nB transients. h, Correlations between photometry and spiking responses. Left: representative example of 50 T + B photometry and spiking responses of one mouse. Right: average correlations, with the correlation coefficient given (R). For b and c, and right-hand graphs of f and h, n = 7 mice. Statistics: b, c and g, two-tailed paired t-tests. e and f, repeated measures ANOVA, with post-hoc two-tailed paired t-tests with Bonferroni corrections. *P < 0.05, **P < 0.01 and ***P < 0.001 after corrections. Shaded regions represent 95% confidence intervals. The central values of box plots denote the median, box bounds denote upper and lower quartiles and whiskers denote ±1.5 interquartile range.
Next, we asked whether photometry transients that occurred concurrently with spiking bursts (T + B) were larger than transients without concurrent spiking bursts (T + nB). We randomly sampled 50 T + B and 50 T + nB transients 400 times to obtain a bootstrapped sample of 20,000 T + B and T + nB transients from each mouse (Fig. 2e,f). There was no difference in amplitude between T + B and T + nB transients, confirming that higher levels of spiking in the underlying tissue does not necessarily mean larger photometry transients (Fig. 2g). For the T + B transients, we also calculated the Pearson correlation between the peak photometry transient amplitude and maximal spiking response. We observed low correlation coefficients across all mice (Fig. 2h, average R = 0.10 ± 0.15), again indicating that larger bursts of spiking do not necessarily produce larger photometry transients. We repeated this analysis with the photometry derivative and a deconvolved photometry signal3 (Methods), but neither improved these correlations (Extended Data Fig. 3).
Next, we repeated these analyses in a new group of mice using a slower calcium indicator that has commonly been used for fiber photometry in the striatum, GCaMP6s (n = 8 mice, 166 single units and multiunits). Despite broader photometry transients in GCaMP6s-expressing mice, we found similar overall results, including low levels of overlap between photometry transients and bursting (JS index = 0.015 ± 0.012) and low correlation strength (R = 0.04 ± 0.49) between co-occurring photometry transients and spiking (Extended Data Fig. 4). We conclude that the photometry signal should not be interpreted as reflective of average spiking activity of the underlying tissue and instead may primarily reflect nonsomatic subthreshold changes in calcium.
To directly compare how the photometry signal relates to somatic versus nonsomatic changes in calcium, we performed microendoscopic recordings using head-mounted microscopes. We expressed GCaMP6s in DMS direct or indirect pathway medium spiny neurons (MSNs) of Drd1-Cre (n = 6: 4 males, 2 females) or A2a-Cre (n = 6: 5 males, 1 female) mice (Fig. 3a) and recorded calcium activity through an optical guide tube containing a 1-mm-diameter microendoscope gradient index (GRIN) lens4. We spatially cropped the recordings to the approximate area of a 200-μm photometry fiber, resulting in 48 videos for analysis. We extracted three component signals from each video (Fig. 3b): (1) a proxy for the photometry signal (the average fluorescence of the raw video, termed ‘pPhotom’), (2) the average somatic calcium (extracted using the CNMF-E algorithm5 implemented in the CaImAn analysis package3) and (3) nonsomatic activity (regions of interest (ROIs) that contained no extracted somatic signals). In both the direct and indirect pathways, pPhotom correlated more strongly with nonsomatic than somatic signals (two-tailed t-test, P < 0.001; Fig. 3c,f). The nonsomatic signal also had higher JS index with pPhotom than the somatic signal (two-tailed t-test, P < 0.001; Fig. 3d,g). To test if this relationship improved when sampling from a larger number of somas, we randomly selected increasing numbers of somatic signals from 1 to 80. The correlations with pPhotom increased when more somatic signals were included but plateaued at R2 ≈ 0.5 in D1-Cre mice and R2 ≈ 0.3 in A2a-Cre mice (Fig. 3e,h). In contrast, the correlation with nonsomatic signals averaged R2 > 0.9 for both D1-Cre and A2a-Cre mice.
Fig. 3 |. pPhotom correlates with nonsomatic changes in calcium.
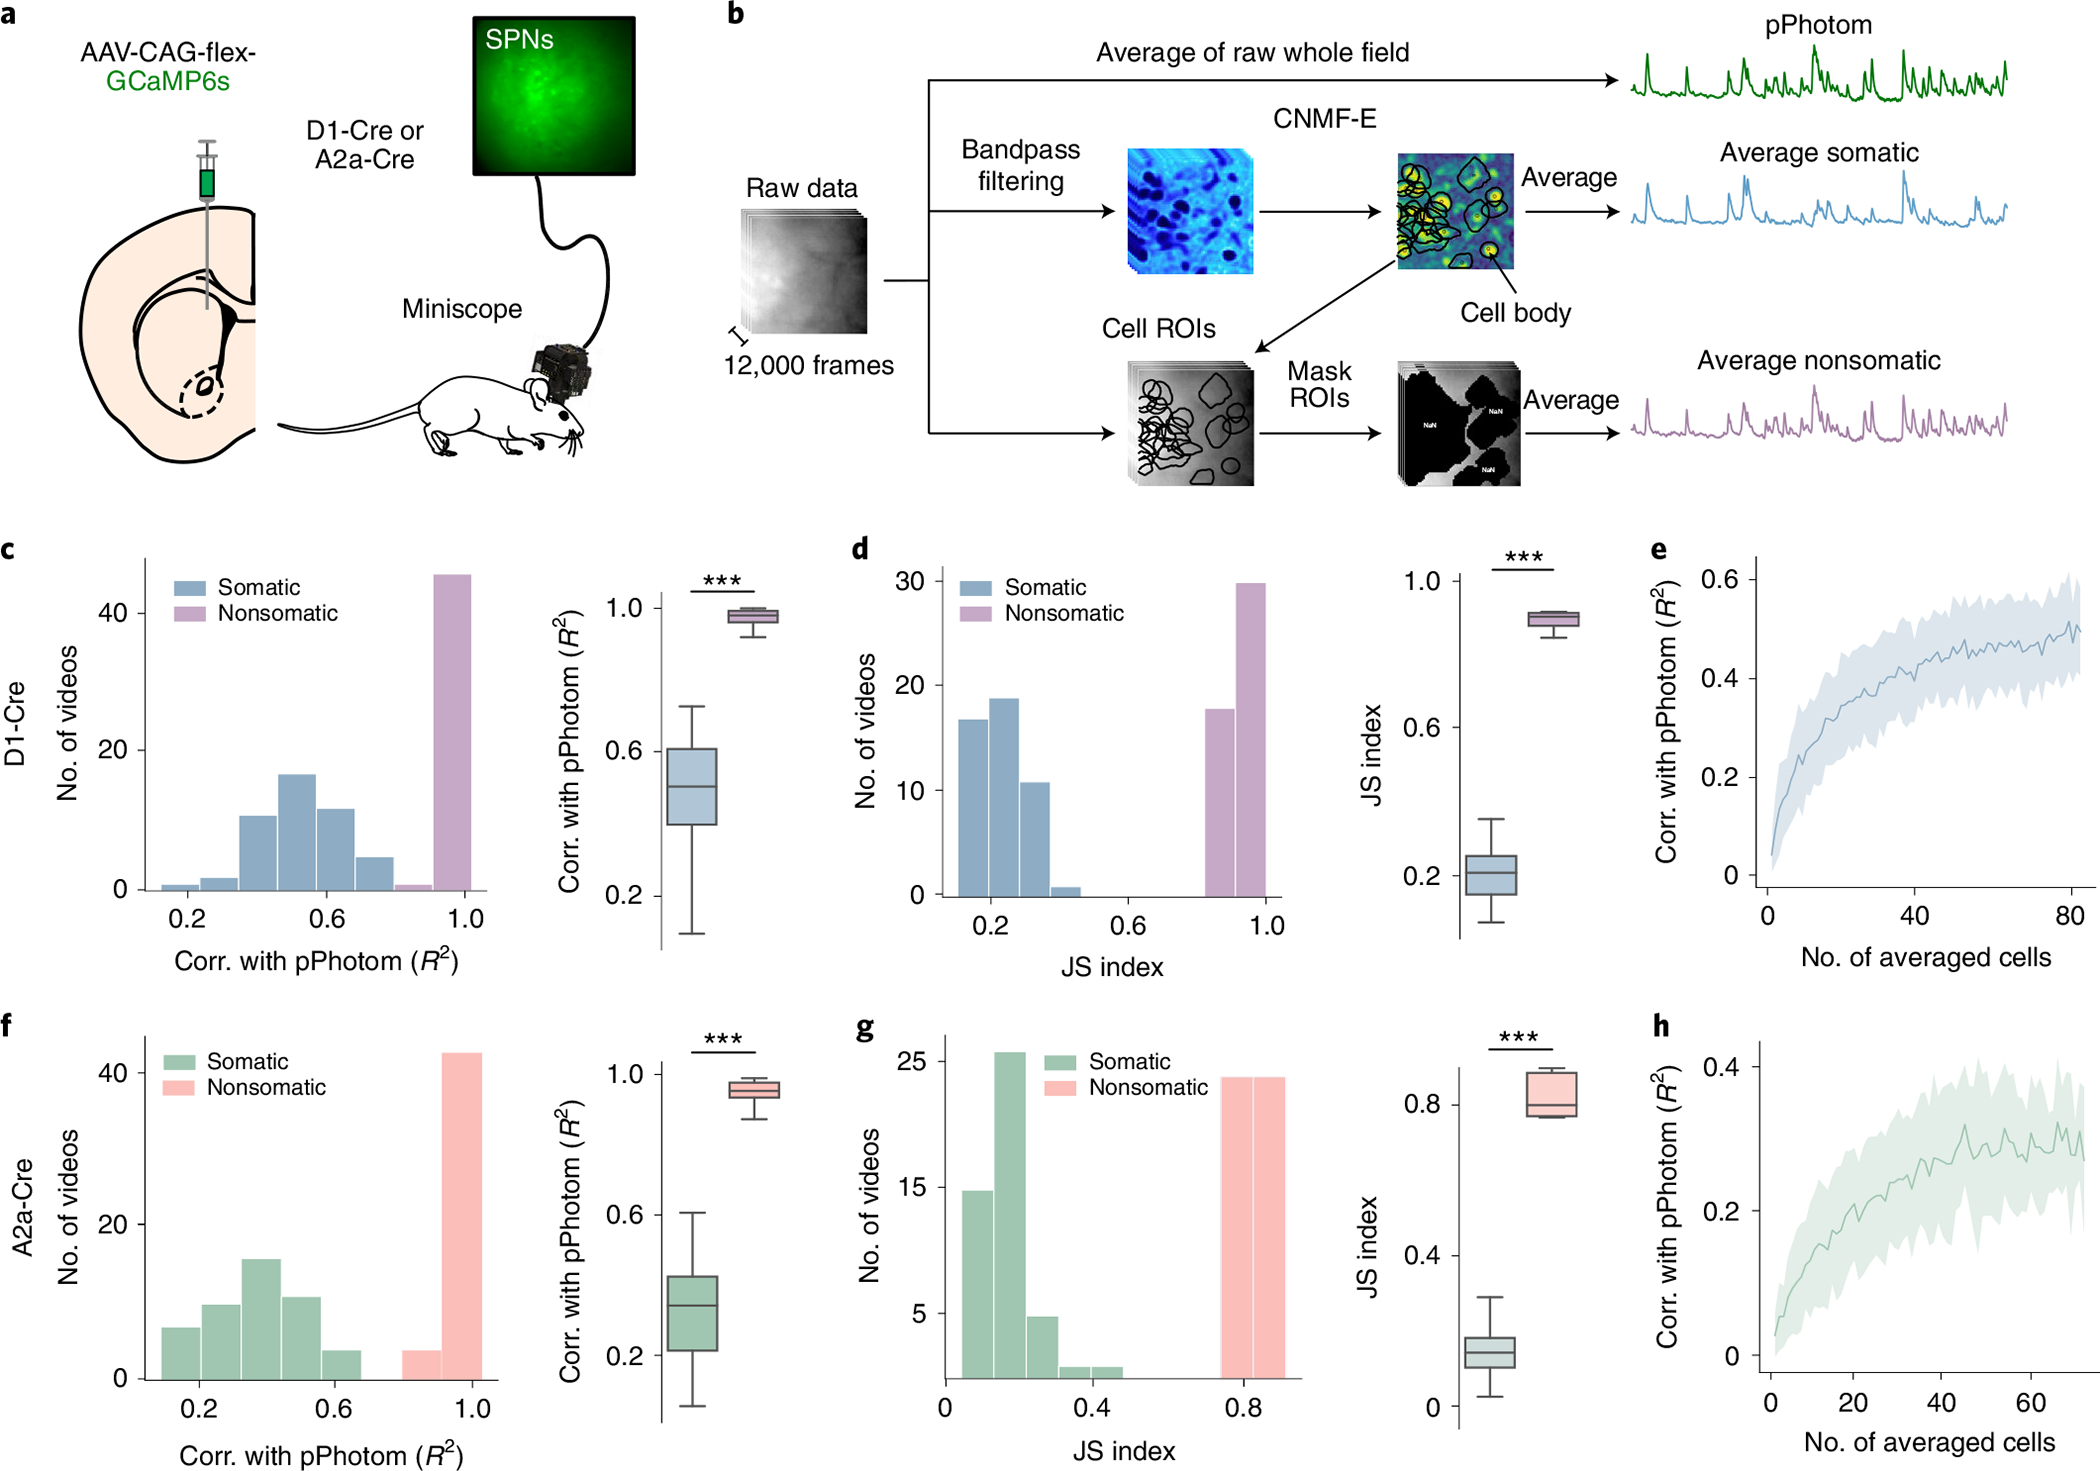
a, Experimental setup: Cre-dependent GCaMP6s was injected in the DMS of D1-Cre or A2a-Cre mice, and a miniature microscope was used to record neural activity from spiny projection neurons (SPNs). b, Segmentation of pPhotom, average somatic signal and average nonsomatic signals. c, Linear correlations (corr.) between photometry and somatic signals in direct pathway neurons. Left: correlation of the average somatic signals with pPhotom (n = 6 mice, 9 subfields/videos per mouse). Right: average correlation per mouse (n = 6 mice, P = 1 × 10⁻⁵). d, JS index between transients in the somatic signal and transients in pPhotom. Left: JS of somatic transients and pPhotom transients (n = 6 mice, 9 subfields/videos per mouse). Right: JS index per mouse (n = 6 mice, P = 1 × 10⁻⁵). e, Correlation between photometry and different numbers of somatic signals (n = 6 mice). f–h, Same as c–e for indirect pathway neurons (n = 6 mice, 9 subfields/videos per mouse). f, Right: P = 1 × 10⁻⁵. g, Right: P = 1 × 10⁻⁵. Shaded regions show 95% confidence intervals. The central values of box plots denote the median, box bounds denote upper and lower quartiles and whiskers denote ±1.5 interquartile range. Statistics for c, d, f and g, two-tailed paired t-tests. ***P < 0.001.
If photometry reflects primarily nonsomatic calcium, pPhotom should also correlate with itself across the imaging field, as dendritic arbors of striatal MSNs can extend >500 μm, whereas somas are only ~10–20 μm in diameter6,7. To test this, we divided the imaging recordings into 6 × 6-pixel regions (roughly somatic size) and calculated correlations among all regions. Correlations were high across all 6 × 6-pixel regions within each video, regardless of their location across the imaging field (average R2 = 0.95 ± 0.04; Extended Data Fig. 5c,d). Individual 6 × 6-pixel regions also strongly correlated with pPhotom (average R2 = 0.97 ± 0.02; Extended Data Fig. 5e,f). In contrast, individual somatic signals exhibited low temporal correlations with one another (average R2 = 0.06 ± 0.13) and with pPhotom (average R2 = 0.21 ± 0.12; Extended Data Fig. 5d–f).
One potential confound of one-photon calcium imaging is that out of focus, somas can be missed by the extraction algorithm and contaminate nonsomatic signals. To test this possibility, we performed volumetric two-photon calcium imaging through a GRIN lens in the dorsal striatum (n = 4 mice, all female; Extended Data Fig. 6a). We extracted cell body locations (ROIs) from three consecutive optical planes using the EXTRACT algorithm8. We calculated correlations between pPhotom of the middle plane and masked videos that excluded somatic ROIs from one, two or all three optical planes (Extended Data Fig. 6b). If out-of-focus somas contributed to pPhotom, these correlations should worsen as we excluded somas from different focal planes. While there was a trend toward significance (one-way repeated measures ANOVA, F = 3.68, P = 0.09), the effect size between conditions (<2% change) was not meaningful and correlations remained high (R2 > 0.98) even with somatic signals from all three imaging planes removed (Extended Data Fig. 6c).
Finally, we used spatial filters to determine spatial frequencies that contributed most strongly to pPhotom (Extended Data Fig. 6d). The pPhotom signal correlated best with full-frame changes (that is, at 0–2 cycles per frame, R2 > 0.85). In contrast, soma-sized changes (ranging from 25 to 50 cycles per frame) had a correlation strength similar to that of average somatic signals in the miniscope videos (R2 ≈ 0.4; Extended Data Fig. 6e).
Overall, we conclude that striatal photometry and average spiking reflect distinct biological phenomenon. This conclusion is predicted from decades of calcium imaging analysis9,10 and supports prior findings from cholinergic neurons in the striatum11. Functionally, this may explain temporal differences in striatal photometry and spiking dynamics preceding actions12. Finally, our conclusions may be relevant to other structures, as position and speed have been decoded from hippocampal and cortical neuropil13,14. There are also limitations to our findings. Striatal neurons have extensive dendritic arbors that may accentuate the neuropil contribution to the fiber photometry signal6,7,15, so different results may occur outside of the striatum. In addition, while we tested two GCaMP variants (8 f and 6 s), different relationships may be observed with variants that target GCaMP to specific cellular compartments16,17 or recordings that target axonal projection fields18. While we conclude that fiber photometry should not be interpreted as a proxy for population spiking activity, our results suggest exciting additional uses for fiber photometry. For instance, we observed sustained elevations in calcium following behavioral stimuli, which may reflect an eligibility trace for synaptic plasticity and behavioral conditioning, providing a substrate to link behavioral events across time19,20.
online content
Any methods, additional references, Nature Research reporting summaries, source data, extended data, supplementary information, acknowledgements, peer review information; details of author contributions and competing interests; and statements of data and code availability are available at https://doi.org/10.1038/s41593-022-01152-z.
Methods
All experimental procedures were approved by the Washington University Animal Care and Use Committee and the Northwestern University Animal Care and Use Committee.
Subjects.
The animals used in this study were 14 wild-type C57BL6 mice (8 males, 6 females), 8 Drd1-Cre mice (GENSAT line EY217, 6 males, 2 females), 6 A2a-Cre mice (GENSAT line KG139, 5 males, 1 female) and 4 Drd1-Cre crossed to Allen Institute reporter line Ai14 on a C57BL6/J background (4 females). Cre mice were obtained from the GENSAT project (The Gene Expression Nervous System Atlas (GENSAT) Project, NINDS Contracts N01NS02331 & HHSN271200723701C to The Rockefeller University (New York, NY)). Animals were housed in either the Washington University in St. Louis animal facilities in standard vivarium cages with ad libitum food and water and a nonreversed 12-h dark/light cycle or the Northwestern University animal facility with a reversed 12-h light/dark cycle.
Viral transduction.
Anesthesia was induced with 3–5% isoflurane and maintained at 0.5–1.5% isoflurane during stereotactic surgery. Ear bars and a mouth holder were used to keep the mouse head in place while the skin was shaved and disinfected with a povidone/iodine solution. The skull was exposed and 1-mm-diameter craniotomy was made with a microdrill mounted to the stereotaxic manipulator. Injections were performed with a glass pipette mounted in a Nanoject 3 infusion system (Drummond Scientific). Then 500 nl of virus AAV1-Syn-GCaMP6s or AAV2/9-CaMKII-GCaMP6s (1.2 × 10¹² GC ml−1) virus was infused over 10 min into either the dorsal striatum (AP = +0.5 mm, ML = +1.5 mm, DV = −2.8 mm) or ventral striatum (AP = +0.5 mm, ML = +1.2 mm, DV = −4.5 mm). The injector was left in place for 5 or 10 min before removal.
Optical guide implantation and head bar placement.
We used a 1.4-mm-diameter drill bit to create another craniotomy (AP = +1.0 mm, ML = +1.5 mm) for implantation of the optical guide tube. We fabricated this guide tube by using ultraviolet (UV) liquid adhesive (Norland no. 81) to fix a 2.5-mm-diameter disc of no. 0 glass to the tip of a 3.8-mm-long, extra-thin 18-gauge stainless steel tube (McMaster-Carr). We ground off any excess glass using a polishing wheel (Ultratec). Using a 27-gauge blunt-end needle, we aspirated the cortex down to DV = −2.1 mm from the dura and implanted the exterior glass face of the optical guide tube at DV = −2.35 mm. After stereotaxic placement of these components, we attached a head bar to the entire assembly using Metabond (Parkell) and dental acrylic. For mice used for two-photon imaging, we used additional dental acrylic to construct a reservoir for holding water for the water-immersion objective lens. Mice recovered for 3–4 weeks before two-photon imaging experiments or mounting of the miniature microscope.
GRIN lens implantation and mounting of miniature microscope.
After 3–4 weeks, we inserted a GRIN lens (1 mm diameter; 4.12 mm length; 0.46 numerical aperture; 0.45 pitch; GRINTECH GmbH or Inscopix Inc.) into the optical guide tube. In mice with uniform indicator expression, we secured the GRIN lens in the guide tube with UV-light-curable epoxy (Loctite 4305). For miniscope imaging, after affixing the GRIN lens, we lowered a miniature microscope (nVistaHD, Inscopix Inc.) toward the GRIN lens until the fluorescent tissue was in focus. To secure the miniature microscope to the cranium, we created a base on the cranium around the GRIN lens using blue-light-curable resin (Flow-It ALC; Pentron). We attached the base plate of the miniature microscope to the resin base using UV-light-curable epoxy (Loctite 4305). After affixing its base plate, we released the microscope and attached a base plate cover (Inscopix Inc.). We coated the resin with black nail polish (Black Onyx, OPI) to make it opaque.
Implantation of electrode arrays.
Following viral infusion, a combined electrophysiology/fiber photometry device was implanted. Fiber optic cannulae (200 μm diameter, 0.50 numerical aperture) with 1.25 mm ceramic ferrules were purchased from Thorlabs and cut to 6 mm long. These cannulae were mounted in a custom electrode array with 32 Teflon-coated tungsten microwires (35 μm diameter; Innovative Neurophysiology) that positioned the wires in a semicircle surrounding a central gap where the photometry fiber was mounted. This combined photometry/electrical recording device was implanted into the right DMS (AP = +0.5 mm, ML = +1.5 mm, DV = −2.8 mm). The device was secured to the skull with a thin layer of adhesive dental cement (C&B Metabond, Parkell) followed by a larger layer of acrylic dental cement (Lang Dental). Once the cement had fully cured, animals were placed back in their home-cage on a pre-heated pad at 37 °C. After recovery, animals received a subcutaneous injection of meloxicam (10 mg kg−1) and were again returned to their home-cages for recovery. Mice recovered for at least 2 weeks to allow for viral expression before recording.
Electrophysiological recordings.
Neurophysiological signals were recorded by a multichannel neurophysiology system (Plexon Omniplex, Plexon Inc.). Spike channels were acquired at 40 kHz and bandpass filtered from 150 Hz to 3 kHz before spike sorting. Recordings were performed in a 9″ × 12″ clear plastic box and lasted between 1 and 3 hr. Video and tracking data was also recorded in real time with the Plexon Cineplex system.
Fiber photometry recordings.
Fiber photometry acquisition was performed with a Neurophotometrics fiber photometry system (FP3001, Neurphotometrics LTD). Briefly, this system utilizes a 470-nm blue-light LED, which was left on continuously at 40–100 μW to excite GCaMP, and a fluorescence light path that includes a dichroic mirror to pass emitted green fluorescence to a complementary metal-oxide semiconductor camera (FLIR BlackFly). Fluorescence signals from the camera are processed with Bonsai (https://bonsai-rx.org/docs) and transmitted as a voltage signal to the Plexon Omniplex for simultaneous digitizing with the electrophysiological data.
Behavior.
Open field recordings were performed after 2 weeks of viral injection in GCaMP8f mice, and 1–3 months in GCaMP6s mice. The operant feeding, air puffs and foot shock behaviors were tested 6–7 weeks after viral injections.
Operant field task.
Mice were placed in an open field chamber and spontaneous activity was recorded for 1.5 h.
Operant feeding task.
In two overnight (16-hour) sessions, mice were trained to hold an isometric lever for at least 200 ms, which dispensed a pellet into the chamber from a FED3 device23. Following training, mice were fasted for 6 hours and simultaneous spiking and photometry data was recorded as they completed this same task for 3 hours during the daytime.
Air puffs.
Mice were placed in an open field chamber and left to acclimate for 15 min. Fifteen air puffs were manually delivered, with a duration of approximately 500 ms each, at pseudo-random intervals between 1 and 3 min.
Foot shocks.
Mice were placed in a shock box chamber and left to acclimate for 15 min. Foot shocks were delivered at pseudo-random intervals of 1 to 3 min. Foot shocks of 0.7 mA and three different lengths were delivered (100 ms, 250 ms and 500 ms, in that order, 12–15 shocks per intensity). In total, between 40 and 45 shocks were delivered per mouse.
Electrophysiology/fiber photometry data analysis.
Single units and multiunits were manually discriminated using principal component analysis (Offline Sorter; Plexon), using multivariate analysis of covariance analyses to determine if single-unit clusters were statistically distinct from multiunit clusters. Where single-unit isolation did not reach statistical significance, spike clusters were combined into multiunits. Data analysis was performed using a custom Python pipeline (code available at: https://osf.io/8j7g2/), described below.
Photometry signal preprocessing.
The fiber photometry signal was processed using a custom Python pipeline (code available at: https://osf.io/8j7g2/). We first applied both a low-pass (6 Hz) and a high-pass filter (0.0005 Hz) to the photometry signal to correct for high-frequency noise and photo bleaching, respectively, and the signal was down-sampled to 20 Hz.
Time derivative of photometry.
To obtain the time derivative of the photometry signal, a discrete derivative was done using the np.diff() function.
Photometry deconvolution.
To deconvolve the photometry signal, we used a one-dimensional constrained deconvolution algorithm, which assumes that the sensor fluorescence follows a second-degree autoregressive process. We used the CaImAn implementation of this algorithm3.
Population spiking preprocessing.
For analyzing the population spiking response around behavioral events, we created peri-event histograms of each unit. To obtain the population spiking, all the trials from all the neurons were concatenated and averaged, resulting in one average time series that reflected the average population spiking.
Photometry transient and spiking burst detection.
Photometry transients were detected using the scipy.find_peaks() function, setting a minimum prominence of 2. For detecting population spiking bursts, all spikes from all the neurons were concatenated and a firing rate histogram was created with bins of 0.05 (or 20 Hz) to create a signal analogous to the photometry signal. A Gaussian filter with a sigma value of 0.5 was applied. Population spiking bursts were detected in the same way to photometry transients, by using the scipy.find_peaks() function with the prominence parameter set to a minimum of 2.
Normalization of signals.
In all peri-event histograms, all the signals were z-scored to a baseline period.
One-photon endoscopic calcium imaging recordings.
Brain imaging in freely moving mice occurred in a circular arena (31 cm in diameter). To habituate mice to this arena, mice explored it for 1 h on each of three sequential days before any calcium ion (Ca2+) imaging. Before each imaging session, we head-fixed each mouse to a metal frame by its implanted head bar and allowed the mouse to walk or run on a running wheel. We then attached the miniature microscope and adjusted the focal setting to optimize the field of view. After securing the microscope to the head of the mouse, we detached the mouse from its head restraint and allowed it to freely explore the circular arena. After allowing ≥10 min for the mouse to habituate to the arena, fluorescence Ca2+ imaging commenced using 50–200 μW of illumination power at the specimen plane and a 20-Hz frame acquisition rate.
Endoscopic calcium imaging analysis.
Cropping.
To better match the surface area of the most commonly used fiber photometry fiber, we cropped each 1-mm GRIN lens image into six 200-μm2 regions with the FIJI distribution of ImageJ21.
Somatic activity extraction.
We used the CaImAn3 cell body extraction Jupyter notebook pipeline to extract somatic activity from miniscope videos. Briefly, this pipeline implements motion correction and the CNMF-E algorithm5 in an online notebook, returning quality metrics and images of extracted somatic signals for subsequent analysis. We then averaged the activity trace of somatic signals.
Nonsomatic activity extraction.
ROIs covering cell bodies were extracted with the CaImAn pipeline and were used to mask out regions of the video that contained somatic activity. The fluorescence in the remaining pixels was averaged for each frame of the video to create an average nonsomatic signal.
Extraction of photometry signals.
The proxy for photometry signal was obtained by averaging the intensity of the entire field for each frame of the raw video.
Two-photon calcium imaging recordings.
Drd1-Cre; Ai14 mice injected with AAV2/9-CaMKII-GCaMP6s were used for two-photon calcium imaging. GCaMP6s was constitutively expressed in both MSN types, whereas tdTomato expression was restricted to D1-MSNs. After habituating mice to head-fixation on a running wheel, we used a two-photon microscope with a piezoelectric actuator (Bruker) to acquire videos of Ca2+ activity and tdTomato expression at three imaging planes separated by 20 μm in the dorsal striatum of head-fixed mice during wheel running. We used a tunable laser (Insight X3, Spectra Physics) and a 16x/0.8NA objective (Nikon) to acquire 512 × 512-pixel videos of each plane at a 30-Hz frame acquisition rate (effectively 6 Hz per plane). We used 920 nm excitation light to simultaneously excite tdTomato and GCaMP6s fluorescence, which we detected using gallium arsenide phoshide photomultiplier tubes and bandpass filters (520/40 for GCaMP6s and 595/50 for tdTomato).
Two-photon calcium imaging processing.
We used an exponential fit to normalize slow variations in green and red fluorescence intensity that were assumed to be due to photo bleaching. We then motion corrected the tdTomato video using NormCorre22. We then applied the tdTomato motion correction transformations to the video frames of the green GCaMP6s fluorescence video. We then corrected for fluctuations in background fluorescence intensity in the GCaMP6s video by applying a Gaussian low-pass filter to each image, then dividing each image frame by its low-pass filtered version. We then down-sampled the GCaMP6s video by a factor of 2 via linear interpolation.
Two-photon calcium imaging analysis.
Data analysis was performed using a custom Python pipeline (code available at: https://osf.io/8j7g2/), described below.
Fast Fourier Transformations (FFTs).
All FFTs analyses were done using the numpy.fft2 module of numpy. To obtain the signal coming from different spatial frequencies, an FFT was applied to each frame, and then a bandpass filter was applied through a circular mask that selected for specific spatial frequencies. Finally, an inverse FFT was performed to recreate a filtered image that contained only the spatial frequencies allowed by the filter.
Nonsomatic activity extraction.
ROIs containing cell bodies were identified with the EXTRACT algorithm and were used to mask out areas of the movie containing somatic signals. Fluorescence from the remaining pixels was averaged for each frame of the video to obtain a nonsomatic signal.
Histology.
At the end of the experiments, we performed histological verification of implant placements. Animals were anesthetized with isoflurane and decapitated, and their brains were quickly removed and placed in 10% formalin solution, in which they were incubated overnight. The brains were then moved to 30% sucrose solution until sectioning. Coronal slices containing the striatum were prepared using a freezing microtome (Leica SM2010R). Slices were mounted on microscope slides with a mounting media and imaged with an epifluorescence microscope (Zeiss). For in vivo electrophysiology, electrode placement was assessed via observation of implant tracts or electric lesions that were made under anesthesia before decapitation (performed with a 5-s long pulse of 10 mA; Ugo Basile Lesion Making Device).
Statistics and reproducibility.
No statistical methods were used to pre-determine sample sizes, but our sample sizes are similar to those reported in previous publications4,12. Confirmation of viral expression and optic fiber/electrode implantation in each mouse was done through histology (Histology), resulting in similar expression and implant localization to the representative example in Fig. 1b. The experimenters were not blinded to the allocation of groups, since both photometry and spiking activity, and calcium imaging signal was acquired from every mouse and all comparisons were paired. No data were excluded. Data distribution was assumed to be normal, but this was not formally tested. There were no experimental groups in this study, and thus no randomization, since photometry and spiking signal (Figs. 1 and 2 and Extended Data Figs. 1–4) and miniscope-based calcium signals (Fig. 3 and Extended Data Figs. 5 and 6) were collected from all the animals in the experiment.
Extended Data
Extended Data Fig. 1 |. Photometry, and spiking activity, and locomotor activity reflect distinct responses around foot shocks.
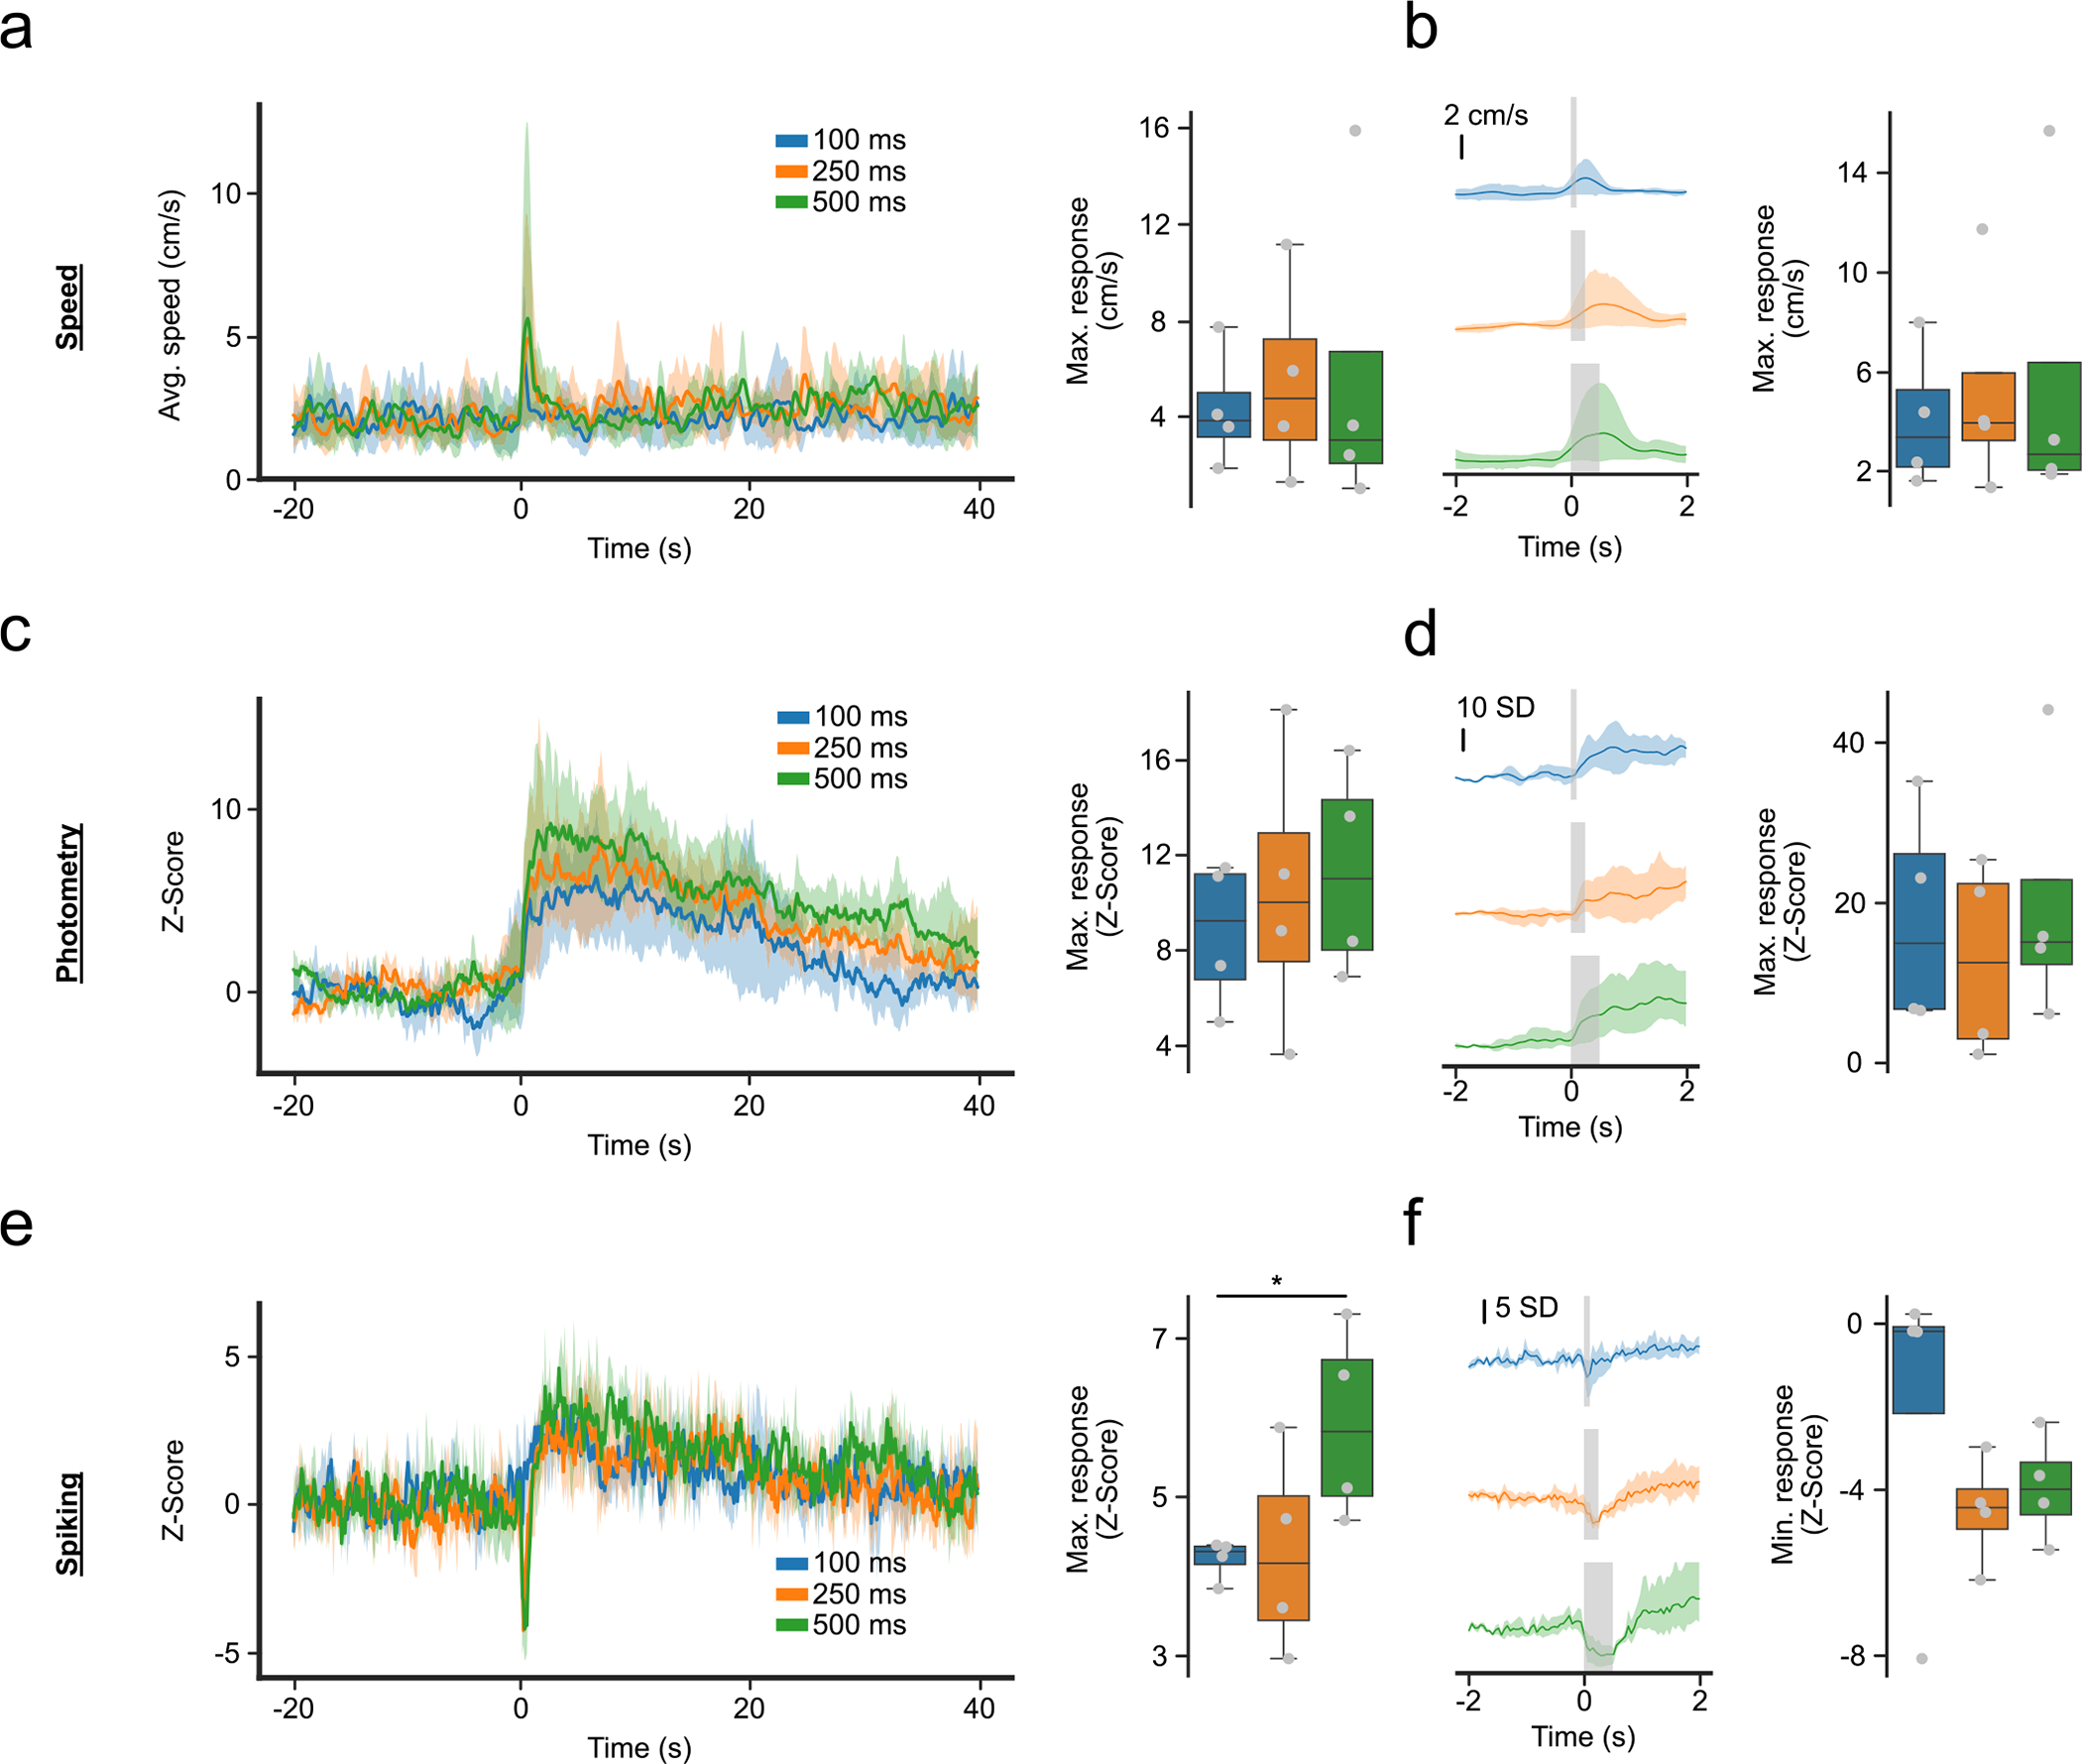
(a) Motor response around 0.7 mA foot shocks of different length. (Left) Average response from −20 to 40 seconds. (Right) Maximum response from 0 to 5 seconds, time-locked to foot shock (F-Value = 0.64, p-value = 0.558). (b) Close-up of (a), showing motor response in a short time-interval around foot shock. (Left) Average response from −2 to 2 seconds. (Right) Maximum response from 0 to 1 second, excluding the stimulus time (F-value = 0.61, p-value = 0.572). (c) Same as (a) but for the photometry response. (Right) F-value = 0.93, p-value = 0.445. (d) Same as (b) but for photometry response. (Right) F-value = 1.89, p-value = 0.231. (e) Same as (a,c) for spiking activity. (Right) F-value = 8.57, p-value = 0.017 (f) Same as (b,d) but for spiking activity and showing the minimum response instead of maximum. (Right) F-value = 1.38, p-value = 0.321. For quantification, we ran repeated measures ANOVAs with post-hoc two-tailed paired t-tests with bonferroni corrections (n = 4 mice). * denotes p < 0.05 after correction. Shaded regions represent 95% confidence intervals. Box plots central value denotes the median, box bounds denote upper and lower quartiles and whiskers denote ±1.5 interquartile range.
Extended Data Fig. 2 |. The time derivative of photometry (derivative) and spiking activity show distinct responses to behavioral events.
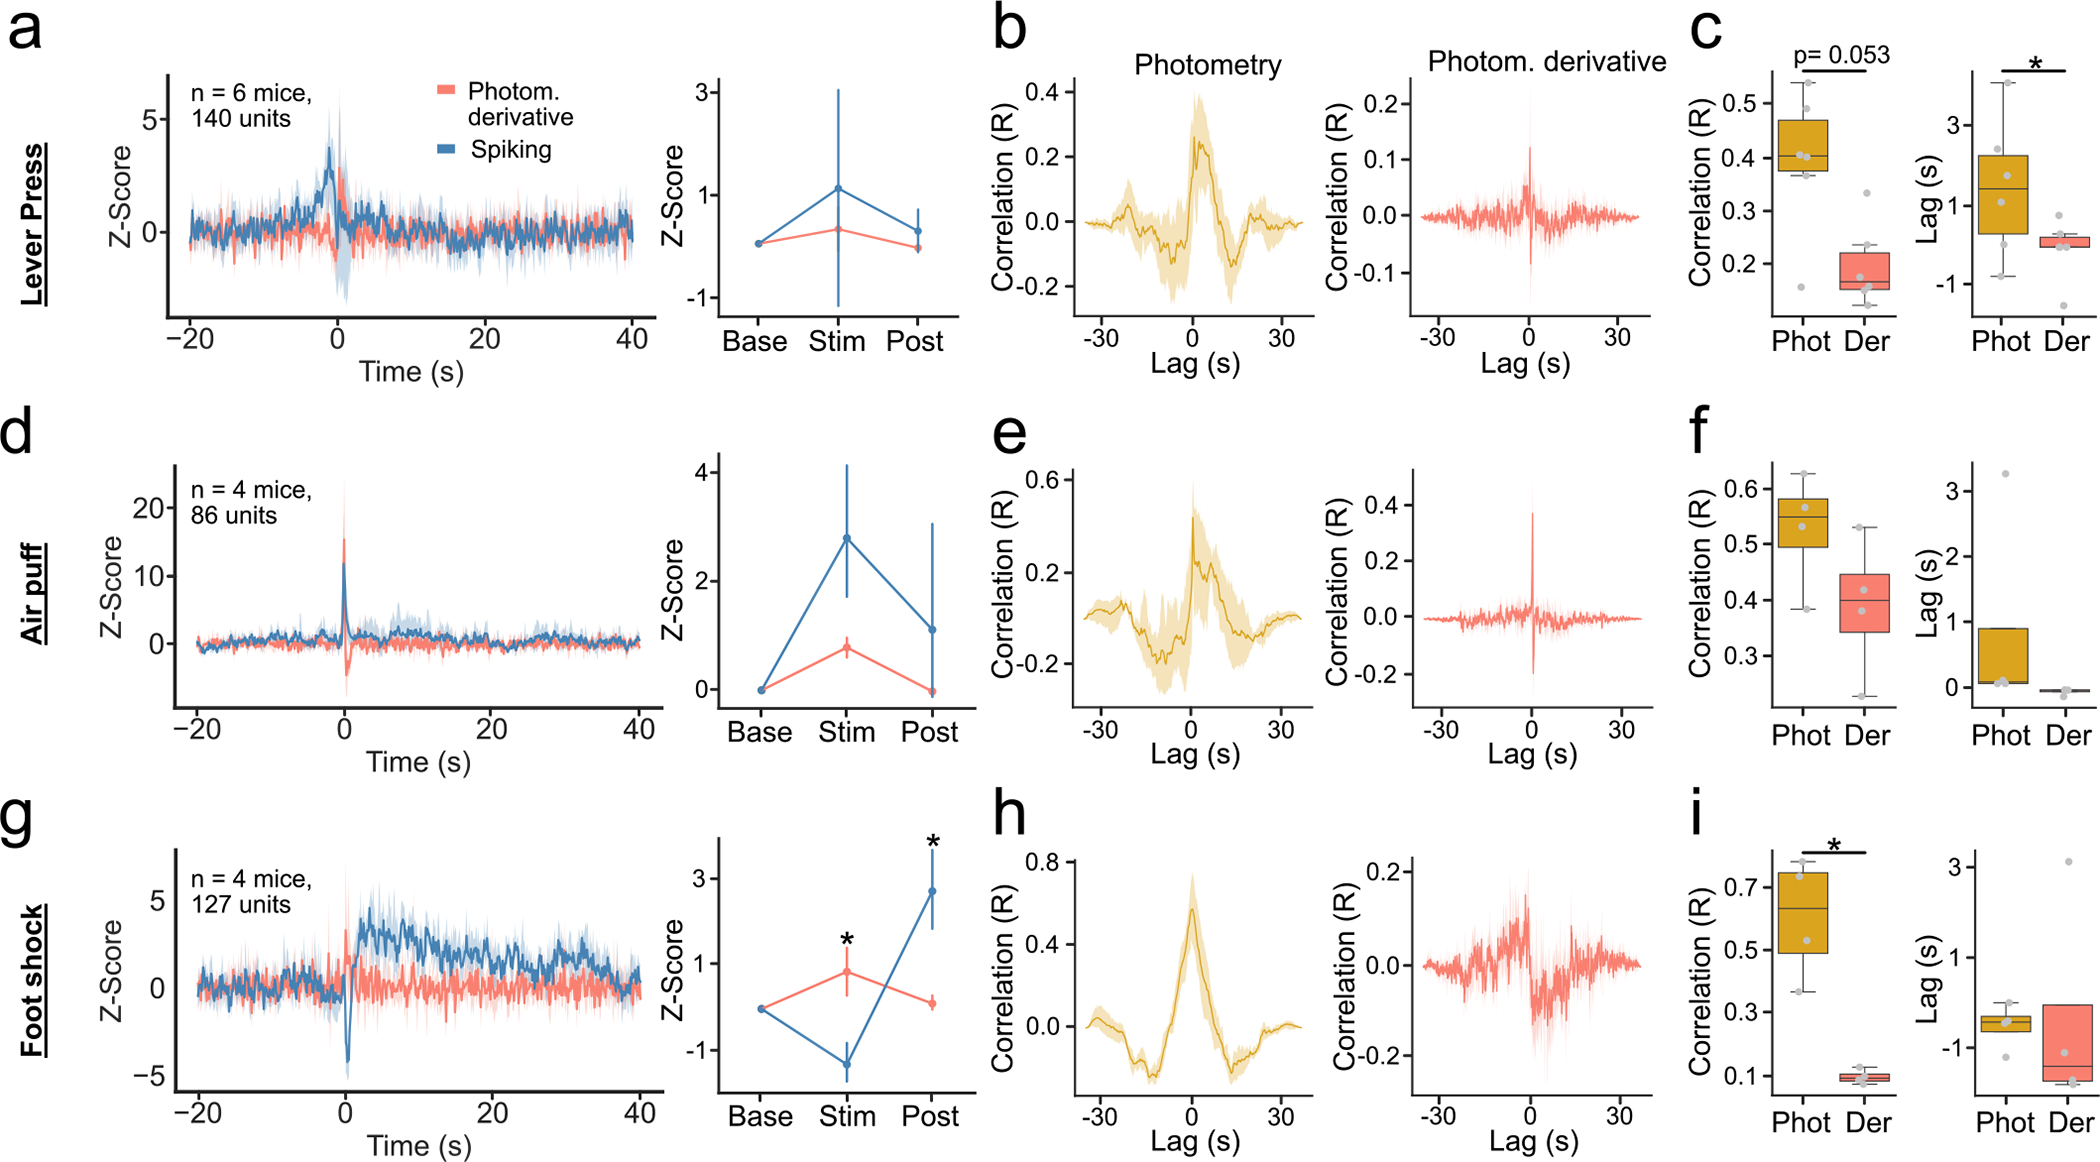
(a) Derivative and population spiking response around lever press (n = 6 mice). (Left) Average response. (Right) Average response in baseline, stimulus and post-stimulus intervals (Signal~Interval F-Value = 0.33, p-value = 0.724). (b) Cross-correlations between the response of the population spiking and photometry (Left) and derivative (Right). (c) (Left) Maximum correlation between photometry and spiking (yellow), and derivative and spiking (pink); p-value = 0.053. (Right) Latency to maximum correlation (n = 6 mice); p-value = 0.027. (d–f) Same as (a-c) for air puff stimulus (n = 4 mice). (d, Right) Signal~Interval F-Value = 4.1, p-value = 0.075. (g-i) Same as (a-c, d-f) for foot shock stimulus (n = 5 mice); i-right: p-value = 0.013. (g, right) Signal~Interval F-Value = 22.22, p-value = 0.002. For quantification of (a,d,f), we ran a repeated measures ANOVA, with post-hoc two-tailed paired t-test with bonferroni corrections. For quantification of (c,f,h), we ran 2-tailed paired t-tests. * denotes p < 0.05. Line plots show mean±95% confidence interval. error bars in (a,d,g right) denote standard deviation. Box plots central value denotes the median, box bounds denote upper and lower quartiles and whiskers denote ±1.5 interquartile range.
Extended Data Fig. 3 |. The time derivative and deconvolution of fiber photometry spiking activity.
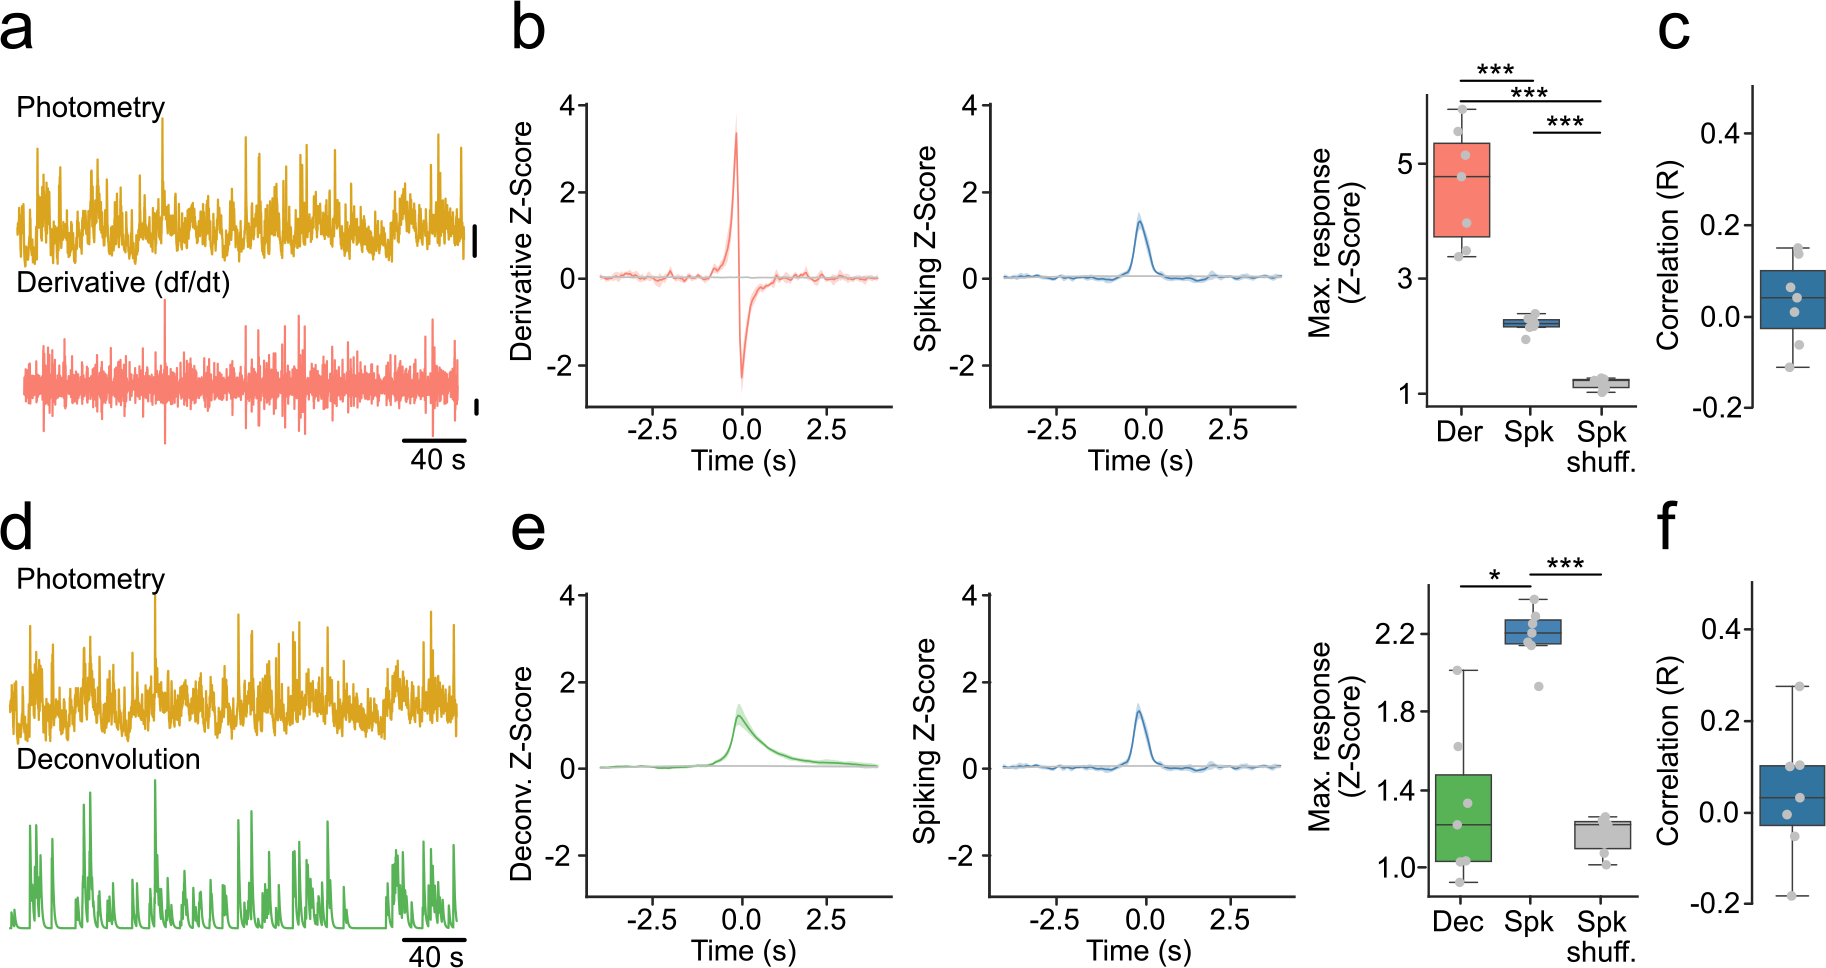
(a) Example photometry trace (top) and its derivative (bottom). Vertical lines represent 2 standard deviations. (b) Derivative and spiking response around photometry transients overlapping with a spiking burst (T + B). (Left) Average derivative response. (Middle) Average population spiking response. (Right) Maximum response (n = 7 mice, F-stat = 60.80, p-value = 1 × 10⁻⁵). (c) Correlations between maximum derivative (Der) and population spiking (Spk) response around T + B. (d) Example photometry trace (top) and its respective deconvolution (bottom). Vertical lines represent 2 standard deviations. (e) Same as (b) but for deconvolution instead of derivative (n = 7 mice, F-stat = 37.74, p-value = 1 × 10⁻⁵). (f) Correlations between maximum deconvolution (Dec) and population spiking (Spk) response around T + B. Shaded regions represent 95% confidence intervals. Box plots central value denotes the median, box bounds denote upper and lower quartiles and whiskers denote ±1.5 interquartile range. For quantification of (b,e right), we used a repeated measures ANOVA with post-hoc two-tailed paired t-tests with Bonferroni corrections. * denotes p < 0.05; *** denotes p < 0.001 after corrections.
Extended Data Fig. 4 |. GcaMP6s fiber photometry reflects only a small proportion of spontaneous changes in spiking activity.
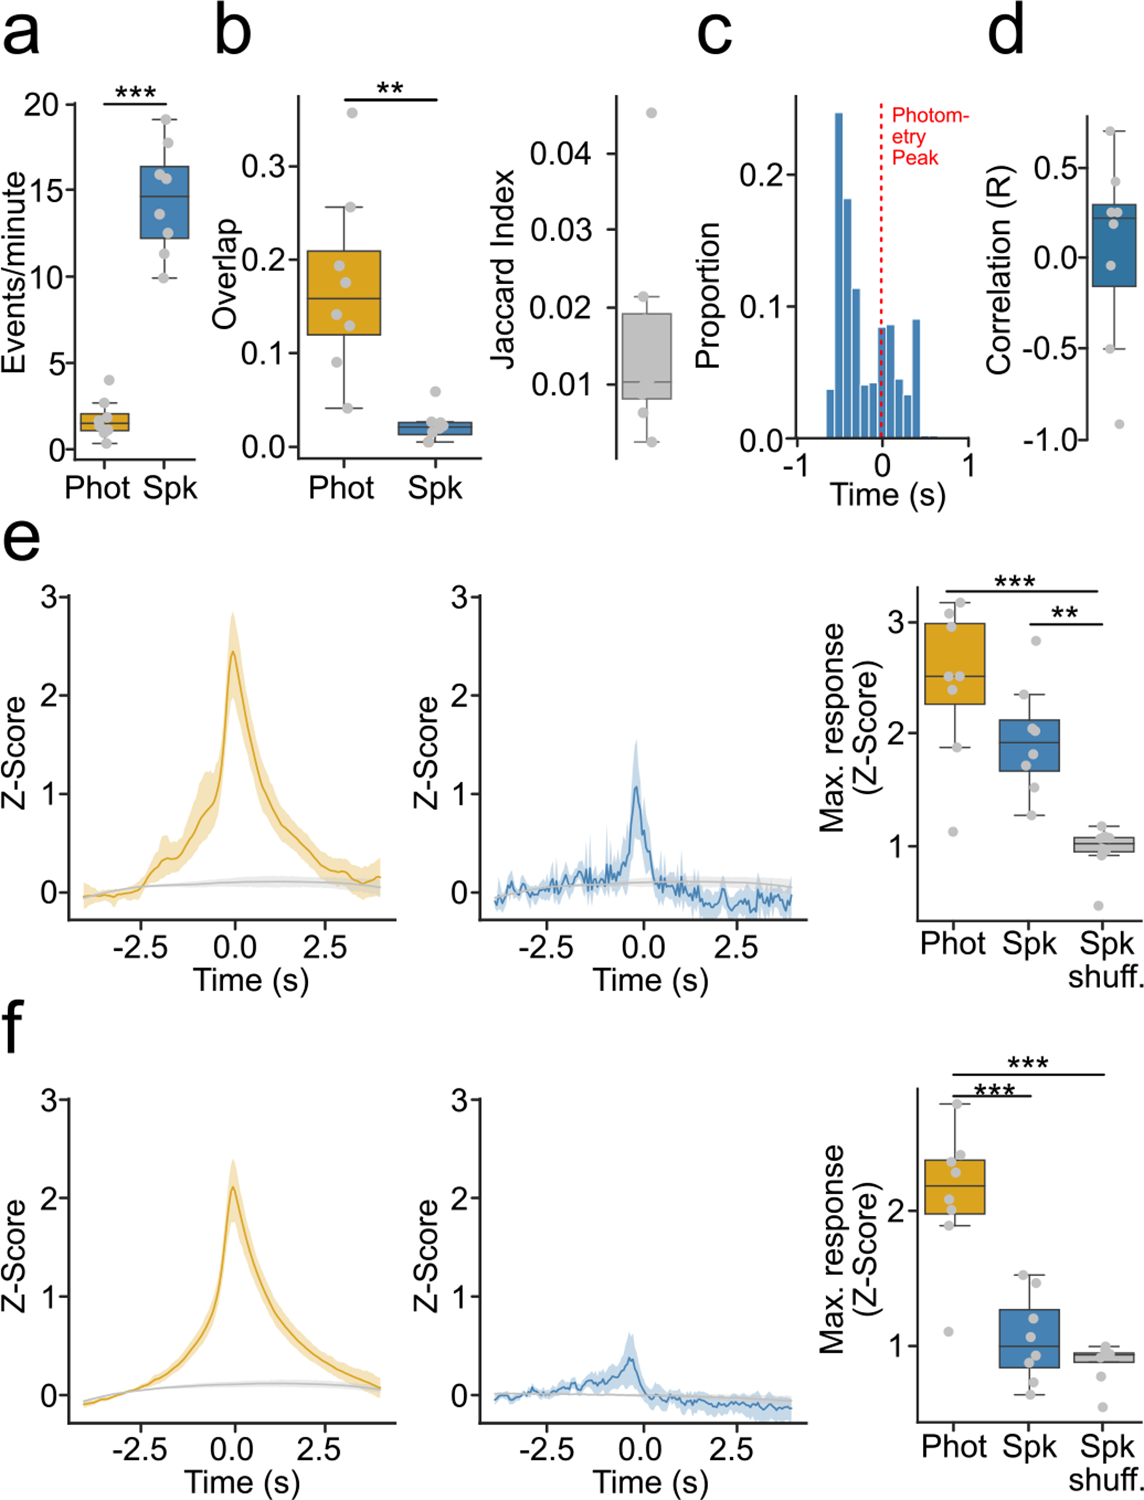
(a) Frequency of identified events in photometry or spiking (n = 8 mice, p-value = 1.75 × 10⁻⁵). (b) Similarity of photometry and spiking events (n = 8 mice). (Left) Proportion of overlap between photometry and spiking events (p-value = 2.36 × 10⁻⁴). (Right) Jaccard similarity. (c) Time course of maximum spiking activity around transients that overlapped with bursts (T + B). (d) Average correlations between photometry and spiking responses atound T + B. (e) Photometry and spiking response around T + B or shuffled timestamps. (Left) Average photometry response T + B (yellow) or shuffled timestamps (gray). (Middle) Average spiking response around T + B (blue) or shuffled timestamps (gray). (Right) Average maximum photometry/spiking response (n = 8 mice, F-value = 20.68, p-value = 1 × 10⁻⁵). (f) Same as (e) but for transients that did not overlap with bursts (T + nB) (Right) (n = 8 mice, F-value = 41.63, p-value < 0.0001). For quantification of (a,b), we ran two-tailed paired t-tests. For quantification of (e,f), we ran a repeated measures ANOVA, with post-hoc two-tailed paired t-tests with bonferroni corrections. * denotes p < 0.05, ** denotes p < 0.01, *** denotes p < 0.001 after corrections. Shaded regions in (f) represent 95% confidence intervals. Box plots central value denotes the median, box bounds denote upper and lower quartiles and whiskers denote ±1.5 interquartile range.
Extended Data Fig. 5 |. pPhotom correlates with whole-field changes in fluorescence signal.
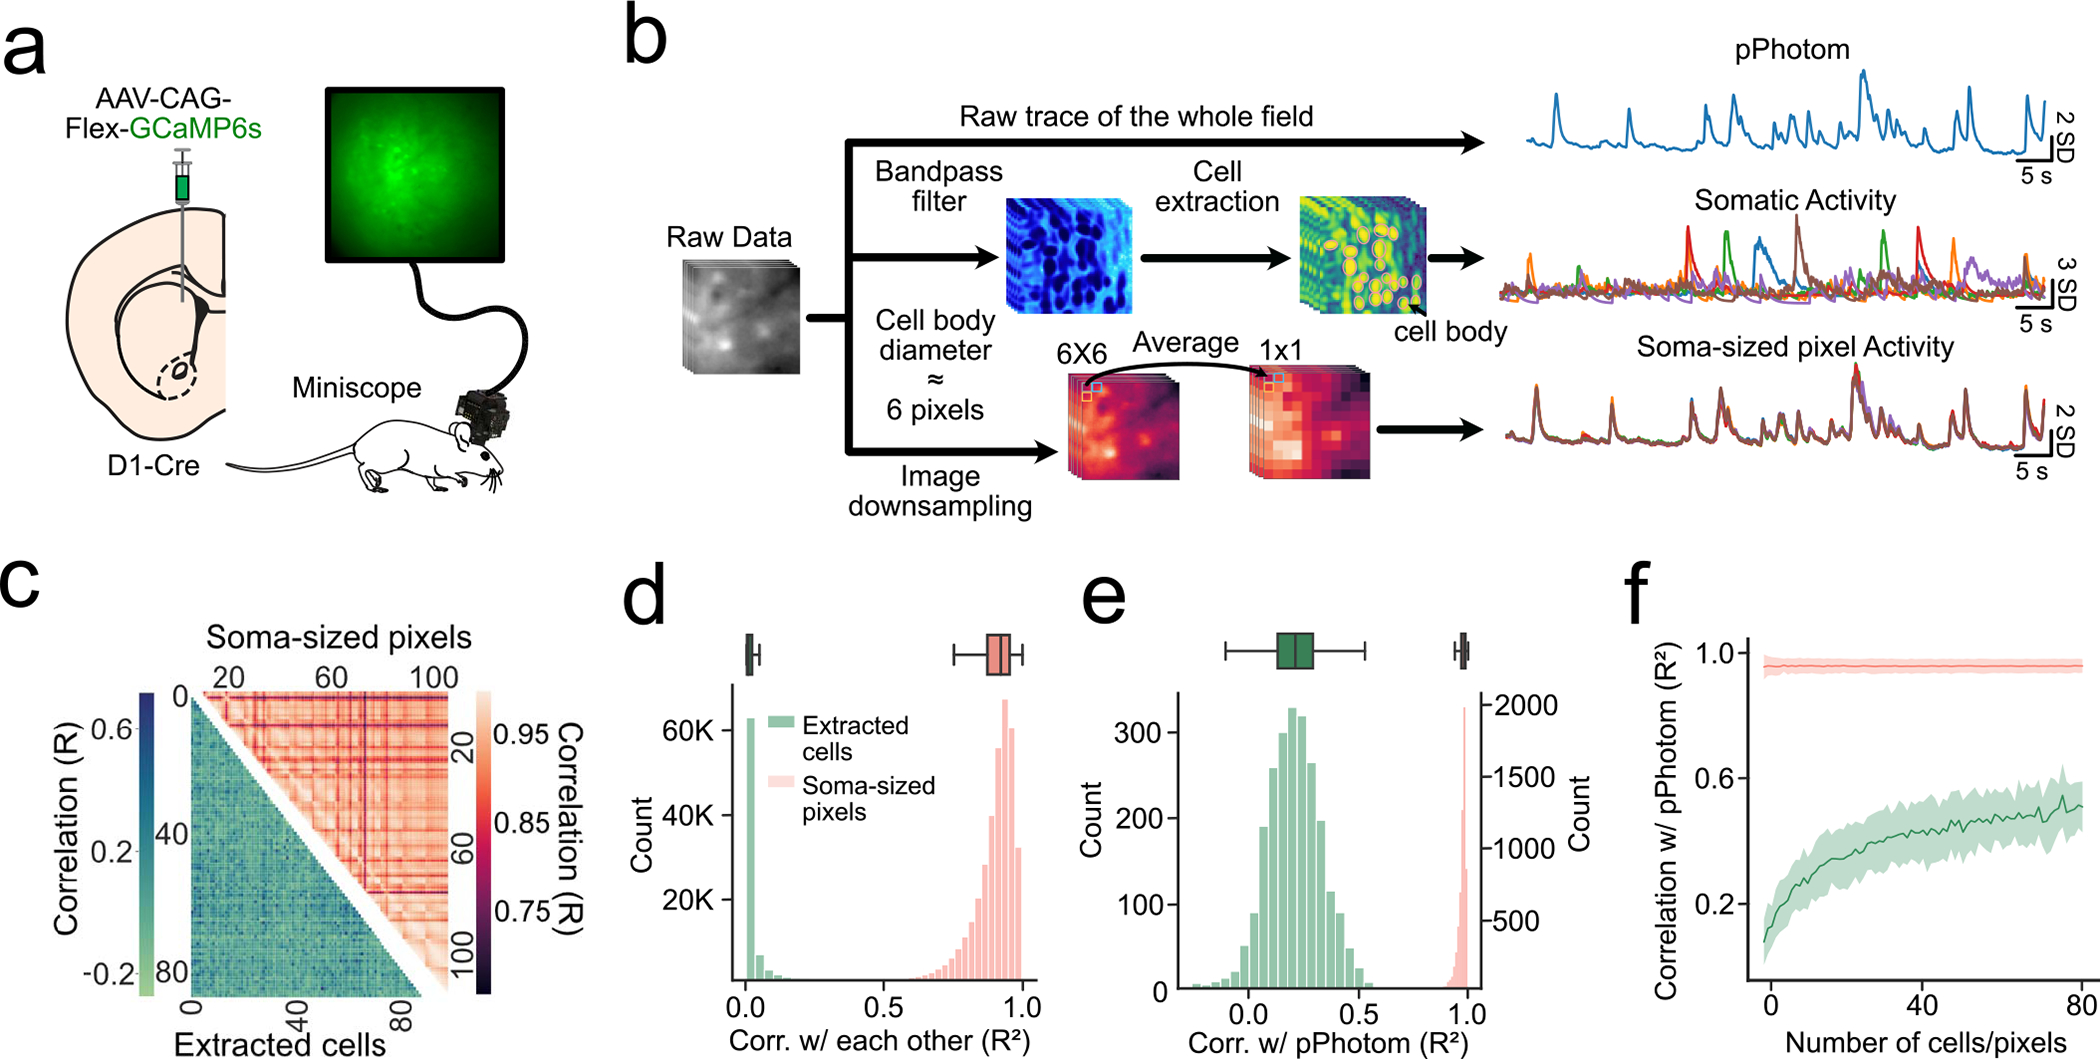
(a) Experimental setup: D1-Cre mice were injected with Cre-dependent GCaMP6s in the DMS and imaged with a headmounted miniscope. (b), three signals were extracted from raw miniscope movies: 1) average of the entire field (pPhotom), 2) somatic signals (via CNMFe cell extraction), and 3) soma-sized regions (6 × 6 pixels) throughout the field. (c) Representative heatmap showing correlations among extracted somatic signals (bottom), and among each soma-sized pixel (top). (d) (Bottom) Distribution of all correlations among extracted cells or soma-sized pixels (n = 6 mice, 9 subfields/movies per mouse, 80 ± 12 extracted cells or soma-sized pixels per subfield). (Top) Boxplot showing distribution of correlations among extracted cells or soma-sized pixels per mouse (n = 6 mice). (e) (Bottom) Distribution of all correlations between extracted cells or soma-sized pixels with pPhotom (n = 6 mice, 9 subfields/movies per mouse, 80 ± 12 extracted cells or soma-sized pixels per subfield). (Top) Boxplot showing distribution of correlations between extracted cells or soma-sized pixels with pPhotom per mouse (n = 6 mice). (f) Correlation between extracted cells or soma-sized pixels with pPhotom as more cells or pixels were averaged. Shaded regions represent 95% confidence intervals. Box plots central value denotes the median, box bounds denote upper and lower quartiles and whiskers denote ±1.5 interquartile range.
Extended Data Fig. 6 |. Out-of-focus cells do not contribute substantially to the pPhotom signal.
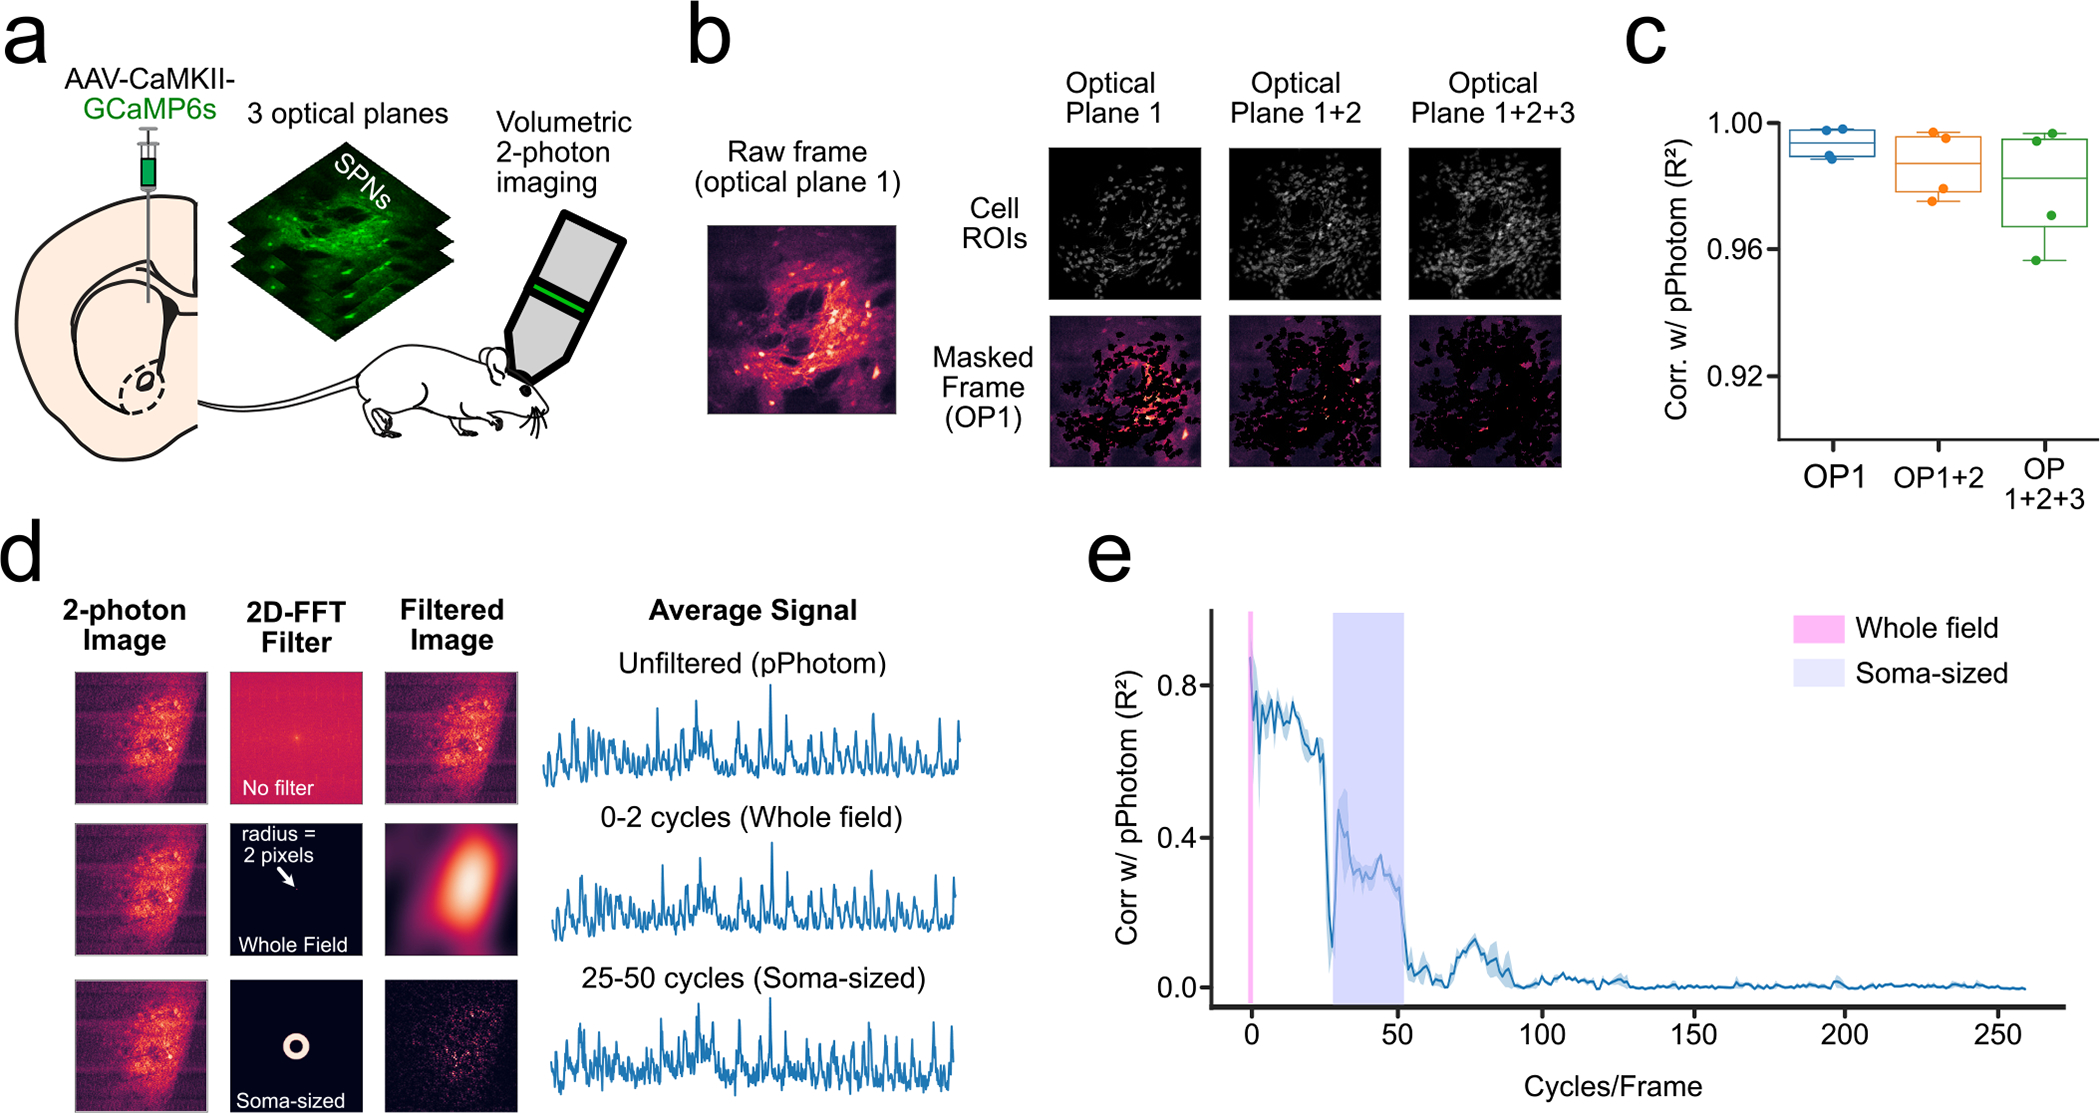
(a) Experimental set-up: we expressed GCaMP6s in the DMS and performed volumetric two-photon imaging of three consecutive optical planes. (b) The raw movie from optical plane 1 (OP1) was masked with somatic ROIs from either optical plane 1 only (OP1), or optical plane 1 and optical plane 2 (OP1 + 2), or from the three optical planes (OP1 + 2 + 3). (c) Correlations between the average signal of the raw movie (pPhotom) and the masked movies (n = 4 mice). (d) 2D-FFts were used to test the contribution of different spatial frequencies. Top row shows an example of the transformation between the time and space domain without applying any bandpass filter. Bottom row shows the same process but applying a bandpass filter that includes only the signal that is between 0 and 2 cycles per frame (full-frame). (e) Correlations between the pPhotom signal and signal from different spatial frequencies (bin-width = 2 cycles/frame). Line plots show mean±95% confidence interval. Box plots central value denotes the median, box bounds denote upper and lower quartiles and whiskers denote ±1.5 interquartile range.
Supplementary Material
Acknowledgements
We thank the HHMI GENIE project for GCaMP reagents and M. Creed for critical reading of the manuscript. Research was supported by the American Heart Association Pre-Doctoral Fellowship (A.A.L), NIDDK DK126355 (B.A.M.-A.), Howard Hughes Medical Institute Hanna H. Gray Fellowship (B.A.), NINDS R35 Diversity Research Supplement Funding, 3R35NS097306-04S1 (B.A.), NINDS R01NS122840 (J.G.P.), Washington University Diabetes Research Center (DK020579, A.V.K.), Nutrition Obesity Research Center (DK056341, A.V.K.), McDonnell Centers for Systems and Cellular Neuroscience (A.V.K.).
Footnotes
Competing interests
The authors declare no competing interests.
Reporting summary. Further information on research design is available in the Nature Research Reporting Summary linked to this article.
Code availability
All custom code generated to analyze the datasets used in the current study are available in the Open Science Framework repository, at https://osf.io/8j7g2/.
Extended data is available for this paper at https://doi.org/10.1038/s41593-022-01152-z.
Peer review information Nature Neuroscience thanks Bernardo Sabatini, Garret Stuber, and the other, anonymous, reviewer(s) for their contribution to the peer review of this work.
Reprints and permissions information is available at www.nature.com/reprints.
Supplementary information The online version contains supplementary material available at https://doi.org/10.1038/s41593-022-01152-z.
Data availability
The datasets generated during and/or analyzed during the current study are available in the Open Science Framework repository, at https://osf.io/8j7g2/. Source data are provided with this paper.
References
- 1.Markowitz JE et al. The striatum organizes 3D behavior via moment-to-moment action selection. Cell 174, 44–58.e17 (2018). [DOI] [PMC free article] [PubMed] [Google Scholar]
- 2.Zhang Y et al. Fast and sensitive GCaMP calcium indicators for imaging neural populations. Preprint at bioRxiv 10.1101/2021.11.08.467793 (2021). [DOI] [PMC free article] [PubMed] [Google Scholar]
- 3.Giovannucci A et al. CaImAn an open source tool for scalable calcium imaging data analysis. eLife 8, e38173 (2019). [DOI] [PMC free article] [PubMed] [Google Scholar]
- 4.Parker JG et al. Diametric neural ensemble dynamics in parkinsonian and dyskinetic states. Nature 557, 177–182 (2018). [DOI] [PMC free article] [PubMed] [Google Scholar]
- 5.Pnevmatikakis EA et al. Simultaneous denoising, deconvolution, and demixing of calcium imaging data. Neuron 89, 285–299 (2016). [DOI] [PMC free article] [PubMed] [Google Scholar]
- 6.Kawaguchi Y, Wilson CJ & Emson PC Projection subtypes of rat neostriatal matrix cells revealed by intracellular injection of biocytin. J. Neurosci. 10, 3421–3438 (1990). [DOI] [PMC free article] [PubMed] [Google Scholar]
- 7.Preston RJ, Bishop GA & Kitai ST Medium spiny neuron projection from the rat striatum: an intracellular horseradish peroxidase study. Brain Res 183, 253–263 (1980). [DOI] [PubMed] [Google Scholar]
- 8.Inan H et al. Fast and statistically robust cell extraction from large-scale neural calcium imaging datasets. Preprint at bioRxiv 10.1101/2021.03.24.436279 (2021). [DOI] [Google Scholar]
- 9.Zhou P et al. Efficient and accurate extraction of in vivo calcium signals from microendoscopic video data. eLife 7, e28728 (2018). [DOI] [PMC free article] [PubMed] [Google Scholar]
- 10.Mukamel EA, Nimmerjahn A & Schnitzer MJ Automated analysis of cellular signals from large-scale calcium imaging data. Neuron 63, 747–760 (2009). [DOI] [PMC free article] [PubMed] [Google Scholar]
- 11.Rehani R et al. Activity patterns in the neuropil of striatal cholinergic interneurons in freely moving mice represent their collective spiking dynamics. eNeuro 6, ENEURO.0351–18.2018 (2019). [DOI] [PMC free article] [PubMed] [Google Scholar]
- 12.London TD et al. Coordinated ramping of dorsal striatal pathways preceding food approach and consumption. J. Neurosci. 38, 3547–3558 (2018). [DOI] [PMC free article] [PubMed] [Google Scholar]
- 13.Chang C-J et al. Behavioral clusters revealed by end-to-end decoding from microendoscopic imaging. Preprint at bioRxiv 10.1101/2021.04.15.440055 (2021). [DOI] [Google Scholar]
- 14.Trautmann EM et al. Dendritic calcium signals in rhesus macaque motor cortex drive an optical brain-computer interface. Nat. Commun. 12, 3689 (2021). [DOI] [PMC free article] [PubMed] [Google Scholar]
- 15.Keemink SW et al. FISSA: a neuropil decontamination toolbox for calcium imaging signals. Sci. Rep. 8, 3493 (2018). [DOI] [PMC free article] [PubMed] [Google Scholar]
- 16.Chen Y et al. Soma-targeted imaging of neural circuits by ribosome tethering. Neuron 107, 454–469.e6 (2020). [DOI] [PMC free article] [PubMed] [Google Scholar]
- 17.Shemesh OA et al. Precision calcium imaging of dense neural populations via a cell-body-targeted calcium indicator. Neuron 107, 470–486.e11 (2020). [DOI] [PMC free article] [PubMed] [Google Scholar]
- 18.Menegas W, Babayan BM, Uchida N & Watabe-Uchida M Opposite initialization to novel cues in dopamine signaling in ventral and posterior striatum in mice. eLife 6, e21886 (2017). [DOI] [PMC free article] [PubMed] [Google Scholar]
- 19.Shindou T, Shindou M, Watanabe S & Wickens J A silent eligibility trace enables dopamine-dependent synaptic plasticity for reinforcement learning in the mouse striatum. Eur. J. Neurosci. 49, 726–736 (2019). [DOI] [PMC free article] [PubMed] [Google Scholar]
- 20.Yamaguchi K et al. A behavioural correlate of the synaptic eligibility trace in the nucleus accumbens. Sci. Rep. 12, 1921 (2022). [DOI] [PMC free article] [PubMed] [Google Scholar]
- 21.Schindelin J et al. Fiji: an open-source platform for biological-image analysis. Nat. Methods 9, 676–682 (2012). [DOI] [PMC free article] [PubMed] [Google Scholar]
- 22.Pnevmatikakis EA & Giovannucci A NoRMCorre: an online algorithm for piecewise rigid motion correction of calcium imaging data. J. Neurosci. Methods 291, 83–94 (2017). [DOI] [PubMed] [Google Scholar]
- 23.Matikainen-Ankney BA et al. An open-source device for measuring food intake and operant behavior in rodent home-cages. eLife 10, e66173 (2021). [DOI] [PMC free article] [PubMed] [Google Scholar]
Associated Data
This section collects any data citations, data availability statements, or supplementary materials included in this article.
Supplementary Materials
Data Availability Statement
The datasets generated during and/or analyzed during the current study are available in the Open Science Framework repository, at https://osf.io/8j7g2/. Source data are provided with this paper.


