Abstract
Understanding biological mechanisms operating in cells is one of the major goals of biology. Since heterogeneity is the fundamental property of cellular systems, single cell measurements can provide more accurate information about the composition, dynamics, and regulatory circuits of cells than population‐averaged assays. Electrochemiluminescence (ECL), the light emission triggered by electrochemical reactions, is an emerging approach for single cell analysis. Numerous analytes, ranging from small biomolecules such as glucose and cholesterol, proteins and nucleic acids to subcellular structures, have been determined in single cells by ECL, which yields new insights into cellular functions. This review aims to provide an overview of research progress on ECL principles and systems for single cell analysis in recent years. The ECL reaction mechanisms are briefly introduced, and then the advances and representative works in ECL single cell analysis are summarized. Finally, outlooks and challenges in this field are addressed.
Keywords: electrochemiluminescence, single cells, reaction mechanisms, biomolecules, cellular structures
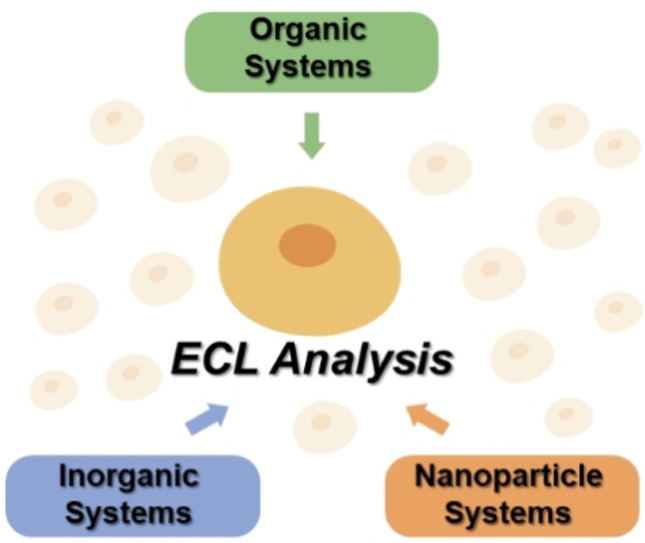
Electrochemiluminescence (ECL) with unique features including near‐zero background, high sensitivity and facile spatiotemporal control is an emerging method for single cell analysis. This review summarizes recent advances in ECL single cell analysis, highlighting the strategies and applications involved in organic systems, inorganic systems and nanoparticle systems.
1. Introduction
Electrochemiluminescence (ECL), also called electrogenerated chemiluminescence, is the light emission triggered by electrochemical reactions. [1] For example, upon applying a voltage to the electrode in a solution containing the luminophore, reactive intermediates are produced to form excited states that emit light. ECL studies originated in the 1920s, [2] while the first detailed ECL studies were reported in the mid‐1960s. [3] After being extensively studied for decades, ECL has become a powerful technique with applications ranging from light‐emitting devices, environment detection, genotoxicity screening to bioanalysis. [4] Luminol, tris(2,2′‐bipyridine)ruthenium (II) (Ru(bpy)3 2+) and nanoparticles are the most frequently used ECL luminophores in recent studies. In particular, Ru(bpy)3 2+‐based ECL system has been successfully commercialized and used worldwide in clinical immunoassays for in vitro diagnosis (IVD).
Photoluminescence (PL), chemiluminescence (CL) and ECL are three typical types of luminescence. Compared with the most popular PL methods for investigating cellular contents, ECL is produced in the absence of scattered light or interference from fluorescent impurities, which avoids the autofluorescence of biological samples and decreases the background. [5] Both CL and ECL undergo highly energetic electron‐transfer reactions to produce light. However, CL is initiated by mixing necessary reagents and controlled by careful manipulation of fluid flow. While ECL is initiated and controlled by electrical signals, which occurs only in the vicinity of the electrode surface, allowing the duration and position of light emission to be precisely modulated. The elegant combination of electrochemical and spectroscopic methods brings ECL remarkable advantages such as extremely high sensitivity, near‐zero background, superior spatiotemporal control and wide dynamic range. [6] Benefiting from these unique features, it is particularly suitable for biosensing. [7] Metal ions, small biomolecules, proteins and nucleic acids have all been determined by ECL assays. [8]
Single cells are the minimal functional unit of life. Understanding how individual cells process information and respond to perturbations is a central goal of biology. [9] After decades of probing, heterogeneity has been recognized as a universal property within cellular populations and is critical for cell fate decisions. For instance, variation in cell phenotypes within a tumor is the major obstacle to effective cancer treatment. [10] Single cell analysis has challenged prevailing ideas obtained by population‐averaged assays and opened new ways of understanding the development and progression of diseases. [11] However, the analysis is quite challenging. First, the typical size of a mammalian cell is only a few picolitres. Second, the absolute number of target molecules is tiny while the number of different molecules is large. In addition, highly dynamic intra‐ or intercellular processes impose additional complexity.
Fluorescence microscopy, mass spectrometry, electrochemical analysis and microfluidics are major techniques capable of measuring single cells. [12] Some excellent reviews have summarized these methods and new analytical methods are constantly being developed. [13] Benefiting from its low background, facile spatiotemporal control, robustness, versatility and high surface sensitivity, ECL has manifested itself as a powerful tool in single cell analysis. In this review, the recent advances in single cell analysis by ECL will be highlighted. After introducing briefly the main ECL systems and mechanisms involved in ECL cytosensors, we shall summarize the applications of organic systems, inorganic systems and nanoparticle systems in single cell analysis. Finally, remaining challenges and future perspectives in this field will be discussed.
2. ECL Systems
According to the types of luminophores, ECL systems can be classified into three categories, namely organic systems, inorganic systems and nanomaterial‐based systems.
2.1. Organic Systems
The early ECL studies originated with organic systems in the 1920s when Dufford et al. observed the light emission of Grignard compounds from electrode surface for the first time. [2] Later, Harvey reported the luminescence of luminol during electrolysis. [14] Polyaromatic hydrocarbons (PAHs, such as rubrene and 1,10‐diphenylanthracene), luminol and their derivatives are typical luminophores in organic systems. A double potential step was applied to an electrode by alternatively pulsing the applied potential at a negative and a positive enough value. During the potential pulsing, PAH is electrochemically reduced and oxidized, forming the radical anion (PAH⋅−) and cation (PAH⋅+) respectively, which are annihilated to generate the excited state (PAH*) that emits light. This route is called “annihilation ECL”. However, the potential window of aqueous solution is too narrow to produce both radicals necessary in annihilation ECL conveniently, which limits its practical applications in bioanalysis.
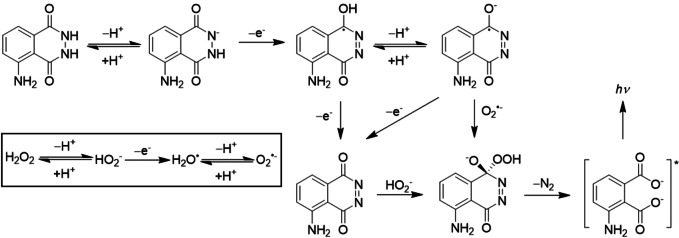
Luminol is another classical organic luminophore that continues to arouse interest. It can produce ECL under a wide range of conditions, which include the presence or absence of oxygen and/or hydrogen peroxide (H2O2), different electrode potentials and potential scanning directions. The excited state of luminol is formed by bond‐breaking reactions. Figure 1 summarizes one possible mechanistic pathway of ECL generation by luminol and H2O2. Basically, luminol deprotonates and then is oxidized to form luminol radical. This intermediate undergoes further oxidation in the presence of H2O2 to produce the excited species. The possibility of coupling ECL reactions with enzyme‐catalyzed reactions that generate H2O2 makes luminol suitable for the detection of a variety of cellular substances. [15] However, the luminescence of luminol is much stronger in alkaline solutions than that in neutral or weakly acidic ones. A compromise should be found between the basic condition needed for luminol and that for the enzyme. Recently, L012 (8‐amino‐5‐chloro‐7‐phenylpyrido[3,4‐d]pyridazine‐1,4(2H, 3H)‐dione), an analog of luminol that enables highly sensitive ECL measurements in neutral conditions, is a promising alternative to luminol, and has been successfully used in ECL single cell analysis. [16] Besides, new concepts and principles such as aggregation‐induced emission (AIE) ECL and circularly‐polarized ECL have been developed, which opened a new range of applications for organic luminophores. [17]
Figure 1.
Mechanistic pathways of ECL generation by luminol and H2O2.
2.2. Inorganic Systems
Inorganic systems, which mainly contain metal complexes, [18] have played a pivotal role in analytical chemistry. The most widely used and most thoroughly studied metal complex is Ru(bpy)3 2+, the benchmark among ECL luminophores since it was first reported in 1972. [19] The advantages of Ru(bpy)3 2+ include the excellent properties in photochemistry and electrochemistry, strong luminescence and stability, and its solubility in both aqueous and nonaqueous solutions. Ru(bpy)3 2+ is the main competitor to luminol in analytical ECL. It can be regenerated in ECL reactions while luminol undergoes irreversible oxidation reactions. Ru(bpy)3 2+ can produce ECL by two dominant pathways, namely the annihilation route and the co‐reactant route. Modern ECL applications of Ru(bpy)3 2+ are almost exclusively based on the latter.
Figure 2 shows four possible reaction routes of Ru(bpy)3 2+/tri‐n‐propylamine (TPrA) co‐reactant system. Figure 2a presents the classical oxidative‐reduction ECL. Ru(bpy)3 2+ and TPrA are both oxidized to generate Ru(bpy)3 3+ and a radical cation, TPrA⋅+, which loses a proton to form the strongly reducing TPrA⋅. This radical further reduces Ru(bpy)3 3+ into Ru(bpy)3 2+*, which relaxes to the ground state and emits light. In a concomitant pathway, Ru(bpy)3 2+ is reduced to Ru(bpy)3 + by TPrA⋅ and the subsequent annihilation reaction produces Ru(bpy)3 2+* (Figure 2b).
Figure 2.
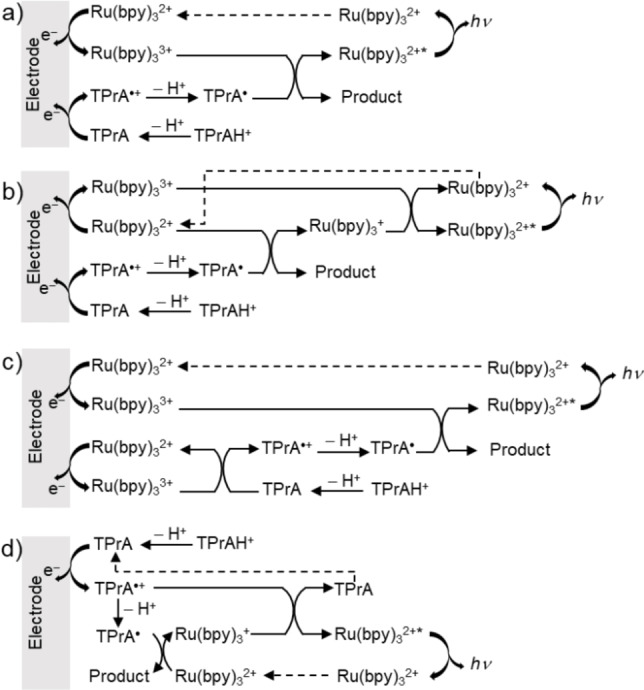
Schemes for the mechanisms involved in Ru(bpy)3 2+/TPrA co‐reactant ECL system.
In the “catalytic route” (Figure 2c), electrogenerated Ru(bpy)3 3+ reacts with TPrA to produce TPrA⋅+. The contribution of this route to the overall ECL process depends on the concentration of Ru(bpy)3 2+. It is favored when relatively high concentrations of Ru(bpy)3 2+ are used. In contrast, the last ECL pathway (Figure 2d), namely the so‐called low‐oxidation potential (LOP) ECL, is significant particularly in dilute Ru(bpy)3 2+ solutions with high concentrations of TPrA. Thus, the ECL signals obtained in sensing systems with Ru(bpy)3 2+ as ECL labels mainly originate from LOP ECL. In this case, only the co‐reactant is oxidized at low potentials. Ru(bpy)3 2+* is generated via the reaction between Ru(bpy)3 + and TPrA⋅+. LOP ECL is the basis for commercial magnetic bead‐based immunoassays.
The introduction of ECL microscopy is an important breakthrough to elucidate ECL mechanisms. [20] For instance, mapping ECL reactivity on Ru(bpy)3 2+‐labeled microbeads demonstrated the generation of excited states at a micrometric distance from the electrode surface, indicating the surface‐confined nature of “LOP route”. [21] Imaging the thickness of ECL layer by using vertically aligned microtube electrodes proves the occurrence of “catalytic route”, through which the ECL‐emitting layer can be extended. [22] These results contribute to the rational design of ECL systems for single cell analysis.
2.3. Nanoparticle Systems
Nanomaterial‐based ECL luminophores mainly include semiconductor quantum dots (QDs), carbon‐based materials, and noble metal clusters. [23] Although the structures of nanomaterials are complicated, the ECL of nanomaterials follows the general annihilation and co‐reactant ECL routes as discussed above. One common feature of nanoparticles needed to notice is the red‐shifted ECL spectrum of nanomaterials with respect to their PL one, which is because ECL probes the surface state while PL provides information about the interior of nanoparticles. [24]
3. Strategies and Applications
3.1. Luminol and Enzymes
As mentioned above, the main interest in luminol ECL is coupling the light‐emitting reaction with biological processes and enzymatic systems that generate H2O2. In a pioneering work reported by Ma et al., cells were incubated on the surface of ITO electrode. [25] As shown in Figure 3a, a pinhole with a diameter of 100 μm was prepared and placed between the ITO electrode and the PMT window. The density of cells was adjusted so that only one cell is exposed to the photomultiplier tube (PMT). Cholesterol oxidase in solution reacts with active membrane cholesterol to generate H2O2, which remarkably promotes the ECL intensity of luminol. The differences between ECL signals obtained before and after the introduction of cholesterol oxidase indicate the amount of active cholesterol at one cell. After removing active membrane cholesterol by oxidases, the amount of inactive cholesterol can be also determined, which provides valuable information about the composition of membrane cholesterol and intracellular cholesterol trafficking at single cell level. [26]
Figure 3.
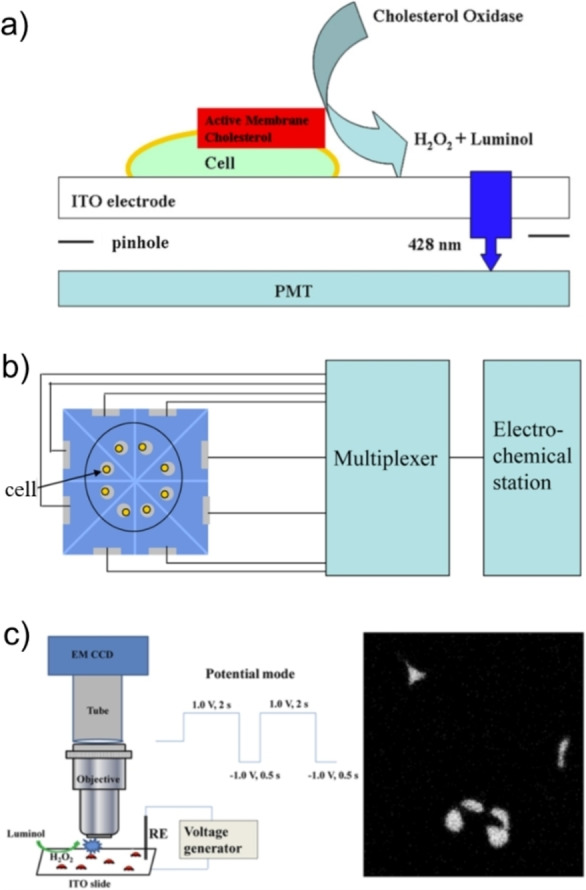
Different setups of luminol ECL for the analysis of cholesterol on cell membrane. (a) Analysis with a pinhole placed between the electrode and the PMT window. Reproduced with permission from Ref. [25] Copyright 2013, American Chemical Society. (b) Serial analysis with a microelectrode array. Reproduced with permission from Ref. [16] Copyright 2014, American Chemical Society. (c) ECL imaging of cholesterol. Reproduced with permission from Ref. [30] Copyright 2015, American Chemical Society.
Enzyme cocktails are designed for ECL detection when appropriate oxidase is unavailable. For example, by treating cells with an enzyme cocktail, phosphatidylserine in the plasma membrane is first converted to phosphatidic acid and serine by phospholipase D. The product serine is subsequently oxidized by L‐amino acid oxidase to yield H2O2. [27] In addition, cholesterol and sphingomyelin on the cell membrane could be co‐monitored by serial enzymatic reactions which produce H2O2 successively. [28] This method is simple, low‐cost, fast and versatile for single cell analysis. Many biomolecules can be detected, as long as there are corresponding oxidases or enzyme cocktails to produce H2O2. [29]
The “pinhole” setup allows only one cell to be detected in a single run. To improve the throughput, a microelectrode array consisting of eight electrodes was prepared. [16] As shown in Figure 3b, single cells were directly incubated on the cell‐sized microelectrodes. The voltage was applied to eight microelectrodes sequentially with a multiplexer while the ECL intensity was recorded by PMT. A relatively high throughput was achieved by analyzing eight cells in 22 s. However, the number of electrodes in such microelectrode arrays is limited, so is the analysis throughput.
Imaging methods could provide significant spatial information that intensity‐based measurements lack. Zhou et al. reported the first ECL imaging work for the parallel measurements of single cells. [30] As shown in Figure 3c, the basic setup of an ECL microscopy consists of an electrochemical cell, a voltage generator, and a microscope equipped with an electron multiplying charge coupled device (EMCCD). When capturing ECL images, external light sources are switched off and a suitable potential is applied to the electrode to launch ECL reactions. Owing to the adherence of cells on the electrode surface, the diffusion of L012 is slowed down and therefore the cells appear dark in ECL images. Comparing ECL images before and after the introduction of cholesterol oxidases, the difference reveals the amount of cholesterol. Although the local heterogeneity of membrane active cholesterol within single cells is observed in ECL images, the diffusion of luminol, H2O2, and ECL intermediates might delocalize the exact sites of reactions. To solve this problem, silica nanochannel membrane (SNM) is prepared on the ITO electrode, which restricts the lateral diffusion and minimizes the crosstalk from nearby microregions, thus improving the spatial resolution of ECL imaging. [31] Compared with the microelectrode array, ECL imaging could not only avoid the complex process of electrode fabrication, but also offer intrinsic advantages including high spatiotemporal resolution and compatibility for high throughput analysis.
Owing to the steric hindrance and insulation of cells, they are visualized as dark shadows in a negative manner by ECL. Liu et al. modified the electrode with chitosan to image cells in a positive mode. [32] The porous chitosan layer increases the distance between the basal cell membrane and the underlying electrode, allowing luminophores to diffuse into this space. The amount of ECL reagents below cells is increased, which guarantees the sensitivity of quantitative analysis. A luminous cell image can be obtained after H2O2 is released by cells.
ECL generated on the micro‐ and nano‐structures allows for the local sensing of single cells. For example, using gold microtube electrode ensembles as the working electrode, local H2O2 efflux was measured and its heterogeneity at subcellular level was revealed. [33] Steady‐state ECL signals of L012 were observed at single titanium dioxide nanoparticles, which allows for the continuous and temporally resolved ECL analysis of single cells. [34] LiFePO4 nanoparticles were employed to facilitate the ECL emission of L012 at a low voltage of 0.5 V, thus minimizing the electrochemical perturbation to living cells. [35]
Above works deal with molecules on cell membrane or released by cells, while intracellular measurements have been realized as well. Xu et al. prepared a microwell array to analyze intracellular analytes. [36] Single cells were retained in cell‐sized microwells and treated with L012, triton X‐100 and glucose oxidase simultaneously. Triton X‐100 breaks the cellular membrane and releases intracellular biomolecules, which further react with corresponding oxidases to yield H2O2. The microwells could not only slow down the diffusion of H2O2 and thus avoid the cross‐interference reactions, but also improve the throughput of analysis. [37] ECL signals from 64 cells can be read at once in an ECL image. Zhang et al. designed a functionalized nanoprobe to detect intracellular microRNA. [38] The nanoprobe can recognize microRNA and release drugs that stimulate cells to produce H2O2. Therefore, cells with the target microRNA become luminous in ECL images. A similar qualitative method was also applied for detecting intracellular nucleolin. [39] The O2 consumption of cell spheroids can be analyzed by ECL imaging indirectly. [40] Dissolved O2 is first electrochemically reduced to H2O2, and consequently the ECL intensity of L012 is positively related to the concentration of O2 and negatively related to O2 consumption. Recently, a voltage modulated ECL method was reported to improve the sensitivity of L012/H2O2 system. [41] By imposing a small voltage upon a constant potential, the ECL intensity increased twofold, which is an effective way to promote the ECL intensity.
In another design, a microelectrode filled with chitosan and luminol is inserted into cells to probe the H2O2 inside cells. [43] Compared with the method involving the lysis of cells, this method is relatively safe for cells. Wang et al. decorated the tip of a nanopipette with a porous Pt deposit that is used as an open bipolar electrode (Figure 4). [42] The voltage drop is confined within the nanopipette tip, which allows the bipolar ECL to generate at a very low voltage. Inserting the nanopipette filled with L012 and oxidases into a cell, intracellular molecules can be loaded into the nanopipette and react with oxidases to produce H2O2, which enhances the ECL signal of L012 at the bipolar electrode. Intracellular H2O2, glucose and enzyme activity were determined by the wireless ECL approach.
Figure 4.
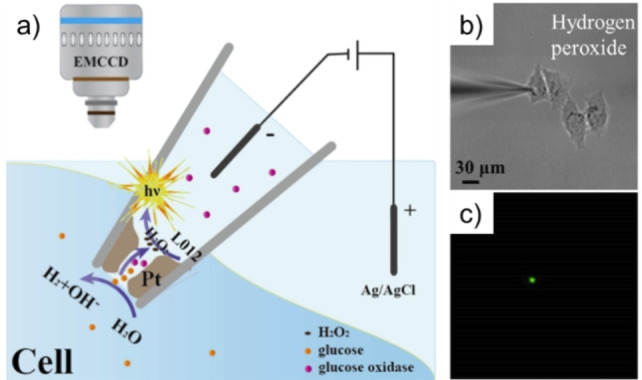
Representation of the bipolar ECL detection for intracellular wireless analysis (a). The bright field image (b) and ECL image (c) of the nanopipette for the detection of intracellular hydrogen peroxide. Reproduced with permission from Ref. [42] Copyright 2020, Wiley‐VCH.
Most of the luminol‐related ECL systems aim to detect small molecules, yet Zhang et al. reported an interesting work in which ECL‐based capacitance microscopy was established to analyze antigens on cell membrane. [44] Upon the binding of antibodies to carcinoembryonic antigen (CEA) on cell surface, local capacitance decreases, resulting in a relatively higher potential drop across the electrical double layer (V dl). Since the ECL intensity of L012 is positively related to V dl, the antigen is visualized as bright spots in ECL difference image. Using this method, 1 pg of CEA can be determined. This work not only achieves the label‐free imaging of antigens on cell surfaces, but also provides a new principle for the detection of low‐content biomarkers.
3.2. Ru(bpy)3 2+‐based Single Cell Imaging
In contrast to luminol ECL system, the majority of bioanalytical applications of Ru(bpy)3 2+ are based on immunolabelling. By attaching a suitable functional group to Ru(bpy)3 2+, it can be linked to proteins or nucleic acids for specific analysis. In 2009, Dolci et al. coated polystyrene microbeads with Ru(bpy)3 2+ using a biotin‐streptavidin interaction and achieved the ECL imaging of single microbeads, which demonstrated the possibility of ultrasensitive imaging of single cells by ECL. [45] Valenti et al. reported the first work for the spatially resolved ECL imaging of single cells in 2017. [46] As shown in Figure 5, they labeled streptavidin with ruthenium complex, which can react with biotin‐labeled cells. The whole cell becomes luminous in FL image, while ECL signals are localized only at cell borders. Such an interesting result is intrinsically associated with the ECL generation mechanisms. The electron tunnelling distance is only a few nanometers. Therefore, most of the ruthenium complex labeled on cell membrane cannot be oxidized directly. LOP ECL is the main route contributing to ECL generation. As the lifetime of the key intermediate TPrA⋅+ in LOP is limited, its diffusion distance is estimated to be several micrometers. Thus, ECL can only generate on the cell border. This work demonstrates the surface‐confined nature of ECL microscopy and contributes to a better understanding of ECL mechanisms and operating conditions for cell imaging.
Figure 5.
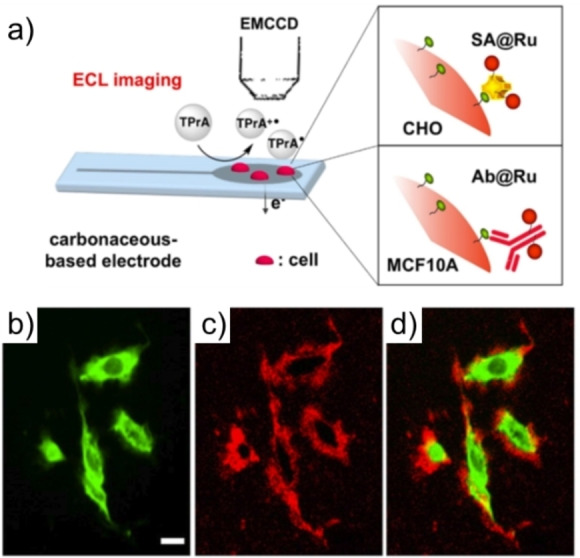
Schematic illustration of imaging single cells by ECL microscopy (a). PL (b), ECL (c) and the overlay (d) images of the same region of interest. Reproduced with permission from Ref. [46] Copyright 2017, American Chemical Society.
In a later work, Voci et al. further studied the vertical resolution of ECL imaging. [47] The focal plane of ECL imaging is found to be ca. 1.2 μm below that of FL imaging. The subwavelength vertical resolution of ECL is reminiscent of total internal reflection fluorescence (TIRF) microscopy. In addition, the whole basal membrane becomes luminous after destroying the membrane, suggesting the cell membrane acts as a physical barrier that blocks the diffusion of co‐reactant. The effect of photobleaching on ECL emission was investigated in the same configuration. [48] A linear correlation between the ECL decrease and the PL loss was obtained, which indicated the same excited state in PL and ECL. The combination of ECL and photobleaching might offer opportunities to investigate the molecular dynamics within cell membrane. Besides, the loss of ECL signals during successive recording was observed, which was proved to be related with electrochemical steps and can be effectively avoided by a cathodic regenerative treatment. [49]
Despite the achievements in ECL imaging with ruthenium as tags, the visualization of low‐content biomolecules is still challenging. Continuous efforts are devoted to amplifying ECL signals. Prostate specific antigen (PSA) at single cells was imaged by using Ru(bpy)3 2+‐doped silica/Au nanoparticles as ECL tags. [50] Liu et al. prepared a silica/Au nanoparticle to load Ru(bpy)3 2+ and amplify the ECL signals. The average number of active Ru(bpy)3 2+ embedded in each particle was calculated to be ca. 3.6×10⁴ and single membrane protein was visualized by ECL for the first time. [51]
Apart from conventional co‐reactant such as TPrA, some intracellular molecules can also function as sacrificial co‐reactant. Ma et al. reported the ECL generation of Ru(bpy)3 2+ with intracellular amino‐rich moieties, such as guanine in DNA and RNA. [52] In this case, only Ru(bpy)3 2+ is oxidized on the electrode surface and the catalytic route accounts for the light emission. As shown in Figure 6, cells display hierarchical signals in ECL images, which reflect the spatial distribution of DNA and RNA. Nucleolus, nucleoplasm and endoplasmic reticulum can be distinguished due to different densities of DNA and RNA. Unlike the short‐lived TPrA⋅+ in surface‐confined ECL microscopy, the electrogenerated intermediates Ru(bpy)3 3+ in catalytic ECL is stable. Therefore, if cells are labeled with co‐reactants while the emitter Ru(bpy)3 2+ is freely diffusing, the analysis of the whole cell rather than basal cell membrane could be achieved. [53] Chen et al. fabricated gold nanoparticles and loaded them with guanine‐rich single‐stranded DNA as co‐reactants. By labeling CEA with the nanoparticle, the entire cell membrane was imaged. [54]
Figure 6.
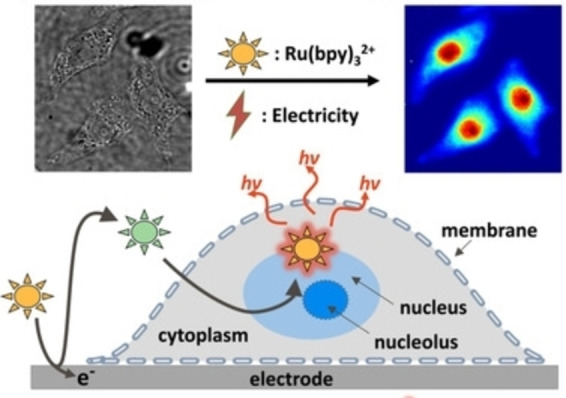
Schematic Diagram for the bio‐co‐reactant‐enhanced ECL Microscopy. Reproduced with permission from Ref. [52] Copyright 2021, Wiley‐VCH.
In above‐mentioned works, either Ru(bpy)3 2+ or the co‐reactant is constrained on cell surface or specific cellular structures, which is unable to diffuse and be oxidized at the electrode surface. The heterogenous ECL is triggered exclusively by the anodic oxidation of the other ECL specie, whose diffusion from the electrode surface is thus critical for light generation. In addition, cells are usually fixed and permeabilized in the labeling process. In contrast, both luminophores and co‐reactants are diffusive in homogenous ECL, which is intuitive and easy to operate. For instance, cell‐matrix adhesions can be visualized in a label‐free manner by ECL microscopy. [55] Single cells incubated on the SNM coated ITO electrode form close adhesions with the underlying electrode surface. The adhesions locally block both the ECL reaction and the diffusion of ECL species while being highlighted as dark maps in ECL images. Thanks to the surface confined feature of the direct oxidative‐reduction route and the enhanced ECL intensity on SNM, distinct visual contrast was obtained. This idea is in principle similar to the negative imaging of latent fingermarks by ECL. [56] Since the method is label‐free, it is rather suitable for living cell analysis. Dynamic variations of cell‐matrix adhesions and collective migration of cells were analyzed by the method.
Based on the negative imaging strategy, Gao et al. analyzed the morphological characteristics and states of single cells during stimulation. [57] Variations in cell‐matrix adhesions of vascular endothelial cells during tube formation were analyzed by Ino et al., in which different adhesion states between monolayer and tube network cultures were highlighted. [58] Apart from cells, mitochondria deposited on the electrode surface hinder the diffusion of ECL reagents as well, which produce negative optical contrast in ECL images. [59] The positive ECL imaging of cell adhesions was achieved by using a bipolar platinized gold nanoelectrode array. [60] Cells are incubated at the cathodic side, while ECL reactions occur at the anodic one. In situ generated O2 confined beneath cells contributed to high ECL intensity at the anodic side, allowing for the positive imaging of cell adhesions. This method is expected to be promising for imaging the redox activities of single cells.
By rationally regulating the concentrations of luminophore and/or co‐reactant, the ECL reaction pathways can be modulated and the emitting layer can be controlled to match with the spatial location of different cellular structures of interest. [61] As depicted in Figure 7, at a low concentration of luminophore, ECL is confined closely to the electrode surface and thus only reveals events in the thin ECL layer, which is particularly suitable for imaging cell‐matrix adhesions. While at a high concentration of Ru(bpy)3 2+, the ECL layer can be remarkably extended by decreasing the concentration of co‐reactants, thus allowing the sequential imaging of cell‐matrix adhesions and cell‐cell junctions in one sample. The results promise opportunities for spatially selective microimaging by ECL.
Figure 7.
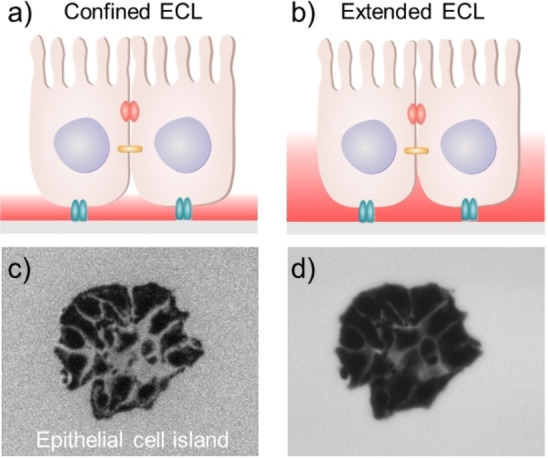
Illustration of modulating the thickness of ECL layer for imaging an epithelial cell island (a, b). The sequential imaging of cell‐matrix adhesions (c) and cell‐cell junctions (d). Reproduced with permission from Ref. [61] Copyright 2021, Wiley‐VCH.
Above works use ECL as the indicating signal for target biomolecules or structures, while in a very recent work, ECL was applied as both the external light source for photodynamic therapy (PDT) and in situ imaging tool for cell imaging. [62] The photosensitizer chlorin e6 in cells could absorb the ECL emitted on the electrode surface and sensitize O2 to produce reactive oxygen species to kill cells. The variations in cell morphology, cell‐matrix adhesions, as well as the permeability of cell membrane during ECL‐PDT were monitored. This work suggests the potential of ECL in clinical applications.
3.3. Single Cell Analysis Based on Nanoparticles
The ECL signals of MIL‐88B(Fe) nanocrystal‐anchored Ti microwires can be enhanced by H2O2, which was used for detecting H2O2 released by single cells. [63] Labeling proteins with nanomaterial‐based luminophores, single cells can be determined by ECL. Qiu et al. captured a single cell in the pipette and then transferred it onto the electrode surface. CD44 on cell surface was labeled with zinc‐coadsorbed carbon quantum dots (ZnCQDs) nanocomposites, and the heterogeneity of CD44 expression level on the same cell line was demonstrated. [64] In this configuration, the ECL intensity can be enhanced after propping up cells with 11‐mercaptoundecanoic acid on the electrode, indicating the significance of spatial architecture design in ECL sensing interface. [65] The ECL intensity would decrease if platelets adhere to a nanocomposites‐labeled cell, which was applied for analyzing intercellular adhesion. [66]
L012 and graphitic‐phase carbon nitride (g‐C3N4) generate ECL at negative and positive potentials respectively. Using functionalized Au@L012 and g‐C3N4 to recognize epidermal growth factor receptor (EGFR) and phosphatidylserine (PS) on cell surface simultaneously, well‐separated ECL signals during a potential scanning can be obtained. [67] As both EGFR and PS are biomarkers for apoptosis, the imaging analysis of the apoptosis rate was achieved.
Wang et al. prepared tertiary amine conjugated polymer dots (TEA‐Pdots) as the ECL luminophore (Figure 8). [68] Due to fast intramolecular electron transfer and the conjugated superstructure, TEA‐Pdots generate strong ECL emissions without co‐reactant in solution. By using human epidermal growth factor receptor 2 (HER2) as the target, ECL imaging of membrane protein on living cells was achieved. It should be noted that only TEA‐Pdots located at the cell bottom can be oxidized on the electrode and emit light. Therefore, the basal membrane was analyzed.
Figure 8.
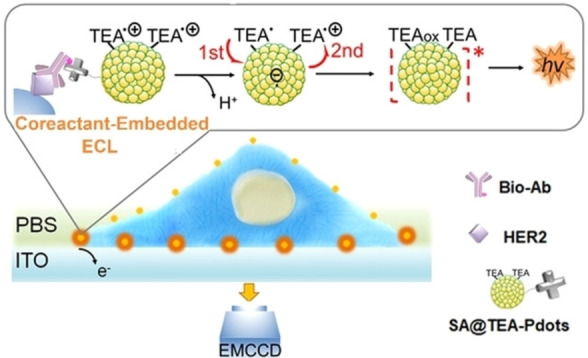
ECL mechanisms of TEA‐Pdots for ECL microimaging of proteins on single cells. Reproduced with permission from Ref. [68] Copyright 2021, Wiley‐VCH.
4. Summary and Outlook
The past few years have witnessed remarkable progress in ECL single cell analysis. Diverse targets including intracellular and extracellular small molecules, peptides and proteins, DNA, RNA and cellular structures have been analyzed by different ECL systems, which provides valuable information on cellular heterogeneity. However, challenges remain in this field. First, the spatial resolution should be further improved. When ECL luminophores are dissolved in solution, the spatial resolution can be affected by diffusional blurring. While in the labeling strategy, its spatial resolution at the sub‐micrometer level is limited by the optical diffraction as conventional optical microscopy. Second, ECL methods for living cell imaging are limited. Given ECL is a weak light emission process, the exposure time used for capturing ECL images of single cells is usually several seconds or sub‐seconds. It might lead to the lack of spatial‐temporal context, both of which are crucial to interpret the precise state of a cell. In addition, multiplexing analysis is not yet developed. As a myriad of substances control cellular activities, high‐parameter single cell technologies have particular potential for revealing biological mechanisms. Due to the complexity of the cellular environment and processes, it might be promising to combine ECL with different methods to provide complementary information. Compared with the ongoing fluorescence methods, single cell analysis by ECL is just beginning. New reagents, mechanisms and facilities are developed, showing additional promise in this field. [69] We believe further innovations in ECL measurements will help to achieve spatiotemporally resolved and high‐throughput analysis of single cells, enabling deeper understanding of cellular behavior and functions.
Conflict of interest
The authors declare no conflict of interest.
5.
Biographical Information
Hao Ding received her bachelor's and Ph.D. degrees in chemistry from Zhejiang University. She is now a postdoctoral fellow at Nanjing University. Her interests are focused on the electrochemical analysis of single cells.

Biographical Information
Dr. Bin Su is a full professor in Department of Chemistry at Zhejiang University. He received his Ph.D. degree in 2006 at the Swiss Federal Institute of Technology and completed his postdoc at the same institute before joining Zhejiang University. His interests cover interfacial electrochemistry, electrochemiluminescence methods and techniques, biosensors and in vivo bioanalysis.

Biographical Information
Dr. Dechen Jiang is currently a professor in School of Chemistry and Chemical Engineering at Nanjing University. He received his Ph.D. degree from Case Western Reserve University. After postdoctoral training at UNC‐Chapel Hill, he joined Nanjing University to start his independent research. His research focuses on the development of electrochemical methodology and instruments for the characterization of cellular activity and material features.

Acknowledgments
This work is supported by the Ministry of Science and Technology of China (2017YFA0700500), the National Natural Science Foundation of China (22125405, 22025403, 22074131, 21974060, 21874117) and the Jiangsu Funding Program for Excellent Postdoctoral Talent (20220ZB27).
Ding H., Su B., Jiang D., ChemistryOpen 2023, 12, e202200113.
Data Availability Statement
Data sharing is not applicable to this article as no new data were created or analyzed in this study.
References
- 1.
- 1a. Richter M. M., Chem. Rev. 2004, 104, 3003–3036; [DOI] [PubMed] [Google Scholar]
- 1b. Miao W., Chem. Rev. 2008, 108, 2506–2553; [DOI] [PubMed] [Google Scholar]
- 1c. Hesari M., Ding Z., J. Electrochem. Soc. 2016, 163, H3116–H3131. [Google Scholar]
- 2. Dufford R., Nightingale D., Gaddum L., J. Am. Chem. Soc. 1927, 49, 1858–1864. [Google Scholar]
- 3.
- 3a. Hercules D. M., Science 1964, 145, 808–809; [DOI] [PubMed] [Google Scholar]
- 3b. Visco R. E., Chandross E. A., J. Am. Chem. Soc. 1964, 86, 5350–5351; [Google Scholar]
- 3c. Marcus R. A., J. Chem. Phys. 1965, 43, 2654–2657; [Google Scholar]
- 3d. Santhanam K. S. V., Bard A. J., J. Am. Chem. Soc. 1965, 87, 139–140. [Google Scholar]
- 4.
- 4a. Liu Z., Qi W., Xu G., Chem. Soc. Rev. 2015, 44, 3117–3142; [DOI] [PubMed] [Google Scholar]
- 4b. Ma X., Gao W., Du F., Yuan F., Yu J., Guan Y., Sojic N., Xu G., Acc. Chem. Res. 2021, 54, 2936–2945. [DOI] [PubMed] [Google Scholar]
- 5. Zanut A., Fiorani A., Rebeccani S., Kesarkar S., Valenti G., Anal. Bioanal. Chem. 2019, 411, 4375–4382. [DOI] [PubMed] [Google Scholar]
- 6.
- 6a. Zhao W., Chen H.-Y., Xu J.-J., Chem. Sci. 2021, 12, 5720–5736; [DOI] [PMC free article] [PubMed] [Google Scholar]
- 6b. Ma C., Cao Y., Gou X., Zhu J.-J., Anal. Chem. 2020, 92, 431–454. [DOI] [PubMed] [Google Scholar]
- 7. Ding H., Guo W., Su B., ChemPlusChem 2020, 85, 725–733. [DOI] [PubMed] [Google Scholar]
- 8.
- 8a. Zhang J., Arbault S., Sojic N., Jiang D., Annu. Rev. Anal. Chem. 2019, 12, 275–295; [DOI] [PubMed] [Google Scholar]
- 8b. Guo W., Liu Y., Cao Z., Su B., J. Anal. Test. 2017, 1, 14. [Google Scholar]
- 9. Schmid A., Kortmann H., Dittrich P. S., Blank L. M., Curr. Opin. Biotechnol. 2010, 21, 12–20. [DOI] [PubMed] [Google Scholar]
- 10. Almendro V., Marusyk A., Polyak K., Annu. Rev. Pathol. Mech. Dis. 2013, 8, 277–302. [DOI] [PubMed] [Google Scholar]
- 11. Yuan G.-C., Cai L., Elowitz M., Enver T., Fan G., Guo G., Irizarry R., Kharchenko P., Kim J., Orkin S., Quackenbush J., Saadatpour A., Schroeder T., Shivdasani R., Tirosh I., Genome Biol. 2017, 18, 84. [DOI] [PMC free article] [PubMed] [Google Scholar]
- 12.
- 12a. Hu K., Nguyen T. D. K., Rabasco S., Oomen P. E., Ewing A. G., Anal. Chem. 2021, 93, 41–71; [DOI] [PMC free article] [PubMed] [Google Scholar]
- 12b. Oomen P. E., Aref M. A., Kaya I., Phan N. T. N., Ewing A. G., Anal. Chem. 2019, 91, 588–621. [DOI] [PubMed] [Google Scholar]
- 13.
- 13a. Stender A. S., Marchuk K., Liu C., Sander S., Meyer M. W., Smith E. A., Neupane B., Wang G., Li J., Cheng J. X., Huang B., Fang N., Chem. Rev. 2013, 113, 2469–2527; [DOI] [PMC free article] [PubMed] [Google Scholar]
- 13b. Zhang L., Vertes A., Angew. Chem. Int. Ed. 2018, 57, 4466–4477; [DOI] [PubMed] [Google Scholar]; Angew. Chem. 2018, 130, 4554–4566; [Google Scholar]
- 13c. Zhou J., Jiang D., Chen H.-Y., Sci. China Chem. 2017, 60, 1277–1284; [Google Scholar]
- 13d. Reece A., Xia B., Jiang Z., Noren B., McBride R., Oakey J., Curr. Opin. Biotechnol. 2016, 40, 90–96. [DOI] [PMC free article] [PubMed] [Google Scholar]
- 14. Harvey N., J. Phys. Chem. 1929, 33, 1456–1459. [Google Scholar]
- 15. Marquette C. A., Blum L. J., Anal. Bioanal. Chem. 2008, 390, 155–168. [DOI] [PubMed] [Google Scholar]
- 16. Tian C., Zhou J., Wu Z. Q., Fang D., Jiang D., Anal. Chem. 2014, 86, 678–684. [DOI] [PubMed] [Google Scholar]
- 17.
- 17a. Carrara S., Aliprandi A., Hogan C. F., De Cola L., J. Am. Chem. Soc. 2017, 139, 14605–14610; [DOI] [PubMed] [Google Scholar]
- 17b. Zinna F., Voci S., Arrico L., Brun E., Homberg A., Bouffier L., Funaioli T., Lacour J., Sojic N., Di Bari L., Angew. Chem. Int. Ed. 2019, 58, 6952–6956; [DOI] [PubMed] [Google Scholar]; Angew. Chem. 2019, 131, 7026–7030; [Google Scholar]
- 17c. Fiorani A., Difonzo M., Rizzo F., Valenti G., Curr. Opin. Electrochem. 2022, 34, 100998. [Google Scholar]
- 18. Chen L., Hayne D. J., Doeven E. H., Agugiaro J., Wilson D. J. D., Henderson L. C., Connell T. U., Nai Y. H., Alexander R., Carrara S., Hogan C. F., Donnelly P. S., Francis P. S., Chem. Sci. 2019, 10, 8654–8667. [DOI] [PMC free article] [PubMed] [Google Scholar]
- 19. Tokel N. E., Bard A. J., J. Am. Chem. Soc. 1972, 94, 2862–2863. [Google Scholar]
- 20. Rebeccani S., Zanut A., Santo C. I., Valenti G., Paolucci F., Anal. Chem. 2022, 94, 336–348. [DOI] [PMC free article] [PubMed] [Google Scholar]
- 21. Sentic M., Milutinovic M., Kanoufi F., Manojlovic D., Arbault S., Sojic N., Chem. Sci. 2014, 5, 2568–2572. [Google Scholar]
- 22. Guo W., Zhou P., Sun L., Ding H., Su B., Angew. Chem. Int. Ed. 2021, 60, 2089–2093; [DOI] [PubMed] [Google Scholar]; Angew. Chem. 2021, 133, 2117–2121. [Google Scholar]
- 23.
- 23a. Cao Z., Shu Y., Qin H., Su B., Peng X., ACS Cent. Sci. 2020, 6, 1129–1137; [DOI] [PMC free article] [PubMed] [Google Scholar]
- 23b. Hesari M., Ding Z., J. Am. Chem. Soc. 2021, 143, 19474–19485; [DOI] [PubMed] [Google Scholar]
- 23c. Zheng L., Chi Y., Dong Y., Lin J., Wang B., J. Am. Chem. Soc. 2009, 131, 4564–4565. [DOI] [PubMed] [Google Scholar]
- 24.
- 24a. Zhang X., Wang P., Nie Y., Ma Q., TrAC Trends Anal. Chem. 2021, 143, 116410; [Google Scholar]
- 24b. Chen Y., Zhou S., Li L., Zhu J.-J., Nano Today 2017, 12, 98–115. [Google Scholar]
- 25. Ma G., Zhou J., Tian C., Jiang D., Fang D., Chen H., Anal. Chem. 2013, 85, 3912–3917. [DOI] [PubMed] [Google Scholar]
- 26. Zuo H., Wang R., Jiang D., Fang D., ChemElectroChem 2017, 4, 1677–1680. [Google Scholar]
- 27. Wang R., Fang D., RSC Adv. 2017, 7, 12969–12972. [Google Scholar]
- 28. Huang S., Liu K., Jiang D., Fang D., Anal. Chem. 2019, 91, 1501–1506. [DOI] [PubMed] [Google Scholar]
- 29. Chen Y., Liu Y., Xia J., Liu J., Jiang D., Jiang D., RSC Adv. 2016, 6, 9518–9521. [Google Scholar]
- 30. Zhou J., Ma G., Chen Y., Fang D., Jiang D., Chen H., Anal. Chem. 2015, 87, 8138–8143. [DOI] [PubMed] [Google Scholar]
- 31. Zhang J., Ding H., Zhao S., Jiang D., Chen H., Electrochem. Commun. 2019, 98, 38–42. [Google Scholar]
- 32. Liu G., Ma C., Jin B., Chen Z., Zhu J.-J., Anal. Chem. 2018, 90, 4801–4806. [DOI] [PubMed] [Google Scholar]
- 33. Ding H., Guo W., Ding L., Su B., Chin. J. Chem. 2021, 39, 2911–2916. [Google Scholar]
- 34. Cui C., Chen Y., Jiang D., Chen H., Zhang J., Zhu J.-J., Anal. Chem. 2019, 91, 1121–1125. [DOI] [PubMed] [Google Scholar]
- 35. Zhang J., Jin R., Chen Y., Fang D., Jiang D., Sens. Actuators B 2020, 129208. [Google Scholar]
- 36.
- 36a. Xu J., Huang P., Qin Y., Jiang D., Chen H., Anal. Chem. 2016, 88, 4609–4612; [DOI] [PubMed] [Google Scholar]
- 36b. Xu J., Jiang D., Qin Y., Xia J., Jiang D., Chen H., Anal. Chem. 2017, 89, 2216–2220. [DOI] [PubMed] [Google Scholar]
- 37. Xia J., Zhou J., Zhang R., Jiang D., Jiang D., Anal. Bioanal. Chem. 2018, 410, 4787–4792. [DOI] [PubMed] [Google Scholar]
- 38. Zhang H., Gao W., Liu Y., Sun Y., Jiang Y., Zhang S., Anal. Chem. 2019, 91, 12581–12586. [DOI] [PubMed] [Google Scholar]
- 39. Gao W., Liu Y., Zhang H., Wang Z., ACS Sens. 2020, 5, 1216–1222. [DOI] [PubMed] [Google Scholar]
- 40. Hiramoto K., Ino K., Komatsu K., Nashimoto Y., Shiku H., Biosens. Bioelectron. 2021, 113123. [DOI] [PubMed] [Google Scholar]
- 41. Zhang J., Jin R., Fang D., Jiang D., Chem. Res. Chin. Univ. 2020, 41, 2421–2425. [Google Scholar]
- 42. Wang Y., Jin R., Sojic N., Jiang D., Chen H.-Y., Angew. Chem. Int. Ed. 2020, 59, 10416–10420; [DOI] [PubMed] [Google Scholar]; Angew. Chem. 2020, 132, 10502–10506. [Google Scholar]
- 43. He R., Tang H., Jiang D., Chen H., Anal. Chem. 2016, 88, 2006–2009. [DOI] [PubMed] [Google Scholar]
- 44. Zhang J., Jin R., Jiang D., Chen H., J. Am. Chem. Soc. 2019, 141, 10294–10299. [DOI] [PubMed] [Google Scholar]
- 45. Dolci L. S., Zanarini S., Della Ciana L., Paolucci F., Roda A., Anal. Chem. 2009, 81, 6234–6241. [DOI] [PubMed] [Google Scholar]
- 46. Valenti G., Scarabino S., Goudeau B., Lesch A., Jovic M., Villani E., Sentic M., Rapino S., Arbault S., Paolucci F., Sojic N., J. Am. Chem. Soc. 2017, 139, 16830–16837. [DOI] [PubMed] [Google Scholar]
- 47. Voci S., Goudeau B., Valenti G., Lesch A., Jovic M., Rapino S., Paolucci F., Arbault S., Sojic N., J. Am. Chem. Soc. 2018, 140, 14753–14760. [DOI] [PubMed] [Google Scholar]
- 48. Han D., Goudeau B., Manojlovic D., Jiang D., Fang D., Sojic N., Angew. Chem. Int. Ed. 2021, 60, 7686–7690; [DOI] [PubMed] [Google Scholar]; Angew. Chem. 2021, 133, 7764–7768. [Google Scholar]
- 49. Han D., Goudeau B., Jiang D., Fang D., Sojic N., Anal. Chem. 2021, 93, 1652–1657. [DOI] [PubMed] [Google Scholar]
- 50. Cao J.-T., Wang Y.-L., Zhang J.-J., Dong Y.-X., Liu F.-R., Ren S.-W., Liu Y.-M., Anal. Chem. 2018, 90, 10334–10339. [DOI] [PubMed] [Google Scholar]
- 51. Liu Y., Zhang H., Li B., Liu J., Jiang D., Liu B., Sojic N., J. Am. Chem. Soc. 2021, 143, 17910–17914. [DOI] [PubMed] [Google Scholar]
- 52. Ma C., Wu S., Zhou Y., Wei H.-F., Zhang J., Chen Z., Zhu J.-J., Lin Y., Zhu W., Angew. Chem. Int. Ed. 2021, 60, 4907–4914; [DOI] [PubMed] [Google Scholar]; Angew. Chem. 2021, 133, 4957–4964. [Google Scholar]
- 53. Ma C., Wang M.-X., Wei H.-F., Wu S., Zhang J.-R., Zhu J.-J., Chen Z., Chem. Commun. 2021, 57, 2168–2171. [DOI] [PubMed] [Google Scholar]
- 54. Chen Y., Gou X., Ma C., Jiang D., Zhu J.-J., Anal. Chem. 2021, 93, 7682–7689. [DOI] [PubMed] [Google Scholar]
- 55. Ding H., Guo W., Su B., Angew. Chem. Int. Ed. 2020, 59, 449–456; [DOI] [PubMed] [Google Scholar]; Angew. Chem. 2020, 132, 457–464. [Google Scholar]
- 56. Xu L., Li Y., Wu S., Liu X., Su B., Angew. Chem. Int. Ed. 2012, 51, 8068–8072; [DOI] [PubMed] [Google Scholar]; Angew. Chem. 2012, 124, 8192–8196. [Google Scholar]
- 57. Gao H., Han W., Qi H., Gao Q., Zhang C., Anal. Chem. 2020, 92, 8278–8284. [DOI] [PubMed] [Google Scholar]
- 58. Ino K., Komatsu K., Hiramoto K., Utagawa Y., Nashimoto Y., Shiku H., Electrochim. Acta 2022, 415, 140240. [Google Scholar]
- 59. Ma Y., Colin C., Descamps J., Arbault S., Sojic N., Angew. Chem. Int. Ed. 2021, 60, 18742–18749; [DOI] [PubMed] [Google Scholar]; Angew. Chem. 2021, 133, 18890–18897. [Google Scholar]
- 60. Qin X., Jin H. J., Li X., Li J., Pan J. B., Wang K., Liu S., Xu J.-J., Xia X.-H., Chem. Eur. J. 2022, 28, e202103964. [DOI] [PubMed] [Google Scholar]
- 61. Ding H., Zhou P., Fu W., Ding L., Guo W., Su B., Angew. Chem. Int. Ed. 2021, 60, 11769–11773; [DOI] [PubMed] [Google Scholar]; Angew. Chem. 2021, 133, 11875–11879. [Google Scholar]
- 62. Chen M.-M., Xu C.-H., Zhao W., Chen H.-Y., Xu J.-J., Angew. Chem. Int. Ed. 2022, 61, e202117401; [DOI] [PubMed] [Google Scholar]; Angew. Chem. 2021, 134, e202117401. [Google Scholar]
- 63. Jian X., Xu J., Wang Y., Zhao C., Gao Z., Song Y.-Y., Anal. Chem. 2021, 93, 11312–11320. [DOI] [PubMed] [Google Scholar]
- 64. Qiu Y., Zhou B., Yang X., Long D., Hao Y., Yang P., ACS Appl. Mater. Interfaces 2017, 9, 16848–16856. [DOI] [PubMed] [Google Scholar]
- 65. Long D., Chen C., Cui C., Yao Z., Yang P., Nanoscale 2018, 10, 18597–18605. [DOI] [PubMed] [Google Scholar]
- 66. Long D., Shang Y., Qiu Y., Zhou B., Yang P., Biosens. Bioelectron. 2018, 102, 553–559. [DOI] [PubMed] [Google Scholar]
- 67. Liu G., Jin B. K., Ma C., Chen Z., Zhu J.-J., Anal. Chem. 2019, 91, 6363–6370. [DOI] [PubMed] [Google Scholar]
- 68. Wang N., Gao H., Li Y., Li G., Chen W., Jin Z., Lei J., Wei Q., Ju H., Angew. Chem. Int. Ed. 2021, 60, 197–201; [DOI] [PubMed] [Google Scholar]; Angew. Chem. 2021, 133, 199–203. [Google Scholar]
- 69.
- 69a. Guo W., Ding H., Zhou P., Wang Y., Su B., Angew. Chem. Int. Ed. 2020, 59, 6745–6749; [DOI] [PubMed] [Google Scholar]; Angew. Chem. 2020, 133, 2117–221; [Google Scholar]
- 69b. Dong J., Lu Y., Xu Y., Chen F., Yang J., Chen Y., Feng J., Nature 2021, 596, 244–249; [DOI] [PubMed] [Google Scholar]
- 69c. Gao N., Zeng H., Wang X., Zhang Y., Zhang S., Cui R., Zhang M., Mao L., Angew. Chem. Int. Ed. 2022, 61, e202204485; [DOI] [PubMed] [Google Scholar]; Angew. Chem. 2022, 134, e202204485. [DOI] [PubMed] [Google Scholar]
Associated Data
This section collects any data citations, data availability statements, or supplementary materials included in this article.
Data Availability Statement
Data sharing is not applicable to this article as no new data were created or analyzed in this study.


