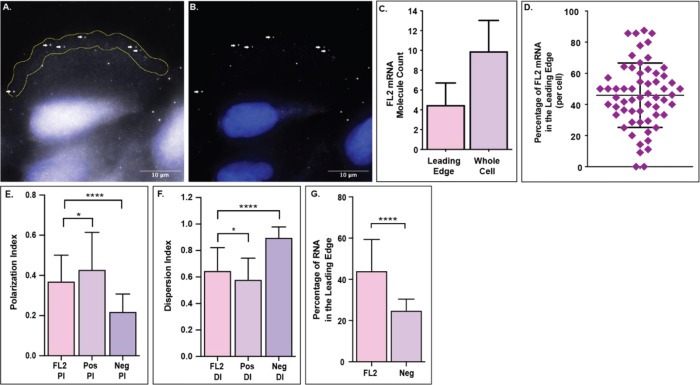
Figure 3. FL2 mRNA localizes to the leading edge of polarized cells.
FL2 mRNA in U2OS cells one hour after a scratch injury. A) Image of FL2 mRNA molecules (white) in a polarized cell on the scratch periphery. Yellow region indicates the leading edge, defined as the first five micrometers of the cell facing the scratch zone. White arrows indicate the FL2 mRNA molecules within the leading edge. DAPI nuclear stain in blue. B) Filtered image of the same cell from panel A to decrease background and emphasize FL2 mRNA localization within the cell. White arrows indicate the same FL2 mRNA molecules as in panel A. C) Quantification of FL2 mRNA within the leading edge (indicated by the yellow outline in panel A) compared to the amount of FL2 mRNA within the whole cell (n=60). D) Percentage of FL2 mRNA within the leading edge of individual cells on the scratch periphery. E) Polarization index (PI) of FL2 mRNA (n=98 pooled) compared to the PI of a positive control (Pos; β-actin mRNA; n=65) and negative control (Neg; IMP2 mRNA; n=33). F) Dispersion index (DI) of FL2 mRNA compared to the DI of a positive control (Pos; β-actin mRNA) and negative control (Neg; IMP2 mRNA). Same cells at panel E. G) Leading edge analysis of FL2 mRNA compared to a negative control (Neg; IMP2 mRNA) in the same cells. N=31.

