

Abstract
Background:
The most recent prevalence and incidence estimates for chlamydia and gonorrhea, the two most reported nationally notifiable conditions in the United States (US), were for 2008. We present updated estimates for the number of prevalent and incident chlamydial and gonococcal infections for 2018.
Methods:
We estimated chlamydial prevalence directly from the 2015–2018 cycles of the National Health and Nutrition Examination Survey (NHANES) and chlamydial incidence using a mathematical model primarily informed by NHANES and case report data. Total and antimicrobial resistant (AMR) gonococcal prevalence and incidence were estimated using mathematical models primarily informed by case report and Gonococcal Isolate Surveillance Program data. Estimates were calculated for the total population, all women, and all men aged 15–39 years, stratified by age group. Primary estimates represent medians and uncertainty intervals represent the 25th (Q1) and 75th (Q3) percentiles of the empirical frequency distributions of prevalence and incidence for each infection.
Results:
Among persons aged 15–39 years in the US in 2018, we estimate 2.35 (Q1=2.20, Q3=2.51) million prevalent and 3.98 (Q1=3.77, Q3=4.22) million incident chlamydial infections, and an estimated 209,000 (Q1=183,000, Q3=241,000) prevalent and 1.57 (Q1=1.44, Q3=1.72) million incident gonococcal infections. Of all gonococcal infections, there were 107,000 (Q1=94,000, Q3=124,000) prevalent and 804,000 (Q1=738,000, Q3=883,000) incident infections demonstrating AMR or elevated minimum inhibitory concentrations (MICs) to selected antibiotics.
Conclusions:
Chlamydia and gonorrhea were very common in the US in 2018. Estimates show that more than 800,000 newly acquired gonococcal infections in 2018 demonstrated resistance or elevated MICs to currently or previously recommended antibiotics.
Keywords: chlamydia, gonorrhea, antimicrobial resistant gonorrhea, prevalence, incidence
Short Summary
Chlamydia and gonorrhea are very common in the United States. This study provides prevalence and incidence estimates for both for 2018, including estimates for antimicrobial resistant gonorrhea.
Introduction
Having accurate measures of the prevalence and incidence of both chlamydia and gonorrhea is important for understanding the full burden of these diseases, preventing their adverse reproductive sequelae, and determining the effectiveness of national sexually transmitted infection (STI) prevention and control efforts. Understanding the full burden of gonococcal infections exhibiting antimicrobial resistance (AMR) has also become increasingly important due to continued decreases in gonococcal susceptibility in the United States (US) and the diminishing number of drugs available that are recommended for treatment. (1) AMR can lead to increased incidence and prevalence of all gonococcal infections as a result of the decreased ability to appropriately treat infections and the increased risk of continued transmission of AMR gonococcal strains.
Chlamydia and gonorrhea are both nationally notifiable conditions and are reported to the Centers for Disease Control and Prevention (CDC). Although case reports are often seen as a proxy for incidence, the two are not synonymous, as national case report data only represent diagnosed and reported infections. (2, 3) As most chlamydial and gonococcal infections are asymptomatic, many people are never diagnosed. (4) Consequently, chlamydia and gonorrhea case report data do not represent the full population burden of disease and should be interpreted cautiously as they are significantly impacted by changes in screening coverage, diagnostic test technologies, and reporting practices. (1, 4)
The number of prevalent and incident chlamydial and gonococcal infections have been estimated several times, most recently for 2008. (5–7) Given the availability of more recent data, improved estimation methods, and the continued need to monitor the burden of these two STIs, we present updated estimates of the prevalence and incidence of chlamydia and gonorrhea in the US for 2018.
Materials and Methods
We estimated the prevalence of chlamydia for 2018 directly from the 2015–2018 cycles of the National Health and Nutrition Examination Survey (NHANES) and 2018 chlamydial incidence using a mathematical model primarily informed by NHANES and case report data. (1, 8, 9) Total and AMR gonococcal prevalence and incidence for 2018 were estimated using mathematical models primarily informed by case report and Gonococcal Isolate Surveillance Program (GISP) data. (1) Given the use of case report data in our models, which are currently unable to adequately capture all anatomic sites of infection of a reported case, and data from NHANES and GISP, which are based on testing of urine and urethral specimens, respectively, our resulting prevalence and incidence estimates represent urogenital infections only and exclude infections at extragenital sites.
Estimates were calculated for the total population, all women, and all men aged 15–39 years, stratified by age group (15–24 and 25–39 years). The population of persons aged 15–39 years was selected based on chlamydia data availability in NHANES. To keep the age ranges the same between diseases, we chose to estimate gonococcal prevalence for 15–39-year-olds, as well. Sex represents sex at birth in GISP, is based on self-report in NHANES, and is unknown for case report data. Calculations were performed separately for each subpopulation, meaning we did not assume any dependence between subpopulations.
Our modeling framework accounts for symptoms differentially affecting both recovery and being reported as a diagnosed case of chlamydia and gonorrhea. This framework mathematically describes the natural history of infection, how cases are reported, what is represented by prevalence estimates (where available), and population sizes. We derived closed form solutions for incidence and prevalence (where necessary); details of this process are described in the Mathematical Modeling Supplement.
We used Monte Carlo simulation accounting for each input parameter’s uncertainty to generate 10,000 input parameter sets for each age-sex-subpopulation. We summarized prevalence and incidence estimates using the median (50th percentile) of the empirical frequency distribution, and uncertainty intervals were characterized by their 25th (Q1) and 75th (Q3) percentiles. Aggregate measures (e.g., total male incidence, total female incidence, total 15–24-year-old incidence, etc.) were estimated by combining component distributions, similar to methods used in the Overview article in this Special Issue. (10)
Prevalence
The point prevalence and relative standard errors (RSEs) of chlamydia were estimated using data from the 2015–2018 NHANES cycles. (8, 9) NHANES is a cross-sectional, complex, multistage survey designed to be representative of the noninstitutionalized civilian population; data were analyzed accounting for the complex survey design. Participants undergo a medical examination as part of their participation and voluntary urinary chlamydia testing is a part of this examination. We generated a distribution around the NHANES point prevalence estimates for each subpopulation to generate the median prevalence of chlamydia by sampling from a normal distribution with mean equal to the point estimate and standard deviation equal to the point estimate * RSE. (8, 9, 11) As gonorrhea prevalence data have not been collected in NHANES since the 2007–2008 cycle, the median prevalence of gonorrhea was estimated using ordinary differential equation (ODE) based modeling techniques assuming equilibrium and static incidence. (12) The gonorrhea prevalence model was informed by case report data, the population size, case reporting fraction, proportion of new infections that are asymptomatic, and rates of background screening, natural clearance, and symptomatic treatment seeking. (1, 4, 13–17, unpublished data from the STD Surveillance Network PS13-1306, 2016–2018) An overview of the gonorrhea prevalence model parameters, stratified by sex and age group (where appropriate), is presented in Table 1. This overview includes a description of model parameters, the inputs informing them, the strength of those and references for all data points used. Details for how each input parameter was informed by data, including a rating system, are provided in the Data Inputs Supplement.
Table 1.
Summary of Model Parameters.
| Parameter* | Population/Characteristic | Median (25th, 75th percentile) † | Distribution Form | Strength of Input‡ | References |
|---|---|---|---|---|---|
| Population size (N) |
Men 15–24 years 25–39 years Women 15–24 years 25–39 years |
22,076,120 33,757,505 21,025,717 33,171,851 |
N/A (unvaried) | II | (13) |
| Number of case reports (κ) |
Chlamydia Men 15–24 years 25–39 years Women 15–24 years 25–39 years Gonorrhea Men 15–24 years 25–39 years Women 15–24 years 25–39 years |
306,110 246,601 779,367 318,246 116,427 167,134 132,291 90,786 |
N/A (unvaried) | II | (1) |
| Case reporting fraction (ρ) § | 95.0% (93.8%, 96.2%) | Uniform | II | (14) Expert opinion |
|
| Proportion of cases that are asymptomatic (β) |
Chlamydia Men Women Gonorrhea Men Women |
83.9% (80.6%, 87.1%) 74.5% (71.6%, 77.5%) 41.3% (31.8%, 51.1%) 68.4% (61.8%, 74.2%) |
Uniform | III | (4) |
| Background screening percent (per year, σ) |
Men 15–24 years 25–39 years Women 15–24 years 25–39 years |
14.4% (13.5%, 15.3%) 17.6% (16.5%, 18.7%) 27.3% (26.1%, 28.4%) 31.1% (30.0%, 32.3%) |
Normal | II | (15) |
| Time to natural clearance (days, 1/ψ) |
Chlamydia Men Women Gonorrhea Men Women |
361.4 (313.9, 423.4) 397.9 (376.0, 416.1) 45.5 (38.6, 54.4) 91.3 (77.3, 108.6) |
Bootstrapped empirical data | III | (16, 18–26) |
| Time from infection to symptomatic treatment seeking (days, 1/τ) ǁ |
Chlamydia Men Women Gonorrhea Men Women |
25.5 (20.4, 30.7) 49.4 (39.7, 58.9) 16.2 (13.8, 18.4) 31.8 (27.5, 36.2) |
Composite: see Data Inputs Supplement | III | (4, 17); Unpublished data from the STD Surveillance Network (PS13–1306), 2016–2018 |
Not all parameters were used in all models. See the Data Inputs Supplement and Mathematical Modeling Supplement for more information on which parameters were used in which estimates.
The 25th and 75th percentiles were generated either parametrically by sampling from the listed probability distribution for each variable or non-parametrically using bootstrapping techniques. The details of this process are explained in the Supplemental Materials. For any variables with no uncertainty interval provided, no variability was assumed.
The strength of the inputs used to inform model parameters was assessed using a rating system adapted from Satterwhite, et al and Lefevre, et al, the criteria for which are provided in the Data Inputs Supplement. (7, 40s)
The case reporting fraction represents the proportion of all diagnosed cases that are reported to the Centers for Disease Control and Prevention.
The time from infection to symptomatic treatment seeking parameter is a function of multiple inputs. These included the probability of a person never seeking treatment, the time from infection acquisition to symptom onset, and time from symptom onset to testing due to symptoms. Refer to the Data Inputs Supplement for more information on how these components were combined to create this composite parameter.
Incidence
ODE based modeling, assuming equilibrium and static incidence, was used to estimate the incidence of both chlamydia and gonorrhea. The chlamydia incidence model was informed by case report data, population size, case reporting fraction, point prevalence, and natural clearance rate. (1, 8, 9, 13, 14, 18–26) The gonorrhea incidence model was informed by case report data, the population size, case reporting fraction, proportion of new infections that are asymptomatic, and rates of background screening, natural clearance, and symptomatic treatment seeking. (1, 4, 13–17, unpublished data from the STD Surveillance Network PS13-1306, 2016–2018) An overview of model parameters, stratified by sex and age group (where appropriate), is presented in Table 1. More detailed information about each input parameter is provided in the Data Inputs Supplement.
Calculating the Estimated Number and Rate of Prevalent and Incident Chlamydial and Gonococcal Infections
We calculated the estimated number of prevalent and incident infections by multiplying prevalence and incidence estimates for both chlamydia and gonorrhea by the US Census Bureau’s 2018 American Community Survey (ACS) full resident population estimates. (13) We also estimated the rate of prevalent and incident infections (per 100,000 population) by dividing the median estimated number of prevalent and incident infections by the 2018 ACS full population estimates for each age-sex specific subpopulation and then multiplying by 100,000. (13) Estimates were calculated for both chlamydia and gonorrhea for the total population and all subpopulations described. Because a person can have ≥1 infection at a given time (e.g., coinfection with chlamydia and gonorrhea) or ≥1 episode of a single infection (e.g., repeat chlamydial infection in the same calendar year), the numbers presented are the estimated total number of infections, rather than the total number of people with a chlamydial or gonococcal infection in 2018.
Antimicrobial Resistant Gonorrhea
The Gonococcal Isolate Surveillance Project (GISP) is the national sentinel surveillance system for AMR gonorrhea in the US. (27) It collects gonococcal isolates from male urethral specimens from select STI clinics and performs antimicrobial susceptibility testing to evaluate resistance trends over time. Using GISP data, an estimated 51.3% of all 2018 gonococcal infections demonstrated resistance to ciprofloxacin, tetracycline, or penicillin, or elevated MICs to azithromycin, ceftriaxone, or cefixime. (1) Currently, the only recommended drug to treat gonorrhea is ceftriaxone; 0.2% of all gonococcal infections in GISP demonstrated elevated MICs to ceftriaxone in 2018. (1, 28) Detailed information about included antibiotics and GISP antimicrobial susceptibility categorizations is located in the Data Inputs Supplement. (29) We multiplied the total number of estimated prevalent and incident gonococcal infections by this proportion to calculate the number of estimated prevalent and incident AMR gonococcal infections.
Ranked Uncertainty Impact Assessment
Input parameter uncertainty led to output uncertainty in our prevalence and incidence estimates. The impact of input uncertainty was examined in detail by generating tornado plots, where prevalence and incidence were estimated using values representing the 25th and 75th percentiles of the distributions for each individual parameter (Table 1), while holding all other parameters at their median values. These analyses ranked the impact of each parameter’s uncertainty on model outcomes.
Results
Prevalence
Chlamydia
The overall number of prevalent chlamydial infections in persons aged 15–39 years in 2018 was 2.35 million, for a rate of 2,138 infections per 100,000 population (Table 2). All subsequent rates are presented as per 100,000 of the age-sex sub-population of interest. The number and rate of prevalent infections was higher among women aged 15–39 and 15–24 years (15–39: n=1.31 million, rate=2,410; 15–24: n=990,000, rate=4,709) compared to men of these same age groups (15–39: n=1.05 million, rate=1,881; 15–24: n=595,000, rate=2,695); however, prevalence was higher in men compared to women aged 25–39 years (men: n=455,000, rate=1,348; women: n=315,000, rate=950). Among persons aged 15–24 years, the rate of prevalent chlamydial infections was 3.2 times that among 25–39-year-olds (15–24: 3,673; 25–39: 1,149). This held true when stratified by sex, although the difference was not as pronounced for men compared to women (2.0 vs. 5.0 times, respectively). In total, 15–24-year-olds accounted for 67.3% of all prevalent chlamydial infections in 2018.
Table 2.
Estimated Prevalence* of Chlamydial, Gonococcal, and Antimicrobial Resistant Gonococcal Infections in Persons Aged 15–39 years, by Sex and Age Group, United States, 2018.
| Median Number of Prevalent Infections† (25th–75th percentile) § |
Median Number of Prevalent Infections, per 100,000 Population‡ (25th–75th percentile) § |
|||||
|---|---|---|---|---|---|---|
|
|
||||||
| Men | Women | Total** | Men | Women | Total** | |
|
| ||||||
| Chlamydia || | ||||||
| 15–24 | 595,000 (530,000–659,000) | 990,000 (899,000–1,084,000) | 1,583,000 (1,472,000–1,696,000) | 2,695 (2,401–2,985) | 4,709 (4,276–5,156) | 3,673 (3,415–3,935) |
| 25–39 | 455,000 (371,000–540,000) | 315,000 (250,000–382,000) | 769,000 (662,000–882,000) | 1,348 (1,099–1,600) | 950 (754–1,152) | 1,149 (989–1,318) |
| 15–39** | 1,050,000 (944,000–1,157,000) | 1,306,000 (1,193,000–1,418,000) | 2,353,000 (2,202,000–2,508,000) | 1,881 (1,691–2,072) | 2,410 (2,201–2,616) | 2,138 (2,001–2,279) |
| Gonorrhea ¶ | ||||||
| 15–24 | 20,000 (15,000–27,000) | 90,000 (72,000–115,000) | 113,000 (93,000–138,000) | 91 (68–122) | 428 (342–547) | 262 (216–320) |
| 25–39 | 28,000 (21,000–38,000) | 60,000 (48,000–76,000) | 91,000 (76,000–111,000) | 83 (62–113) | 181 (145–229) | 136 (114–166) |
| 15–39** | 50,000 (40,000–63,000) | 155,000 (131,000–184,000) | 209,000 (183,000–241,000) | 90 (72–113) | 286 (242–339) | 190 (166–219) |
| Antimicrobial Resistant Gonorrhea # | ||||||
| 15–24 | 10,000 (8,000–14,000) | 46,000 (37,000–59,000) | 58,000 (48,000–71,000) | 45 (36–63) | 219 (176–281) | 135 (111–165) |
| 25–39 | 14,000 (11,000–19,000) | 31,000 (25,000–39,000) | 47,000 (39,000–57,000) | 41 (33–56) | 93 (75–118) | 70 (58–85) |
| 15–39** | 26,000 (21,000–32,000) | 80,000 (67,000–94,000) | 107,000 (94,000–124,000) | 47 (38–57) | 148 (124–173) | 97 (85–113) |
Prevalence estimates represent point prevalence, assumed to be at equilibrium, reflective of burden on any given day in 2018.
The number of prevalent infections was rounded to the nearest thousand infections. The number of prevalent chlamydial and gonococcal infections was calculated by multiplying the per capita incidence estimates by the American Community Survey full population estimates for 2018.
Per capita prevalence estimates are represented as the number of prevalent infections per 100,000 population for each age-sex specific subpopulation. All numbers are rounded to the nearest full integer.
Uncertainty intervals represent the 25th and 75th percentiles of the empirical frequency distribution of a given estimate.
The point prevalence of chlamydia was estimated using data from the 2015–2018 cycles of the National Health and Nutrition Examination Survey; these estimates were then used to create a probability distribution of chlamydia prevalence, as described in the Data Inputs Supplement.
The point prevalence of gonorrhea was estimated by finding the close form solution of an ordinary differential equation-based model, assuming equilibrium and static incidence. Details are available in the Mathematical Modeling Supplement.
The prevalence of antimicrobial resistant gonorrhea was determined by multiplying the 2018 percentage (51.3%) of isolates from the Gonococcal Isolate Surveillance Project demonstrating resistance to ciprofloxacin, tetracycline, or penicillin, or elevated minimum inhibitory concentrations to azithromycin, ceftriaxone, or cefixime by the median gonococcal incidence estimates for 2018. (1)
Total and 15–39-year-old estimates are not the sum of individual estimates, but rather descriptions of multiple distributions that have been combined.
Gonorrhea
The overall number of prevalent gonococcal infections in persons aged 15–39 years in 2018 was 209,000, for a rate of 190 infections per 100,000 population (Table 2). The number and rate of prevalent infections was higher among women compared to men of all age groups. This difference was most pronounced comparing rates between 15–24- and 25–39-year-old women and men (15–24: 4.7 times, women: 428, men: 91; 25–39: 2.2 times, women: 181, men: 83). In total, there were 113,000 prevalent infections among 15–24-year-olds, accounting for 54.1% of all prevalent gonococcal infections in 2018.
AMR Gonorrhea
Assuming 51.3% of all gonococcal infections in 2018 demonstrated AMR or elevated MICs to selected antibiotics, there was a total of 107,000 (Table 2) prevalent AMR gonococcal infections in 2018; 26,000 were in men and 80,000 were in women. (1) The estimated number of prevalent AMR gonococcal infections among all 15–24- and 25–39-year-olds was 58,000 and 47,000, respectively.
Incidence
Chlamydia
The total estimated number of incident chlamydial infections among persons aged 15–39 years in 2018 was 3.98 million, for a rate of 3,620 infections per 100,000 population (Table 3); 2.35 million were in women (rate=4,343) and 1.62 million were in men (rate=2,903). Among 15–24-year-olds, there were 2.65 million incident chlamydial infections (rate=6,144), representing 66.5% of all newly acquired infections in 2018. Women aged 15–24 years had the highest number and rate of incident infections compared to all other age-sex subpopulations (n=1.73 million, rate=8,219), accounting for 43.4% of all incident chlamydial infections and 65.3% of all incident infections among 15–24-year-olds. Among 25–39-year-olds, the number and rate of incident infections was higher in men (n=707,000, rate=2,094) compared to women (n=625,000, rate=1,884), accounting for 53.0% of incident infections in this age group.
Table 3.
Estimated Incidence* of Chlamydial, Gonococcal, and Antimicrobial Resistant Gonococcal Infections in Persons Aged 15–39 years, by Sex and Age Group, United States, 2018.
| Median Number of Incident Infections† (25th–75th percentile) § |
Median Number of Incident Infections, Per 100,000 Population‡ (25th–75th percentile) § |
|||||
|---|---|---|---|---|---|---|
|
|
||||||
| Men | Women | Total|| | Men | Women | Total|| | |
|
| ||||||
| Chlamydia | ||||||
| 15–24 | 910,000 (805,000–1,026,000) | 1,728,000 (1,636,000–1,829,000) | 2,648,000 (2,506,000–2,798,000) | 4,122 (3,646–4,648) | 8,219 (7,781–8,699) | 6,144 (5,814–6,492) |
| 25–39 | 707,000 (605,000–818,000) | 625,000 (563,000–688,000) | 1,333,000 (1,213,000–1,464,000) | 2,094 (1,792–2,423) | 1,884 (1,697–2,074) | 1,992 (1,812–2,187) |
| 15–39|| | 1,621,000 (1,443,000–1,820,000) | 2,354,000 (2,236,000–2,477,000) | 3,983,000 (3,770,000–4,223,000) | 2,903 (2,584–3,260) | 4,343 (4,126–4,570) | 3,620 (3,426–3,838) |
| Gonorrhea | ||||||
| 15–24 | 277,000 (238,000–335,000) | 502,000 (426,000–595,000) | 798,000 (705,000–907,000) | 1,255 (1,078–1,517) | 2,388 (2,026–2,830) | 1,851 (1,636–2,104) |
| 25–39 | 399,000 (342,000–475,000) | 335,000 (287,000–395,000) | 750,000 (669,000–853,000) | 1,182 (1,013–1,407) | 1,010 (865–1,191) | 1,121 (1,000–1,274) |
| 15–39|| | 697,000 (618,000–796,000) | 853,000 (757,000–962,000) | 1,568,000 (1,438,000–1,722,000) | 1,248 (1,107–1,426) | 1,574 (1,397–1,775) | 1,425 (1,307–1,565) |
| Antimicrobial Resistant Gonorrhea ¶ | ||||||
| 15–24 | 142,000 (122,000–172,000) | 258,000 (219,000–305,000) | 409,000 (362,000–465,000) | 643 (553–779) | 1,227 (1,042–1,451) | 949 (840–1,079) |
| 25–39 | 205,000 (175,000–244,000) | 172,000 (147,000–203,000) | 385,000 (343,000–438,000) | 607 (518–723) | 519 (443–612) | 575 (512–654) |
| 15–39|| | 358,000 (317,000–408,000) | 438,000 (388,000–494,000) | 804,000 (738,000–883,000) | 641 (568–731) | 808 (716–911) | 731 (671–802) |
Close form solutions of ordinary differential equation-based models that assumed equilibrium and static incidence were used to estimate the incidence of both chlamydia and gonorrhea. A detailed description of these models is provided in the Mathematical Modeling Supplement.
Incidence estimates represent the cumulative number of incident infections during 2018. All counts are rounded to the nearest thousand infections. The number of incident chlamydial and gonococcal infections was calculated by multiplying the per capita incidence estimates by the American Community Survey full population estimates for 2018.
Per capita incidence estimates are represented as the number of incident infections per 100,000 population for each age-sex specific subpopulation. All numbers are rounded to the nearest full integer.
Uncertainty intervals represent the 25th and 75th percentiles of the empirical frequency distribution of a given estimate.
Total and 15–39-year-old estimates are not the sum of individual estimates, but rather descriptions of multiple distributions that have been combined.
The incidence of antimicrobial resistant gonorrhea was determined by multiplying the 2018 percentage (51.3%) of isolates from the Gonococcal Isolate Surveillance Project demonstrating resistance to ciprofloxacin, tetracycline, or penicillin, or elevated minimum inhibitory concentrations to azithromycin, ceftriaxone, or cefixime by the median gonococcal incidence estimates for 2018. (1)
Gonorrhea
The total estimated number of incident gonococcal infections in persons aged 15–39 years in 2018 was 1.57 million, for a rate of 1,425 infections per 100,000 population (Table 3). Stratified by sex, there were 853,000 incident gonococcal infections in women (rate=1,574) and 697,000 in men (rate=1,248). Among 15–24-year-olds, there were 798,000 incident gonococcal infections (rate=1,851), representing 50.9% of all newly acquired infections in 2018; there were 750,000 incident gonococcal infections among 25–39-year-old persons (rate=1,121). Among women, the rate of newly acquired gonococcal infections in 15–24-year-olds was 2.4 times that of 25–39-year-olds (15–24: 2,388; 25–39: 1,010); however, this difference was not as pronounced in men (1.1 times; 15–24: 1,255; 25–39: 1,182).
AMR Gonorrhea
The estimated number of incident AMR gonococcal infections in 2018 among all 15–39-year-olds was 804,000 (Table 3); 358,000 were in men and 438,000 were in women. The estimated number of incident AMR gonococcal infections among all 15–24- and 25–39-year-olds was 409,000 and 385,000, respectively.
Ranked Uncertainty Impact Analysis
Chlamydial Incidence
For nearly all sex- and age-stratified subpopulations, uncertainty in chlamydial prevalence was most impactful on the resulting chlamydial incidence estimates. When chlamydial prevalence was varied among women aged 15–24 years from the 25th to the 75th percentiles of its empirical frequency distribution while holding all other parameters constant at their median (1.73 million), the resulting number of incident chlamydial infections ranged from 1.65 to 1.82 million (Figure 1). Among women aged 15–24 years, the next most impactful parameter was the rate of natural clearance, as the range of the resulting number of incident chlamydial infections was slightly smaller (1.69–1.78 million). Natural clearance was most impactful for chlamydial incidence in men aged 15–24 years, ranging from 830,000 to 1.0 million from a median of 910,000. The impact of the uncertainty in the remaining parameters on chlamydial incidence for each sex- and age-stratified subpopulation are provided in Figure 1.
Figure 1.
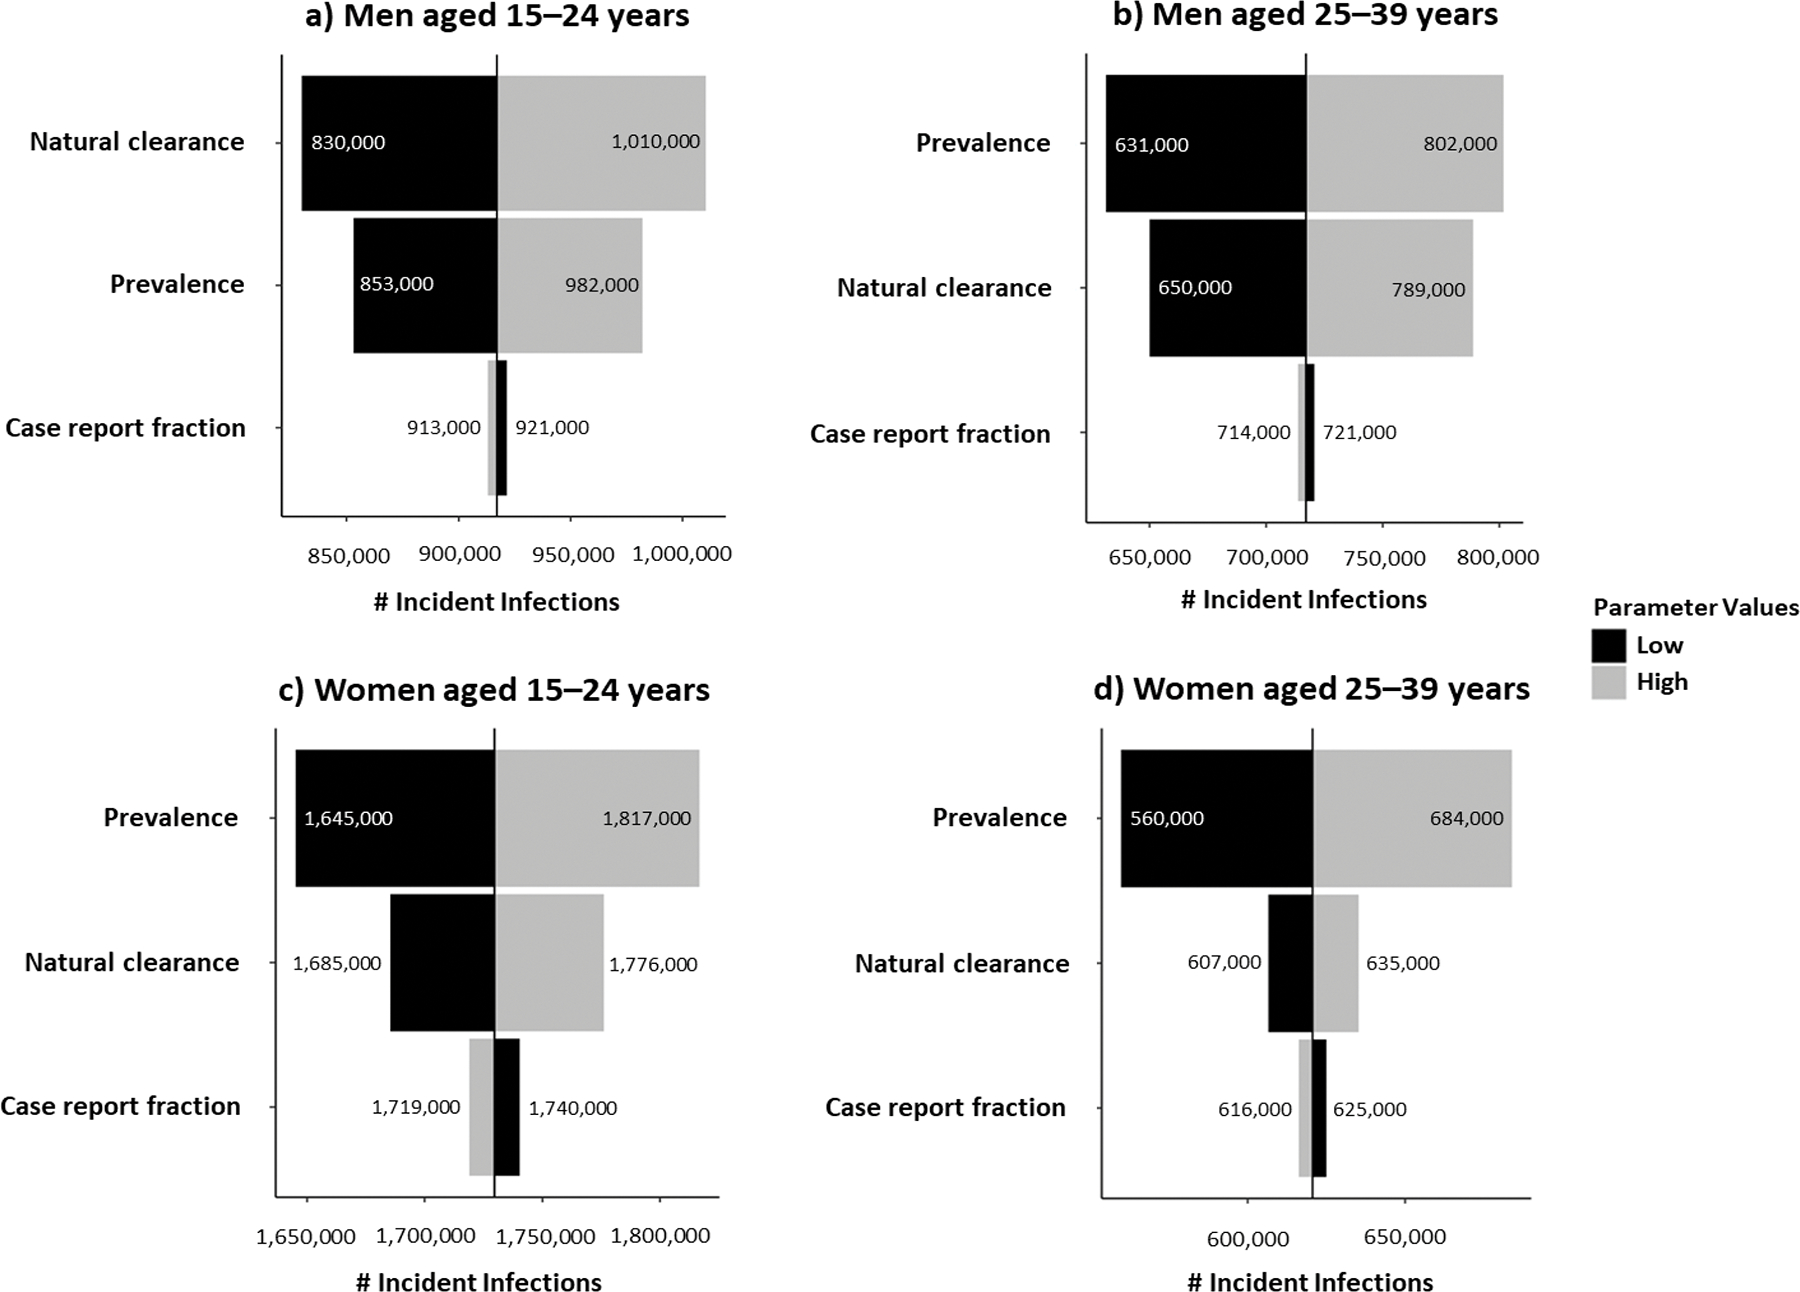
Ranked uncertainty impact analysis of model parameters on chlamydial incidence, by sex and age group, United States, 2018.
Gonococcal Prevalence
For all sex- and age-stratified subpopulations, uncertainty in the proportion of infections that are asymptomatic was most impactful on gonococcal prevalence estimates. When the asymptomatic proportion was varied among men aged 15–24 and 25–39 years from the 25th to the 75th percentiles of their empirical frequency distributions while holding all other parameters constant at their medians, the number of prevalent gonococcal infections ranged from 15,000 to 26,000 and 21,000 to 37,000, considering medians of 19,000 and 28,000, respectively (Figure 2). The rate of natural clearance was also an impactful parameter for all subpopulations, ranging the number of prevalent gonococcal infections among women aged 15–24- and 25–39 years from 82,000 to 98,000 and 55,000 to 65,000, considering medians of 90,000 and 60,000, respectively. The impact of other parameters on gonococcal prevalences for each sex- and age-stratified subpopulation are provided in Figure 2.
Figure 2.
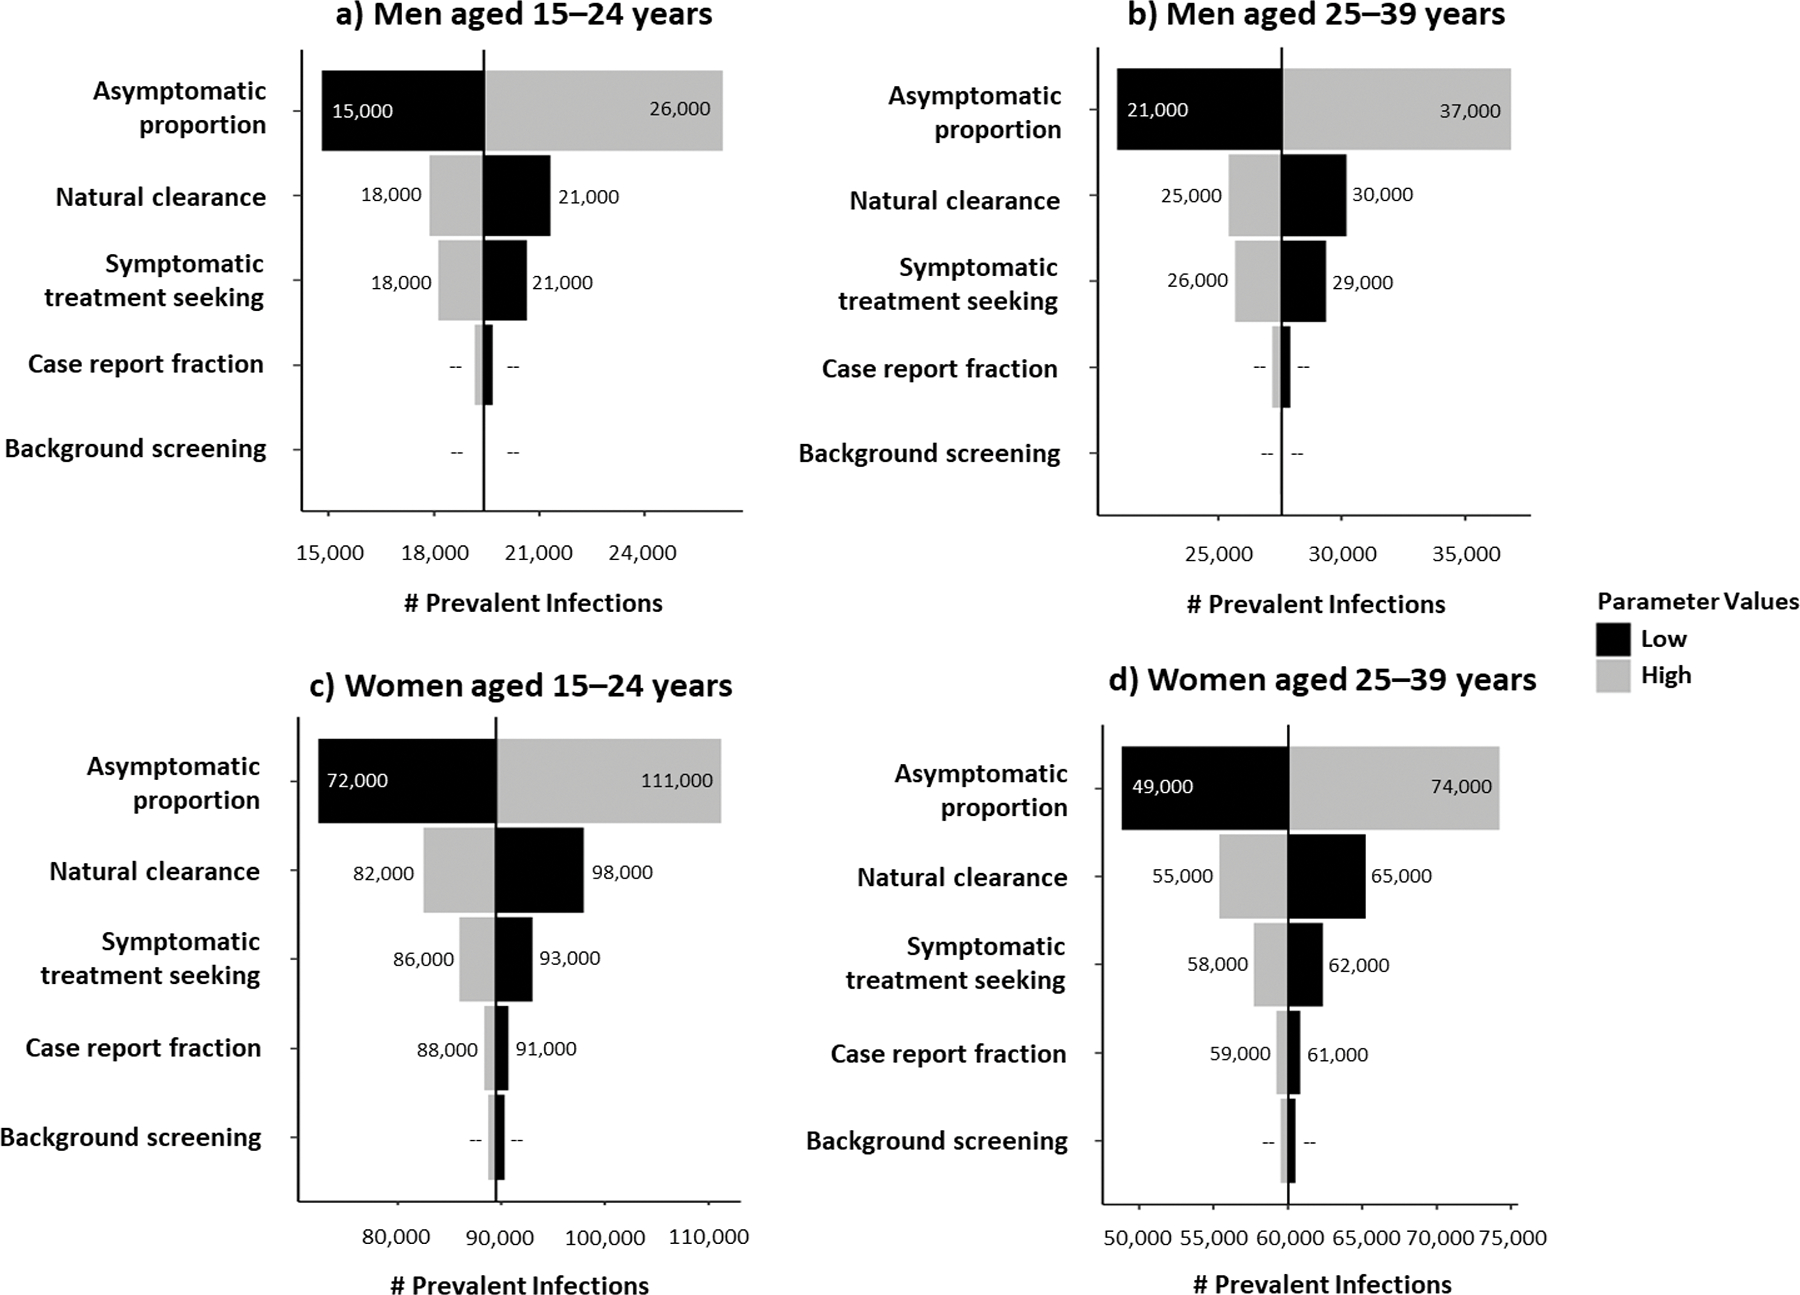
Ranked uncertainty impact analysis of model parameters on gonococcal prevalence, by sex and age group, United States, 2018.
Gonococcal Incidence
For all sex- and age-stratified subpopulations, uncertainty in the proportion of infections that are asymptomatic was also most impactful on gonococcal incidence estimates. When varying the asymptomatic proportion among men aged 15–24 and 25–39 years from the 25th to the 75th percentiles of their empirical frequency distributions while holding all other parameters constant at their medians, the number of incident gonococcal infections ranged from 241,000 to 332,000 and 345,000 to 474,000, considering medians of 277,000 and 399,000, respectively (Figure 3). The rate of natural clearance was also an impactful parameter for all subpopulations, ranging the number of incident gonococcal infections among women aged 15–24 and 25–39 years from 468,000 to 530,000 and 316,000 to 358,000, considering medians of 499,000 and 336,000, respectively. The case report fraction and rate of background screening had little to no impact on gonococcal incidence model outcomes. The impact of the uncertainty of the rate of symptomatic treatment seeking on gonococcal incidence for each sex- and age-stratified subpopulation are provided in Figure 3.
Figure 3.

Ranked uncertainty impact analysis of model parameters on gonococcal incidence, by sex and age group, United States, 2018.
Discussion
We estimated 2.35 million prevalent and 3.98 million incident chlamydial infections among persons aged 15–39 years in the US in 2018, respectively; approximately two-thirds of both were among persons aged 15–24 years. Likewise, there were an estimated 209,000 prevalent and 1.57 million incident gonococcal infections among persons aged 15–39 years; more than half of both were among persons aged 15–24 years. Because of the different methods and data sources used for these estimates versus previous estimates, this study should be considered a standalone study and comparisons to previous estimates should be interpreted cautiously. (5–7) Future research, however, should consider applying the current methods retrospectively as a means of comparison to prior methods.
Our results indicate the number and rate of incident chlamydial infections was much higher in women than men aged 15–39 years, echoing the nearly doubled rates of reported chlamydia cases in women compared to men in the 2018 STI case report data. (1) There are at least two potential explanations for this. First, women likely have increased susceptibility to infection relative to men due to physiologically normal biological factors, such as cervical ectopy. (30, 31s) Cervical ectopy is more common among adolescents and oral contraceptive users, likely contributing to the high number of incident chlamydial infections among 15–24-year-olds. Second, we assumed the proportion of asymptomatic chlamydial infections is lower and background chlamydia screening is higher in women compared to men. (4, 15) Because women are screened more often than men and potentially re-infected following treatment, women might have multiple incident infections with relatively short durations. Similarly, men, for whom screening is not recommended and who can have asymptomatic infections, might have fewer incident infections with relatively long durations.
Our estimates of the number and rate of prevalent gonococcal infections in 2018 appear to be considerably higher in women than in men. This is in contrast to case reports, which are higher among men compared to women in 2018, suggesting a higher prevalence among men. (1) One reason for this could be that men are more likely to have symptoms and are also more likely to seek care earlier for symptoms compared to women. (4, 17, unpublished data from the STD Surveillance Network PS13–1306, 2016–2018) Another reason could be our assumption that the natural clearance rate is twice as fast in men compared to women. Both reasons would result in women remaining infected longer, and hence, a higher prevalence. (16)
We also provided estimates of the number and rate of prevalent and incident AMR gonococcal infections in the US in 2018. Gonorrhea has progressively developed resistance to every recommended therapy to date. (32s) Given the high rates of reported gonorrhea in the US, the resulting reproductive complications, and the increasing risk of being able to effectively treat these infections, GISP provides critical data for monitoring AMR GC. (1, 3) One important limitation to keep in mind with the use of GISP data is that they represent only men with symptomatic gonococcal urethritis presenting to STI clinics in select US cities and may not be representative of all people with gonorrhea in the US.
One limitation of these analyses is our lack of adjustment for imperfect test characteristics. Using estimates of test sensitivity and specificity from existing literature for chlamydia, we estimated the false positive rate for chlamydia was 2.1% (min=1.8%, max=2.3%). (33s-36s) However, many subpopulations in our analyses had NHANES prevalence values below the false positive rate, indicating a possible incongruence. For this reason, we presented all results without adjustment for imperfect test characteristics. Had we accounted for this, in particular imperfect specificity, our estimates would have been lower.
In addition, as our models include case report data, which are currently unable to capture all anatomic sites of infection of a reported case, and data from NHANES and GISP, which are based on testing of urine and urethral specimens, respectively, our resulting prevalence and incidence estimates represent only urogenital infections and exclude extragenital sites, such as the rectum and oropharynx. Consequently, these estimates may underestimate the full burden of chlamydia and gonorrhea in the US. Given the high prevalence of extragenital infections in certain subpopulations, such as men having sex with men, data on the proportion of reported urogenital chlamydia and gonorrhea cases that also had an extragenital infection, as well as the prevalence of extragenital chlamydia and gonorrhea, need to be incorporated into future models to refine incidence estimates.
While our primary analysis provided uncertainty intervals around estimates of prevalence and incidence overall, our secondary analysis assessed the impact of each input parameter’s uncertainty separately on model outcomes. (37s) In this analysis, we found that chlamydial prevalence uncertainty was most impactful on its incidence in three of the four age-sex subpopulations, indicating that improving the precision of prevalence estimates would improve the precision of our incidence estimates the most, especially in women. However, in 15–24-year-old men (and 25–39-year-old men to a lesser extent), improved precision for natural clearance would greatly improve the precision of our chlamydial incidence estimates. For gonorrhea, we found that uncertainty around the proportion of infections that are asymptomatic was most impactful on both prevalence and incidence. Therefore, better estimates of the proportion of new gonococcal infections that are asymptomatic would improve the precision of our incidence and prevalence estimates the most. The rate of natural clearance was also an impactful parameter on gonococcal prevalence and incidence, particularly for women. These findings highlight the importance of these specific data on our model-based prevalence and incidence estimates.
Unfortunately, these and other data are lacking in the literature, requiring us to incorporate several assumptions and/or rely on expert opinion. For example, for natural clearance, there was a considerable amount of data informing the duration of untreated chlamydial infections but a relative paucity of similar data for gonorrhea. (18–26) Therefore, to estimate the duration of untreated gonococcal infection, we used data from a single study of 16 women, while the only similar studies we found in men were decades old and identified infections using culture, Gram stain, or fluorescent antibody tests, techniques which are known to have lower sensitivities. (16, 38s, 39s) We therefore chose to use only the more recent study based on female NAAT results and made the assumption that men naturally clear gonorrhea twice as fast as women. For the proportion of cases that were asymptomatic, we again only found data from either outdated studies or review papers where the actual numbers used to arrive at their estimates were not provided, leaving us to use data from a sole study of a convenience sample of 18–29 year old people in New Orleans. (4, 38s, 39s) Uncertainty in these two parameters affected uncertainty in our final estimates the most. Because we cannot guarantee the internal and external validity of these studies, our estimates should be interpreted with caution. Should newer data become available to better inform these input parameters, these could lead to changes in estimates of prevalence and incidence. These findings highlight the critical need for better and more robust data to inform model parameters.
Despite uncertainty around our estimates and some of the inputs informing model parameters, our findings illustrate a high burden of chlamydia and gonorrhea in the US. Compared to previous estimates of the prevalence and incidence of chlamydia and gonorrhea, this study incorporates a more rigorous methodology, including uncertainty estimates, extensive sensitivity analyses, as well as transparent assumptions. Because of this, we feel this work is an improvement over previous iterations. However, there is still more work to be done. We hope our findings promote additional research into the most ambiguous model parameters described here in an effort to provide the researchers who perform the next iteration of these analyses adequate and robust data to inform their models and decrease estimate uncertainty.
Supplementary Material
Acknowledgments
The authors thank Drs. Thomas Gift and Harrell Chesson for providing expertise and input for the ODE model development. We also thank Dr. Laura Haderxhanaj for providing data from the National Survey of Family Growth and Mark Stenger for providing data from the STD Surveillance Network to inform the background screening and symptomatic treatment seeking parameters used in all models. We thank Dr. Emily Learner for her assistance in generating the summary estimate of diagnostic test sensitivity and specificity. We thank Dr. Elaine Flagg for her intensive research into, and for compiling, the 2018 American Community Survey population data used to generate the number of prevalent and incident infections. Lastly, we would like to thank all staff at state and local health departments performing surveillance for chlamydia and gonorrhea in the United States, in addition to all sentinel sites and regional laboratories participating in GISP. Without the data these jurisdictions provided, these analyses would not have been possible.
Footnotes
Conflicts of Interest/Disclosure Statement: The authors report no conflicts of interest.
OMB/CDC Disclaimer: The findings and conclusions in this report are those of the authors and do not necessarily represent the official position of the Centers for Disease Control and Prevention.
References
- 1.Centers for Disease Control and Prevention. Sexually Transmitted Disease Surveillance 2018. Atlanta: U.S. Department of Health and Human Services; 2019. [Google Scholar]
- 2.Stamm WE. Chlamydia trachomatis Infections of the Adult. In: Holmes KK, Sparling PF, Stamm WE, et al. , eds. Sexually Transmitted Diseases. 4th ed. New York, NY: McGraw-Hill; 2008: 575–94. [Google Scholar]
- 3.Hook III EW, Handsfield HH. Gonococcal Infections in the Adult. In: Holmes KK, Sparling PF, Stamm WE, et al. , eds. Sexually Transmitted Diseases. 4th ed. New York, NY: McGraw-Hill; 2008: 627–45. [Google Scholar]
- 4.Farley TA, Cohen DA, Elkins W. Asymptomatic sexually transmitted diseases: the case for screening. Prev Med 2003; 36(4): 502–509. [DOI] [PubMed] [Google Scholar]
- 5.Cates W Jr, American Social Health Association Panel. Estimates of the incidence and prevalence of sexually transmitted diseases in the United States. Sex Transm Dis 1999; 26(Suppl 4): S2–S7. [DOI] [PubMed] [Google Scholar]
- 6.Weinstock H, Berman S, Cates W Jr. Sexually transmitted diseases among American youth: Incidence and prevalence estimates, 2000. Perspect Sex Reprod Health 2004; 36(1): 6–10. [DOI] [PubMed] [Google Scholar]
- 7.Satterwhite CL, Torrone E, Meites E, et al. Sexually transmitted infections among US women and men: prevalence and incidence estimates, 2008. Sex Transm Dis 2013; 40(3): 187–193. [DOI] [PubMed] [Google Scholar]
- 8.Centers for Disease Control and Prevention. National Center for Health Statistics. National Health and Nutrition Examination Survey Data. Hyattsville, MD: US Department of Health and Human Services, Centers for Disease Control and Prevention, 2015–2016. Available at: https://wwwn.cdc.gov/nchs/nhanes/Search/DataPage.aspx?Component=Laboratory&CycleBeginYear=2015. Accessed July 1, 2020. [Google Scholar]
- 9.Centers for Disease Control and Prevention. National Center for Health Statistics. National Health and Nutrition Examination Survey Data. Hyattsville, MD: US Department of Health and Human Services, Centers for Disease Control and Prevention, 2017–2018. Available at: https://wwwn.cdc.gov/nchs/nhanes/Search/DataPage.aspx?Component=Laboratory&CycleBeginYear=2017. Accessed July 1, 2020. [Google Scholar]
- 10.Kreisel KM, Spicknall IH, Gargano JW, et al. Sexually transmitted infections among US women and men: Prevalence and incidence estimates, 2018. Sex Transm Dis 2021; 48(4): 208–214. [DOI] [PMC free article] [PubMed] [Google Scholar]
- 11.Centers for Disease Control and Prevention. National Center for Health Statistics. National Health and Nutrition Examination Survey: Analytic Guidelines, 2011–2016. Hyattsville, MD: US Department of Health and Human Services, Centers for Disease Control and Prevention. Available at: https://wwwn.cdc.gov/nchs/data/nhanes/analyticguidelines/11-16-analytic-guidelines.pdf. Accessed July 1, 2020. [Google Scholar]
- 12.Anderson RM, May RM. Infectious Diseases of Humans: Dynamics and Control. New York: Oxford University Press; 1992. [Google Scholar]
- 13.US Census Bureau. American Community Survey, 2018 American Community Survey 1-Year Estimates, Table S0201. Generated by Kristen Kreisel using American FactFinder http://factfinder.census.gov (18 February 2020). [Google Scholar]
- 14.Learner ER, Torrone EA, Fine JP, et al. Chlamydia prevalence trends among women and men entering the National Job Training Program from 1990 through 2012. Sex Transm Dis 2018; 45(8): 554–559. [DOI] [PMC free article] [PubMed] [Google Scholar]
- 15.National Center for Health Statistics. 2018. 2015–2017 National Survey of Family Growth Public Use Data and Documentation. Hyattsville, MD: CDC National Center for Health Statistics. Available at: https://www.cdc.gov/nchs/nsfg/nsfg_2015_2017_puf.htm. Accessed August 5, 2020. [Google Scholar]
- 16.Stupiansky NW, Van der Pol B, Williams JA, et al. The natural history of incident gonococcal infection in adolescent women. Sex Transm Dis 2011; 38(8): 750–754. [DOI] [PubMed] [Google Scholar]
- 17.Korenromp EL, Sudaryo MK, de Vlas SJ, et al. What proportion of episodes of gonorrhoea and chlamydia becomes symptomatic? Int J STD AIDS 2002; 13(2): 91–101. [DOI] [PubMed] [Google Scholar]
- 18.Geisler WM, Wang C, Morrison SG, et al. The natural history of untreated Chlamydia trachomatis infection in the interval between screening and returning for treatment. Sex Transm Dis 2008; 35(2): 119–123. [DOI] [PubMed] [Google Scholar]
- 19.Joyner JJ, Douglas JM, Foster M, et al. Persistence of Chlamydia trachomatis infection detected by polymerase chain reaction in untreated patients. Sex Transm Dis 2002; 29(4): 196–200. [DOI] [PubMed] [Google Scholar]
- 20.McCormack WM, Alpert S, McComb DE, et al. Fifteen-month follow-up study of women infected with Chlamydia trachomatis. New Engl J Med 1979; 300(3): 123–125. [DOI] [PubMed] [Google Scholar]
- 21.Molano M, Meijer CJ, Weiderpass E, et al. The natural course of Chlamydia trachomatis infection in asymptomatic Colombian women: a 5-year follow-up study. J Inf Dis 2005; 191(6): 907–916. [DOI] [PubMed] [Google Scholar]
- 22.Morre SA, van den Brule AJ, Rozendaal L, et al. The natural course of asymptomatic Chlamydia trachomatis infections: 45% clearance and no development of clinical PID after one-year follow-up. Int J STD AIDS 2002; 13(Suppl 2): 12–18. [DOI] [PubMed] [Google Scholar]
- 23.Parks KS, Dixon PB, Richey CM, et al. Spontaneous clearance of Chlamydia trachomatis infection in untreated patients. Sex Transm Dis 1997; 24(4): 229–235. [DOI] [PubMed] [Google Scholar]
- 24.Rogers S, Miller W, Turner C, et al. Concordance of Chlamydia trachomatis infections within sexual partnerships. Sex Transm Infect 2008; 84(1): 23–28. [DOI] [PubMed] [Google Scholar]
- 25.Sheffield JS, Andrews WW, Klebanoff MA, et al. Spontaneous resolution of asymptomatic Chlamydia trachomatis in pregnancy. Obstet Gynecol 2005; 105(3): 557–562. [DOI] [PubMed] [Google Scholar]
- 26.van den Brule AJ, Munk C, Winther JF, et al. Prevalence and persistence of asymptomatic Chlamydia trachomatis infections in urine specimens from Danish male military recruits. Int J STD AIDS 2002; 13(Suppl 2): 19–22. [DOI] [PubMed] [Google Scholar]
- 27.Centers for Disease Control and Prevention. 2020. Gonococcal Isolate Surveillance Project (GISP) and Enhanced GISP (eGISP): Protocol. Available at: https://www.cdc.gov/std/gisp/GISP_eGISP_Protocol_January_2020.pdf. Accessed August 5, 2020.
- 28.St Cyr S, Barbee L, Workowski KA, et al. Update to CDC’s treatment guidelines for gonococcal infection, 2020. MMWR Morb Mort Wkly Rep 2020; 69(50): 1911–1916. [DOI] [PMC free article] [PubMed] [Google Scholar]
- 29.Clinical and Laboratory Standards Institute. Performance Standards for Antimicrobial Susceptibility Testing. 30th ed. CLSI supplement M100. Wayne, PA: Clinical and Laboratory Standards Institute; 2020. [Google Scholar]
- 30.Aral SO, Holmes KK. The Epidemiology of STIs and their Social and Behavioral Determinants: Industrialized and Developing Countries. In: Holmes KK, Sparling PF, Stamm WE, et al. , eds. Sexually Transmitted Diseases. 4th ed. New York, NY: McGraw-Hill; 2008: 53–92. [Google Scholar]
Associated Data
This section collects any data citations, data availability statements, or supplementary materials included in this article.