

Abstract
The plasma proteomic changes that precede the onset of dementia could yield insights into disease biology and highlight novel biomarkers and avenues for intervention. We quantified 4,877 plasma proteins in non-demented older adults in the ARIC cohort and performed a proteome-wide association study of dementia risk over five years (N=4,110; 428 incident cases). Thirty-eight proteins were associated with incident dementia after Bonferroni correction. Of these, 16 were also associated with late-life dementia risk when measured in plasma collected nearly 20 years earlier, during midlife. Two-sample Mendelian randomization causally implicated two dementia-associated proteins (SVEP1 and Angiostatin) in Alzheimer’s disease. SVEP1, an immunologically relevant cellular adhesion protein, was found to be part of larger dementia-associated protein networks, and circulating levels were associated with atrophy in brain regions vulnerable to Alzheimer’s pathology. Pathway analyses for the broader set of dementia-associated proteins implicated immune, lipid, metabolic signaling, and hemostasis pathways in dementia pathogenesis.
Introduction
While blood levels of several biologically relevant molecules have been associated with risk for Alzheimer’s disease and dementia more broadly,1–4 information about the full range of changes to the plasma proteome in the years preceding dementia is lacking. Several case-control studies have taken an unbiased ‘omics’ approach to understanding the plasma proteomic differences between individuals living with Alzheimer’s dementia and non-demented older adults. Although these studies have been informative, they were limited by modest sample sizes and by technological challenges permitting a survey of only a small fraction of the human proteome.5–16 Furthermore, plasma proteomic studies of dementia to date have been almost exclusively cross-sectional, potentially subject to reverse causation, and unable to determine whether there are proteomic signatures of dementia in the years preceding its clinical onset.
Gene expression studies have identified transcriptional changes that coincide with dementia.17–19 However, as regulation of protein concentrations in blood extends beyond simply its transcriptome and as proteins are more directly linked to disease phenotypes than transcriptomes, surveying the proteome might offer new insights into the risk of incident dementia. The recent advances in high-throughput technology for the characterization of the human proteome have enabled the simultaneous assessment of ~5,000 circulating proteins.20,21 By applying this technology to conduct a large-scale prospective analysis of the plasma proteome in clinically non-demented individuals who progress to dementia, the current study takes a new, relatively unbiased approach to discovery of blood-based dementia biomarkers, some of which could also be causal disease mediators. In this study, we test the hypothesis that widespread proteomic changes can (a) be detected in blood many years before dementia onset and (b) be used to better understand the molecular pathways altered in the preclinical and prodromal phase of dementia.
The current study used modified aptamer technology (SomaScan) to examine the relationship between the plasma level of 4,877 proteins and risk for incident dementia in a large biracial community-based sample of older adults from the Atherosclerosis Risk in Communities (ARIC) study in the United States. In this proteome-wide association study of dementia risk, we found the level of 38 unique proteins to be significantly associated with dementia risk over the subsequent 5 years. In an analysis that reinforced and extended these findings, we demonstrated that a large subset of these proteins was also associated with incident dementia risk when measured during middle adulthood, almost 20 years earlier. We also confirmed that a number of these proteins were associated with dementia risk in the Age, Gene/Environment Susceptibility (AGES)-Reykjavik study, a prospective community-based cohort in Europe (Iceland). Additionally, we have conducted systems-level analyses of dementia-associated proteins to characterize the biological mechanisms and regulatory pathways associated with dementia risk, and we have used neuroimaging to relate these proteins to markers of brain structural integrity and molecular pathology relevant to Alzheimer’s disease. Leveraging published GWAS data from external consortia,22 we used bidirectional two-sample Mendelian randomization to investigate causal links between dementia-associated proteins and Alzheimer’s disease and identify new potential therapeutic targets.
Results
Cohort Characteristics.
A total of 4,110 participants were included in the primary analytic sample (age: 75 years [SD 5]; 58% women; 17% black; Figure 1A). At ARIC study visit 5 (2011–2013), henceforth referred to as late-life baseline, 79% (n=3,238) of participants were cognitively normal and 21% (n=872) met criteria for mild cognitive impairment (MCI). In total, 428 participants progressed to dementia after the blood draw for proteomic assessment. The median follow-up time was 4.9 years (IQR: 4.3 to 5.2). A detailed study flowchart is presented in Supplementary Figure 1; included/excluded participant characteristics are presented in Supplementary Tables 1–3. Of the 5,284 available aptamer binding reagents, 4,877 (91%) passed quality control (see Methods) and were used in the current analysis.
Figure 1.
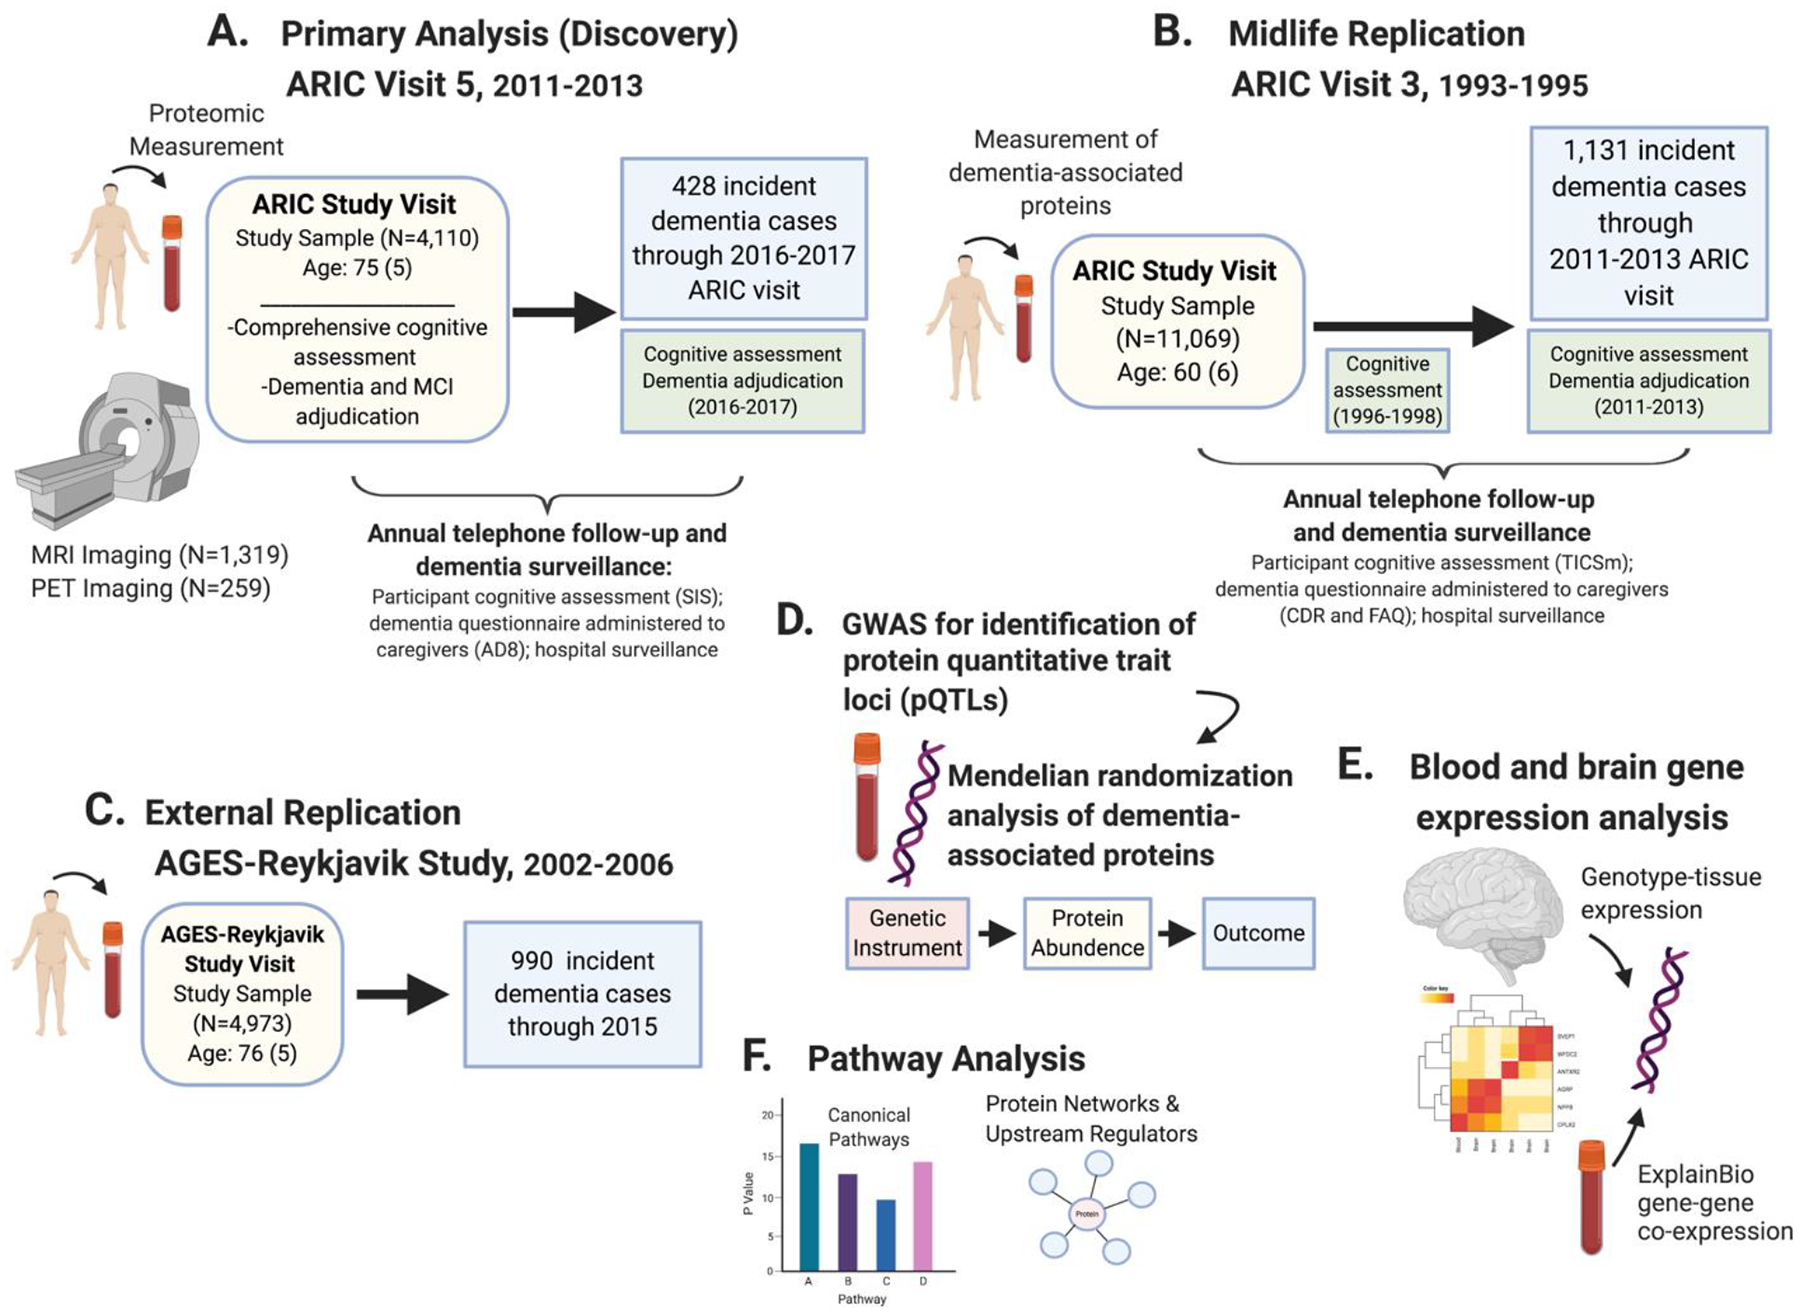
Schematic overview of the study design.
(A) The primary (discovery) analysis related proteins measured at ARIC visit 5 (late-life baseline; 2011–2013) to incident dementia occurring before the end of visit 6 (2016–2017). (B) Midlife replication analyses examined the subset of dementia-associated proteins identified in the primary analysis of older adults. Each of these dementia-associated proteins were measured in plasma collected during an earlier ARIC visit (visit 3; 1993–1995) and were related to incident dementia occurring up to the time of ARIC visit 5. (C) Dementia-associated proteins that were identified in the primary analysis and replicated in the midlife replication analysis were measured in the AGES-Reykjavik study and associated with incident dementia. (D) A genome-wide association studies identified loci associated with plasma levels of dementia-associated proteins. Identified protein quantitative trait loci (pQTLs) were included in two-sample Mendelian randomization analyses to assess causal associations with Alzheimer’s disease. (E) The GTEx database was used to examine the expression of genes coding for top proteins in blood and expression of the same gene across multiple brain regions. Gene co-expression networks for genes associated with top dementia-associated proteins were also examined. (F) Ingenuity Pathway Analysis identified enriched biological pathways, common upstream regulators, and protein networks among the subset of dementia-associated proteins. Figure created with BioRender.com.
Abbreviations: AD8, ascertain dementia-8; CDR, Clinical Dementia Rating Scale; FAQ, Functional Activities Questionnaire; SIS, Six-item Screener; TICSm, Telephone Interview for Cognitive Status Modified.
Association of Protein Levels with Incident Dementia.
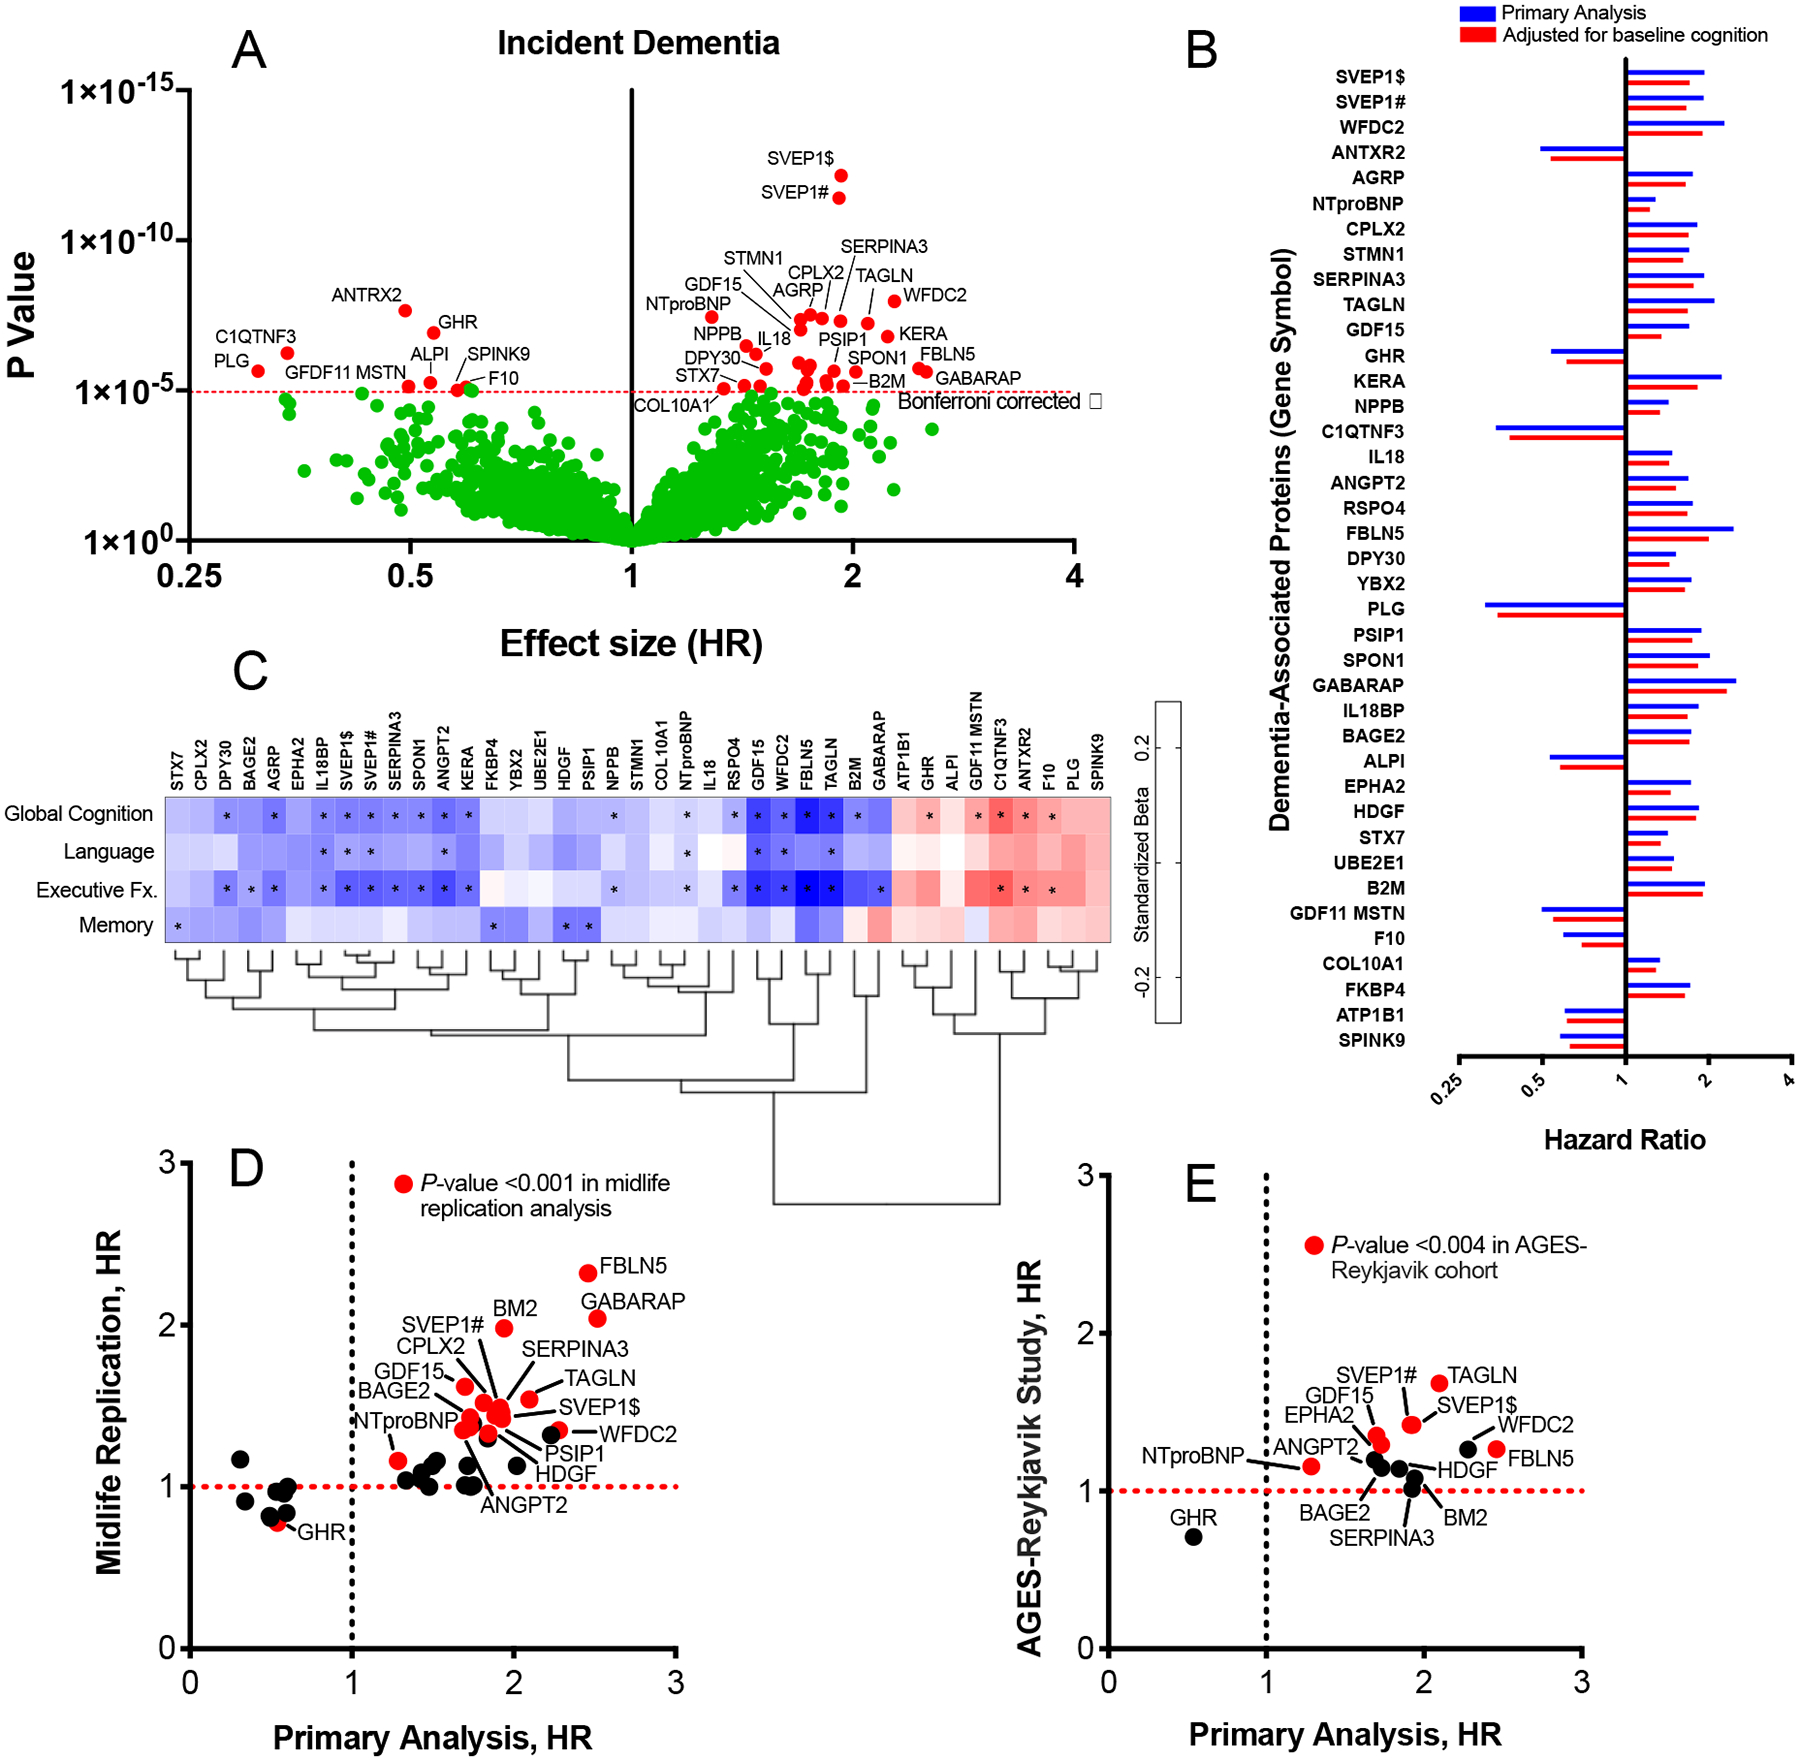
In univariate analyses, 443 unique proteins were significantly associated with incident dementia after Bonferroni correction for multiple comparisons (P<1.03E-05; Supplementary Table 4). After adjusting for demographic factors, APOE ε4 status, cardiovascular risk factors, and kidney function, 38 proteins were associated with incident dementia after Bonferroni correction (Figure 2A; protein list in Supplementary Table 5). At least 10 of the 38 dementia-associated proteins are targeted by known drugs (Supplementary Table 6). The top five dementia-associated proteins identified using the covariate-adjusted model were Sushi, von Willebrand factor type A, EGF and pentraxin domain-containing protein 1 (SVEP1); WAP four-disulfide core domain protein 2 (WFDC2); Anthrax toxin receptor 2 (ANTXR2); Agouti related protein (AGRP); and N-terminal pro-BNP (NTproBNP). Compared with the association between older age and dementia risk derived from our analyses, a doubling of SVEP1, WFDC2, AGRP, and NPPB protein level was equivalent to the effect of 6, 7, 5, and 2 years of additional age on dementia risk, respectively. A doubling in ANTXR2 level was equivalent to the effects of 6 fewer years of age on dementia risk. Exclusion of the APOE ε4 genotype as a covariate to uncover protein-dementia associations driven by this major Alzheimer’s disease risk variant revealed six additional dementia-associated proteins (i.e., IGFBP2, F10, CD14, GM2A, and RPL12 Supplementary Table 7). Results of the primary analyses were robust to additional adjustment for single nucleotide polymorphism (SNP)-based ancestry principal components (PCs),23 with the exception of a few proteins (e.g., BAGE2 and STX7; Supplementary Table 5).
Figure 2.
Proteome-wide associations with incident dementia, midlife replication, and external replication
Estimates for all analyses were derived from Cox proportional hazards regression models adjusted for age, sex, race-center, education, APOE ε4 status, and body mass index, diabetes, hypertension, smoking status, and eGFR-creatinine at the time of protein assessment. (A) Volcano plot showing the hazard ratio (x-axis) and two-sided P-values (y-axis) for the association of log2 protein levels with incident dementia. Proteins above the horizontal dotted red line were significantly associated with incident dementia after Bonferroni correction. (B) Hazard ratios for dementia-associated proteins without (blue bars) and with (red bars) adjustment for global cognitive functioning at baseline. (C) The cross-sectional association between dementia-associated proteins and 4 domains of cognition (global cognition, language, executive function and memory) at baseline (ARIC visit 5). Standardized estimates were calculated from linear regression models adjusted for age, sex, race-center, education, APOE ε4 status, body mass index, diabetes, hypertension, smoking status, and eGFR-creatinine at the time of protein assessment. Estimates represent the standard deviation difference in cognitive factor score per log2 increase in protein level (estimates and two-sided P-values are provided in the supplement). *Indicates statistical significance after Bonferroni correction for multiple comparisons (0.05/38; P=0.0013). (D) Hazard ratios for the midlife (index visit 1993–1995, ages 49–73) replication analysis of the 38 dementia-associated proteins previously identified in older adults (y-axis) plotted against hazard ratios for each dementia-associated protein derived from the primary analysis (index visit 2011–2013, ages 66–90) on the x-axis. The Bonferroni-corrected two-sided α (0.05/38) = 0.0013. (E) Hazard ratios for the AGES-Reykjavik (index visit 2002–2006) replication of proteins that were significantly associated with dementia risk in both the primary and the midlife replication analysis (y-axis) plotted against hazard ratios derived from the primary analysis (x-axis). Thirteen of the 16 candidate proteins were measured in the AGES-Reykjavik and were thus included in this analysis. The Bonferroni-corrected two-sided α (0.05/13) = 0.004. Symbols # and $ indicate different SOMAmers targeting the same protein.
Given that a subset of participants had mild cognitive impairment at the late-life baseline visit, we examined whether the 38 dementia-associated proteins discovered in the primary analysis were associated with progression to dementia independent of baseline cognitive functioning. After adjustment for global cognitive performance measured at the time of the blood draw, 13 out of 38 proteins identified in our primary analysis remained significantly associated with incident dementia at the same Bonferroni-corrected threshold (Supplementary Table 5). This set of 13 plasma proteins were thus associated with symptomatic progression independent of baseline cognitive status, which itself is strongly associated with dementia risk (Figure 2B).24 Nearly all of the dementia-associated proteins showed a cross-sectional association with cognition measured at late-life baseline. Some proteins were strongly associated with memory abilities, whereas others were more closely tied to executive functioning and language (Figure 2C; Supplementary Table 8).
Dementia-Associated Proteins Measured During Midlife.
To reinforce and extend our discovery findings, we examined whether the set of 38 dementia-associated proteins identified in our primary analysis were associated with dementia risk when measured 18 years earlier in middle adulthood using a non-overlapping set of dementia cases. The proteins were measured using the same version of the SomaScan platform at ARIC Study visit 3 (1993–1995) in 11,069 participants (Figure 1B; participant characteristics in Supplementary Table 9; flowchart in Supplementary Figure 2). As previously reported by Lehallier and colleagues,25 there was a modest correlation between late-life and midlife protein levels (median r=0.40; Supplementary Table 10). In the years between visit 3 and the study late-life baseline (visit 5), there were 1,131 incident dementia cases over a median follow-up time of 17.2 years (IQR: 14.2 to 18.3). Sixteen of the 38 dementia-associated proteins measured during middle adulthood (visit 3) were associated with incident dementia after Bonferroni correction, including seven of the top ten proteins (Figure 2D; Extended Data Fig. 1). Thus, nearly half of the proteins associated with dementia risk when measured in late life also showed an association with dementia risk when measured two decades earlier (full results in Supplementary Table 11). The probability of 16 or more proteins replicating out of 38 tested due to chance alone is approximately 1.00E-08.
Replication in the Icelandic AGES-Reykjavik Study.
Next, we set out to evaluate the 16 proteins that were associated with dementia risk in the midlife replication analysis in an external cohort, the AGES-Reykjavik study, which used an earlier generation of the SomaScan platform to perform proteomic profiling on 4,973 participants at study baseline (2002–2006; participant characteristics in Supplementary Table 12).26,27 In the platform, 13 of the 16 candidate proteins were quantified. Of the 4,973 participants (mean age: 76 [SD 5]) included in the analysis, 990 developed dementia over a median 10.3-year (IQR: 6.7 to 11.4) follow-up period. Six of the 13 candidate proteins were significantly associated with incident dementia after Bonferroni correction, including SVEP1 and NTproBNP (Figure 2E; Extended Data Fig. 1). The probability of 6 of 13 proteins replicating due to chance alone is approximately 1.98E-05. Nine of the 13 proteins were associated with incident dementia at an uncorrected P<0.05 threshold (full results in Supplementary Table 13).
Mendelian Randomization Causally Implicates Proteins.
We used a bidirectional two-sample Mendelian randomization to determine whether there was evidence for a causal relationship between the dementia-associated proteins and Alzheimer’s disease. Protein quantitative trait loci (pQTLs) were identified for 22 of the 38 dementia associated proteins in a recent study by Sun et al. using the INTERVAL cohort.28 These pQTL associations at genome-wide significance (P<5.0E-08) and their functional annotations (i.e. eQTL in brain and CADD score) are presented (Supplementary Table 14). After pQTL pruning (pruned at r2<0.05), 10 proteins were identified to have at least 3 pQTL instrumental variables (IVs) for the forward analysis. We used data from a large Alzheimer’s disease GWAS (N=21,982 cases; N=41,944 controls) to examine the causal association between dementia-associated proteins and Alzheimer’s disease risk.22 After excluding outlier IVs, Mendelian randomization conducted using inverse variance weighting (IVW) found evidence for a causal relationship between higher levels of SVEP1 and Alzheimer’s disease and higher levels of PLG and Alzheimer’s disease (Table 1), and analyses using a weighted median method provided additional support for causal effects from SVEP1 but not PLG (Supplementary Table 15). Sensitivity analyses estimates for SVEP1 were consistent with IVW estimates in direction and magnitude, and the MR assumptions were valid (Supplementary Table 15). In the reverse MR analysis, we identified 45 IVs for Alzheimer’s disease and tested whether Alzheimer’s disease influences 22 dementia-associated proteins. We did not identify a causal association of Alzheimer’s disease with any proteins at Bonferroni-corrected significance level (Table 1).
Table 1.
Examination of Alzheimer’s disease causal effects for the dementia-associated proteins using bidirectional Mendelian randomization
| Protein | Gene name | Inverse variance weighting (IVW) estimate | |||||
|---|---|---|---|---|---|---|---|
| Forward (Protein → Alzheimer’s disease) | Backward (Protein ← Alzheimer’s disease) | ||||||
| No. of SNPs | Slope±SE | P-value | No. of SNPs | Slope±SE | P-value | ||
| Agouti-related protein | AGRP | < 3 IVs | 44a | −0.016±0.024 | 0.498 | ||
| Intestinal-type alkaline phosphatase | ALPI | < 3 IVs | 44a | 0.013±0.024 | 0.592 | ||
| Angiopoietin-2 | ANGPT2 | No IV identified | 42a | −0.048±0.025 | 0.061 | ||
| B melanoma antigen 2 | BAGE2 | 4 | −0.041±0.036 | 0.251 | 41a | −0.037±0.026 | 0.167 |
| Complement C1q tumor necrosis factor-related protein 3 | C1QTNF3 | IV not present in AD GWAS | 41a | 0.018±0.026 | 0.496 | ||
| Protein dpy-30 homolog | DPY30 | No IV identified | 44a | −0.015±0.024 | 0.538 | ||
| Ephrin type-A receptor 2 | EPHA2 | < 3 IVs | 42a | −0.051±0.024 | 3.39×10⁻² | ||
| Coagulation Factor X | F10 | 5 | 0.037±0.033 | 0.259 | 44a | 0.029±0.024 | 0.225 |
| Growth/differentiation factor 11/8 | GDF11;MSTN | 3 | −0.025±0.053 | 0.627 | 44a | −0.063±0.024 | 8.24×10⁻³ |
| Growth/differentiation factor 15 | GDF15 | 5a | 0.051±0.030 | 0.085 | 40a | −0.052±0.024 | 3.25×10⁻² |
| Growth hormone receptor | GHR | < 3 IVs | 43a | −0.027±0.024 | 0.251 | ||
| Interleukin-18-binding protein | IL18BP | IV not present in AD GWAS | 44a | −0.045±0.024 | 0.056 | ||
| N-terminal pro-BNP | NPPB | 4 | 0.058±0.039 | 0.136 | 43a | −0.005±0.024 | 0.835 |
| Angiostatin | PLG | 9a | 0.083±0.029 | 4.51×10⁻³† | 39a | 0.013±0.025 | 0.616 |
| R-spondin-4 | RSPO4 | Not enough IVs | 44a | −0.042±0.024 | 0.076 | ||
| Serine protease inhibitor Kazal-type 9 | SPINK9 | IV not present in AD GWAS | 45 | 0.036±0.024 | 0.126 | ||
| Spondin-1 | SPON1 | 3 | 0.002±0.033 | 0.954 | 43a | −0.014±0.024 | 0.558 |
| Syntaxin-7 | STX7 | 5a | −0.002±0.026 | 0.932 | 42a | −0.012±0.024 | 0.622 |
| Sushi, von Willebrand factor type A $ | SVEP1 | 8a | 0.077±0.024 | 1.38×10⁻³† | 45 | −0.013±0.024 | 0.597 |
| Sushi, von Willebrand factor type A # | SVEP1 | 8a | 0.075±0.024 | 2.16×10⁻³† | 45 | −0.031±0.024 | 0.190 |
| Transgelin | TAGLN | No IV identified | 43a | 0.017±0.024 | 0.487 | ||
| WAP four-disulfide core domain protein 2 | WFDC2 | No IV identified | 45 | −0.037±0.024 | 0.116 | ||
| Y-box-binding protein 2 | YBX2 | 3 | −0.028±0.041 | 0.497 | 39a | 0.015±0.026 | 0.565 |
GWAS information from Kunkle et al. (2019) used for Mendelian randomization analysis;
Symbols # and $ indicate different SOMAmers targeting the same protein.
Outlier was detected. IVW analysis was re-performed excluding the outliers.
Significant causal association at Bonferroni-adjusted significance level (0.05/number of proteins included in the analysis): two-sided P < 3.33×10⁻³ for forward and two-sided P < 2.27×10⁻³ for backward.
Next, we examined whether the pQTLs identified for each of the dementia-associated proteins (a total of 2,731 unpruned genome-wide significant pQTLs) were associated with mRNA transcript expression of genes in brain tissues. We identified 85 genes for which dementia-associated protein pQTLs were also eQTLs in brain tissues (Supplementary Tables 14 and 16). An enrichment analysis of brain eQTL genes implicated ephrin receptor activity, aligning with previous finding that ephrin receptors play a role in Alzheimer’s disease and amyloid-related synaptic dysfunction (gene enrichment analyses provided in Supplementary Table 17).29
Proteomic Prediction of Dementia.
Plasma proteins have demonstrated good prediction of current dementia previously in case-control studies, with AUCs generally ranging from 0.70 to 0.80,30 but the utility of circulating proteins for prediction of future dementia events has not been established. We examined the degree to which plasma proteins can predict future progression to dementia using elastic net machine learning to select optimal protein combinations. The protein-only prediction model had an average area under the curve (AUC) of 0.744 (95% CI: 0.714, 0.774) calculated using ten-fold cross-validation. By comparison, the combination of participant age, race, sex, education, and APOE ε4 status yielded an AUC of 0.760 (95% CI: 0.730, 0.790). As displayed in Extended Data Figure 2, adding dementia-associated proteins to a model that included demographic characteristics significantly improved the AUC (Δ for C statistic was 0.017, P=0.02). The addition of proteins did not significantly improve dementia prediction for a model that additionally included clinical variables. Recent findings suggest that measurement of known disease-specific molecules in plasma (e.g., tau phosphorylated at threonine 217 for Alzheimer’s disease) is likely to yield even greater predictive accuracy.31
Dementia-Associated Proteins and Neuroimaging Measures.
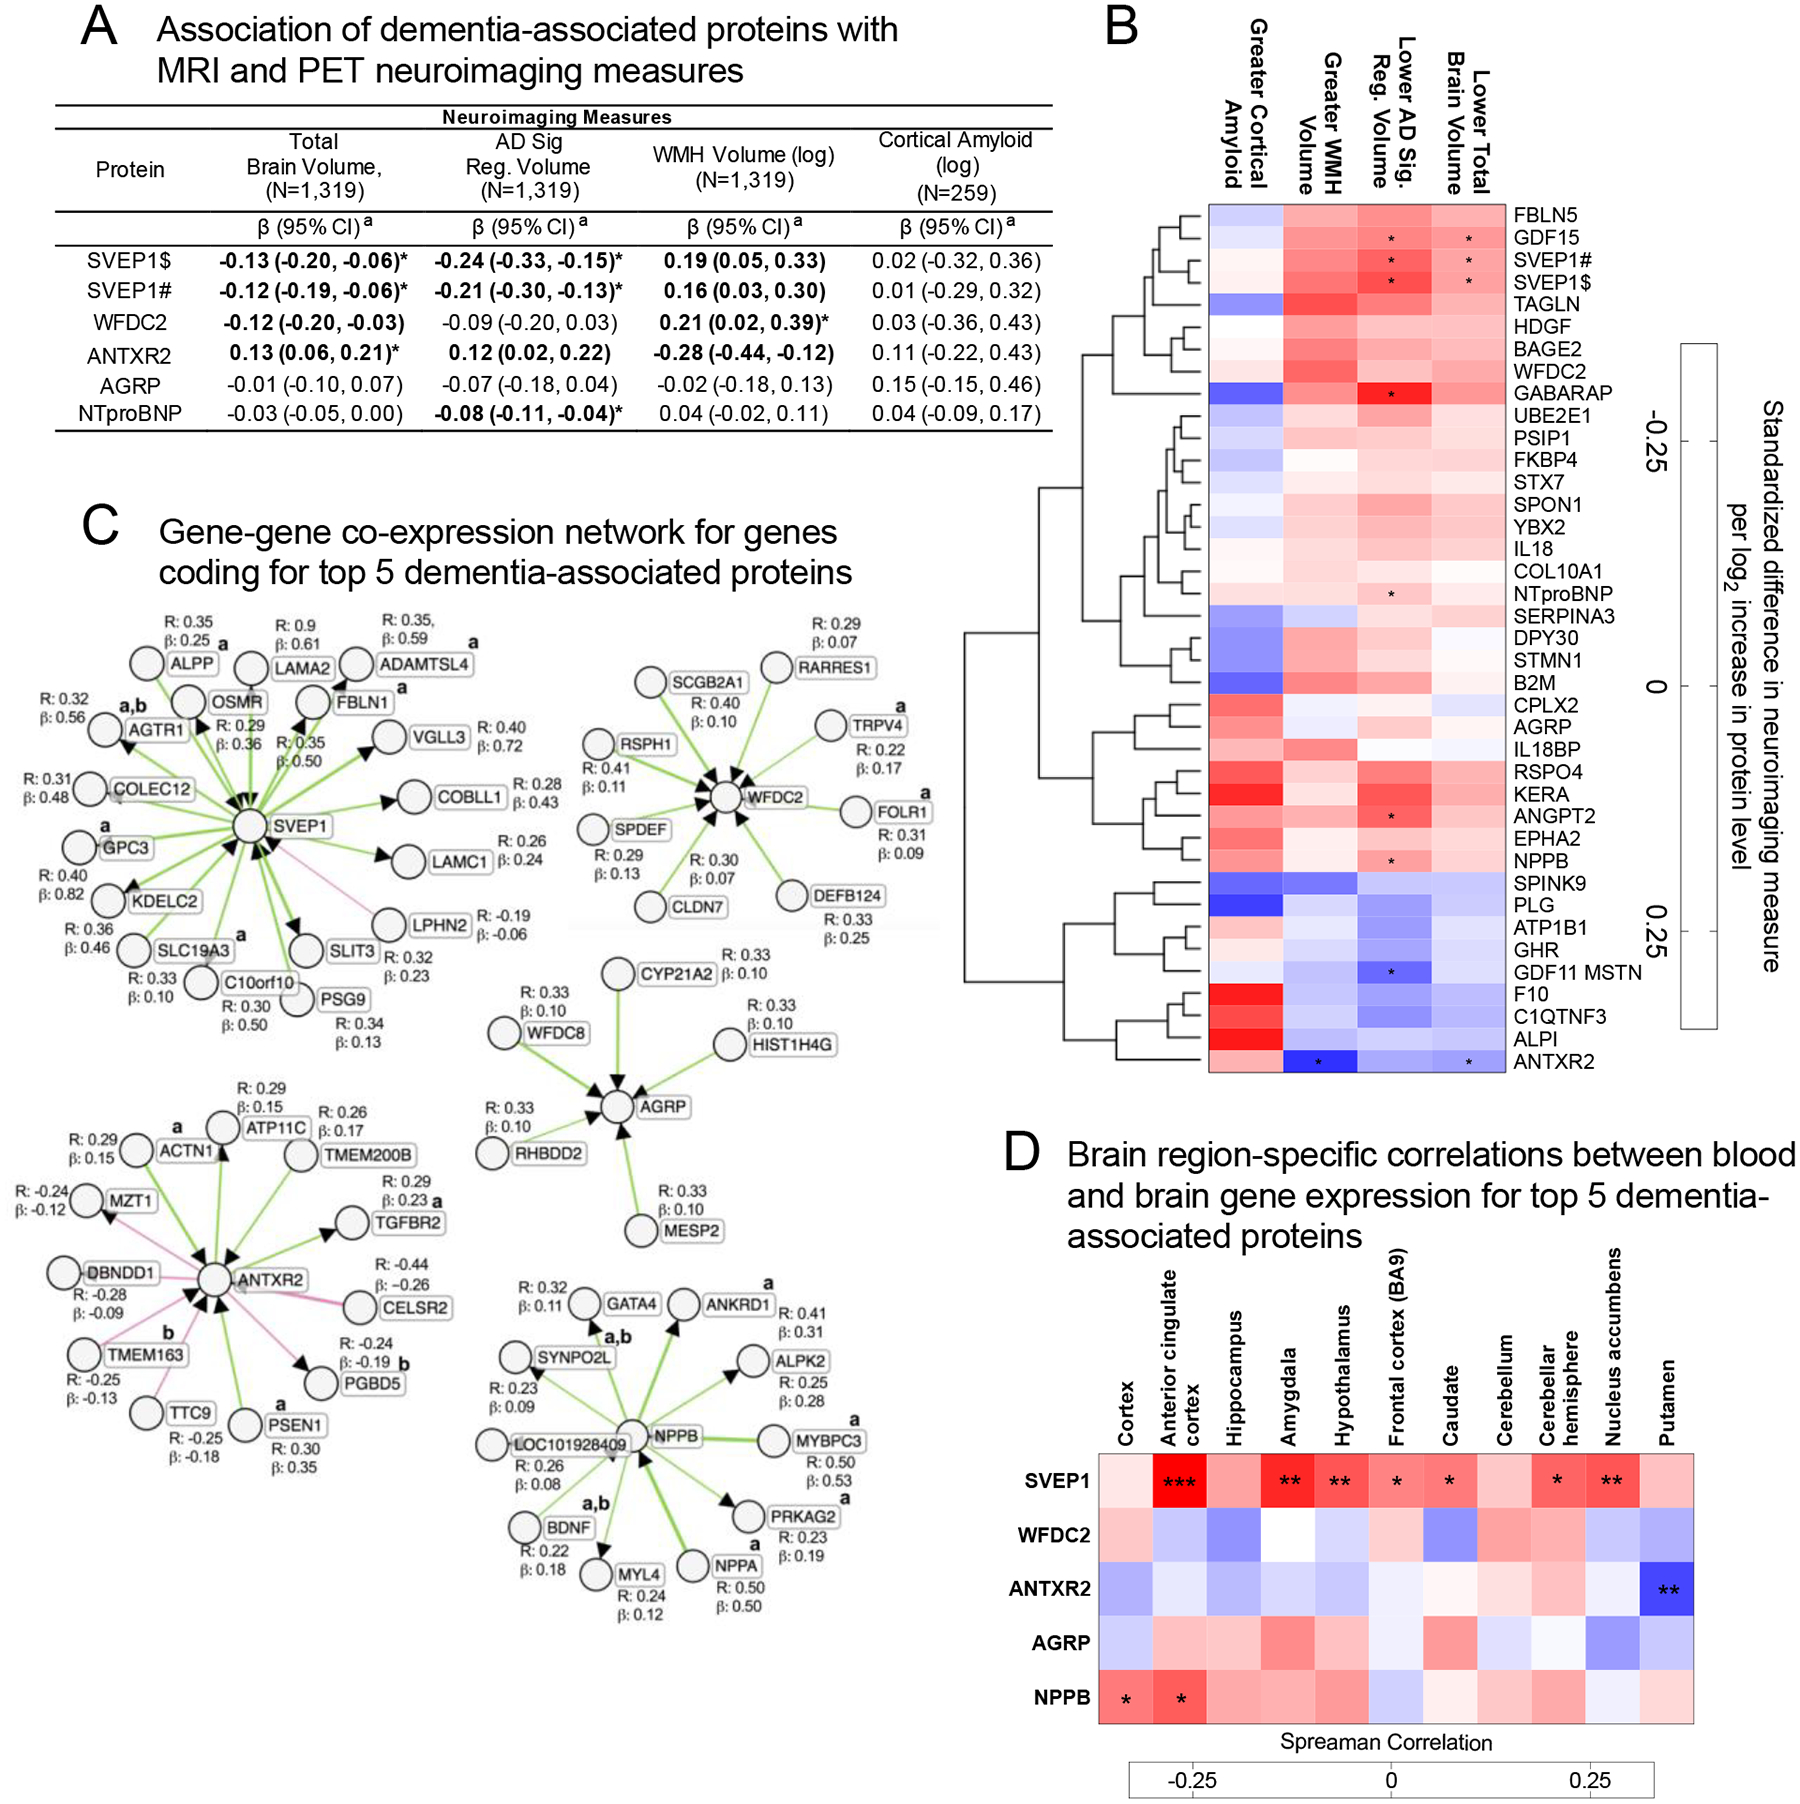
We examined the cross-sectional association of dementia-associated plasma protein levels with structural brain MRI (n=1,319) and amyloid PET (n=259) measures taken at or near the time of the blood draw (Supplementary Table 2). Dementia-associated protein levels were significantly associated with MRI markers of neurodegeneration (reduced brain volumes) and white matter pathology (white matter hyperintensity [WMH] volume), after adjustment for confounders (Figures 3A and 3B; Supplementary Table 18). A focused examination of the top five dementia-associated proteins found that SVEP1and NTproBNP levels were most strongly associated with smaller brain volume in regions vulnerable to Alzheimer’s disease, whereas WFDC2 and ANTXR2 were most strongly associated with WMH volume (Figure 3A). A hierarchical cluster analysis (Figure 3B) indicated the existence of protein subgroups related to neuroimaging markers of neurodegeneration, white matter pathology, and amyloid-specific processes known to contribute to dementia (Figure 3B). There was less power to detect associations between proteins and cortical amyloid given that fewer participants underwent PET neuroimaging. Although one association between intestinal-type alkaline phosphatase (ALPI) and cortical amyloid emerged, it did not survive correction for multiple comparisons (Supplementary Table 18). Unexpectedly, some proteins showing suggestive associations with greater cortical amyloid were also associated with lower neurodegeneration and white matter pathology. This finding is consistent with previous work demonstrating that certain biological processes can have divergent effects on neurodegenerative and amyloidogenic brain changes.32,33
Figure 3.
Association of dementia-associated proteins with neuroimaging markers and gene co-expression analyses
(A) The association of the top five dementia-associated proteins with MRI-defined total brain volume, Alzheimer’s disease signature region (AD Sig. Reg.) volume, white matter hyperintensity (WMH) volume, and cortical ß-amyloid defined using florbetapir PET imaging. Bolded estimates were statistically significant (two-sided P<0.05). a Estimates represent the difference in neuroimaging measure per log2 increase in protein level. (B) Heatmap showing the adjusted association between dementia-associated proteins and neuroimaging measures for all dementia-associated proteins. An unsupervised hierarchical cluster analysis was used to group proteins based on their association with all displayed neuroimaging outcomes. (A, B) Analyses were conducted using multivariable linear regression adjusted for baseline age, sex, race-center, education, APOE ε4 status, baseline body mass index, diabetes, hypertension, smoking status, eGFR-creatinine, and, where appropriate, intracranial volume. Neuroimaging variables were standardized to facilitate comparability across measures. *Indicates statistical significance after Bonferroni correction for multiple comparisons (0.05/38; two-sided P=0.0013). Symbols # and $ indicate different SOMAmers targeting the same protein. (C) Gene co-expression networks for the top five dementia-associated proteins. Co-expression analyses were conducted on whole blood gene expression data from 244 participants. Results were derived using the ExplainBio algorithm.35,36 a Indicates the gene or gene product has been previously associated with Alzheimer’s disease in the literature. b Indicates the gene or gene product has been previously associated with dementia or dementia-related phenotypes in the literature (see supplement for list of references). (D) Spearman correlations between whole blood gene expression and gene expression in select brain regions for the genes coding for the top five dementia-associated proteins in postmortem samples. A two-sided type 1 error of 5% was considered statistically significant.
*P<0.05; **P<0.01; ***P<0.001
Expression of Genes Coding for Dementia-Associated Proteins.
Many of the genes coding for dementia-associated proteins were expressed at relatively low levels in blood, but higher levels in other tissues, including adipose, heart, and spleen (Extended Data Fig. 3). An examination of the top five dementia-associated proteins found that the expression of SVEP1 and ANTXR2 in blood, though generally low, correlated with expression of the same gene in one or more brain region (Figure 3D; Supplemental Table 19). SVEP1, in particular, showed a consistent blood vs. brain gene expression correspondence across multiple brain regions, with a particularly strong association in the anterior cingulate cortex. Thus, for at least a subset of dementia-associated proteins, the abundance of transcripts in blood relate to the abundance of transcripts in the brain. We also conducted gene network analyses to determine which genes are likely co-expressed with genes coding for the top five dementia-associated proteins using the ExplainBio tool.34 As is indicated in Figure 3C, each dementia-associated protein has between 5 and 19 co-expressed genes, several of which have been previously implicated in Alzheimer’s disease and dementia. Interestingly, the gene coding for dementia-associated protein ANTXR2 was found to be co-expressed with PSEN1, which codes for the proteolytic subunit of γ-secretase, an important component of brain Aβ peptide production (co-expressed gene details and functional annotations are provided in Supplementary Table 20).
Enriched Biological Pathways and Protein Networks.
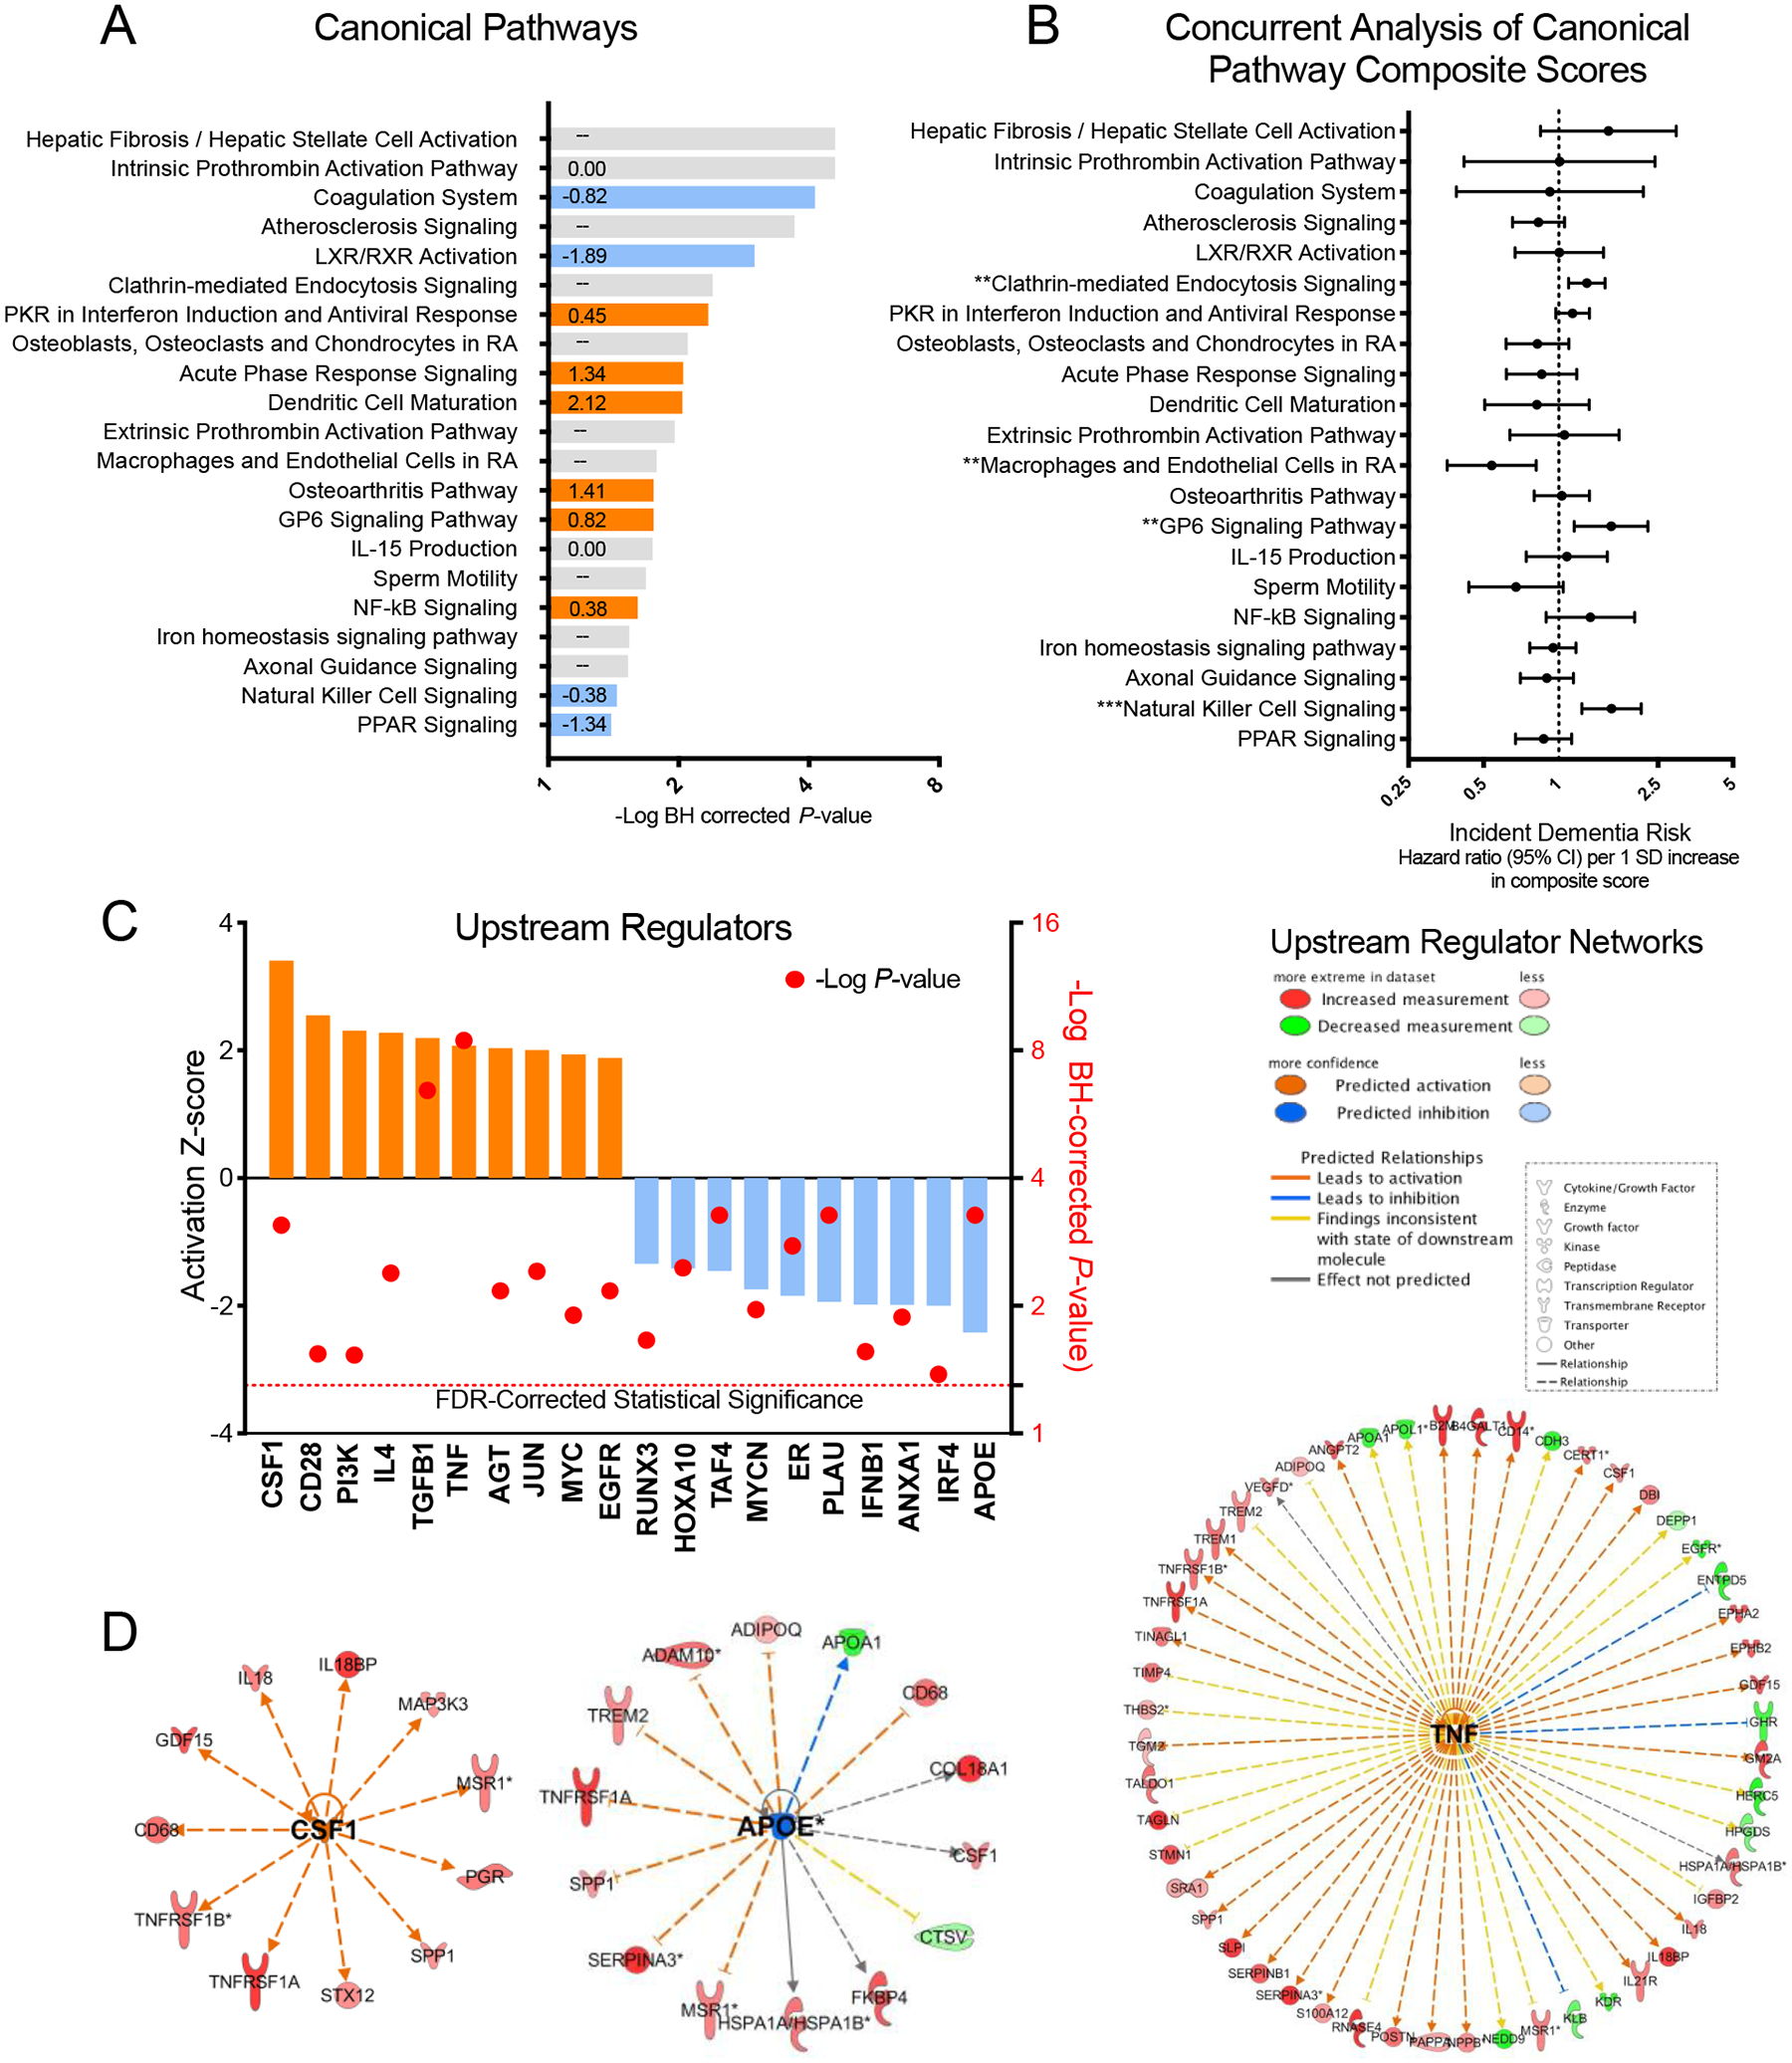
We next performed pathway analyses to understand the biological processes and regulatory mechanisms that may be disrupted in individuals at risk for dementia. The set of 212 dementia-associated proteins significant at a false discovery rate (FDR) threshold of 0.05 were organized into canonical (well-understood biological) pathways by the Ingenuity Pathway Analysis (IPA) tool. As shown in Figure 4A and Supplementary Table 21, dementia-associated proteins were enriched for a number of biological pathways, including pathways involved in lipid and metabolic signaling, vascular function/hemostasis, and innate immunity. To further understand the degree to which these biological pathways are associated with dementia risk, we developed a composite score (Canonical Pathway Composite Scores) for each canonical pathway based on the set of proteins associated with each pathway (Supplementary Table 22). In an analysis that examined Canonical Pathway Composite Scores side-by-side in relation to dementia risk using a single model (to account for pathway overlap), Composite Scores representing endocytosis signaling, innate immune activation, and glycoprotein 6 pathway signaling were independently associated with dementia risk (Figure 4B and Supplementary Table 23). Thus, changes to these components of peripheral biology are uniquely associated with, and may contribute to, future dementia risk.
Figure 4.
Biological pathways and upstream regulators implicated in dementia risk
(A) Canonical (biological) pathways identified using Ingenuity Pathway Analysis (IPA) that met the threshold for statistical significance (P <0.05) using right-tailed (one-sided) Fisher’s exact test and FDR-correction for multiple comparisons are displayed. Orange and blue pathways are estimated to be activated and inhibited, respectively, in individuals who progress to dementia. Predicted activation z-scores are displayed within each bar. The direction of activation could not be predicted based on observed relationships for canonical pathways that display no z-score. (B) The association between derived Canonical Pathway Composite Scores and risk for incident dementia calculated using a single Cox regression model that included all 21 Canonical Pathway Composite Scores and demographic and clinical confounder variables. Data are presented as Hazard ratios and 95% confidence intervals. Hazard ratios represent dementia risk associated with a one standard deviation increase in Canonical Pathway Composite Score. The statistical tests were two-sided. Because this was a single test, there was no adjustment for multiple comparisons. (C) Predicted upstream regulators of dementia-associated protein expression based on experimentally observed relationships. Activation z-scores are represented by colored bars and correspond to the left y-axis. P-values calculated using right-tailed (one-sided) Fisher’s exact test and FDR-correction for multiple comparisons are represented by the red circles. These values correspond to the right y-axis and represent the degree of overlap between known upstream regulator target proteins and identified dementia-associated proteins. (D) The network of target proteins regulated by top activated upstream regulator colony stimulating factor 1 (CSF1), top inhibited upstream regulator apolipoprotein E (APOE), and the upstream regulator with greatest statistical overlap, tumor necrosis factor (TNF). All target proteins were associated with incident dementia at an FDR-corrected significance level (P < 0.05) in the primary analysis.
*P< 0.05; **P<0.01; ***P<0.001
To determine how protein groups may work together to influence dementia risk, we next identified networks of related proteins from the set of 212 dementia-associated proteins using the IPA Networks Analysis, an algorithm that groups proteins based on known genetic or molecular relationships to other genes or gene products.37 Twelve networks consisting of 10 or more dementia-associated proteins were identified and their ontologies were characterized (Figure 5; Extended Data Fig. 4–8; Supplementary Table 24). An analysis which examined Protein Network Scores (Supplementary Table 25) side-by-side in relation to dementia risk using a single model found that that five Protein Network Scores were independently associated with dementia risk (Figure 5A; Supplementary Table 26). The strongest association was found for the immune network (Network 4), which includes a group of interconnected dementia-associated proteins, including TREM2, TREM1, IL18, IFNA4, and SERPINB1, with an NF-κB hub (a transcription factor that is central to innate immune function). This network was enriched for cytokines and proteins known to be involved in microglial pathogen phagocytosis (Figures 5C and 5D; Extended Data Fig. 6). This plasma protein network may therefore represent the peripheral signature of the microglia response to neurodegenerative processes, what has been termed disease-associated microglia (DAM).38 Plasma protein networks associated with extracellular matrix organization, endopeptidase activity, PPAR signaling, and lipid binding were also independently associated with dementia risk. We found each of these protein networks to be differentially associated with neuroimaging characteristics, suggesting they may relate to dementia risk through distinct neurobiological substrates (Figure 5B).
Figure 5.
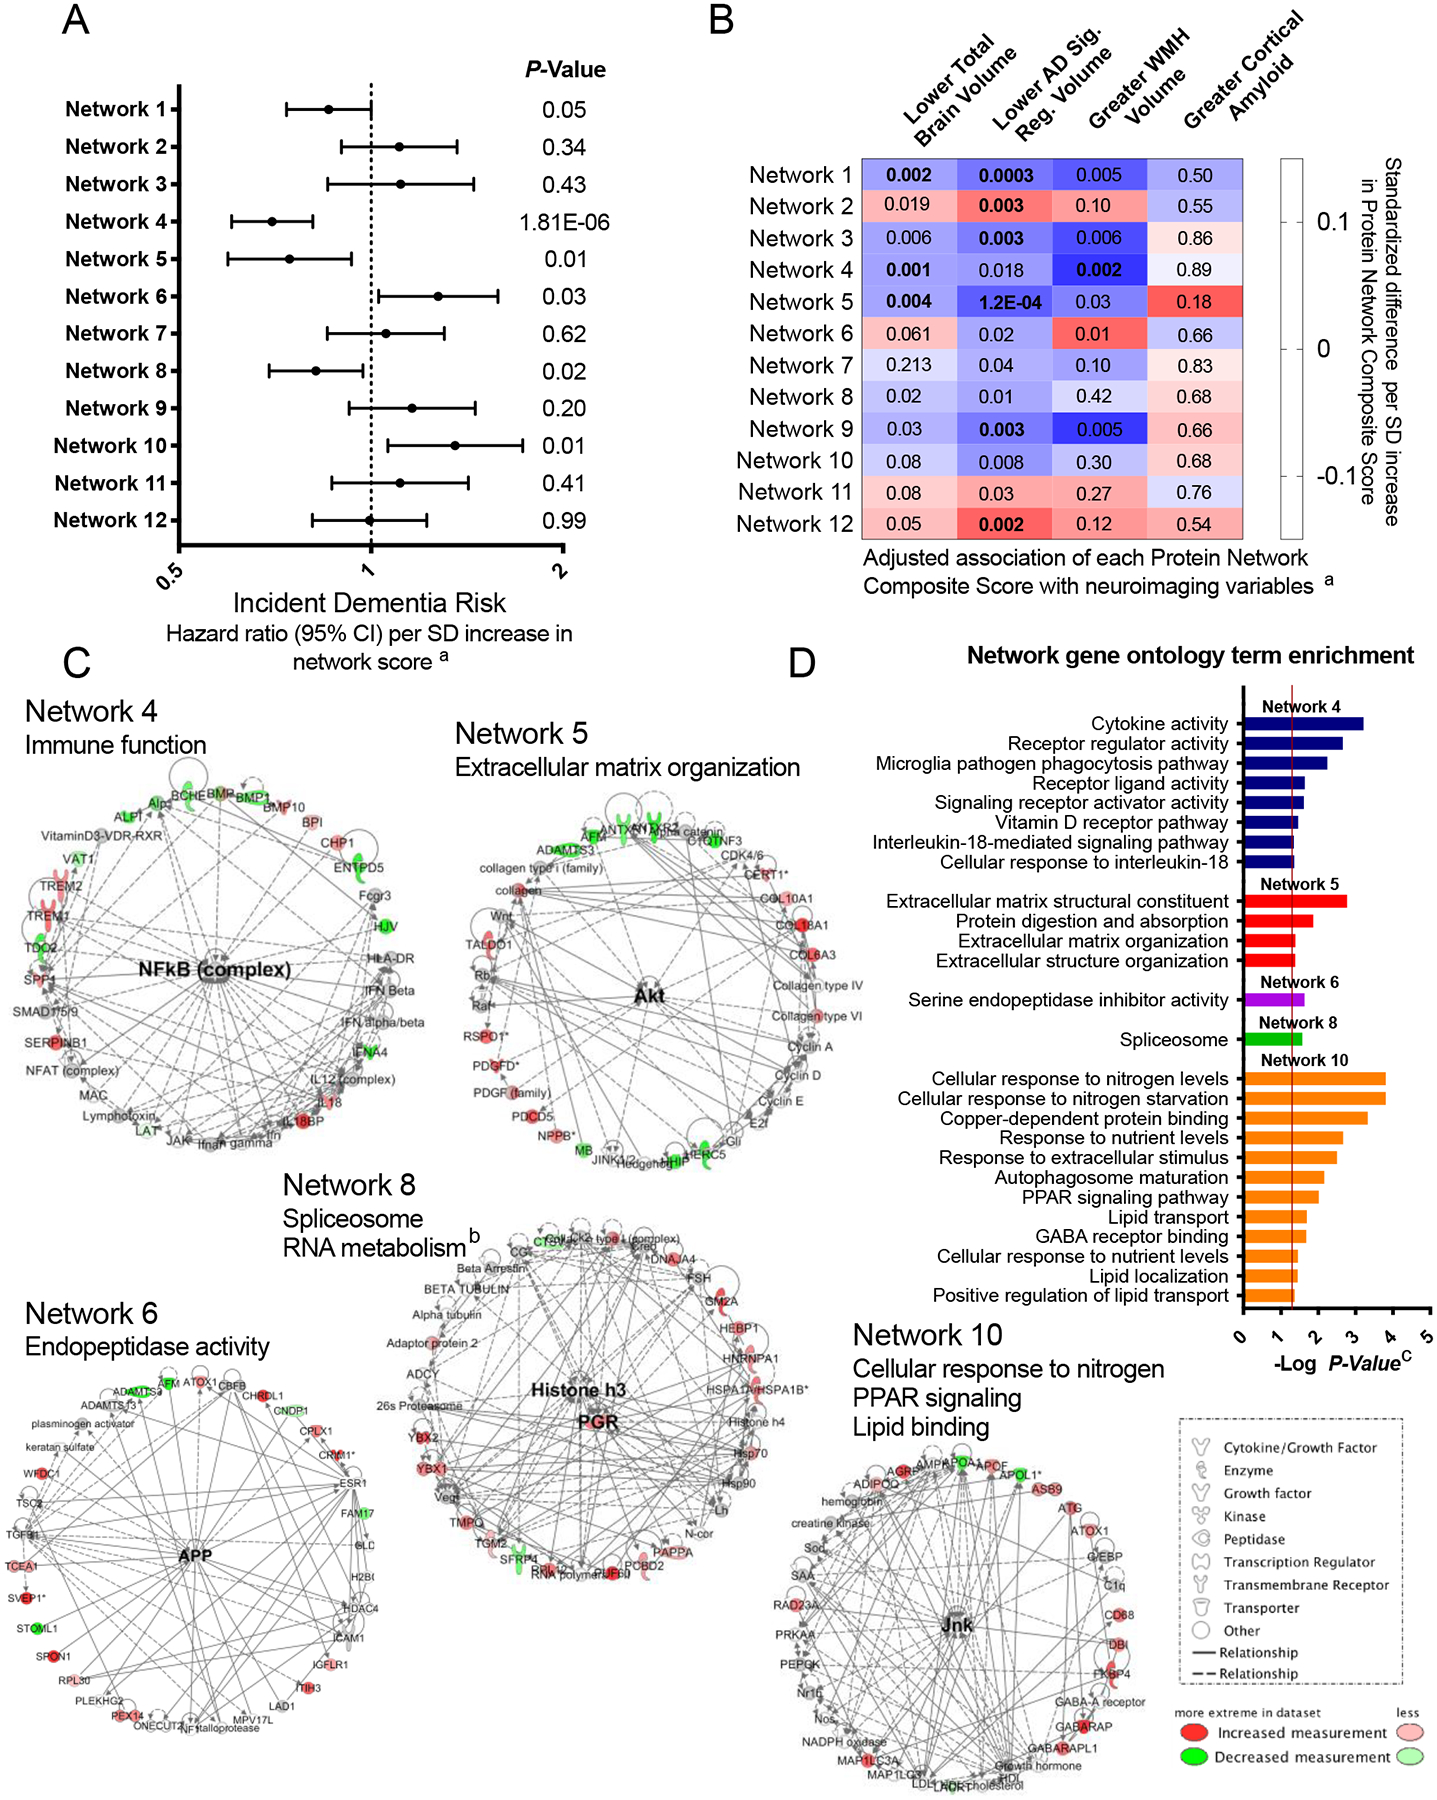
Protein networks identified among dementia-associated proteins
Twelve networks of dementia-associated proteins were derived based on known genetic and molecular relationships using Ingenuity Pathway Analysis (IPA). (A) The association between Protein Network Composite Scores and risk for incident dementia calculated using a single Cox model that included all 12 Protein Network Composite Scores in addition to demographic and clinical confounder variables. Data are presented as Hazard ratios and 95% confidence intervals and two-sided P-values. Hazard ratios represent the dementia risk associated with a one standard deviation increase in Protein Network Composite Score. Because this was a single test, there was no adjustment for multiple comparisons. (B) The association of Protein Network Composite Scores with MRI-defined total brain volume, Alzheimer’s disease signature region (AD Sig. Reg.) volume, white matter hyperintensity (WMH) volume, and cortical ß-amyloid defined using florbetapir PET imaging. P-values are displayed inside each cell (bolded terms are statistically significant after Bonferroni correction (0.05/12; two-sided P<0.004). (C) Dementia-associated protein networks and associated functional annotations. Red nodes represent proteins that were more abundant in participants who subsequently developed dementia. Green nodes represent proteins that were less abundant in participants who subsequently developed dementia. Gray nodes represent measured proteins unrelated to dementia risk, and white nodes represent unmeasured proteins that were integrated into the computationally-derived networks based on previous evidence of network relevance derived from the Ingenuity Knowledge Base. Lines represent connections between proteins, genes, or other gene products identified in the Ingenuity Knowledge Base. (D) (D) The g:Profiler toolkit was used to assess the functional enrichment.39 Functional profiling of each protein set was conducted using the Gene Ontology (GO),40,41 Kyoto Encyclopedia of Genes and Genomes (KEGG),42 and WikiPathways43 databases. The full set of GO molecular function, GO biological process, KEGG, and WikiPathway terms are provided in Extended Data Fig. 4–8.
a Model adjusted for age, sex, race-center, education, APOEε4, and baseline body mass index, diabetes, hypertension, smoking status, and eGFR-creatinine.
b Term derived from Ingenuity Pathway Analysis protein network ontology.
c Adjusted for multiple comparisons using the g:SCS algorithm in the g:Profiler.39
Upstream Regulators of Dementia Associated Proteins.
Next, we used IPA to determine which genes, proteins, or other gene products may control the expression of dementia-associated protein groups, and thus play an upstream regulatory function. The top predicted upstream regulators are presented in Figure 4C and the full set of target proteins is presented in Supplementary Table 27. Several inflammatory cytokines were predicted to be among the top regulators of dementia-associated protein expression. This is consistent with evidence from multiple lines of research which suggests that immune function plays an important role in dementia pathogenesis.44–48 TNF, a top upstream regulator identified in the current study, has been identified previously as the top regulator of differentially expressed genes in Alzheimer’s disease brains.49 TGFβ, another top upstream regulator, has been previously identified as a key regulator of microglia’s immunological response to β-amyloid.50 Regulators of other physiological processes were also implicated, including apolipoprotein E (APOE). APOE, a major Alzheimer’s disease risk gene, was predicted to act as regulator of dementia-associated proteins. Inhibition of APOE was associated with an increased abundance of a number of molecules, including TREM2 and ADAM10, which have been implicated in Alzheimer’s disease genomic studies and linked to dementia risk in the current analysis (Figure 4D).22,51 A subset of upstream regulator proteins were themselves associated with dementia risk (CSF1, AGT, MYC, and EGFR; Supplementary Table 27).
Identification of Dementia-Associated Proteins Using PEER.
Given the number of unobservable factors that may affect proteomic expression, we next used the Probabilistic Estimation of Expression Residuals (PEER) method to examine the effect of removing hidden biological pathways or regulators, or technical/environmental artifacts that may broadly affect proteomic expression.52,53 After PEER adjustment, complexin-2 remained associated with dementia risk (HR, 2.48; 95% CI: 1.89, 3.28; P=1.05E-10). PEER adjusted analysis conducted for complexin-2 measured during midlife also found a significant association between protein level and dementia risk (HR, 1.62; 95% CI: 1.33, 1.99; P=2.65E-06). Complexin-2 is a protein primarily expressed in the brain which has been shown to regulate vesicle fusion in pre-synaptic neurons and cytoplasmic vesicle exocytosis,54,55 but little is known about its potential role in Alzheimer’s disease pathogenesis.56 The current results suggest that unlike other dementia-associated proteins, complexin-2 may affect dementia risk independent of broader biological signals captured using PEER factors. Of the 110 PEER factors used in the analysis of proteins at late-life baseline, three were associated with dementia risk (Extended Data Fig. 9). These three PEER factors captured proteomic variation related to innate and adaptive immune activation and cardiovascular functioning (Supplementary Table 28).
Discussion
Until recently, the high throughput technology needed to simultaneously quantify thousands of proteins in thousands of blood samples was unavailable, and as such, an understanding of the spectrum of circulating protein changes associated with dementia risk remained incomplete. The current study, which extensively characterized the proteome of non-demented individuals who later developed dementia, reassuringly ‘replicates’ some of the associations that emerged from previous small case-control studies (see Supplementary Table 29), but also identified an expanded group of plasma proteins whose levels were altered in individuals who subsequently developed dementia. Notably, 38 proteins were independently associated with dementia risk over a 5-year follow-up period at a Bonferroni-corrected significance level. Over 200 unique proteins met the less stringent FDR-corrected threshold, suggesting that there is a sizable plasma proteomic signature associated with future dementia. Nearly half of these 38 proteins also demonstrated a robust association with a different set of incident dementia cases when measured in blood collected nearly 20 years earlier, and a number of these associations were further reinforced by validation in a population on a different continent. We found Mendelian randomization support for a causal link between at least one dementia-associated protein (SVEP1) and Alzheimer’s disease, and demonstrated further that plasma protein levels relate strongly to neuroimaging-defined dementia endophenotypes. Systems-level analyses of the broader set of dementia-associated proteins most consistently implicated peripheral immune, vascular/hemostasis, and cholesterol metabolic processes as being relevant to dementia risk.
Statistical associations between protein level and dementia risk provided in this study do not by themselves establish causality. However, Mendelian randomization analyses provided evidence for causal links between SVEP1 and Alzheimer’s disease. While SVEP1 genotype has been associated with sepsis severity and circulating cytokine levels,57,58 to our knowledge, no previous study has demonstrated an association between SVEP1 protein level and neurodegenerative disease. SVEP1 acts as a ligand for integrin α9β1 and is believed to facilitate cellular adhesion in the context of pro-inflammatory signaling.57,59,60 Numerous studies have identified increased vascular adhesion as a key feature of aging and age-related diseases,61–63 consistent with recent findings showing SVEP1 to be among the top proteins positively associated with age.25 Given that age-related increase of leukocyte adhesion to brain endothelial cells have been shown to promote neuroinflammation and cognitive impairment in rodent models,62 it is plausible that SVEP1 similarly influences Alzheimer’s disease risk by facilitating immune cell adhesion to cerebral vessel walls. Future mechanistic studies will be needed to further test this hypothesis and its implications for treatment.
Mendelian randomization analyses also suggested a causal link between angiostatin, an anti-angiogenic protein coded for by the plasminogen gene (PLG), and Alzheimer’s disease; however, these results were less robust to sensitivity analyses. Microvascular dysfunction and angiogenesis are known features of Alzheimer’s disease, and one translational study suggests that angiostatin may regulate these neurobiological processes in the context of cerebral amyloid pathology.64 Although higher levels of the angiostatin protein were associated with lower dementia risk in the ARIC cohort, the Mendelian randomization results suggests that a genetic propensity for greater plasma angiostatin levels increases Alzheimer’s disease risk. The relationship of levels and activity of angiostatin across tissues is unclear, but given the discordant directions between the protein-dementia and pQTL-Alzheimer’s disease associations, our angiostatin findings should be interpreted with caution.
Using repeated protein measurement across an extended follow-up period, the midlife replication analyses provide insight into the temporal relevance of specific molecules and, by extension, specific biological processes. For example, proteins such as complexin-2 demonstrated a consistent association across the age range, providing further support for their relevance in early and late stages of dementia pathogenesis. In contrast, our results indicate that proteins such as spondin-1 and IL-18, which have been previously implicated in Alzheimer’s disease,65,66 may only become abnormal closer to the time of dementia onset. Furthermore, neuroimaging analyses suggest that dementia-associated proteins differ in terms of their relationship with neurobiological processes underlying dementia, with some proteins showing comparatively stronger associations with neurodegeneration in regions vulnerable to Alzheimer’s disease pathology, and others with white matter pathology. Proteins that show (a) a mid- and late-life association with dementia risk and (b) an association with atrophy in Alzheimer’s vulnerable brain regions (e.g., SVEP1, GDF15, NPPB, NTproBNP, GABARAP, ANGPT2) should be prioritized for investigation of Alzheimer’s disease therapeutic potential. There are drugs currently available which target some of these high priority proteins (Supplementary Table 6).
The current results offer new insight into the biological changes that may precede dementia onset. While reinforcing results from previous plasma proteomic and gene expression studies of Alzheimer’s disease that show enrichment for NF-kB and cytokine signaling, complement activation, and lipid signaling pathways, these results also extend current knowledge by highlighting the relevance of other peripheral pathways, such as those which regulate coagulation (GP6) and natural killer (NK) cell signaling.15,16,67 Additionally, we have identified several biologically relevant plasma protein networks that are independently associated with dementia risk. A network enriched for immune signaling proteins, including TREM1, TREM2, IL-18, and LAT, had the most robust association with dementia risk and related strongly to MRI markers of gray and white matter integrity. Further functional profiling of this protein network indicates that it may represent the peripheral signature of the microglial response to Alzheimer’s or other neurodegenerative pathology.68 One of the proteins in this network, TREM2 (triggering receptor expressed on myeloid cells 2), is a receptor known to play a role in modulating microglial function and neuroinflammation in Alzheimer’s disease.69 The identified plasma protein network may therefore be important for Alzheimer’s disease neuro-immune monitoring,68 particularly for therapeutics which target microglia function.
The current study has numerous strengths and innovations, including the use of a high throughput proteomic technology applied to a large community-based sample, an extended follow-up for the longitudinal assessment of dementia risk at both older age and middle age, the replication of candidate proteins in a different age range and geographic region, a comprehensive assessment of neurocognitive and neuroimaging outcomes, and state-of-the-art analyses to determine which of the protein biomarkers are also disease mediators and plausible targets of therapies. Nevertheless, the results should be interpreted within the context of some limitations. First, although the results of this community-based study may apply to the population of white and Black adults living within the United States, the ARIC population characteristics limit the generalizability of results to individuals of other racial and ethnic groups. However, the partial replication of our protein-dementia associations in a demographically dissimilar external cohort supports the generalizability of our results. An additional limitation is the inability to classify dementia by presumed etiology within the ARIC cohort. This is a common limitation given the challenges associated with the accurate diagnosis of Alzheimer’s disease ante-mortem, especially in a large cohort study where cerebral spinal fluid (CSF) and PET analyses are less feasible. Given that this is a community-based sample, the majority of dementia cases were suspected to be pathologically defined by either Alzheimer’s or mixed Alzheimer’s-cerebrovascular disease. The likely mix of dementia causes in our primary outcome measure reduced power to identify proteins associated with specific dementia etiologies; however, we did evaluate protein associations with Alzheimer’s-relevant neuroimaging findings and Alzheimer’s-specific GWAS. Future studies that incorporate CSF, PET imaging, brain autopsy, or new highly-sensitive plasma biomarkers will be important for linking identified proteins to specific neurodegenerative conditions. Results from the current protein-amyloid PET analyses should be interpreted with caution given the modest sample size and the potential effects of selection introduced by neuroimaging substudy inclusion criteria. Finally, although SomaScan provides the most comprehensive assessment of circulating proteins, this platform does not fully capture the human proteome and may be biased in its preferential measurement of secreted proteins.28
Methods
Study Design and Participants
This study was conducted using data from the Atherosclerosis Risk in Communities (ARIC) study, an ongoing community-based cohort study that initially enrolled 15,792 participants from four communities across the US: Washington County, Maryland; Forsyth County, North Carolina; northwestern suburbs of Minneapolis, Minnesota; and Jackson, Mississippi between 1987 and 1989.70 ARIC participants were evaluated every three years at study visits until visit 4 (1996–1998). Fifteen years after visit 4, participants were invited back for visit 5 (2011–2013). Participants were invited back for visit 6 (2016–2017) approximately five years later (the study design is illustrated in Supplementary Figure 1). Study protocol were approved by Institutional Review Boards at each participating center: University of North Carolina at Chapel Hill, Chapel Hill, NC; Wake Forest University, Winston-Salem, NC; Johns Hopkins University, Baltimore, MD; University of Minnesota, Minneapolis, MN; and University of Mississippi Medical Center, Jackson, MS. All participants gave written informed consent at each study visit, and proxies provided consent for participants who were judged to lack capacity. The current study complies with STROBE guidelines.
Statistics & Reproducibility
The current analysis used a cohort study design (detailed above). No statistical methods were used to predetermine sample sizes. Sample sizes were determined based on available data.
The primary analysis examined the association of protein level at ARIC visit 5 (late-life baseline) with dementia risk between visits 5 and 6. As illustrated in Supplementary Figure 1, participants who met criteria for dementia at visit 5 were excluded from the primary analysis, as were participants missing proteomic data, covariate information, or the visit 5 cognitive assessment. After participant exclusions, a total of 4,110 participants were included in the primary analyses. The midlife replication analysis included participants who were non-demented at ARIC visit 3 (1993–1995). This analysis examined the association of protein level at visit 3 with dementia risk between visits 3 and 5. The incident dementia cases included in the midlife replication analysis (cases occurring after visit 3, but before visit 5) were completely distinct from the incident dementia cases included in the primary analysis (cases occurring after visit 5). These analyses included an overlapping set of non-demented or censored participants. As illustrated in Supplementary Figure 2, participants who were classified as having dementia or censored at or before visit 3, and participants with missing proteomic data or covariate information were excluded from the midlife replication analysis. A total of 11,069 participants were included in the midlife replication analysis. The statistical approaches used for each component of the study are described in the corresponding sections below.
Protein Measurement
Using blood collected at ARIC visit 3 and visit 5, the relative concentration of plasma proteins or protein complexes was measured using a Slow Off-rate Modified Aptamer (SOMAmer)-based capture array.71 In brief, this method uses short single strands of DNA with chemically modified nucleotides, called modified aptamers, which act as protein binding reagents with defined three-dimensional structures and unique nucleotide sequences which are identifiable and quantifiable using DNA detection technology. The SomaScan assay has been described in detail previously,21 as have the assay’s performance characteristics.72,73 Previous work indicates a median intra- and inter-run coefficient of variation of approximately 5% and intra-class correlation coefficients of ~0.9.20,71 The SomaScan assay has a sensitivity that is comparable to that of immunoassays while extending the lower limit of detection (in the femtomolar range) down to below that offered by conventional immunoassay approaches.28,73,74 A list of all the 5,284 modified aptamers in the v.4 SomaScan platform used in this study can be found in the supplement to a publication by Williams and colleagues.74
Plasma was collected using a standardized protocol at each ARIC site, frozen at −80C, and shipped on dry ice to the ARIC central laboratory where it was continuously frozen until aliquoting into barcoded microtiter plates with screw-top lids. The plates were sent to SomaLogic Inc (SomaLogic, Inc, Boulder, Colorado) for quantification. A technical description of the assay can be found in a white paper on the manufacturer’s website (http://somalogic.com/wp-content/uploads/2017/06/SSM-002-Technical-White-Paper_010916_LSM1.pdf) and in previous publications.21,74 In total, 5,284 modified aptamers (SOMAmers reagents or “SOMAmers”) were used to measure relative protein concentration.
SomaLogic Quality Control
The data were normalized by the manufacturer using a pool of healthy control participants.73 Samples were flagged if at least one of the following four sample calibration factors fell outside of acceptable criteria: hybridization control normalization factor; normalization factor for dilution of 0.005%; normalization factor for dilution of 0.5%; and normalization factor for dilution of 20%. Of the total 5,327 study samples provided by unique ARIC participants, 15 were excluded at visit 5 for failing to meet the acceptable criteria. A total of 68 plates were run for 5,284 SOMAmers. The manufacturer flagged SOMAmers if the interpolate calibration factor was outside the acceptable criteria (QC Ratio of 0.8 −1.2). Although, we did not exclude proteins on this basis, we conducted sensitivity analyses for all dementia-associated proteins to examine the consequences of excluding samples from plates that met the out-of-range criteria. Two of the 38 dementia-associated proteins had one or more flagged plate. Results of the primary analysis remained similar after excluding measurements on flagged plates.
ARIC Quality Control
We manually annotated six uniprot ID’s and three protein names. We applied log base 2 transformation to all SOMAmer measures to correct for skewness. We ran blind duplicates for 187 of the 5,327 (4%) participants with available SOMAmer data at visit 5, and 414 of 11,565 (4%) participants with SOMAmer data available at visit 3. The median inter-assay coefficient of variation for SOMAmers measured from visit 5 blood (calculated using the Bland-Altman method because proteins levels were measured on a relative scale [CVBA]) was 4.7%. The median inter-assay CVBA for SOMAmers measured from visit 3 blood was 6.3%. The median split sample reliability coefficient was 0.85 at visit 3 and 0.94 at visit 5, after excluding quality control outliers, as described below.
Of the 5,284 available SOMAmers, we excluded 94 SOMAmers that had a CVBA >50% or a variance of < 0.01 on the log scale at either visit 5 or visit 3. Additionally, we excluded 228 SOMAmers because of binding to mouse Fc-fusion, 15 SOMAmers for binding to a contaminant, and 70 SOMAmers binding to non-proteins, including hybridization control elution, non-human proteins, non-biotin, non-cleavable, and spuriomer products. For each SOMAmer, we winsorized outliers that were greater or less than five standard deviations from the sample mean on the log2 scale. In total, 4,877 SOMAmers measuring 4,697 unique proteins or protein complexes passed quality control and were analyzed in the current study. The inter-assay CVBA and reliability coefficients for the SOMAmers associated with dementia risk in our primary analysis are provided in Supplementary Table 30.
Using a subset of ARIC participants, we were able to validate the measurement of several dementia-associated proteins that were previously measured using traditional immunoassays: GDF15, NTproBNP, IL18, and B2M. SomaScan and traditional immunoassay measurements for plasma GDF15 (n=142, r=0.94), NTproBNP (n=5,168, r=0.90), and B2M (n=5313, r=0.92) were highly correlated.71 However, SomaScan levels of IL18 were unrelated to IL18 levels measured using a traditional immunoassay (n=142; r=−0.02) (Luminex multiplex assay, R&D Systems Inc., Minneapolis, MN). GDF-15, NTproBNP, B2M, and IL18 antibodies were used at the recommended dilutions as per the manufacturer protocol (typically, 50-fold as in 2 microliter of antibody stock solution in a total of 100 microliter reaction volume for the automated assays). Seventeen of the 39 SOMAmers binding to dementia-associated proteins have been validated previously using either multiple reaction monitoring (MRM) mass spectrometry, data dependent analysis (DDA) mass spectrometry, or by identification of cis pQTLs using GWAS (Supplementary Table 31).27,28
Covariate Assessment
Participant race (black/white), education (less than high school/high school, general education diploma [GED], or vocational school/college, graduate or professional school), and sex (male/female) were reported at ARIC visit 1. Because race and study site (center) were highly confounded, a combined race-center variable was used that classified participants as either white-Washington County, white-Forsyth County, black-Forsyth County, white-Minneapolis, or black-Jackson. APOE was genotyped using the TaqMan assay (coded as 0 APOEε4 alleles, ≥1 APOEε4 alleles, or missing; Applied Biosystems, Foster City, CA). All other covariates were assessed at the visit concurrent with the plasma proteomic measurement. Estimated glomerular filtration rate (eGFR) was calculated based on serum creatinine and demographic characteristics.75 Body mass index (BMI) was calculated using measured height and weight (kg/m2). Hypertension, based on the mean of the last two blood pressure measurements, was defined as a systolic blood pressure above 140 mm Hg, or a diastolic blood pressure above 90 mm Hg, or use of hypertensive medication. Diabetes was defined at visit 3 as a fasting glucose ≥126 mg/dL or non-fasting glucose ≥200 mg/dL, current use of diabetes medication, or a self-report diabetes diagnosed by a physician. Diabetes at visit 5 was defined based on HbA1c level of 6.5% or greater, current use of diabetes medication, or self-report of physician diagnosis. Smoking was defined based on self-report of current smoking status (yes/no).
Dementia Assessment
Primary Analysis (Visit 5 to Visit 6).
The primary analysis included 4,110 participants (mean age: 75; [SD 5]; 58% women). Participants underwent a comprehensive cognitive and functional assessment at visits 5 and 6. This included a comprehensive neuropsychological assessment with 10 cognitive measures (see Supplementary Methods) to assess memory, language, and processing speed and executive function, and an informant interview, as described previously.76 Participants were given a limited cognitive battery at ARIC visits 2 and 4, which included 3 of the 10 cognitive measures used in the comprehensive cognitive battery administered at visits 5 and 6. A detailed list of the cognitive measures used in the comprehensive cognitive battery has been published previously.76 Cognitive and functional information was used to define dementia for participants who attended visit 5 and/or visit 6. An algorithmic dementia diagnosis was initially defined when the following criteria are met: a score of greater than 5 on the Functional Activities Questionnaire (FAQ) or a Clinical Dementia Rating scale sum of boxes (CDR-SB) greater than 3; two or more cognitive domain scores greater than 1.5 standard deviations below the normative mean; and previous evidence of decline on the cognitive battery of greater than 0.055 standard deviations per year, which approximates the rate of cognitive decline in cognitively normal older adults.77,78 All dementia diagnoses identified using the algorithm were confirmed by an expert committee of physicians and neuropsychologists based on the National Institute on Ageing and Alzheimer’s Association79 and the Diagnostic and Statistical Manual of Mental Disorders (Fifth Edition).76,80
Participants were contacted annually by phone and semiannually after 2012. Between visit 5 and 6 participants were administered the Six-item Screener (SIS), a brief cognitive assessment, annually via phone.81 If the participant received a low score on the SIS (or was not able to participate in the screening via phone), the Ascertain Dementia 8-Item Informant Questionnaire (AD8)82 was administered to the participant’s informant. For participants who attended visit 6, these measures were used to estimate the date of dementia onset. For participants who did not attend visit 6 (due to death or visit non-attendance), SIS, AD8, hospital discharge codes, and death certificate codes were used to define dementia diagnoses and date of dementia onset up to December 31, 2017.83 The dementia incidence rate was 22.0 (95% CI: 20.0, 24.2) cases per 1000 person-years.
Midlife Replication Analysis (Visit 3 to Visit 5).
The midlife replication analysis included 11,069 participants (mean age: 60; [SD 6]; 55% women). Methods for dementia surveillance between ARIC visit 1 and visit 5 have been detailed previously.76,84 After visit 3, the baseline visit for this analysis, telephone follow-up was conducted annually, and then semiannually since 2012. Following visit 3, participants underwent a cognitive assessment at visit 4 (1996–1998). Between visit 4 and visit 5, participants were administered the Telephone Interview for Cognitive Status Modified (TICSm), an abbreviated cognitive assessment, via phone. For a subset of participants suspected of having dementia, a modified version of the CDR and the FAQ were administered to informants. For participants who attended visit 5, these measures were used to estimate the date of dementia onset. For participants who did not attend visit 5 (due to death or visit non-attendance), the TICSm, CDR, FAQ, hospital discharge codes, and death certificate codes were used to define dementia diagnosis and date of dementia onset up to September 1, 2013. The dementia incidence rate was 6.6 (95% CI: 6.2, 7.0) cases per 1000 person-years.
Suspected dementia etiology was determined for the subset of participants to attended visit 5. Due to an inability to provide a neurological exam for participants diagnosed with dementia after ARIC visit 5, and for participants in whom dementia was exclusively diagnosed using dementia surveillance methods, dementia etiology was not considered.
Identification of Dementia-Associated Proteins
Cox proportional hazards regression models were used to examine the association between the relative level of 4,877 SOMAmers measured at late-life baseline (visit 5) and incident dementia occurring between visit 5 and visit 6 (Supplementary Figure 1). We examined an unadjusted model and three covariate-adjusted models. First, we examined a demographically adjusted model which controlled for age, sex, race-center, education, and APOEε4 (model 1). Because kidney function was found to correlate with plasma protein levels for a large subset of the proteome, we examined a second model that additionally adjusted for kidney function defined eGFR-creatinine (model 2). We also examined a third (model 3) fully-adjusted model that adjusted for cardiovascular risk factors (i.e., BMI, diabetes, hypertension, and smoking status), given the role of these variables as potential confounders.84 We used the fully adjusted model (model 3) for all primary analyses. Midlife replication analyses used the same Cox proportional hazards regression models to examine the association between SOMAmer levels and incident dementia occurring between visit 3 and visit 5 for the subset of dementia-associated proteins identified in the primary analysis (Supplementary Figure 2). We used Bonferroni-corrected two-sided P-value <0.05 to determine statistical significance. Analyses were conducted using R version 3.6.2.
Replication in the AGES-Reykjavik Study
A detailed description of the AGES-Reykjavik Study26 and the AGES-Novartis SomaScan platform27 have been provided previously. Briefly, the AGES-Reykjavik Study is prospective longitudinal cohort study of older European white adults who were initially enrolled in the Reykjavik Study, established in 1967. From 2002 to 2006, 5,764 participants previously enrolled in the Reykjavik study were reexamined for the first wave of the AGES-Reykjavik. This baseline assessment was completed over three visits within a 4- to 6-week time window. Participants underwent a comprehensive assessment which included a clinical examination, questionnaires, a battery of cognitive measures, an MRI scan, and a blood draw. The AGES-Reykjavik study was approved by the Icelandic Nation Bioethics Committee (VSN: 00–063), the Icelandic Data Protection Authority, Iceland, and the Institutional Review Board for the National Institute of Aging, NIH, United States. Written informed consent was obtained from all participants.
Blood samples used for the current analyses were collected at the AGES-Reykjavik study baseline. Serum was prepared using a standardized protocol and stored in 0.5 ml aliquots at −80° C. A custom-designed Novartis SomaScan 5K platform was used to measure 5,034 SOMAmers found to bind to 4,137 distinct human proteins. Samples were sent to SomaLogic Inc (SomaLogic, Inc, Boulder, Colorado) for quantification. SOMAmers evaluated in the current study passed quality control. An assessment of a 1,000 protein subset conducted by Emilsson and colleagues found a median inter-assay CVs to be < 1%.27 SOMAmer levels were log base 2 transformed for the current analysis.
Dementia classification was conducted using a three-step procedure, as described previously.26 All participants were administered the Mini-Mental State Examination and the Digit Symbol Substitution Test. Participants who received a low score on either measure were administered a more comprehensive battery of cognitive measures. Participants who received a low score on the Trails A and B measure or the Rey Auditory Verbal Learning Test received an additional assessment, which included a neurologic examination and a proxy interview. Dementia diagnoses were adjudicated based on consensus during a conference that included a neurologist, geriatrician, neuropsychologist, and a neuroradiologist who provided a clinical reading of available MRIs. DSM-IV criteria were used to diagnose dementia.85 The dementia incidence rate was 27.5 (95% CI: 25.9, 29.2) cases per 1000 person-years.
Of the 5,764 participants enrolled in the AGES-Reykjavik study, 4,973 participants (mean age: 76 [SD 5]; 58% women) who were non-demented at the baseline and had non-missing covariate information were included in the current analyses. To examine generalizability of the protein-dementia associations found within the ARIC cohort, we submitted the sixteen proteins associated with incident dementia in both the primary analysis and the midlife replication analysis for external replication in AGES-Reykjavik cohort. Thirteen of the 16 identified proteins were quantified in AGES-Reykjavik participants. Cox proportional hazards regression models were used to examine the association between the relative level of 14 SOMAmers (representing 13 unique proteins) and incident dementia occurring between the baseline visit and October 2015. Models were adjusted for baseline age, sex, education, APOEε4, eGFR-cr, BMI, diabetes, hypertension, and smoking status.
Relating Dementia-Associated Proteins to Cognition
We used multivariable linear regression to examine the association of dementia-associated protein levels with global and domain-specific cognitive factor scores (defined in the Supplementary Methods). We used fully-adjusted models (model 3) for all analyses. Cognitive factor scores were standardized to facilitate comparability across cognitive domains. Analyses were conducted using Stata, version 14 (StataCorp, College Station, TX).
Dementia Prediction
To investigate whether dementia-associated proteins might improve dementia prediction, we used an approach that combined cross-validation with elastic net models. Cross-validation is used to reduce overfitting. Elastic net is a regularized regression method which penalizes the addition of new features to each model using the two penalization parameters (L1 and L2) used in ridge and LASSO regression.74 We used elastic net with Cox proportional hazards regression to optimize the selection of proteins for predictive models of dementia risk. Elastic net has been used in previous proteomic studies to create protein-based models for disease prediction.20,74 Elastic net regression models were used in the current study to select a weighted combination of SOMAmers from among the top 50 SOMAmers associated with dementia in the Cox proportional hazards models described in the section above. We conducted sensitivity analyses allowing elastic net models to select from the top 100 and top 200 SOMAmers, but prediction was generally less accurate when the number of SOMAmers available to choose from was increased. The glmnet R package (version 4.0.2) with a designated alpha of 0.5 was used the elastic net models.
We used a 10-fold cross-validation approach which split the data into two sets: 90% of the sample was used for model derivation, which included all discovery steps: (a) selection of the top 50 SOMAmers (ranked by P-value) using Cox proportional hazards models, and (b) generation of prediction models using an elastic net Cox proportional hazards model to select a weighted combination of SOMAmers from among the top 50 identified in step a. The other 10% of the sample was used to validate the protein model. This process was repeated 10 times, cycling through ten 10% validation subsets and 90% training subsets comprising the entire dataset. We generated an average naive (from the 90% training subset) and validated (from the 10% validation subset) C statistic for the protein prediction models. This process was repeated for a protein-only model, models which included demographic and cardiovascular risk factor information (these covariates were forced into the model), and for models that included proteins and demographic/cardiovascular risk factor information.
Brain MRI and PET Imaging
Of the 6,538 ARIC participants who attended visit 5, 1,978 received a 3-Tesla brain MRI after their medical evaluation. As has been described in detail previously,86 all ARIC participants with evidence of cognitive impairment at visit 5 and all participants who participated in the Brain MRI Ancillary Study (2004–2006) were selected to receive a brain MRI, as was an age-stratified random sample of participants without cognitive impairment. Participants with MRI contraindications were not selected. The MRI analysis included 1,319 non-demented participants from the larger analytic sample with complete brain MRI data.
A common set of MRI sequences was performed at each ARIC site and analyzed at the ARIC MRI Reading Center (Mayo Clinic) using methods described in detail previously.86 Magnetization-prepared rapid acquisition gradient echo (MP-RAGE), axial T2*gradient echo, and axial T2 fluid attenuated inversion recovery (FLAIR) sequences were obtained. Brain volume was calculated using Freesurfer (v5.1.0; http://surfer.nmr.mgh.harvard.edu)87 on MP-RAGE sequences. The current study evaluated total brain volume and Alzheimer’s Disease Signature Region volumes. Alzheimer’s Disease Signature Region volume was calculated by combining the volumes of the parahippocampal gyrus, entorhinal cortex, inferior parietal lobules, hippocampus, and precuneus.88 FLAIR images were used to calculate white matter hyperintensity (WMH) volume, which was quantified using a computer-aided segmentation program.89 All MRI analyses were adjusted for total intracranial volume. WMH volume was log-transformed to correct for skewness.
Florbetapir PET scans were obtained from non-demented participants enrolled in the ARIC-PET study within one year of the brain MRI to measure cortical amyloid. Participants at three ARIC sites (Forsyth County, North Carolina; Washington County, Maryland; and Jackson, Mississippi) were eligible for enrollment in the ARIC-PET study if they were free of the following conditions at the time of enrollment: dementia, current heavy alcohol use, renal dysfunction (creatinine levels > 2mg/dl), or a prolonged QT-c interval (>450 ms). In total, 346 participants were enrolled in the ARIC PET study, of which 259 were included in the current analytic sample. PET scans were co-registered with MP-RAGE sequences. As is described in detail elsewhere,90 PET images were acquired between 50 and 70 minutes after intravenous injection of the florbetapir isotope for a 20-minute (4 × 5 minute) uptake scan. After images were reviewed for image quality by the PET image analysis center at Johns Hopkins, standardized uptake value ratios (SUVRs) were quantified and 34 regions of interest (ROIs) were manually applied to SUVR images in the standard Montreal Neurologic Institute (MNI) space. We used a measure of global cortical florbetapir uptake derived from the volume-dependent weighted average of the orbitofrontal, prefrontal, superior frontal; lateral temporal, parietal, and occipital lobes; and the precuneus, anterior cingulate, and the posterior cingulate. A cerebellar gray matter region was used as the reference. Global SUVR score was log-transformed to correct for skewness.
We used multivariable linear regression to evaluate the association of dementia-associated protein levels with MRI and PET measures. We used fully-adjusted models (model 3) for all neuroimaging analyses. Analyses of MRI variables included sampling weights to account for the ARIC brain MRI sampling strategy. MRI and PET measures were standardized to facilitate comparability. Analyses were conducted using Stata, version 14 (StataCorp, College Station, TX).
Mendelian Randomization Analysis
We used a Mendelian randomization (MR)91 approach to study the causal relation between the dementia-associated proteins and Alzheimer’s disease (AD). MR design mimics randomized controlled trial in an observational setting by using independent SNPs associated with exposure as instrumental variables (IVs). We used a bidirectional two-sample MR design92,93 to evaluate whether a dementia-associated protein is causally related to Alzheimer’s disease, or vice versa, using summary statistics sourced from two independent samples. We used protein quantitative trait locus (pQTL) data published by Sun et al. (2018)28 to identify SNPs associated with SOMAmer levels of dementia-associated proteins. Among 38 dementia-associated proteins, 22 proteins had pQTL data available. SNP-AD associations were obtained from the International Genomics of Alzheimer’s Project (IGAP) discovery GWAS summary statistics (n=63,926).22 For both directions (forward: protein to AD, backward: AD to protein), SNPs with genome-wide significance (P-value <5 × 10⁻⁸) were selected and LD pruned (r2<0.05) using a web-app, LDlink (11/06/2020 release) against 1000 Genome European reference panel.94 When the IV was not included in the outcome data, we used a proxy (r2>0.6) within 500 kilo-basepairs. Proteins were required to have at least 3 IVs to be eligible for multi-IV MR analyses.
Under the set of MR assumptions, the slope of inverse variance weighted (IVW) regression (a weighted linear regression of SNP-outcome association on the SNP-exposure association with the inverse of the variance of SNP-outcome association as the weights and zero-intercept) provides a valid casual estimate. We performed sensitivity analyses using complementary approaches that are robust to violation of MR assumptions, including Mendelian Randomization-Egger,95 weighted median method,96 and CONtamination MIXture97. A consistent causal estimate between approaches helps to rule out false positives. Strength of IVs was evaluated with mean F statistics for IVW analysis, where F<10 was considered as a ‘weak IV’ (the Staiger–Stock rule98 javascript:;). The “No Measurement Error (NOME)” assumption was evaluated by Bowden I2 statistics for MR-Egger analysis. To evaluate the no horizontal pleiotropy assumptions, we tested pleiotropy with Egger intercept test99 and Mendelian Randomization Pleiotropy RESidual Sum and Outlier test.100 Cochran’s heterogeneity test was used to test the heterogeneity between casual estimates.101 All the analysis were performed using TwoSampleMR102 (version 0.5.5) and MendelianRandomization103 (version 0.5.0) R packages. We also constructed radial plots104 using RadialMR (version 0.4) R package to detect potentially invalid or influential instruments (“outliers”) and performed a IVW MR analysis again after excluding outliers. The MR association P-value was Bonferroni adjusted for the number of proteins with IV available.
To investigate the functional consequence of the genome-wide significant protein pQTLs, we estimated Combined Annotation Dependent Depletion (CADD, version 1.4) score and examined their association with gene expression in brain tissue using Functional Mapping and Annotation of Genome-Wide Association Studies105 (FUMA) platform. pQTLs with CADD score greater than 12.37 was regarded as having a deleterious effect.106 Associations with gene expression were identified using data from Brain eQTL Almanac107 (BRAINEAC) and Genotype-Tissue Expression108 (GTEx version 8) projects.
Gene Expression Analyses
Genotype-Tissue Expression Analysis
To examine the expression of genes coding for dementia-associated proteins in discrete brain regions and in whole blood, we used data acquired from the genotype-tissue expression (GTEx) project, a publicly available database of multi-tissue gene expression data.108,109 All donors gave written informed consent and GTEx study protocols were approved by the NIH National Human Genome Research Institute. A detailed description of the GTEx database has been previously provided.109 Using version 8 of the GTEx database, we first visualized the gene expression across 11 brain regions, whole blood, and other relevant tissue (heart, kidney, spleen, adipose) for all dementia-associated proteins using the GTEx Multi Gene Query. Genes and tissue types were grouped using a hierarchical cluster analysis based on gene expression level presented on a scale of transcripts per million (TPM). Next, we used gene expression data to examine the correlation between the expression of genes coding for the top dementia-associated proteins in whole blood and expression of these same genes across 11 discrete brain regions (i.e., the cortex, anterior cingulate cortex [BA24], hippocampus, amygdala, hypothalamus, frontal cortex [BA9], caudate, cerebellum, cerebellar hemisphere, nucleus accumbens, and the putamen) in corresponding donors. Of the 948 donors, 755 had whole blood gene expression data available. We matched the set of participants with whole blood gene expression data available with corresponding brain gene expression data, which was available in a smaller subset of participants (sample sizes for each brain region provide in Supplementary Table 19). All gene expression values were log transformed to correct for skewness. Outliers deviating >5 standard deviations from the mean of the log transformed distribution were excluded. We examined the correlation between whole blood gene expression and brain gene expression using Spearman correlations.
Gene Co-expression Analysis
Gene co-expression analysis for the top five dementia-associated proteins was conducted using the ExplainBio web tool (http://www.explainbio.com).34 The ExplainBio tool uses a recursive algorithm to select the group of genes which most strongly predict expression of another gene. We used this tool to identify the set of genes whose expression most strongly predicted the expression of genes coding for dementia-associated proteins. We also used this algorithm to determine the set of genes whose expression was most strongly predicted by the expression of genes coding for each dementia-associated protein. This analysis used whole blood from 244 donors. As described in detail elsewhere,35 the ExplainBio algorithm first finds the gene whose log gene expression is most strongly associated with expression of the node gene (i.e, the genes coding for top dementia-associated proteins). The program then recursively searches remaining genes to find the gene that best improves the model until the individual R2 of the added gene is below 0.0625. This generates a linear model for the set of genes which together have the highest direct contribution to the expression of the gene of interest. We conducted a systematic review of the literature to determine whether the genes co-expressed with node genes have been previously implicated in Alzheimer’s disease and dementia more broadly. We used the search terms “((Gene Symbol [Title/Abstract]) OR (Gene Name [Title/Abstract])) AND ((Dementia[Title/Abstract]) OR (Alzheimer’s disease[Title/Abstract]))” in PubMed for each gene using the gene symbol, gene name and aliases. We cited work demonstrating the involvement of co-expressed genes in Alzheimer’s disease/dementia in Supplementary Table 20.
Ingenuity Pathway Analysis
To further examine the biological mechanisms associated with the set of plasma proteins dysregulated in individuals at risk for dementia, we used Ingenuity Pathway Analysis (IPA), a bioinformatics application that facilitates the analysis and interpretation of omics data based on manually curated content provided through the Ingenuity Knowledge Base (IPA, QIAGEN Inc., https://www.qiagenbioinformatics.com/products/ingenuity-pathway-analysis). We used the set of proteins associated with incident dementia at an FDR-corrected threshold (two-sided P< 0.05). SOMAmers and genes that could not be mapped to the IPA databased were excluded for IPA analyses. We linked the 217 SOMAmers associated with dementia risk to 212 unique genes in the IPA database; Cox proportional hazards beta estimates (in the form of log expression ratios) and FDR-corrected P-values derived from our primary analyses using a fully adjusted model (model 3) were uploaded for each protein. Not all SOMAmers mapped to a unique gene in the IPA database. In some cases, duplicate SOMAmers mapped to a single gene (e.g., SVEP1$ and SVEP1#), and in other cases, more than one gene product corresponded to a single gene ID (e.g., NTproBNP and natriuretic peptide B). Duplicates were resolved by consolidating the gene ID and using the maximum expression value of the two SOMAmers.
Analysis were conducted using the Ingenuity Knowledge Base as the reference set, and included both direct and indirect experimentally confirmed relationships from all species, with a maximum of 35 molecules per network and 25 networks per analysis (parameters used in previously published studies).110,111 The IPA Core Analysis was used to estimate the degree to which specific canonical pathways, protein networks, and upstream regulators were implicated based on the set of proteins found to be associated with dementia risk. The IPA Core Analysis calculates one-sided P-values using a right-tailed Fisher’s exact test to quantify the probability of overlap between a set of dementia-associated proteins identified in current analysis and a set of proteins known to exist within a specific pathway or process due to random chance. A P-value of <0.05 was used as the threshold for statistical significance after applying Benjamini-Hochberg FDR adjustment for multiple comparisons. A Z-score was also calculated, which quantifies the likelihood and directionality of the expression of canonical pathways and upstream regulators, considering the direction of the protein-specific association in our dataset and the known directional effect of one molecule on another molecule or on a process. A Z-score <−2 or >2 has been recommended as the threshold for significance when interpreting directionality. A detailed explanation of the statistical underpinnings of IPA Core Analyses have been published previously.112
We conducted sensitivity analyses to examine alternative thresholds for protein inclusion, including two-sided P<0.01 (380 SOMAmers). These analyses demonstrated a pattern of enriched canonical pathways, protein networks, and upstream regulators that was generally similar to that found in the primary analysis. We conducted an additional sensitivity analysis which restricted the protein reference group to the proteins measured by the SomaScan platform. These results showed enrichment for similar canonical pathways, protein networks, and upstream regulators; however, for canonical pathways and upstream regulators, the Z-scores were attenuated, and most P-values did not survive correction for multiple comparisons. Lastly, we permutated the data and submitted a random set of proteins to IPA to ensure that enriched pathways identified in our primary analyses were not simply a result of technical artifact.
We also examined the relative contribution of the 21 identified canonical pathways to dementia risk. We derived 21 Canonical Pathway Composite Scores for each participant. For each canonical pathway, a composite score was calculated as the linear combination of the proteins assigned to the identified canonical pathway. Protein weights were defined using the first component of a pathway-specific principal component analysis (PCA). Proteins included in each PCA are listed in Supplementary Table 21 and the Canonical Pathway Composite Score factor loadings are provided in Supplementary Table 22. The association between Canonical Pathway Composite Scores and risk for incident dementia after late-life baseline (visit 5) was examined using a Cox proportional hazards regression model that included all 21 Canonical Pathway Composite Scores and demographic and cardiovascular risk factor covariates (model 3).
IPA network analysis was used to identify interactions between groups of highly connected dementia-associated proteins. Networks were generated algorithmically based on known genetic or molecular connectivity with other genes or gene products.37 Highly connected genes/gene products are first identified as focus molecules or “seeds.” Focus molecules identified as having the most interactions with other focus molecules are connected to form a network. Connected non-focus molecules identified in our primary analysis as being associated with dementia risk were then iteratively added to the network. Networks were limited by 35 molecules each to facilitate the identification discrete networks. To determine the biological relevance of identified protein networks, we used the g:Profiler toolkit.39 Functional profiling of each protein set was conducted using the Gene Ontology (GO),40,41 Kyoto Encyclopedia of Genes and Genomes (KEGG),42 and WikiPathways43 databases. The full set of GO molecular function, GO biological process, KEGG, and WikiPathway terms are provided in Extended Data Fig. 4–8. In a similar manner to the derivation of the Canonical Pathway Composite Score identified above, we generated Protein Network Scores using the proteins included in each of the identified networks containing ten or more dementia-associated proteins. Proteins included in each network are listed in Supplementary Table 24 and the Protein Network Score factor loadings are provided in Supplementary Table 25. For each protein network, a Protein Network Score was calculated as the linear combination of the set of proteins, as defined by the first component of the PCA. The association between Protein Network Scores and risk for incident dementia after late-life baseline (visit 5) was examined using a Cox proportional hazards regression model which included all 12 composite scores and demographic and cardiovascular risk factor covariates (model 3). We also examined the association of Protein Network Composite Scores with brain MRI and PET measures using fully adjusted models (model 3) for all analyses.
Probabilistic Estimation of Expression Residuals (PEER)
We applied the Probabilistic Estimation of Expression Residuals (PEER) method to examine the effect of removing variation related to latent patterns within the proteomic data.52,113 Experimental and technical noises can have systematic effects on high-throughput measurements. Environmental conditions, both internally and externally, can also have a large influence on those measurements. This may include cellular fluctuations and biological pathway effects. All these factors may contribute a large proportion of variation to our measured protein levels and thereby obscure some small-effect association signals. We used the PEER method to estimate a set of latent covariates explaining the main source of technical and biological sources of variance in the log-transformed protein data.113 Log-transformed protein data were then adjusted in a linear regression for those PEER factors. The residuals from this linear regression were used as the corrected-protein quantification in the PEER-adjusted analysis. The PEER correction helps to elucidate isolated-effect association signals independent of broader technical and biological sources of variance. At total of 110 and 160 PEER factors were used for the analyses of visit 5 and visit 3 proteins, respectively. The number of PEER factors was selected to control the proteomic inflation factor at an acceptable level, generally less than 1.1. We examined effect of including alternative set of PEER factors (e.g., top 50 PEERs, top 80 PEERs) and found that the results were similar.
To examine the association between visit 5 PEER factors and dementia risk, we used an adjusted Cox proportional hazards regression model (model 3) with PEER factor as the independent variable and incident dementia as the outcome. To characterize the biological relevance of dementia-associated PEER factors, we examined the Spearman correlations between each dementia-associated PEER factor and visit 5 SOMAamer levels and submitted these correlations and the associated P-values to IPA for Core Analyses. SOMAmers that correlated with each dementia-associated PEER factor (FDR corrected two-sided P <0.05 for PEERS 9 and 88 and FDR corrected two-sided P <0.0001 for PEER 3) were included in this analysis. Canonical pathways associated with each dementia-associated PEER factor were defined based on the P-value of overlap, i.e., the probability of overlap between PEER-associated proteins and the proteins which make up each canonical pathway by chance alone.
Extended Data
Extended Data Fig. 1.
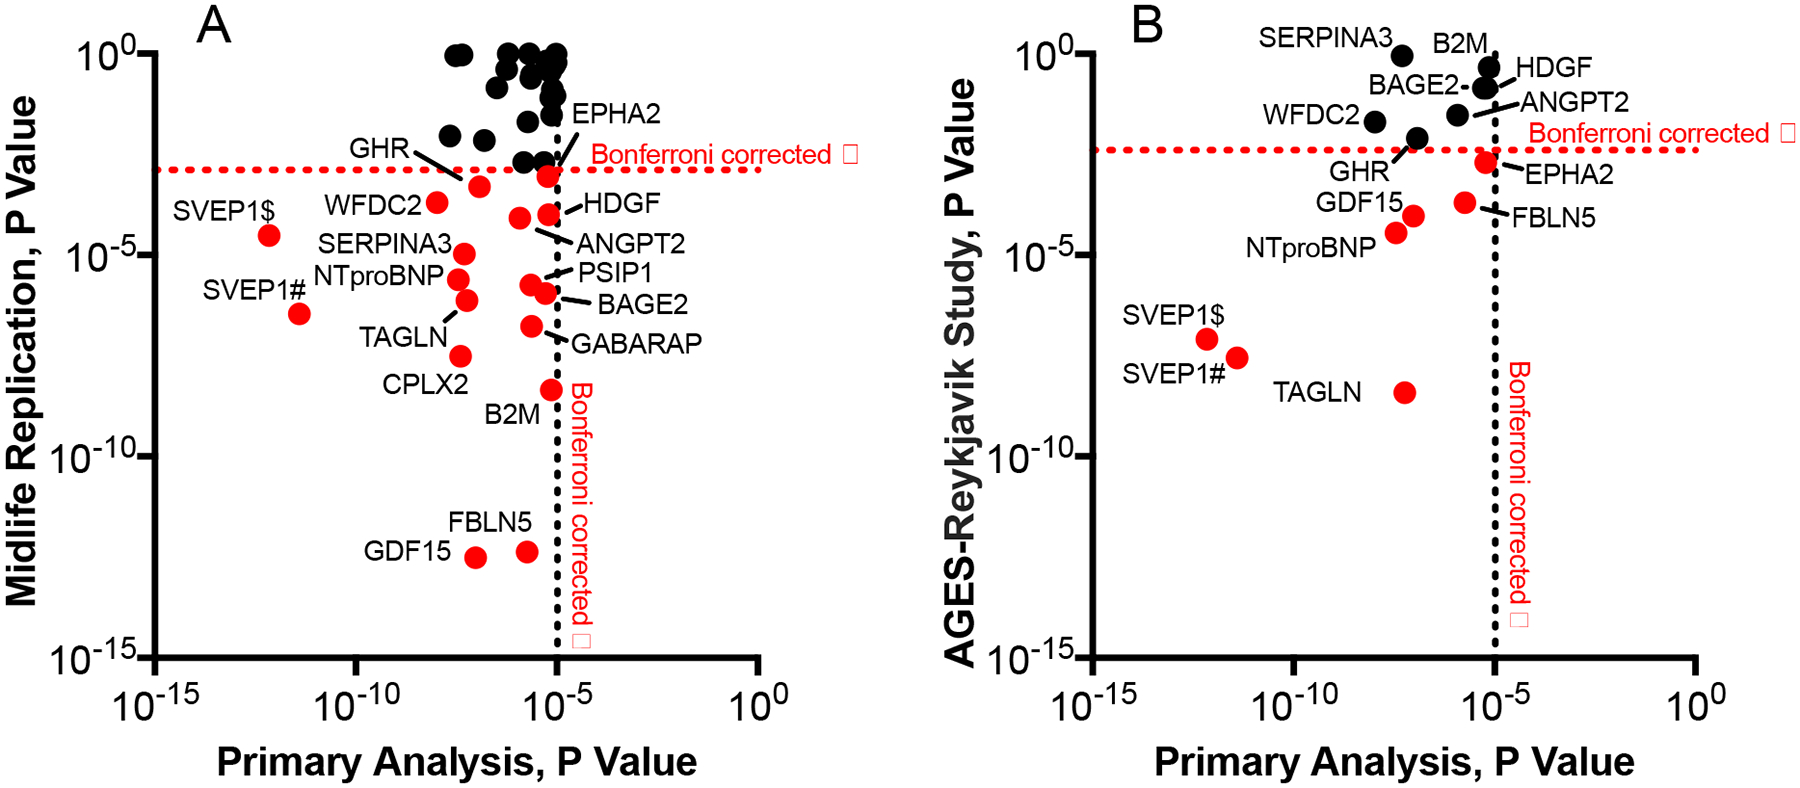
P-values for dementia-associated proteins in midlife replication and AGES-Reykjavik external replication analyses
(A) P-values (two-sided) for the midlife replication analysis (index visit 1993–1995, ages 49–73) of the 38 dementia-associated proteins identified in older adults (y-axis) plotted against P-values for each dementia-associated protein derived from the primary analysis (index visit 2011–2013) on the x-axis. The horizontal dotted red line represents the Bonferroni-corrected threshold for statistical significance in the midlife replication analysis (0.05/38; P<0.0013). The vertical dotted black line represents the Bonferroni-corrected threshold for statistical significance in the primary analysis (0.05/4,877; P<1.03×10⁻⁵). (B) P-values (two-sided) for the AGES-Reykjavik (index visit 2002–2006) replication of proteins that were significantly associated with dementia risk in both the primary and the midlife replication analysis (y-axis) plotted against P-values for each dementia-associated protein derived from the primary analysis (index visit 2011–2013) on the x-axis. The horizontal dotted red line represents the Bonferroni-corrected threshold for statistical significance in the AGES-Reykjavik replication analysis (0.05/13; P<0.0038). The vertical dotted black line represents the Bonferroni-corrected threshold for statistical significance in the primary analysis (0.05/4,877; P<1.03×10⁻⁵).
Extended Data Fig. 2.
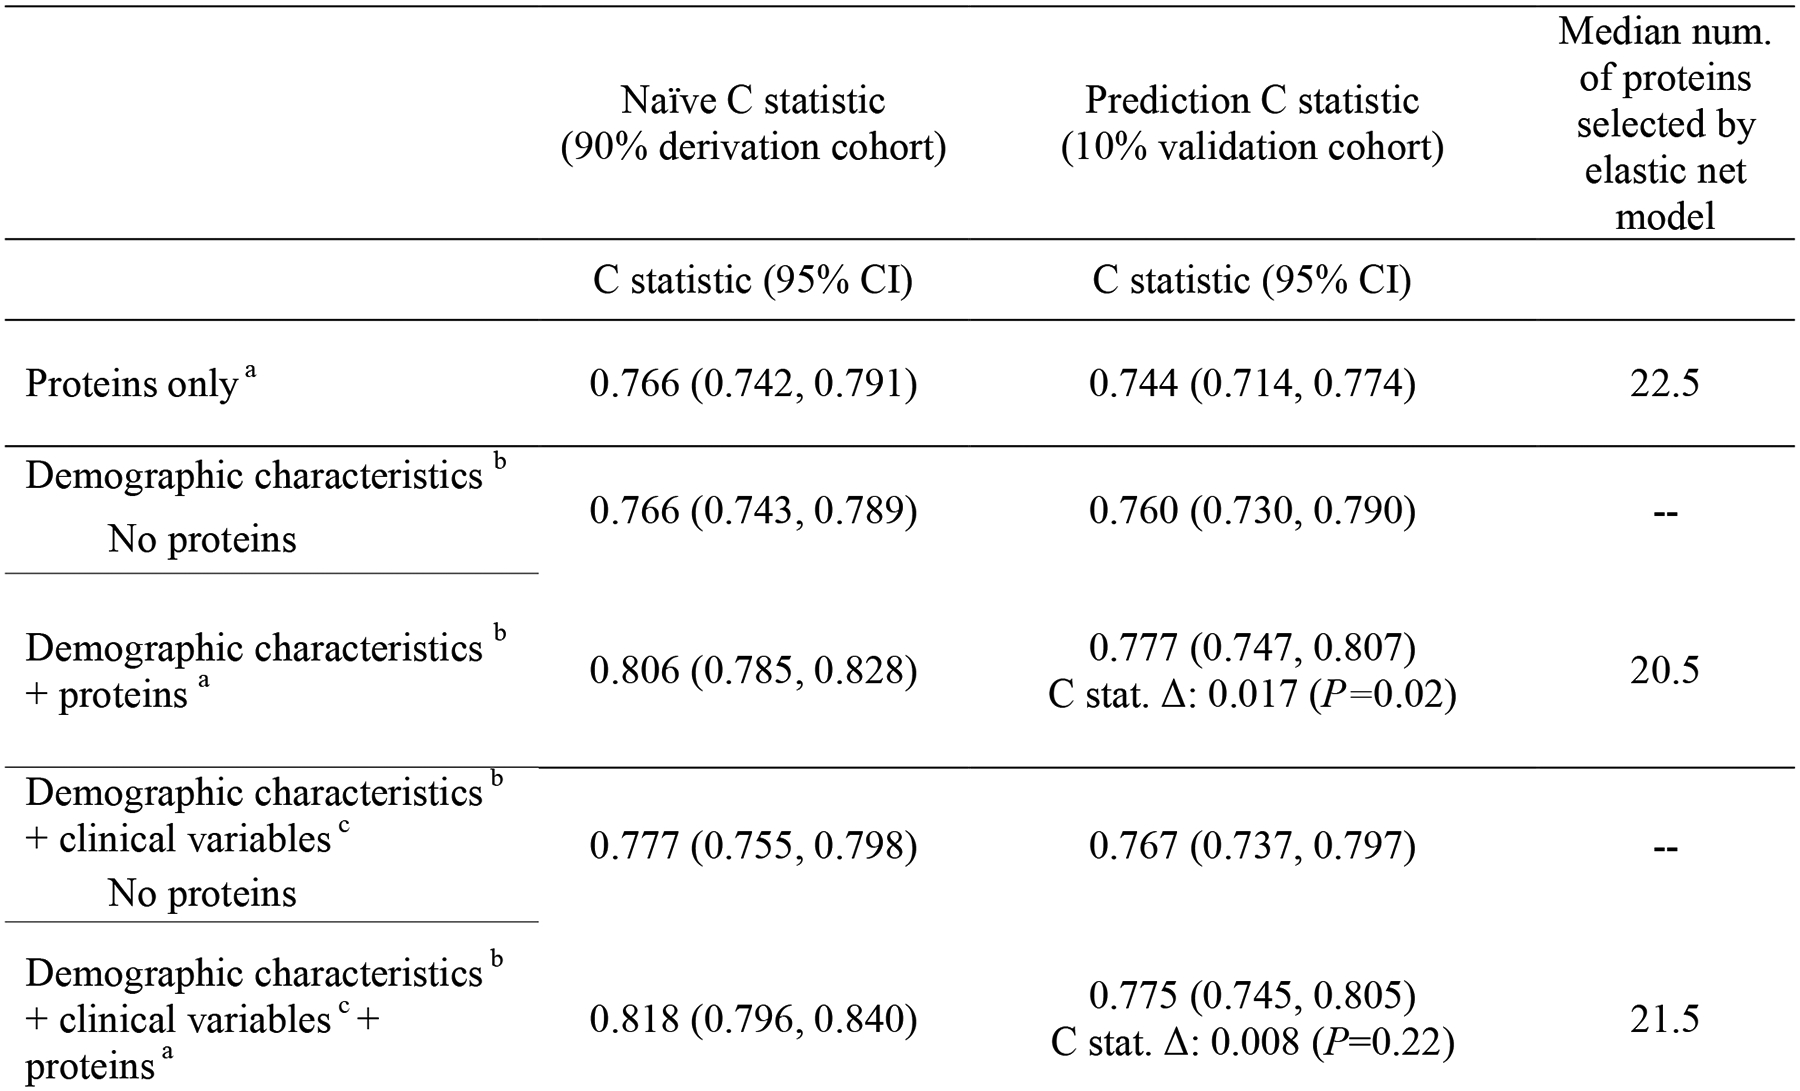
Prediction of incident dementia using proteins, demographic and clinical variables, and their combination measured at late-life baseline (2011–2013)
Elastic net machine learning with Cox proportional hazards regression was used to select the best combination of proteins from the top 50 proteins in each model. This table shows results from 10-fold cross validated analyses. Two-sided P-values were calculated for the C statistic comparisons. No corrections for multiple comparisons were performed.
a Protein combination defined using elastic net machine learning algorithm
b Includes age, sex, race-center, education, and APOEε4
c Includes body mass index, diabetes, hypertension, smoking status, and eGFR-creatinine
Abbreviations: C stat. Δ, change in C statistic with the addition of elastic net proteins.
Extended Data Fig 3.
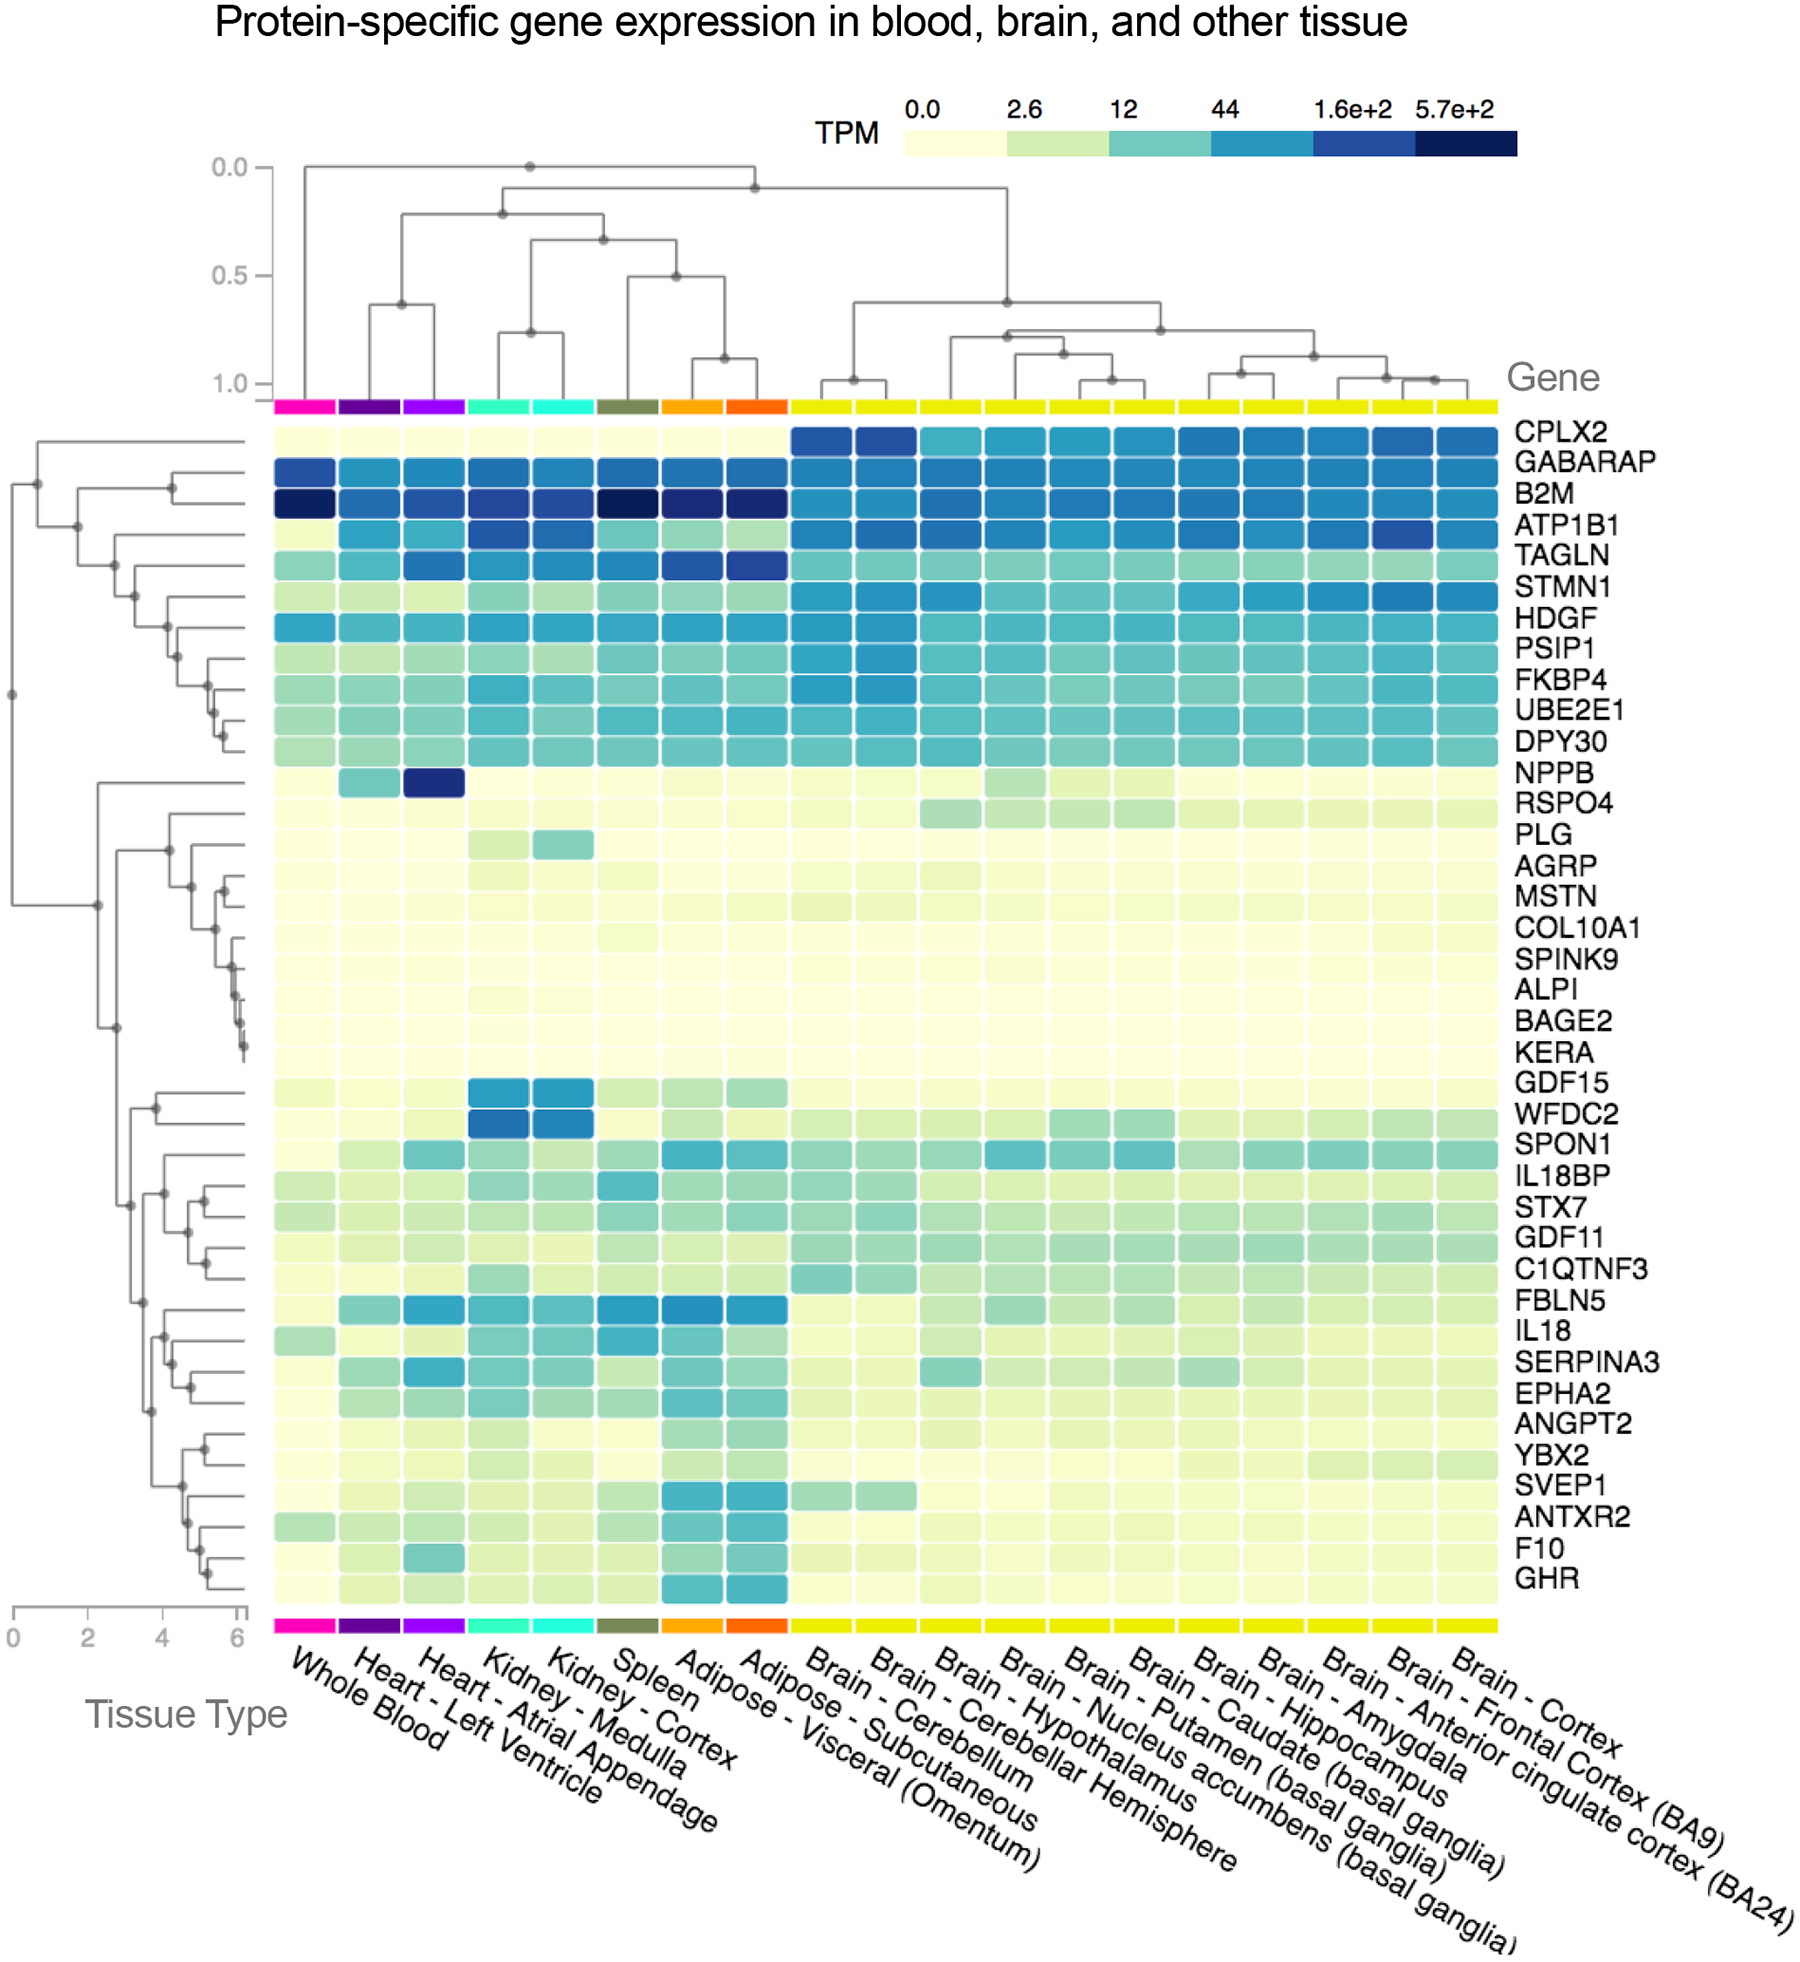
Gene expression in whole blood, brain, heart, kidney, spleen, and adipose tissue of genes coding for dementia-associated proteins
Using gene expression data available from postmortem samples in the GTEx database, this heatmap shows the expression of genes coding for dementia-associated proteins (in transcripts per million) in whole blood, select brain regions, and other selected tissue. Hierarchical cluster analysis was used to group dementia-associated proteins based on gene expression across multiple tissues.
Extended Data Fig 4.
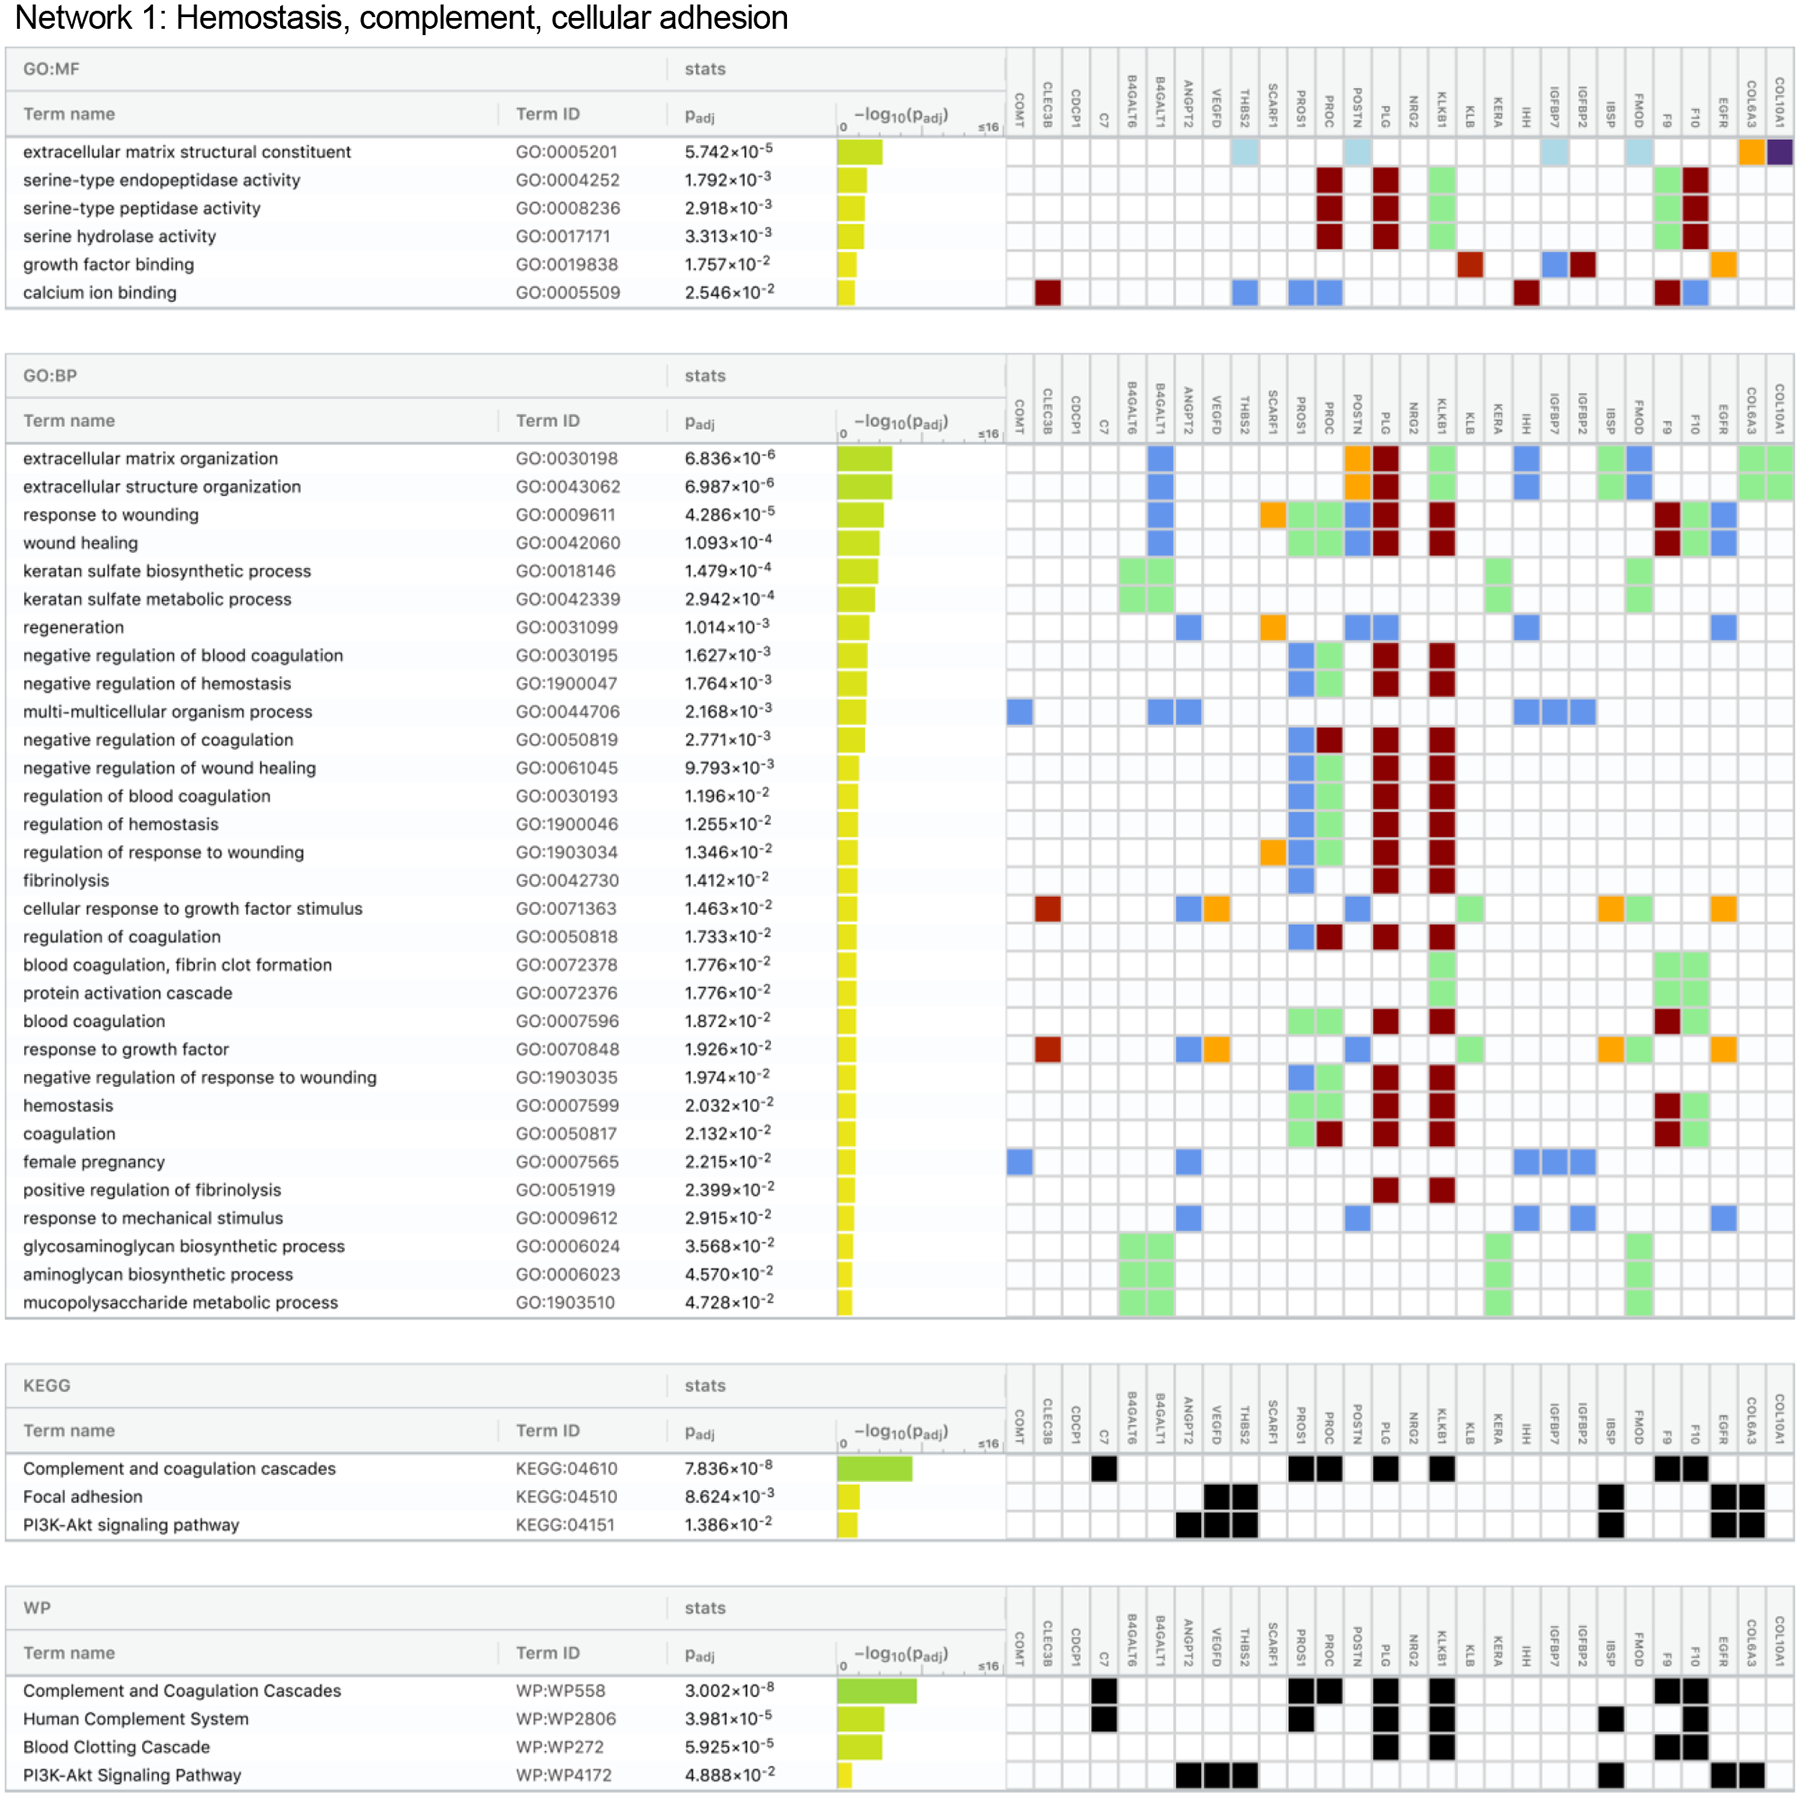
Functional profiling of protein Network 1 identified among the set of dementia-associated proteins
Protein networks were assembled based on evidence of known gene/molecule interactions in the Ingenuity Knowledge Base. The g:Profiler toolkit39 was used to analyze the proteins in each dementia-associated protein network for functional enrichment. We defined the biological pathways/processes associated with each protein set using the Gene Ontology (GO), Kyoto Encyclopedia of Genes and Genomes (KEGG), and WikiPathways databases. Images were generated using the g:Profiler web tool: https://biit.cs.ut.ee/gprofiler/.
Abbreviations: GO:BP, gene ontology biological process; GO:MF, gene ontology molecular function
Extended Data Fig 5.
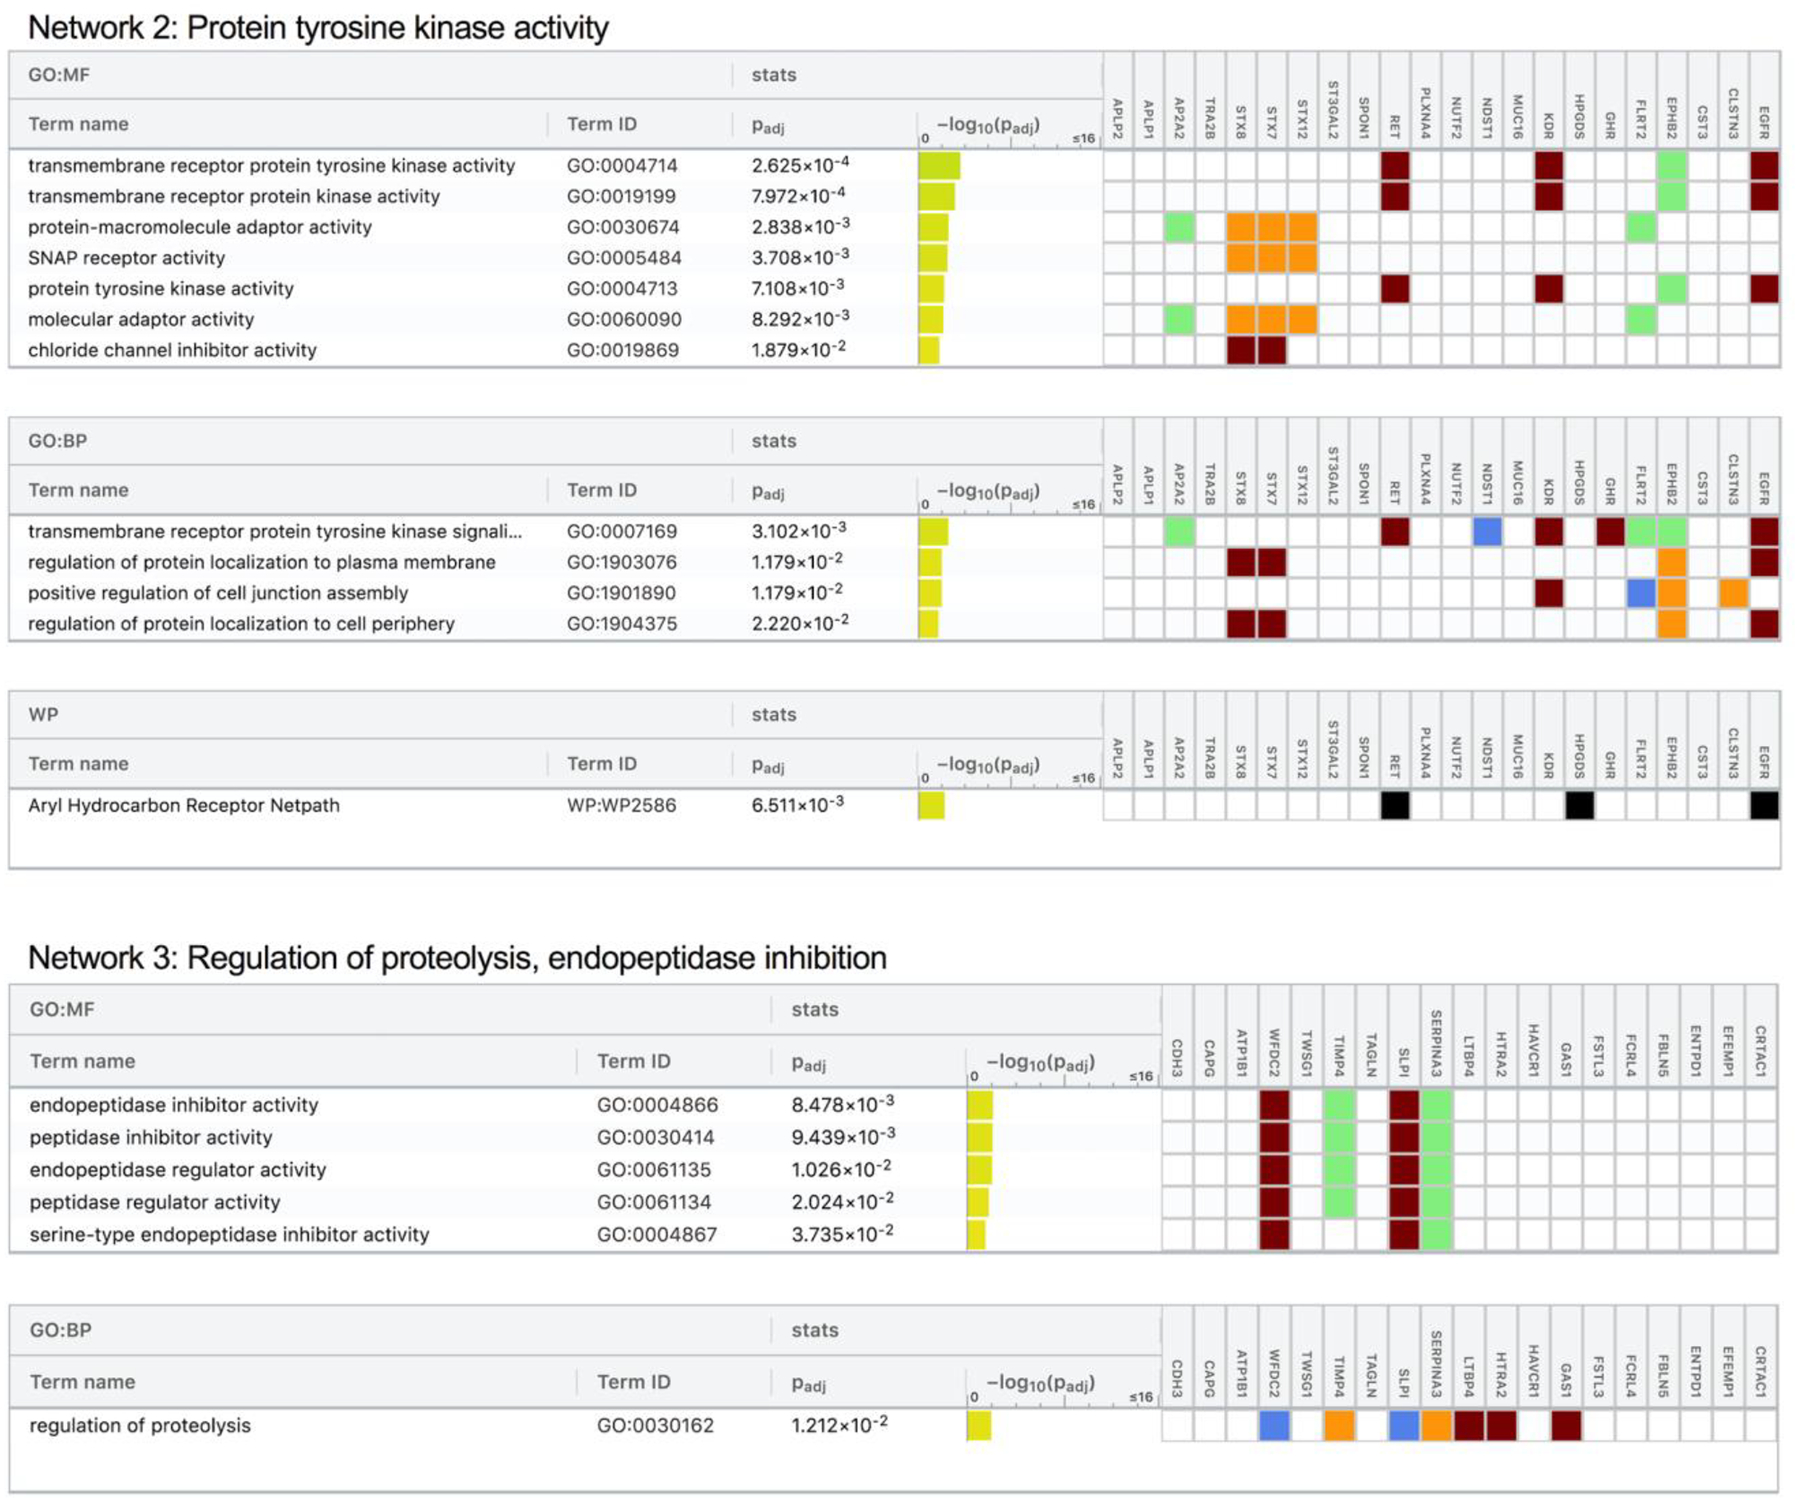
Functional profiling of protein Network 2 and Network 3 identified among the set of dementia-associated proteins
Protein networks were assembled based on evidence of known gene/molecule interactions in the Ingenuity Knowledge Base. The g:Profiler toolkit39 was used to analyze the proteins in each dementia-associated protein network for functional enrichment. We defined the biological pathways/processes associated with each protein set using the Gene Ontology (GO), Kyoto Encyclopedia of Genes and Genomes (KEGG), and WikiPathways databases. Images were generated using the g:Profiler web tool: https://biit.cs.ut.ee/gprofiler/.
Abbreviations: GO:BP, gene ontology biological process; GO:MF, gene ontology molecular function
Extended Data Fig 6.
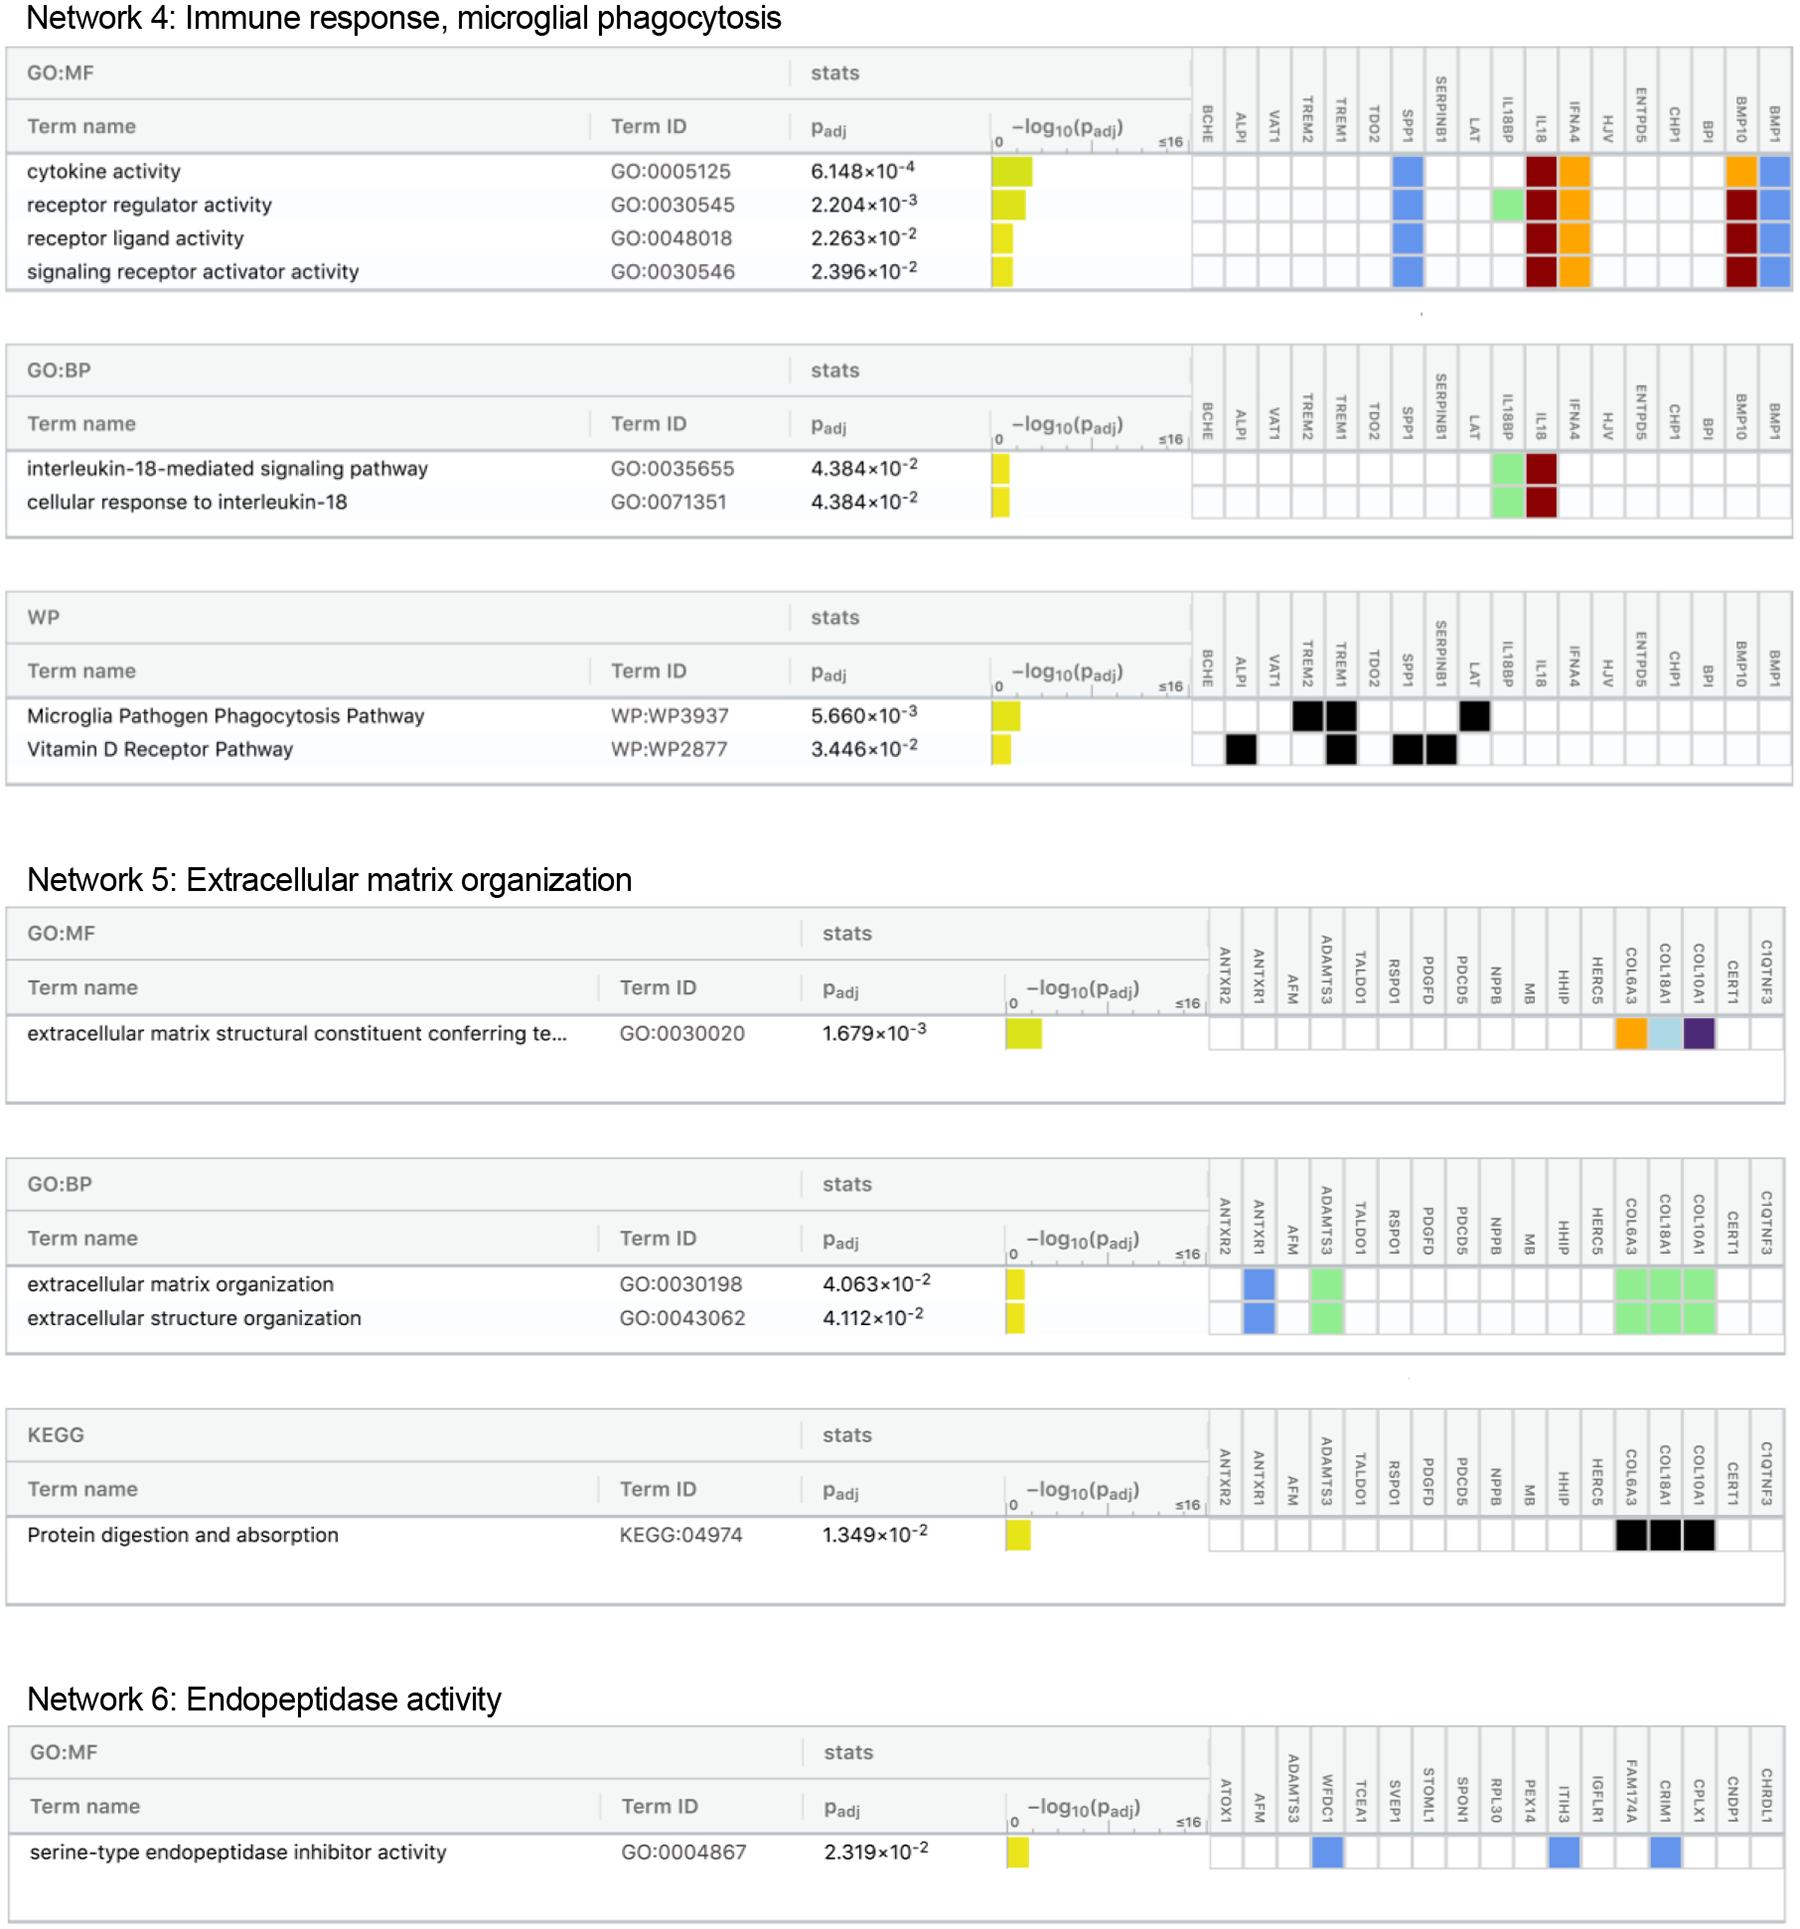
Functional profiling of protein Network 4, Network 5, and Network 6 identified among the set of dementia-associated proteins
Protein networks were assembled based on evidence of known gene/molecule interactions in the Ingenuity Knowledge Base. The g:Profiler toolkit39 was used to analyze the proteins in each dementia-associated protein network for functional enrichment. We defined the biological pathways/processes associated with each protein set using the Gene Ontology (GO), Kyoto Encyclopedia of Genes and Genomes (KEGG), and WikiPathways databases. Images were generated using the g:Profiler web tool: https://biit.cs.ut.ee/gprofiler/.
Abbreviations: GO:BP, gene ontology biological process; GO:MF, gene ontology molecular function
Extended Data Fig 7.
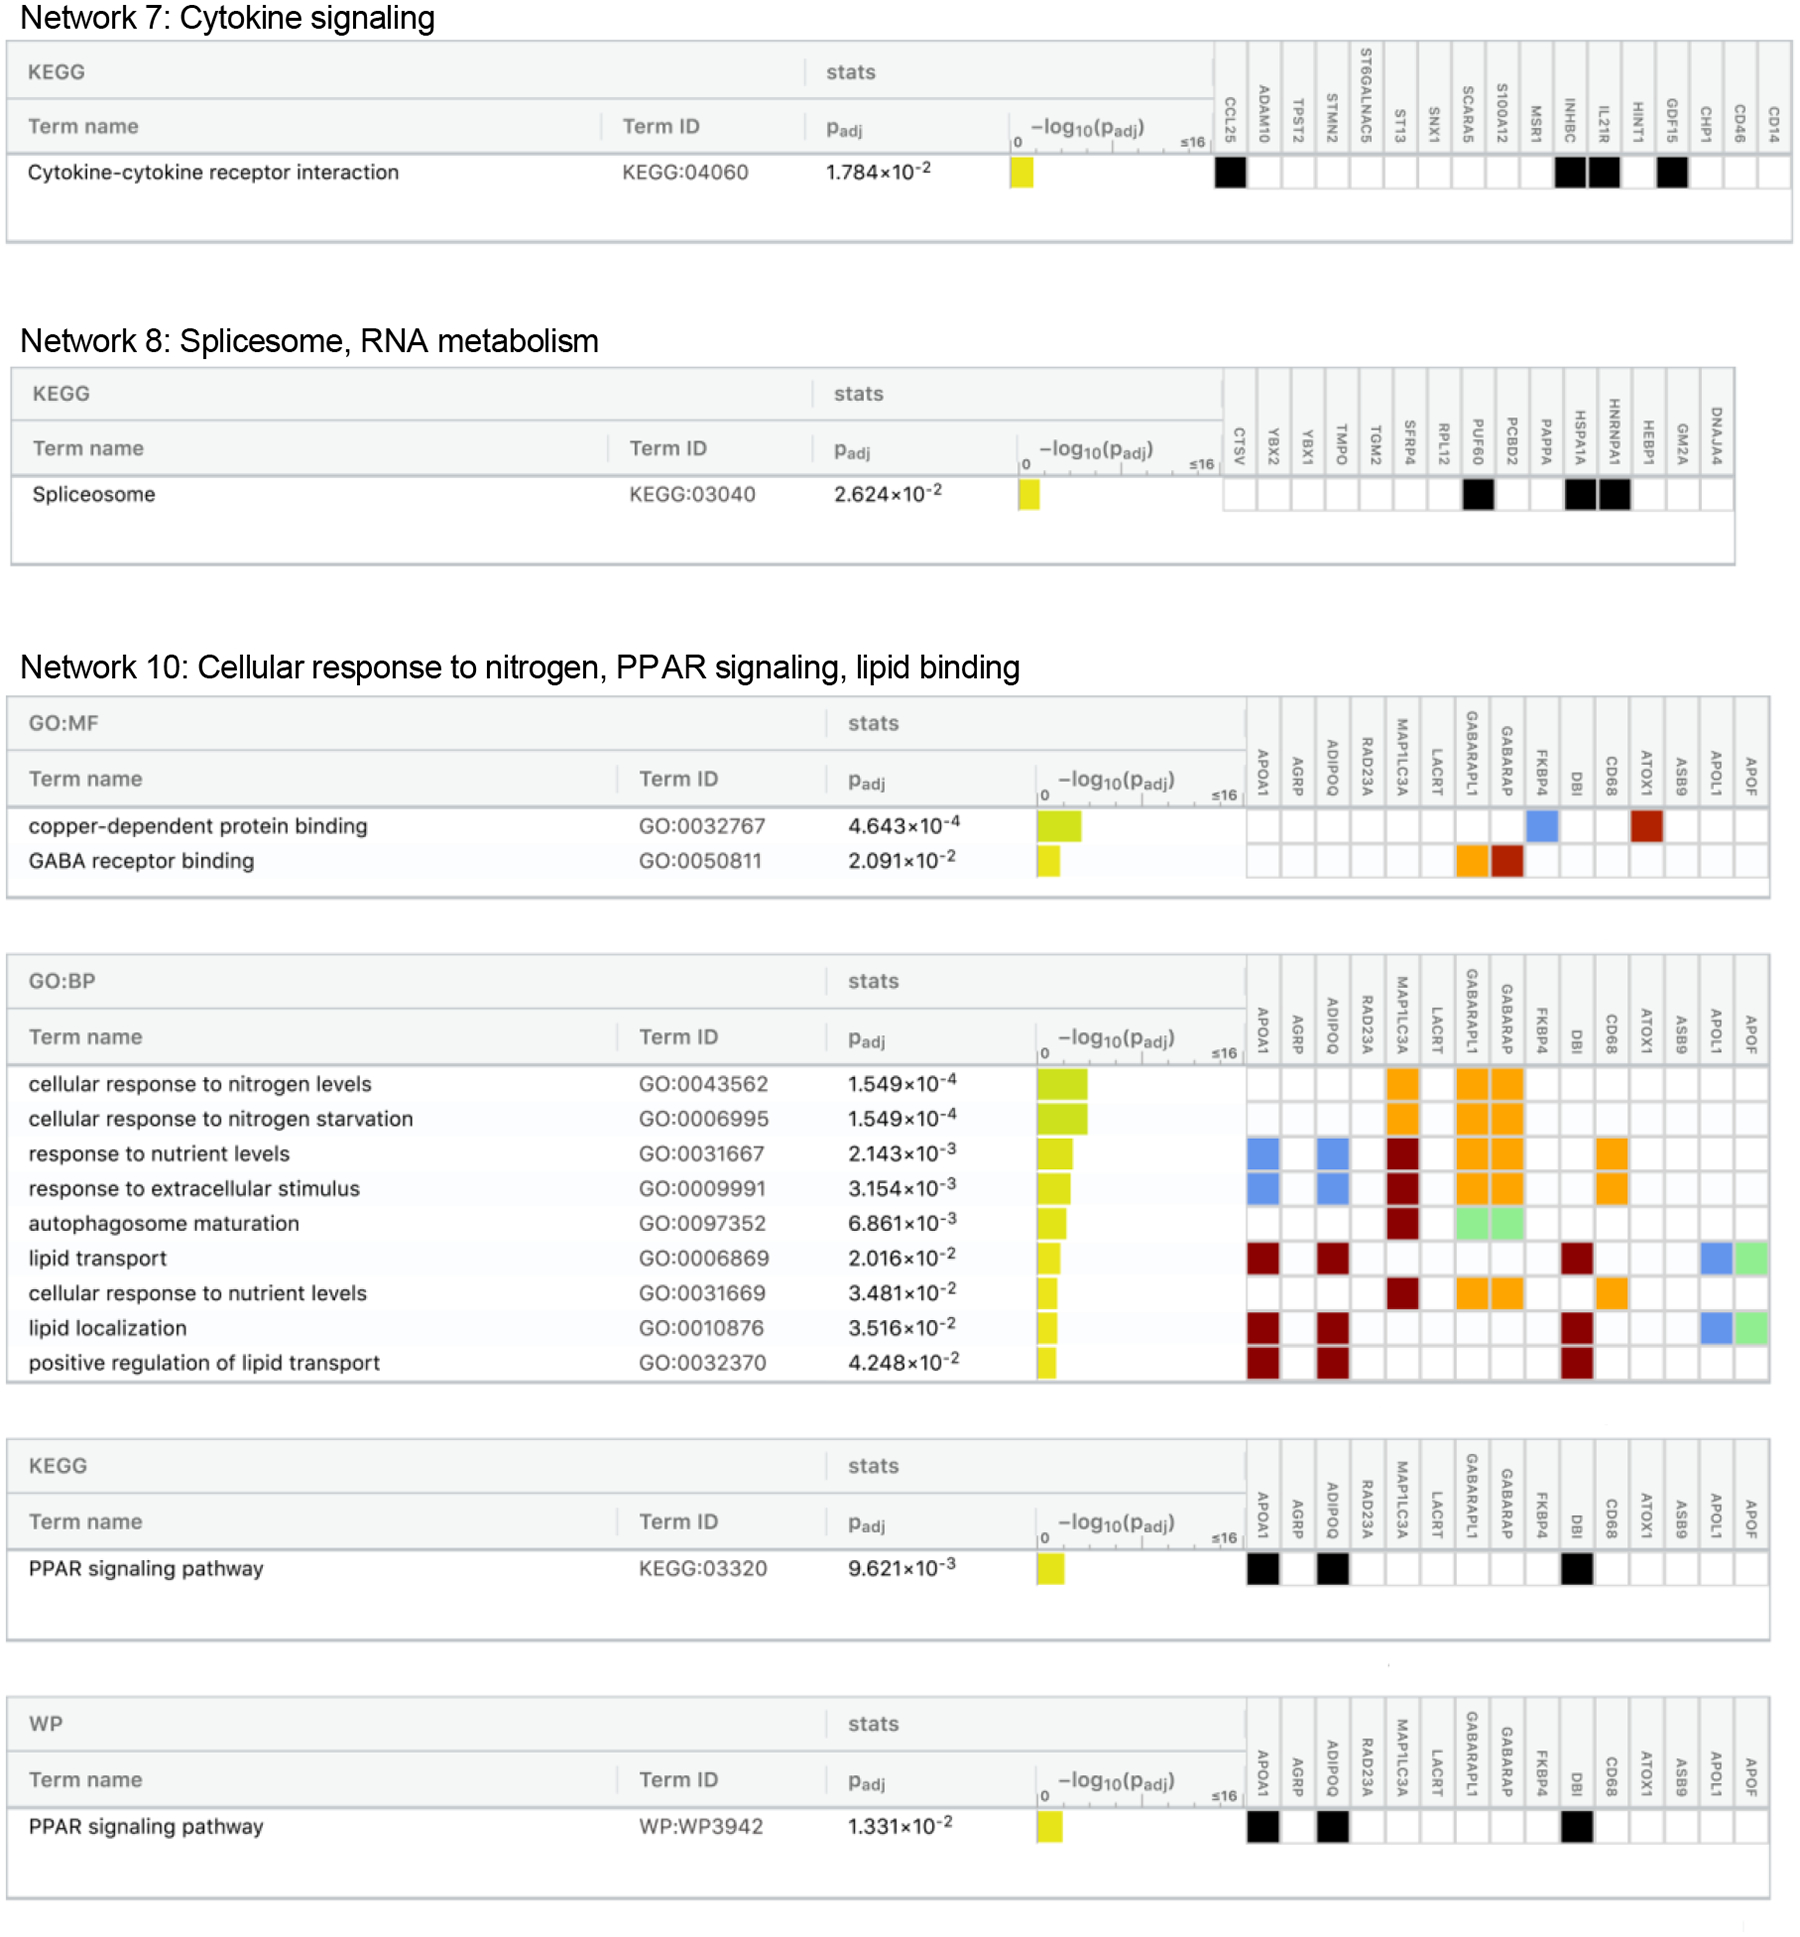
Functional profiling of protein Network 7, Network 8, and Network 10 identified among the set of dementia-associated proteins
Protein networks were assembled based on evidence of known gene/molecule interactions in the Ingenuity Knowledge Base. The g:Profiler toolkit39 was used to analyze the proteins in each dementia-associated protein network for functional enrichment. We defined the biological pathways/processes associated with each protein set using the Gene Ontology (GO), Kyoto Encyclopedia of Genes and Genomes (KEGG), and WikiPathways databases. Images were generated using the g:Profiler web tool: https://biit.cs.ut.ee/gprofiler/. No enriched biological pathways/processes were found for Network 9.
Abbreviations: GO:BP, gene ontology biological process; GO:MF, gene ontology molecular function
Extended Data Fig 8.
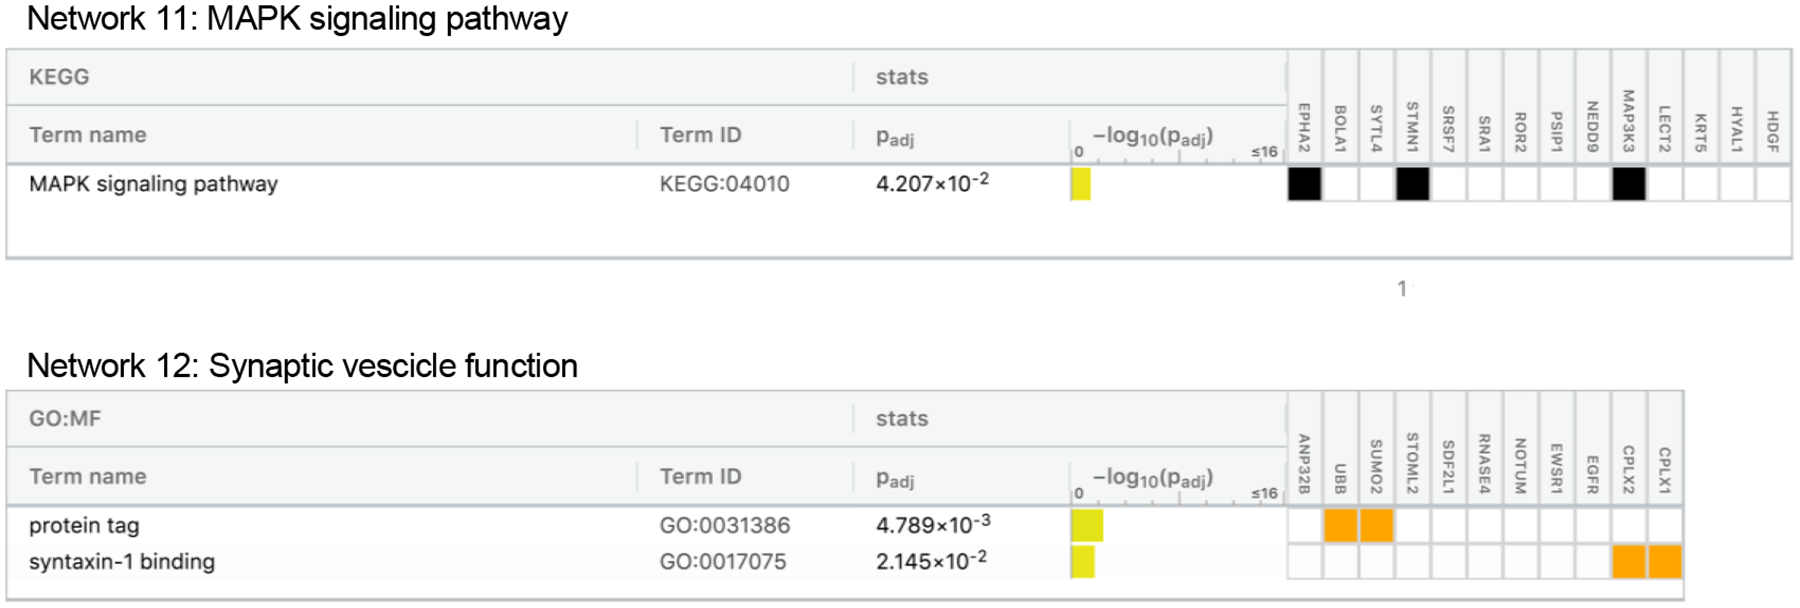
Functional profiling of protein Network 11 and Network 12 identified among the set of dementia-associated proteins
Protein networks were assembled based on evidence of known gene/molecule interactions in the Ingenuity Knowledge Base. The g:Profiler toolkit39 was used to analyze the proteins in each dementia-associated protein network for functional enrichment. We defined the biological pathways/processes associated with each protein set using the Gene Ontology (GO), Kyoto Encyclopedia of Genes and Genomes (KEGG), and WikiPathways databases. Images were generated using the g:Profiler web tool: https://biit.cs.ut.ee/gprofiler/.
Abbreviations: GO:BP, gene ontology biological process; GO:MF, gene ontology molecular function
Extended Data Fig. 9.
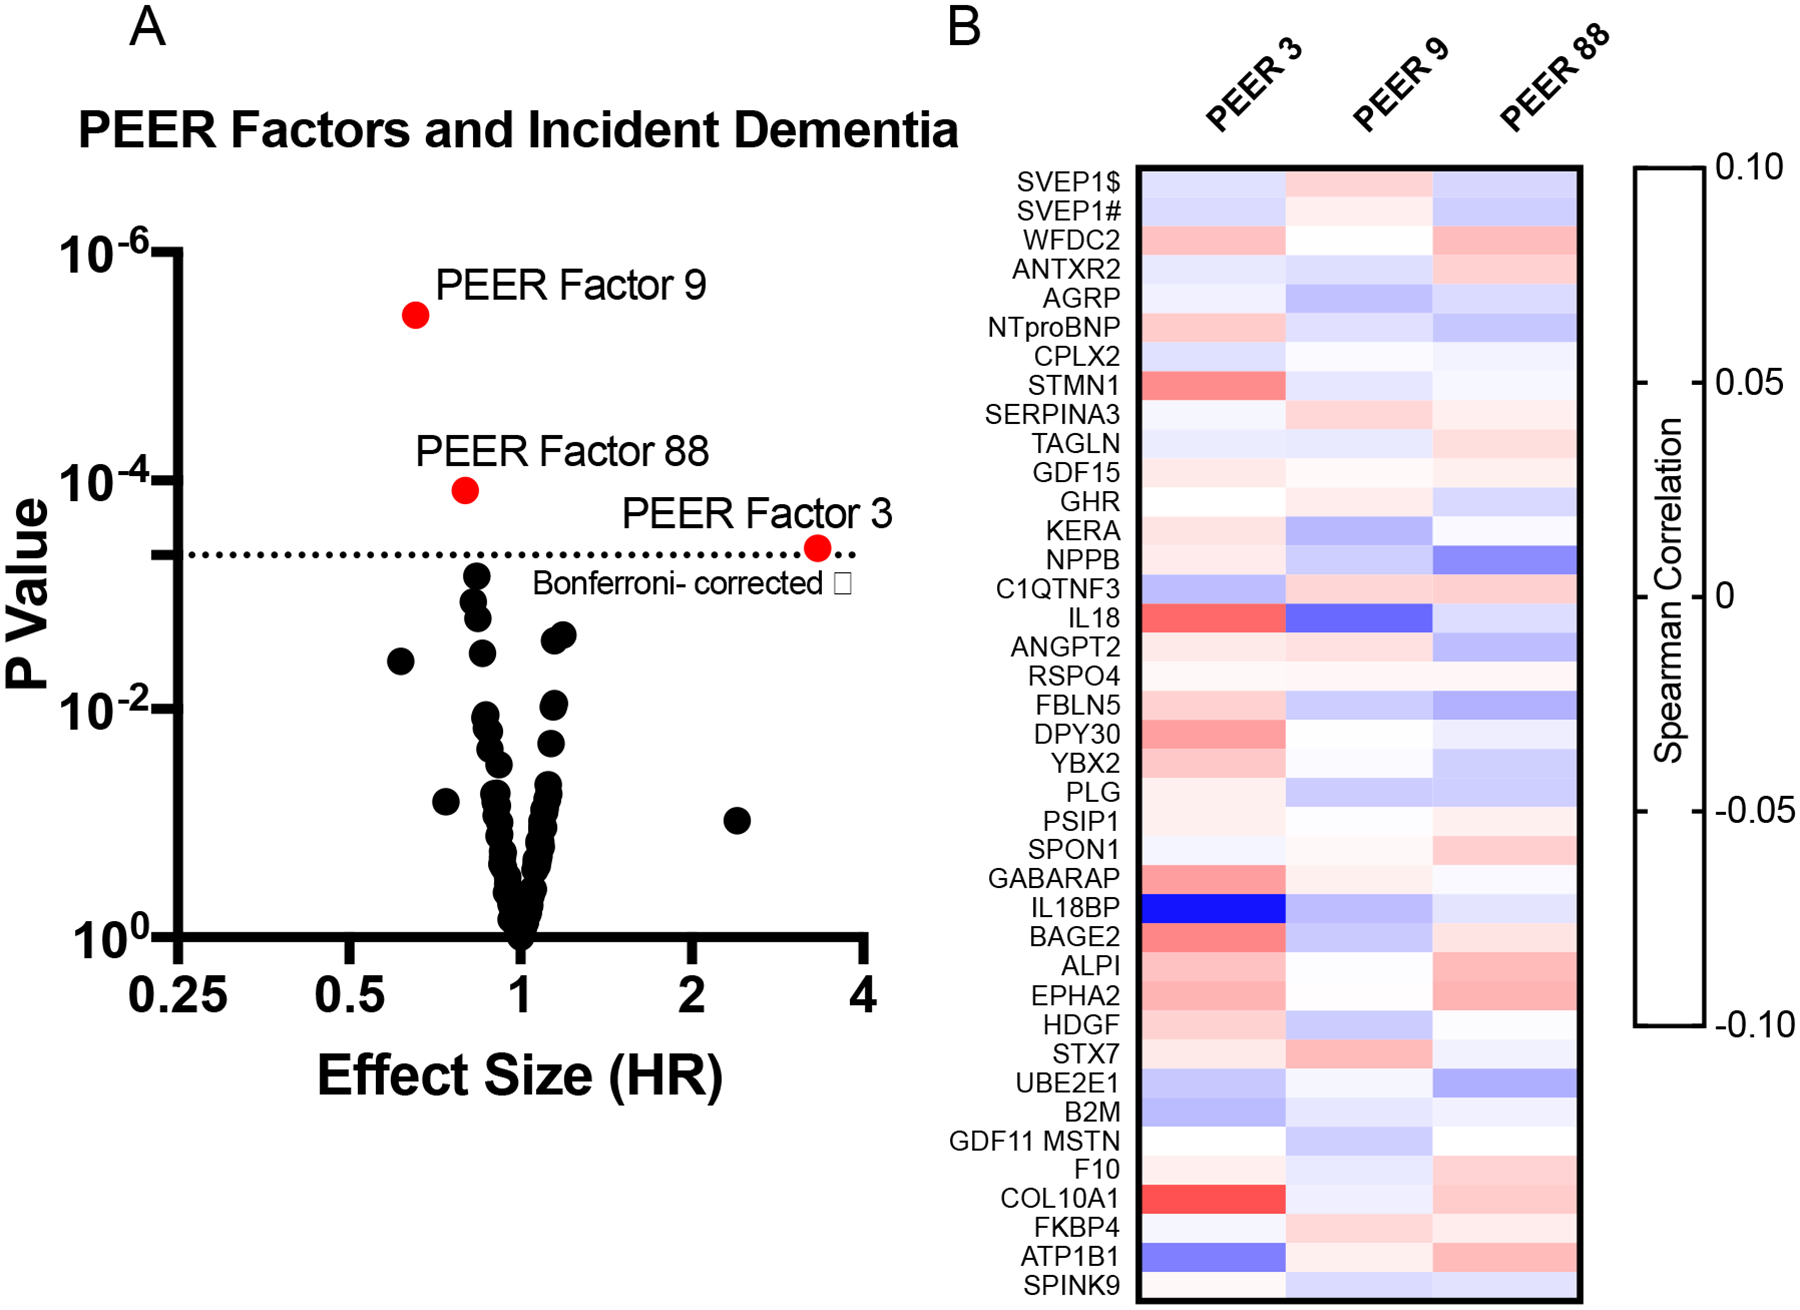
PEER factors associated with incident dementia after visit 5
(A) Volcano plot showing the hazard ratio (x-axis) and two-sided P-value (y-axis) for the association of 110 PEER factors with incident dementia. PEER factors above the horizontal dotted line were significantly associated with incident dementia after Bonferroni correction (0.05/110; P<0.00045). P-values for dementia-associated PEER factors were 3.57E-06, 1.23E-04, and 3.93E-04 for PEER factors 9, 88, and 3, respectively. (B) Spearman correlations between dementia-associated protein level and each PEER factors associated with dementia risk.
Supplementary Material
Acknowledgements:
We thank the staff and participants of the ARIC study for their important contributions. We also thank Bridget Chen for her valuable assistance with aspects of the manuscript. The Atherosclerosis Risk in Communities study has been funded in whole or in part with Federal funds from the National Heart, Lung, and Blood Institute, National Institutes of Health, Department of Health and Human Services (contract numbers HHSN268201700001I, HHSN268201700002I, HHSN268201700003I, HHSN268201700004I and HHSN268201700005I), R01HL087641, R01HL086694; National Human Genome Research Institute contract U01HG004402; and National Institutes of Health contract HHSN268200625226C. Neurocognitive data is collected by U01 2U01HL096812, 2U01HL096814, 2U01HL096899, 2U01HL096902, 2U01HL096917 from the NIH (NHLBI, NINDS, NIA and NIDCD), and with previous brain MRI examinations funded by R01-HL70825 from the NHLBI. The ARIC-PET study is funded by the National Institute on Aging (R01AG040282). Infrastructure was partly supported by Grant Number UL1RR025005, a component of the National Institutes of Health and NIH Roadmap for Medical Research. This study was also supported by contracts K23 AG064122 (to K.A.W), K24 AG052573 (to R.F.G.), and U01-AG052409 (to M.F.) from NIA; and R01-HL134320 (to C.M.B.) from NHLBI. Avid Radiopharmaceuticals provided the florbetapir isotope for the study but had no role in the study design or interpretation of results. The Age Gene/Environment Susceptibility-Reykjavik Study was supported by the Icelandic Heart Association, the National Institute of Aging (N01-AG-12100 and HHSN271201200022C), the Intramural Program at the NIA, the Althingi (the Icelandic Parliament), the Icelandic Centre for Research (RANNIS) grant 141101-051 and the Novartis Institute for Biomedical Research (NIBR). SomaLogic provided assays as an in-kind contribution in a data flex change collaboration agreement. This research was supported in part by the Intramural Research Program of the NIH, National Institute on Aging. Funders had no control over the publication.
Competing interests:
RCH has received grants and consulting fees from Denka Seiken outside the scope of the current research study. AW received fees from Analysis Group as a consultant outside the scope of the current research study. PG is a member of the SomaLogic Medical Advisory board, for which he receives no remuneration of any kind. LLJ is an employee and stockholder of Novartis. RFG received fees from the American Academy of Neurology for her role as an Associate Editor for the journal Neurology. Proteomic assays in ARIC were conducted free of charge as part of a data exchange agreement with Soma Logic. The remaining authors declare no competing interests.
Footnotes
Code availability
All software used in this study are publicly available: R version 3.6.2 (https://www.r-project.org/); Stata, version 14 (https://www.stata.com/stata14/); Ingenuity Pathway Analysis (https://digitalinsights.qiagen.com/products-overview/discovery-insights-portfolio/analysis-and-visualization/qiagen-ipa/); EplainBio (http://www.explainbio.com/); GraphPad Prism 8.4.3. (https://www.graphpad.com/scientific-software/prism/). The code used in this study can be made available from the corresponding author on reasonable request.
Data availability
All data generated in this study are either included in this article (and its Supplementary Information), available on reasonable request, or are available in an online public database. Pre-existing data access policies for each of the parent cohort studies (ARIC and AGES) specify that research data requests can be submitted to each steering committee; these will be promptly reviewed for confidentiality or intellectual property restrictions and will not unreasonably be refused. Individual level patient or protein data may further be restricted by consent, confidentiality or privacy laws/considerations. These policies apply to both clinical and proteomic data. For information on how to access available data and study protocols, see www2.cscc.unc.edu/aric/. Data from the AGES Reykjavik study used in this study are available through collaboration (AGES_data_request@hjarta.is) under a data usage agreement with the IHA. Tissue-specific gene expression data is available at https://www.gtexportal.org/home/. Gene co-expression analyses conducted using data available at http://www.explainbio.com. Brain gene expression date were derived from the Brain eQTL Almanac (BRAINEAC; http://www.braineac.org/) and the Functional Mapping and Annotation of Genome-Wide Association Studies105 (FUMA) platform (https://fuma.ctglab.nl/). eQTL gene enrichment was performed using data from the Molecular signatures (MsigDB; http://www.broadinstitute.org/msigdb) and the NHGRI-EBI Catalog of published genome-wide association studies (GWAS Catalog; https://www.ebi.ac.uk/gwas/). Functional enrichment of protein networks was conducted using the g:Profiler web tool https://biit.cs.ut.ee/gprofiler/gost.
References
- 1.Nakamura A et al. High performance plasma amyloid-β biomarkers for Alzheimer’s disease. Nature 554, 249–254 (2018). [DOI] [PubMed] [Google Scholar]
- 2.Mattsson N, Cullen NC, Andreasson U, Zetterberg H & Blennow K Association between Longitudinal Plasma Neurofilament Light and Neurodegeneration in Patients with Alzheimer Disease. JAMA Neurol. 76, 791–799 (2019). [DOI] [PMC free article] [PubMed] [Google Scholar]
- 3.Palmqvist S et al. Cerebrospinal fluid and plasma biomarker trajectories with increasing amyloid deposition in Alzheimer’s disease. EMBO Mol. Med e11170 (2019). doi: 10.15252/emmm.201911170 [DOI] [PMC free article] [PubMed] [Google Scholar]
- 4.Kim K et al. Clinically accurate diagnosis of Alzheimer’s disease via multiplexed sensing of core biomarkers in human plasma. Nat. Commun 11, 119 (2020). [DOI] [PMC free article] [PubMed] [Google Scholar]
- 5.Soares HD et al. Plasma Biomarkers Associated With the Apolipoprotein E Genotype and Alzheimer Disease. Arch. Neurol 69, 1310 (2012). [DOI] [PMC free article] [PubMed] [Google Scholar]
- 6.Doecke JD et al. Blood-Based Protein Biomarkers for Diagnosis of Alzheimer Disease. Arch. Neurol 69, 1318 (2012). [DOI] [PMC free article] [PubMed] [Google Scholar]
- 7.Hye A et al. Proteome-based plasma biomarkers for Alzheimer’s disease. Brain 129, 3042–3050 (2006). [DOI] [PubMed] [Google Scholar]
- 8.Cutler P et al. Proteomic identification and early validation of complement 1 inhibitor and pigment epithelium-derived factor: Two novel biomarkers of Alzheimer’s disease in human plasma. Proteomics. Clin. Appl 2, 467–77 (2008). [DOI] [PubMed] [Google Scholar]
- 9.Choi J, Malakowsky CA, Talent JM, Conrad CC & Gracy RW Identification of oxidized plasma proteins in Alzheimer’s disease. Biochem. Biophys. Res. Commun 293, 1566–1570 (2002). [DOI] [PubMed] [Google Scholar]
- 10.Henkel AW et al. Multidimensional plasma protein separation technique for identification of potential Alzheimer’s disease plasma biomarkers: a pilot study. J. Neural Transm 119, 779–88 (2012). [DOI] [PubMed] [Google Scholar]
- 11.Ray S et al. Classification and prediction of clinical Alzheimer’s diagnosis based on plasma signaling proteins. Nat. Med 13, 1359–62 (2007). [DOI] [PubMed] [Google Scholar]
- 12.Ijsselstijn L et al. Serum levels of pregnancy zone protein are elevated in presymptomatic alzheimer’s disease. J. Proteome Res 10, 4902–4910 (2011). [DOI] [PubMed] [Google Scholar]
- 13.O’Bryant SE et al. A serum protein-based algorithm for the detection of Alzheimer disease. Arch. Neurol 67, 1077–81 (2010). [DOI] [PMC free article] [PubMed] [Google Scholar]
- 14.Sattlecker M et al. Alzheimer’s disease biomarker discovery using SOMAscan multiplexed protein technology. Alzheimer’s Dement. 10, 724–734 (2014). [DOI] [PubMed] [Google Scholar]
- 15.Kiddle SJ et al. Candidate blood proteome markers of Alzheimer’s disease onset and progression: A systematic review and replication study. Journal of Alzheimer’s Disease 38, 515–531 (2014). [DOI] [PubMed] [Google Scholar]
- 16.Sattlecker M et al. Longitudinal Protein Changes in Blood Plasma Associated with the Rate of Cognitive Decline in Alzheimer’s Disease. J. Alzheimer’s Dis 49, 1105–1114 (2016). [DOI] [PubMed] [Google Scholar]
- 17.Zhang Y et al. An RNA-Sequencing Transcriptome and Splicing Database of Glia, Neurons, and Vascular Cells of the Cerebral Cortex. J. Neurosci 34, 11929–11947 (2014). [DOI] [PMC free article] [PubMed] [Google Scholar]
- 18.Sharma K et al. Cell type- and brain region-resolved mouse brain proteome. Nat. Neurosci 18, 1819–1831 (2015). [DOI] [PMC free article] [PubMed] [Google Scholar]
- 19.Seyfried NT et al. A Multi-network Approach Identifies Protein-Specific Co-expression in Asymptomatic and Symptomatic Alzheimer’s Disease. Cell Syst. 4, 60–72.e4 (2017). [DOI] [PMC free article] [PubMed] [Google Scholar]
- 20.Ganz P et al. Development and validation of a protein-based risk score for cardiovascular outcomes among patients with stable coronary heart disease. JAMA - J. Am. Med. Assoc 315, 2532–2541 (2016). [DOI] [PubMed] [Google Scholar]
- 21.Gold L et al. Aptamer-based multiplexed proteomic technology for biomarker discovery. PLoS One 5, e15004 (2010). [DOI] [PMC free article] [PubMed] [Google Scholar]
- 22.Kunkle BW et al. Genetic meta-analysis of diagnosed Alzheimer’s disease identifies new risk loci and implicates Aβ, tau, immunity and lipid processing. Nat. Genet 51, 414–430 (2019). [DOI] [PMC free article] [PubMed] [Google Scholar]
- 23.Price AL et al. Principal components analysis corrects for stratification in genome-wide association studies. Nat. Genet 38, 904–909 (2006). [DOI] [PubMed] [Google Scholar]
- 24.Shadlen MF et al. Education, cognitive test scores, and black-white differences in dementia risk. J. Am. Geriatr. Soc 54, 898–905 (2006). [DOI] [PubMed] [Google Scholar]
- 25.Lehallier B et al. Undulating changes in human plasma proteome profiles across the lifespan. Nat. Med 25, 1843–1850 (2019). [DOI] [PMC free article] [PubMed] [Google Scholar]
- 26.Harris TB et al. Age, gene/environment susceptibility-reykjavik study: Multidisciplinary applied phenomics. Am. J. Epidemiol 165, 1076–1087 (2007). [DOI] [PMC free article] [PubMed] [Google Scholar]
- 27.Emilsson V et al. Co-regulatory networks of human serum proteins link genetics to disease. Science (80-.) 361, 769–773 (2018). [DOI] [PMC free article] [PubMed] [Google Scholar]
- 28.Sun BB et al. Genomic atlas of the human plasma proteome. Nature 558, 73–79 (2018). [DOI] [PMC free article] [PubMed] [Google Scholar]
- 29.Cissé M & Checler F Eph receptors: New players in Alzheimer’s disease pathogenesis. Neurobiology of Disease 73, 137–149 (2015). [DOI] [PubMed] [Google Scholar]
- 30.Shi L et al. A Decade of Blood Biomarkers for Alzheimer’s Disease Research: An Evolving Field, Improving Study Designs, and the Challenge of Replication. Journal of Alzheimer’s Disease 62, 1181–1198 (2018). [DOI] [PMC free article] [PubMed] [Google Scholar]
- 31.Palmqvist S et al. Discriminative Accuracy of Plasma Phospho-tau217 for Alzheimer Disease vs Other Neurodegenerative Disorders. JAMA - J. Am. Med. Assoc 324, 772–781 (2020). [DOI] [PMC free article] [PubMed] [Google Scholar]
- 32.Ghosh S et al. Sustained Interleukin-1 Overexpression Exacerbates Tau Pathology Despite Reduced Amyloid Burden in an Alzheimer’s Mouse Model. J. Neurosci 33, 5053–5064 (2013). [DOI] [PMC free article] [PubMed] [Google Scholar]
- 33.Paolicelli RC et al. TDP-43 Depletion in Microglia Promotes Amyloid Clearance but Also Induces Synapse Loss. Neuron 95, 297–308.e6 (2017). [DOI] [PMC free article] [PubMed] [Google Scholar]
- 34.Varma S Network model of normal gene expression predicts gene perturbation fold changes. in RECOMB/ISCB Conference on Regulatory and Systems Genomics with DREAM Challenges (2015). [Google Scholar]
- 35.Varma VR et al. Alpha-2 macroglobulin in Alzheimer’s disease: a marker of neuronal injury through the RCAN1 pathway. Mol. Psychiatry 22, 13–23 (2017). [DOI] [PMC free article] [PubMed] [Google Scholar]
- 36.Seddighi S et al. SPARCL1 Accelerates Symptom Onset in Alzheimer’s Disease and Influences Brain Structure and Function during Aging. J. Alzheimer’s Dis 61, 401–414 (2018). [DOI] [PMC free article] [PubMed] [Google Scholar]
- 37.Savli H, Szendröi A, Romics I & Nagy B Gene network and canonical pathway analysis in prostate cancer: A microarray study. Exp. Mol. Med 40, 176–185 (2008). [DOI] [PMC free article] [PubMed] [Google Scholar]
- 38.Keren-Shaul H et al. A Unique Microglia Type Associated with Restricting Development of Alzheimer’s Disease. Cell 169, 1276–1290.e17 (2017). [DOI] [PubMed] [Google Scholar]
- 39.Raudvere U et al. G:Profiler: A web server for functional enrichment analysis and conversions of gene lists (2019 update). Nucleic Acids Res. 47, W191–W198 (2019). [DOI] [PMC free article] [PubMed] [Google Scholar]
- 40.Gene T et al. Gene Ontology: tool for the unification of biology. Nat. Genet 25, 25 (2000). [DOI] [PMC free article] [PubMed] [Google Scholar]
- 41.The Gene Ontology C et al. The Gene Ontology Resource: 20 years and still GOing strong. Nucleic Acids Res. (2019). doi: 10.17863/CAM.36439 [DOI] [PMC free article] [PubMed] [Google Scholar]
- 42.Kanehisa M, Sato Y, Kawashima M, Furumichi M & Tanabe M KEGG as a reference resource for gene and protein annotation. Nucleic Acids Res. 44, D457–D462 (2016). [DOI] [PMC free article] [PubMed] [Google Scholar]
- 43.Bohler A et al. Reactome from a WikiPathways Perspective. PLoS Comput. Biol 12, (2016). [DOI] [PMC free article] [PubMed] [Google Scholar]
- 44.Jansen IE et al. Genome-wide meta-analysis identifies new loci and functional pathways influencing Alzheimer’s disease risk. Nat. Genet 51, 404–413 (2019). [DOI] [PMC free article] [PubMed] [Google Scholar]
- 45.Zhang B et al. Integrated systems approach identifies genetic nodes and networks in late-onset Alzheimer’s disease. Cell 153, 707–720 (2013). [DOI] [PMC free article] [PubMed] [Google Scholar]
- 46.Jones L et al. Convergent genetic and expression data implicate immunity in Alzheimer’s disease. Alzheimer’s Dement. 11, 658–671 (2015). [DOI] [PMC free article] [PubMed] [Google Scholar]
- 47.Felsky D et al. Neuropathological correlates and genetic architecture of microglial activation in elderly human brain. Nat. Commun 10, (2019). [DOI] [PMC free article] [PubMed] [Google Scholar]
- 48.Walker KA et al. The association of mid-to late-life systemic inflammation with white matter structure in older adults: The Atherosclerosis Risk in Communities Study. Neurobiol. Aging 68, 26–33 (2018). [DOI] [PMC free article] [PubMed] [Google Scholar]
- 49.Steeland S et al. Counteracting the effects of TNF receptor-1 has therapeutic potential in Alzheimer’s disease. EMBO Mol. Med 10, (2018). [DOI] [PMC free article] [PubMed] [Google Scholar]
- 50.Krasemann S et al. The TREM2-APOE Pathway Drives the Transcriptional Phenotype of Dysfunctional Microglia in Neurodegenerative Diseases. Immunity 47, 566–581.e9 (2017). [DOI] [PMC free article] [PubMed] [Google Scholar]
- 51.Neumann H & Daly MJ Variant TREM2 as risk factor for alzheimer’s disease. N. Engl. J. Med 368, 182–184 (2013). [DOI] [PubMed] [Google Scholar]
- 52.Stegle O, Parts L, Piipari M, Winn J & Durbin R Using probabilistic estimation of expression residuals (PEER) to obtain increased power and interpretability of gene expression analyses. Nat. Protoc 7, 500–507 (2012). [DOI] [PMC free article] [PubMed] [Google Scholar]
- 53.Parts L, Stegle O, Winn J & Durbin R Joint genetic analysis of gene expression data with inferred cellular phenotypes. PLoS Genet. 7, e1001276 (2011). [DOI] [PMC free article] [PubMed] [Google Scholar]
- 54.Trimbuch T & Rosenmund C Should I stop or should I go? The role of complexin in neurotransmitter release. Nature Reviews Neuroscience 17, 118–125 (2016). [DOI] [PubMed] [Google Scholar]
- 55.An SJ, Grabner CP & Zenisek D Real-time visualization of complexin during single exocytic events. Nat. Neurosci 13, 577–583 (2010). [DOI] [PMC free article] [PubMed] [Google Scholar]
- 56.Tannenberg RK, Scott HL, Tannenberg AEG & Dodd PR Selective loss of synaptic proteins in Alzheimer’s disease: Evidence for an increased severity with APOE ε4. Neurochem. Int 49, 631–639 (2006). [DOI] [PubMed] [Google Scholar]
- 57.Nakada TA, Russell JA, Boyd JH, Thair SA & Walley KR Identification of a nonsynonymous polymorphism in the SVEP1 gene associated with altered clinical outcomes in septic shock. Crit. Care Med 43, 101–108 (2015). [DOI] [PubMed] [Google Scholar]
- 58.Siddiqui S, Gurung RL, Liu S, Seet ECP & Lim SC Genetic Polymorphisms and Cytokine Profile of Different Ethnicities in Septic Shock Patients, and their Association with Mortality. Indian J. Crit. Care Med 23, 135–138 (2019). [DOI] [PMC free article] [PubMed] [Google Scholar]
- 59.Sato-Nishiuchi R et al. Polydom/SVEP1 is a ligand for integrin α9β1. J. Biol. Chem 287, 25615–25630 (2012). [DOI] [PMC free article] [PubMed] [Google Scholar]
- 60.Schwanzer-Pfeiffer D, Roßmanith E, Schildberger A & Falkenhagen D Characterization of SVEP1, KIAA, and SRPX2 in an in vitro cell culture model of endotoxemia. Cell. Immunol 263, 65–70 (2010). [DOI] [PubMed] [Google Scholar]
- 61.Richter V et al. Circulating vascular cell adhesion molecules VCAM-1, ICAM-1, and E-selectin in dependence on aging. Gerontology 49, 293–300 (2003). [DOI] [PubMed] [Google Scholar]
- 62.Yousef H et al. Aged blood impairs hippocampal neural precursor activity and activates microglia via brain endothelial cell VCAM1. Nat. Med 25, 988–1000 (2019). [DOI] [PMC free article] [PubMed] [Google Scholar]
- 63.Janelidze S et al. CSF biomarkers of neuroinflammation and cerebrovascular dysfunction in early Alzheimer disease. Neurology 91, e867–e877 (2018). [DOI] [PMC free article] [PubMed] [Google Scholar]
- 64.K Ryu J, P Little J, Klegeris A, Jantaratnotai N & G McLarnon J Actions of the Anti-Angiogenic Compound Angiostatin in an Animal Model of Alzheimer’s Disease. Curr. Alzheimer Res 10, 252–260 (2013). [DOI] [PubMed] [Google Scholar]
- 65.Jahanshad N et al. Genome-wide scan of healthy human connectome discovers SPON1 gene variant influencing dementia severity. Proc. Natl. Acad. Sci. U. S. A 110, 4768–4773 (2013). [DOI] [PMC free article] [PubMed] [Google Scholar]
- 66.Bossù P et al. Interleukin-18 produced by peripheral blood cells is increased in Alzheimer’s disease and correlates with cognitive impairment. Brain. Behav. Immun 22, 487–492 (2008). [DOI] [PubMed] [Google Scholar]
- 67.Li X, Long J, He T, Belshaw R & Scott J Integrated genomic approaches identify major pathways and upstream regulators in late onset Alzheimer’s disease. Sci. Rep 5, 12393 (2015). [DOI] [PMC free article] [PubMed] [Google Scholar]
- 68.Keren-Shaul H et al. A Unique Microglia Type Associated with Restricting Development of Alzheimer’s Disease. Cell 169, 1276–1290.e17 (2017). [DOI] [PubMed] [Google Scholar]
- 69.Painter MM et al. TREM2 in CNS homeostasis and neurodegenerative disease. Molecular Neurodegeneration 10, (2015). [DOI] [PMC free article] [PubMed] [Google Scholar]
- 70.The ARIC Investigators. The Atherosclerosis Risk in Communities (ARIC) Study: design and objectives. The ARIC investigators. Am. J. Epidemiol 129, 687–702 (1989). [PubMed] [Google Scholar]
- 71.Tin A et al. Reproducibility and Variability of Protein Analytes Measured Using a Multiplexed Modified Aptamer Assay. J. Appl. Lab. Med 4, 30–39 (2019). [DOI] [PMC free article] [PubMed] [Google Scholar]
- 72.Kim CH et al. Stability and reproducibility of proteomic profiles measured with an aptamer-based platform. Sci. Rep 8, 8382 (2018). [DOI] [PMC free article] [PubMed] [Google Scholar]
- 73.Candia J et al. Assessment of Variability in the SOMAscan Assay. Sci. Rep 7, 14248 (2017). [DOI] [PMC free article] [PubMed] [Google Scholar]
- 74.Williams SA et al. Plasma protein patterns as comprehensive indicators of health. Nat. Med 25, 1851–1857 (2019). [DOI] [PMC free article] [PubMed] [Google Scholar]
- 75.Muntner P, He J, Astor BC, Folsom AR & Coresh J Traditional and Nontraditional Risk Factors Predict Coronary Heart Disease in Chronic Kidney Disease: Results from the Atherosclerosis Risk in Communities Study. J. Am. Soc. Nephrol 16, 529–538 (2005). [DOI] [PubMed] [Google Scholar]
- 76.Knopman DS et al. Mild cognitive impairment and dementia prevalence: The Atherosclerosis Risk in Communities Neurocognitive Study. Alzheimer’s Dement. Diagnosis, Assess. Dis. Monit 2, 1–11 (2016). [DOI] [PMC free article] [PubMed] [Google Scholar]
- 77.Hayden KM et al. Cognitive decline in the elderly: An analysis of population heterogeneity. Age Ageing 40, 684–689 (2011). [DOI] [PMC free article] [PubMed] [Google Scholar]
- 78.Wilson RS, Li Y, Bienias L & Bennett DA Cognitive decline in old age: Separating retest effects from the effects of growing older. Psychol. Aging 21, 774–789 (2006). [DOI] [PubMed] [Google Scholar]
- 79.McKhann GM et al. The diagnosis of dementia due to Alzheimer’s disease: Recommendations from the National Institute on Aging-Alzheimer’s Association workgroups on diagnostic guidelines for Alzheimer’s disease. Alzheimer’s and Dementia 7, 263–269 (2011). [DOI] [PMC free article] [PubMed] [Google Scholar]
- 80.American Psychiatric Association. DSM-5: Diagnostic and Statistical Manual of Mental Disorders. (American Psychiatric Association, 2013). [Google Scholar]
- 81.Carpenter CR, Despain B, Keeling TN, Shah M & Rothenberger M The six-item screener and AD8 for the detection of cognitive impairment in geriatric emergency department patients. Ann. Emerg. Med 57, 653–661 (2011). [DOI] [PMC free article] [PubMed] [Google Scholar]
- 82.Galvin JE, Roe CM, Xiong C & Morris JC Validity and reliability of the AD8 informant interview in dementia. Neurology 67, 1942–1948 (2006). [DOI] [PubMed] [Google Scholar]
- 83.Walker KA et al. Association of Midlife to Late-Life Blood Pressure Patterns With Incident Dementia. JAMA 322, 535–545 (2019). [DOI] [PMC free article] [PubMed] [Google Scholar]
- 84.Gottesman RF et al. Associations Between Midlife Vascular Risk Factors and 25-Year Incident Dementia in the Atherosclerosis Risk in Communities (ARIC) Cohort. JAMA Neurol. 388, 797–805 (2017). [DOI] [PMC free article] [PubMed] [Google Scholar]
- 85.American Psychiatric Association. in The Curated Reference Collection in Neuroscience and Biobehavioral Psychology (American Psychiatric Association, 1994). doi: 10.1016/B978-0-12-809324-5.05530-9 [DOI] [Google Scholar]
- 86.Knopman DS et al. Vascular Imaging abnormalities and cognition: Mediation by cortical volume in nondemented individuals: Atherosclerosis risk in communities-neurocognitive study. Stroke 46, 433–440 (2015). [DOI] [PMC free article] [PubMed] [Google Scholar]
- 87.Fischl B et al. Whole brain segmentation: Automated labeling of neuroanatomical structures in the human brain. Neuron 33, 341–355 (2002). [DOI] [PubMed] [Google Scholar]
- 88.Dickerson BC et al. Alzheimer-signature MRI biomarker predicts AD dementia in cognitively normal adults. Neurology 76, 1395–1402 (2011). [DOI] [PMC free article] [PubMed] [Google Scholar]
- 89.Raz L et al. Thrombogenic microvesicles and white matter hyperintensities in postmenopausal women. Neurology 80, 911–918 (2013). [DOI] [PMC free article] [PubMed] [Google Scholar]
- 90.Gottesman RF et al. The ARIC-PET amyloid imaging study: Brain amyloid differences by age, race, sex, and APOE. Neurology 87, 473–480 (2016). [DOI] [PMC free article] [PubMed] [Google Scholar]
- 91.Smith GD & Ebrahim S ‘Mendelian randomization’: Can genetic epidemiology contribute to understanding environmental determinants of disease? International Journal of Epidemiology 32, 1–22 (2003). [DOI] [PubMed] [Google Scholar]
- 92.Burgess S, Butterworth A & Thompson SG Mendelian randomization analysis with multiple genetic variants using summarized data. Genet. Epidemiol 37, 658–665 (2013). [DOI] [PMC free article] [PubMed] [Google Scholar]
- 93.Zheng J et al. Recent Developments in Mendelian Randomization Studies. Curr. Epidemiol. Reports 4, 330–345 (2017). [DOI] [PMC free article] [PubMed] [Google Scholar]
- 94.Machiela MJ & Chanock SJ LDlink: A web-based application for exploring population-specific haplotype structure and linking correlated alleles of possible functional variants. Bioinformatics 31, 3555–3557 (2015). [DOI] [PMC free article] [PubMed] [Google Scholar]
- 95.Bowden J, Davey Smith G & Burgess S Mendelian randomization with invalid instruments: effect estimation and bias detection through Egger regression. Int. J. Epidemiol 44, 512–25 (2015). [DOI] [PMC free article] [PubMed] [Google Scholar]
- 96.Bowden J, Davey Smith G, Haycock PC & Burgess S Consistent Estimation in Mendelian Randomization with Some Invalid Instruments Using a Weighted Median Estimator. Genet. Epidemiol 40, 304–314 (2016). [DOI] [PMC free article] [PubMed] [Google Scholar]
- 97.Burgess S, Foley CN, Allara E, Staley JR & Howson JMM A robust and efficient method for Mendelian randomization with hundreds of genetic variants. Nat. Commun 11, 376 (2020). [DOI] [PMC free article] [PubMed] [Google Scholar]
- 98.Staiger D & Stock JH Instrumental Variables Regression with Weak Instruments. (National Bureau of Economic Research, Inc, 1994). doi:DOI: [Google Scholar]
- 99.Burgess S & Thompson SG Interpreting findings from Mendelian randomization using the MR-Egger method. Eur. J. Epidemiol 32, 377–389 (2017). [DOI] [PMC free article] [PubMed] [Google Scholar]
- 100.Verbanck M, Chen CY, Neale B & Do R Detection of widespread horizontal pleiotropy in causal relationships inferred from Mendelian randomization between complex traits and diseases. Nat. Genet 50, 693–698 (2018). [DOI] [PMC free article] [PubMed] [Google Scholar]
- 101.Cochran W The combination of estimates from different experiments. Biometrics 10, 101–129 (1954). [Google Scholar]
- 102.Hemani G et al. The MR-base platform supports systematic causal inference across the human phenome. Elife 7, (2018). [DOI] [PMC free article] [PubMed] [Google Scholar]
- 103.Burgess S, Scott RA, Timpson NJ, Davey Smith G & Thompson SG Using published data in Mendelian randomization: a blueprint for efficient identification of causal risk factors. Eur. J. Epidemiol 30, 543–552 (2015). [DOI] [PMC free article] [PubMed] [Google Scholar]
- 104.Bowden J et al. Improving the visualization, interpretation and analysis of two-sample summary data Mendelian randomization via the Radial plot and Radial regression. Int. J. Epidemiol 47, 1264–1278 (2018). [DOI] [PMC free article] [PubMed] [Google Scholar]
- 105.Watanabe K, Taskesen E, Van Bochoven A & Posthuma D Functional mapping and annotation of genetic associations with FUMA. Nat. Commun 8, (2017). [DOI] [PMC free article] [PubMed] [Google Scholar]
- 106.Kircher M et al. A general framework for estimating the relative pathogenicity of human genetic variants. Nat. Genet 46, 310–315 (2014). [DOI] [PMC free article] [PubMed] [Google Scholar]
- 107.Ramasamy A et al. Genetic variability in the regulation of gene expression in ten regions of the human brain. Nat. Neurosci 17, 1418–1428 (2014). [DOI] [PMC free article] [PubMed] [Google Scholar]
- 108.Aguet F et al. The GTEx Consortium atlas of genetic regulatory effects across human tissues. bioRxiv 787903 (2019). doi: 10.1101/787903 [DOI] [PMC free article] [PubMed] [Google Scholar]
- 109.Lonsdale J et al. The Genotype-Tissue Expression (GTEx) project. Nature Genetics 45, 580–585 (2013). [DOI] [PMC free article] [PubMed] [Google Scholar]
- 110.Hage C et al. Inflammatory Biomarkers Predict Heart Failure Severity and Prognosis in Patients with Heart Failure with Preserved Ejection Fraction: A Holistic Proteomic Approach. Circ. Cardiovasc. Genet 10, (2017). [DOI] [PubMed] [Google Scholar]
- 111.Helleman J, Smid M, Jansen MPHM, van der Burg MEL & Berns EMJJ Pathway analysis of gene lists associated with platinum-based chemotherapy resistance in ovarian cancer: The big picture. Gynecol. Oncol 117, 170–176 (2010). [DOI] [PubMed] [Google Scholar]
- 112.Krämer A, Green J, Pollard J & Tugendreich S Causal analysis approaches in ingenuity pathway analysis. Bioinformatics 30, 523–530 (2014). [DOI] [PMC free article] [PubMed] [Google Scholar]
- 113.Stegle O, Parts L, Durbin R & Winn J A bayesian framework to account for complex non-genetic factors in gene expression levels greatly increases power in eQTL studies. PLoS Comput. Biol 6, 1–11 (2010). [DOI] [PMC free article] [PubMed] [Google Scholar]
Associated Data
This section collects any data citations, data availability statements, or supplementary materials included in this article.
Supplementary Materials
Data Availability Statement
All data generated in this study are either included in this article (and its Supplementary Information), available on reasonable request, or are available in an online public database. Pre-existing data access policies for each of the parent cohort studies (ARIC and AGES) specify that research data requests can be submitted to each steering committee; these will be promptly reviewed for confidentiality or intellectual property restrictions and will not unreasonably be refused. Individual level patient or protein data may further be restricted by consent, confidentiality or privacy laws/considerations. These policies apply to both clinical and proteomic data. For information on how to access available data and study protocols, see www2.cscc.unc.edu/aric/. Data from the AGES Reykjavik study used in this study are available through collaboration (AGES_data_request@hjarta.is) under a data usage agreement with the IHA. Tissue-specific gene expression data is available at https://www.gtexportal.org/home/. Gene co-expression analyses conducted using data available at http://www.explainbio.com. Brain gene expression date were derived from the Brain eQTL Almanac (BRAINEAC; http://www.braineac.org/) and the Functional Mapping and Annotation of Genome-Wide Association Studies105 (FUMA) platform (https://fuma.ctglab.nl/). eQTL gene enrichment was performed using data from the Molecular signatures (MsigDB; http://www.broadinstitute.org/msigdb) and the NHGRI-EBI Catalog of published genome-wide association studies (GWAS Catalog; https://www.ebi.ac.uk/gwas/). Functional enrichment of protein networks was conducted using the g:Profiler web tool https://biit.cs.ut.ee/gprofiler/gost.