

Abstract
Background:
To assess the cost-effectiveness of sacubitril/valsartan compared with enalapril in patients with heart failure with reduced ejection (HFrEF).
Methods:
A systematic literature search was conducted searching in major electronic databases from inception to January 1, 2021. All relevant full economic evaluation studies of sacubitril/valsartan versus enalapril for the treatment of patients with HFrEF were identified using ad hoc search strategies. Mortality, hospital admissions, quality-adjusted life years (QALYs), life-years (LYQs), annual drug costs, total lifetime costs, and incremental cost-effectiveness ratio (ICER) were considered as the outcomes. The quality of the included studies was assessed using the CHEERS checklist. This study was conducted and reported in accordance with the “Preferred Reporting Items for Systematic Reviews and Meta-Analyses” (PRISMA) guidelines.
Results:
The initial search yielded a pool of 1026 articles, of which 703 unique articles were screened, 65 full-text articles were assessed for eligibility and 15 studies finally included in the qualitative synthesis. Studies show that sacubitril/valsartan reduces mortality and hospitalization rate. The mean of death risk ratio and hospitalization were computed at 0.843 and 0.844, respectively. Sacubitril/valsartan produced higher annual and total lifetime costs. The lowest and highest lifetime costs for sacubitril/valsartan were found in Thailand ($4,756) and Germany ($118,815), respectively. The lowest ICER was reported in Thailand ($4857/QALY) and the highest in the USA ($143,891/QALY).
Conclusion:
Sacubitril/valsartan is associated with better outcomes and may be cost-effective compared to enalapril for the management of HFrEF. However, in developing countries such as Thailand, sacubitril-valsartan costs must be reduced to yield an ICER below the threshold.
Keywords: Cost-effectiveness analysis; Sacubitril-valsartan; Heart failure, epidemiology; Heart failure, therapy; Systematic review
Introduction
Heart failure (HF) is associated with notable mortality, morbidity and economic burden. Heart failure is the leading cause of admission in the United States with more than 1 million annual hospital admissions.1 The prevalence is estimated to be 1 to 2%, and more than 50 percent of the patients have HF with reduced ejection fraction (HFrEF).2 According to estimates, in 2010 15 million people in Europe and 6.6 million in the United States are expected to suffer from HF.3,4 HF accounts for approximately 2% of the UK National Health Service (NHS) annual budget, however the cost will rise to 4%, if hospitalizations and nursing home visits costs are considered.5
Angiotensin-converting–enzyme (ACE) inhibitors have been used in the management of HFrEF for nearly 25 years.6, 7 As evident in the Cooperative North Scandinavian Enalapril Survival Study (CONSENSUS) trial, long-term treatment with enalapril decreased the relative risk of death by 16% among patients with mild-to-moderate symptoms.7 Sacubitril/valsartan, an angiotensin receptor neprilysin inhibitor (ARNI) previously known as LCZ696, is a novel oral agent, shown to reduce cardiovascular death (16%) and HF hospitalization (21%) in addition to improvement in quality of life (QOL) as reported in the PARADIGM-HF trial (Prospective Comparison of ARNI With ACEI to Determine Impact on Global Mortality and Morbidity in Heart Failure) compared with enalapril.8, 9 As a result, in July 2015, sacubitril-valsartan was approved by the U.S. Food and Drug Administration (FDA) and the European Medicines Agency for patients with New York Heart Association (NYHA) functional class II to IV HFrEF based on the results of the PARADIGM-HF trial.
Cost-effectiveness analyses (CEAs) and the resulting incremental cost-effectiveness ratio (ICERs), defined as cost per quality-adjusted life-year (QALY), have been commonly used to guide decisions on resource allocation in the health system and to compare the effectiveness of health interventions.10 Since the current cornerstone of HFrEF pharmacotherapy revolves around low-cost generic medications such as ACEIs (Enalapril= $280 per year) and beta-blockers (BBs), it is unclear whether the cost of sacubitril-valsartan ($4,560 per year in the US) will influence its clinical utility.
Given the limited healthcare budgets, evidence-based cost-effectiveness studies need to support and inform healthcare decision and policy-makers. Within this context, this study aimed to systematically collect and synthesize economic evidence in terms of quality-adjusted life-years (QALYs) gained, deaths from cardiovascular causes and hospital admissions, the direct medical costs, and the cost-effectiveness of sacubitril/valsartan compared with enalapril in patients with HFrEF.
Methods
Identification of studies
A systematic literature search was conducted searching in PubMed/MEDLINE, Scopus, Web of Science Core Collection, Embase and NHS Economic Evaluation Database (NHS EED) and the Health Technology Assessment (HTA) database from inception to January 1, 2021. All relevant full economic evaluation studies of sacubitril/valsartan versus enalapril for the treatment of patients with HFrEF were identified using ad hoc search strategies. Separate search strategies were developed for each database (Supplementary data). The reference lists of eligible articles were hand searched to find additional relevant studies. The following search terms were included: Valsartan; “sacubitril-valsartan”; “hydrochlorothiazide plus valsartan”; “amlodipine plus valsartan”; cost*; economic*; “cost-benefit analysis”; “cost-effectiveness analysis”; and “cost-utility analysis”.
Eligibility Criteria
The “Patients, Intervention, Comparator, Outcomes and Study design” (PICOS) criteria are described below.
Patients: HFrEF patients;
Intervention: Sacubitril/valsartan;
Comparator: Enalapril;
Outcomes: Mortality, hospital admissions, Quality-Adjusted Life Years (QALYs), Life years gain (LYQs), annual drug costs, total lifetime costs, Incremental Cost-Effectiveness Ratio (ICER), costs per QALYs, costs per LYGs, and Net Monetary Benefit (NMB);
Study design: Model-based or trial-based full economic evaluations (Cost-Benefit Analysis (CBA), Cost-Effectiveness Analysis (CEA), and Cost-Utility Analysis (CUA).
Exclusion criteria
Partial evaluation studies (cost-minimization analysis, cost-of-illness (CoI) studies, cost-analysis, cost outcome descriptions, and cost descriptions;
Reviews, commentaries, letters to the editors, editorials, protocols, abstracts;
Non-English language full-text studies.
Selection of Studies
After removing duplicates, titles and abstracts of studies were screened independently by two authors for inclusion. Full text of selected studies were assessed by one author against the eligibility criteria and checked in an independent manner by a second author. Any disagreements were resolved by discussion. The agreement was reached on all included studies. EndNote x9 software was used for management of search results and to remove duplications.
Data extraction and quality assessment of the studies
Two reviewers (SA and JA) independently extracted data using a predefined data extraction form. Disagreements were resolved by discussion at each step. Data extraction was performed in Microsoft Excel. The following data were extracted from each study included: study/publication year, country, funding, comparators, health outcomes, perspective, time horizon, number of patients, sensitivity analysis, discount rate, included costs, type of modelling, mortality, hospital admission, QALYs, LYQs, annual cost, total lifetime cost, ICER, Threshold and Base case analysis results.
The quality of the included studies was assessed by two independent reviewers (SA and JA) using the CHEERS checklist.11, 12 Any disagreements were resolved through consensus. The CHEERS tool consisted of twenty-four items in six sections (i) title and abstract, ii) introduction, iii) methods, iv) results, v) discussion,13 and vi) other) and were scored using ‘Yes’ (reported in full), ‘No’ (not reported), and ‘Not Applicable’.
Synthesis of results
The key characteristics and results of included studies were summarized and synthesized qualitatively using tables and complemented by a narrative description and comparison of the results among studies. This study was conducted and reported in accordance with the “Preferred Reporting Items for Systematic Reviews and Meta-Analyses” (PRISMA) guidelines.14 In order to aid in comparisons across studies, cost results were converted to $US, year 2019 values.
Results
The major findings of this systematic review and study selection are outlined in the PRISMA flow chart (Figure 1). The initial search yielded a pool of 1026 articles, of which 701 unique articles were screened, and 65 full-text articles were assessed for eligibility. Finally, 15 articles were included in the review to compare sacubitril/valsartan versus enalapril in the management of HFrEF. All studies retained have a minimum number of 15 items of the CHEERS checklist (Supplementary data).
Figure 1.

Process of the systematic literature search, according to the Preferred Reporting Items for Systematic Reviews and Mete-Analyses
Table 1 summarizes characteristics of each included study. The studies were conducted in USA (n=3),15–17 Germany (n=2),18, 19 Netherlands (n=2),20, 21 Australia (n=2),22, 23 Singapore (n=1),24 UK (n=1),25 Switzerland (n=1),26 Thailand (n=1),27 Portugal (n=1)28 and South Korea (n=1).29 The key health outcomes reported in the investigations were QALYs, LYQs, mortality and hospital admissions. The discount rate in the studies was between 1.5% to 5%. Eleven studies applied the results of the PARADIGM-HF trial for modelling. All studies included direct costs such as medications and hospitalization. Three studies applied modeling time horizon between 5 and 20 years and six studies considered time horizon between 30 and 40 years. One study did not clearly state the time horizon. All studies used Markov and decision-analytical model except Ramos studies. The remaining studies (n=5) applied “lifetime” horizon. Two studies used a societal perspective. Thirteen studies chose narrower perspectives such as third-party payer (n=6), health care system (n=5) and provider (n=1). One study did not clearly report the perspective. All studies performed a sensitivity analysis to assess the robustness of their results. Sources of funding for five studies were the industry.
Table 1.
Characteristics of included studies in the review
| Study/Publication year | Country | Funding | Comparators | Health Outcomes | Perspective | Time Horizon | Number of patients | Mean age | Sensitivity analysis | Discount rate | Included Costs |
|---|---|---|---|---|---|---|---|---|---|---|---|
| Gaziano et al, 2016 | USA | - | Sacubitril/valsartan vs enalapril | QALYs, Mortality, hospital admissions | - | 30-year | PARADIGM-HF trial | 63.8 | Yes | 3% | Direct cost |
| King et al, 2016 | USA | - | Sacubitril/valsartan vs enalapril | QALYs, Mortality, hospital admissions | Third-party payer perspective | Lifetime (40 years) | PARADIGM-HF trial | 60 years | Yes | 3% | Direct cost |
| Van der Pol et al, 2017 | Netherlands | - | Sacubitril/valsartan vs enalapril | QALYs, Mortality, hospital admissions | Payer's perspective | 30-year | - | - | Yes | costs = 4% per year health outcomes= 1.5% | Direct cost |
| Lin et al, 2017 | Singapore | - | Sacubitril/valsartan vs enalapril | QALYs, Mortality, hospital admissions | Singapore healthcare payer perspective | 10 years | 1,000 66-year-old patients with HF | 66 | Yes | 3% | Direct costs |
| McMurray et al, 2017 | UK | Novartis ag | Sacubitril/valsartan vs enalapril | QALYs, Mortality, hospital admissions | Healthcare providers in the UK, Denmark and colombia | Lifetime horizon | - | - | Yes | 3.5%, 3% and 5% for the UK, Danish and Colombian | Direct cost |
| Ramos et al, 2017 | Netherlands | - | Sacubitril/valsartan vs enalapril | QALYs, hospital admissions | Societal perspective | Lifetime time horizon | PARADIGM-HF trial | 63.80 | Yes | 4% for costs and a discount rate of 1.5% for effects | Direct cost |
| Ademi et al, 2017 | Switzerland | Novartis AG | Sacubitril/valsartan vs enalapril | QALYs, hospital admissions | Swiss health care system | Lifetime time horizon | PARADIGM-HF trials: Enalapril 10 mg twice daily=4212 Sac/Val 200 mg twice daily=4187 | 63.80 | Yes | 3% | |
| Gandjour et al, 2018 | Germany | Novartis Deutschland GmbH | Sacubitril/valsartan vs enalapril | QALYs, LYQs | German social health insurance (SHI) | 36 years in the base case | PARADIGM-HF trials | 64 years | Yes | 3% | Direct cost |
| Krittayaphong et al, 2018 | Thailand | - | Sacubitril/valsartan vs enalapril | QALYs, LYQs, Mortality, hospital admissions | Healthcare perspective | - | PARADIGM-HF trial | 63.80 | Yes | 3% | Direct cost |
| Zueger et al, 2018 | USA | - | Sacubitril/valsartan vs enalapril | QALYs | US payer perspective | 5-year time horizon | PARADIGM-HF trial | 63.80 | Yes | 3% | Direct costs |
| Borges et al, 2019 | Portugal | Novartis Farma, Produtos Farmacêuticos SA | Sacubitril/valsartan vs enalapril | QALYs, LYQs | Societal perspective | A time horizon of 30-years | PARADIGM-HF trial | 63.80 | Yes | 5% | Direct costs |
| Chin et al, 2019 | Australia | - | Sacubitril/valsartan vs enalapril | QALYs, LYQs, Mortality, hospital admissions | Australian health care perspective | 20 years | PARADIGM-HF trial | 63 | Yes | 5% | Direct costs |
| Park et al, 2019 | South Korea | Novartis Korea Ltd. | Sacubitril/valsartan vs enalapril | QALYs, LYQs, Mortality, hospital admissions | health care sector perspective | Lifetime horizon | PARADIGM-HF trial | 63.8 | Yes | 5% | Direct costs |
| Perera et al, 2019 | Australia | - | Sacubitril/valsartan vs enalapril | QALYs, LYQs | Australian healthcare perspective | Lifetime time horizon | PIONEER-HF trial | 61 years | Yes | 5.0% | Direct costs |
| Van der Pol et al, 2019 | Germany | - | Sacubitril/valsartan vs enalapril | QALYs, LYQs, Mortality, hospital admissions | Perspective of the German Statutory Health Insurance | 30 years | PARADIGM-HF trial | 64 years | Yes | 3% | Direct costs |
QALY, Quality-adjusted life-year; HF, Heart failure; LYQ, Life-years gained; Y, Yes
Table 2 presents effectiveness and cost-effectiveness results. Included studies show that sacubitril/valsartan reduced mortality and hospitalization. Also, sacubitril/valsartan saved more life years and QALY in HFrEF patients. Studies showed that sacubitril/valsartan generated higher total lifetime costs. The lowest and highest lifetime costs for enalapril in comparison with sacubitril/valsartan were reported in Thailand ($529, $4,756) and Germany ($84,407, $118,815), respectively. Reports showed a different cost per QALY among various countries. The lowest ICER value was found in Thailand ($4857/QALY) and the highest in the US ($143,891 /QALY). As demonstrated, there was a wide range for annual costs of sacubitril/valsartan in different countries with the lowest cost in Thailand ($171 per year) and the highest in the US ($5,025 per year). Figure 2 shows the mean of death and hospitalization risk ratios (0.843 and 0.844, respectively).
Table 2.
Summary results of cost effectiveness parameters
| Study/year | Patient population | model | Mortality | Heart failure Hospitalization | LYQs | QALYs | Annual drug cost | Total Lifetime Cost | ICER | Threshold | Base case results |
|---|---|---|---|---|---|---|---|---|---|---|---|
| Gaziano et al, 2016 | Patients with HFrEF | Markov model | Mortality (Sacubitril/valsartan) vs enalapril= HR, 0.84 | Heart failure hospitalization (Sacubitril/valsartan) vs enalapril= HR, 0.79 | - | Enalapril= 6.02 Sacubitril/valsartan = 6.80 Incremental= 0.78 |
Enalapril= 96$ Sacubitril/valsartan =4500$ |
Enalapril= 83,303 $ per life Sacubitril/valsartan = 118,815 $ Incremental= 35,512 |
45,017$ per QALY | $150 000 per QALY | Sacubitril/valsartan is cost-effective and could lead to the prevention of thousands of premature deaths and hospitalizations for patients with heart failure. |
| King et al, 2016 | Patients with HFrEF | Markov model | Risk of CV mortality: Enalapril =1.87 Sacubitril/valsartan = 1.49 (1.49/1.87=0.79) |
Risk of HF hospitalization: Enalapril=3.44 Sacubitril-valsartan=2.62 HR=0.76 |
Enalapril= 8.4 Sacubitril/valsartan= 9.48 Incremental=1.08 |
Sacubitril/valsartan = 6.49 Enalapril=5.74 Incremental=0.75 |
Enalapril=$280 Sacubitril/valsartan=$ 4,560 |
Enalapril= $21,758 Sacubitril/valsartan= $60,391 Incremental=$38,633 |
35,879$, Per LYQs and 50,959$ per QALY | $100,000 per QALY | Sacubitril-valsartan is a cost-effective treatment option depending on the willingness-to-pay threshold. |
| van der Pol et al, 2016 | Patients with HFrEF | Markov model | Death Risk ratio (Sacubitril/valsartan compared with enalapril) =0.84 | Hospitalization Risk ratio (Sacubitril/valsartan compared with enalapril) = 0.77 | Enalapril=6.87 Sacubitril/valsartan =7.28 Incremental=0.40 |
Enalapril= 4.93 Sacubitril/valsartan = 5.22 Incremental = 0.29 |
Sacubitril/valsartan = $1,890 | Enalapril= €12,358 (13,747$) Sacubitril/valsartan = €17,918 (19,889$) Incremental= €5,560 |
€19,113 (21,215$) | €20,000(22,000$) and €50,000(55,000$) per QALY | Sacubitril/valsartan can be considered a cost-effective treatment at a daily price of €5.25. |
| Lin et al, 2017 | Patients with HFrEF | Markov model | CV deaths 10 years: Enalapril=426 Sacubitril/valsartan =361 Difference=–65 (361/426= 0.84) |
Hospitalisation for HF in 1000 patients: Enalapril=306 Sacubitril/valsartan =269 Difference=–37 HR==0.88 |
- | Enalapril=3.29 Sacubitril/valsartan =3.50 Incremental QALYs=0.21 |
Enalapril= $54 Sac/Val = $2,397 |
Enalapril= 2,197(SGD (1,625$)) Sacubitril/valsartan = 17,857(SGD (13,214$)) Incremental cost=15,660 |
74,592(SGD/QALY gained) (55,198$) | SGD 20,000(14800$) and SGD 100,000(74,000$) per QALY | Sacubitril/valsartan may not represent good value for limited health care dollars at its current price of SGD 9.00/day. |
| McMurray et al, 2017 | Patients with HFrEF | A decision analytic model | All-cause mortality (%) at year 5 UK: Enalapril=38% Sacubitril/valsartan =33% Difference=–0.05(33%/38%=0.86) Denmark: Enalapril=44% Sacubitril/valsartan =40% Difference=–0.04(40%/44%=0.90.9) Colombia: Enalapril=40% Sacubitril/valsartan =36% Difference=–0.04(36%/40%=0.9) |
Number of HF hospitalizations per patient UK: Enalapril=0.89 Sacubitril/valsartan =0.84 Difference=–0.05 HR= 0.94) Denmark: Enalapril=0.82 Sacubitril/valsartan =0.76 Difference=–0.05 HR= 0.92 Colombia: Enalapril=0.85 Sacubitril/valsartan =0.79 Difference=–0.05 HR= 0.93 |
- | UK: Enalapril=5.06 Sacubitril/valsartan = 5.58 Incremental= 0.52 Denmark: Enalapril=4.81 Sacubitril/valsartan = 5.27 Incremental=0.47 Colombia: Enalapril=4.52 Sacubitril/valsartan = 4.95 Incremental=0.42 |
- | UK(GBP): Enalapril= 14,814 (19,110$) Sacubitril/valsartan = 23,720 (30,598$) Incremental= 8906 Denmark (DKK): Enalapril= 145,346 (21,511$) Sacubitril/valsartan = 226 330 (33,496$) Incremental= 80 984 Colombia (COP): Enalapril= 29,284, 724 (8,785$) Sacubitril/valsartan = 4, 008 231(13,360) Incremental= 16 723 507 |
UK (GBP)= 17, 134(22,103$) Denmark (DKK)= 173, 994(25,751$) Colombia (COP)= 39, 522, 754(11,856$) |
UK: £20, 000 (EUR 23,862) £30 000 (EUR 35, 793) Denmark: Kr250, 000 (EUR 33, 624) Colombian: OP$52.4 million (EUR 15 975) |
in all three countries, sacubitril/valsartan is likely to be cost-effective compared with an ACEI (the current standard of care) in patients with HFrEF. |
| Ramos et al, 2017 | Chronic Heart Failure and Reduced Ejection Fraction | - | - | Heart failure hospitalizations hazard ratio: Enalapril=0.88 Sacubitril/valsartan =0.85 Difference= –0.03 HR= 0.96 |
Enalapril=5.28 Sacubitril/valsartan= 5.67 Incremental=0.39 |
Enalapril=4.06 Sacubitril/valsartan =4.39 Incremental=0.33 |
Enalapril= €368 Sacubitril/valsartan =€1440 |
Enalapril= €16,001 (17,761$) Sacubitril/valsartan = €21,840 (24,242$) Incremental= €5,839 |
€17,600 | €50,000 per QALY | Sacubitril/valsartan is cost effective compared with enalapril. |
| Ademi et al, 2017 | Patients with HFrEF | Markov model | - | Enalapril= 35 797 Sacubitril/valsartan = 32 857 Difference= −2940 HR= 0.91 |
Enalapril=6.17 Sacubitril/Valsartan=6.67 Incremental=0.50 |
Enalapril=4.56 Sacubitril/valsartan =4.99 Incremental=0.42 |
Sac/Val = $2,126 | Enalapril= 53,479 CHF (54,548$) Sacubitril/valsartan = 69,683 CHF (71,076$) Incremental= 10 926 |
25 684 CHF | 50,000 CHF per QALY | The treatment of HFrEF patients with Sacubitril/valsartan versus enalapril is cost effective. |
| Gandjour et al, 2018 | Patients with HFrEF | Markov model | - | - | Enalapril=7.18 Sacubitril/valsartan = 8.04 Incremental=0.86 |
Enalapril=5.40 Sac/Val = 6.16 Incremental=0.76 |
sacubitril/valsartan= $2,110 | Total lifetime costs (€): Enalapril= 76,043 (84,407$) Sacubitril/valsartan = 96,194 (106,775$) Incremental=20,151 |
cost (€) per QALY. 26,278, cost (€) per life-year gained 23,401 |
€30,000 per QALY | The treatment of HFrEF patients with Sacubitril/valsartan versus enalapril is cost effective. |
| Krittayaphong et al, 2018 | Patients with HFrEF | An analytical decision model | Death (per cohort of 1000 per year). Cardiovascular death: Enalapril=687 Sacubitril/valsartan =618 Incremental= –69 HR= 0.89 |
Number of events (per cohort of 1000 per year): Enalapril=101 Sacubitril/valsartan =69 Incremental= –51 HR= 0.68 |
Enalapril= 8.36 Sacubitril/valsartan = 9.21 Incremental=0.85 |
Enalapril= 6.90 Sacubitril/valsartan = 7.69 Incremental=0.79 |
Enalapril= $0.75 Sacubitril/valsartan = $171 |
Total cost (THB): Enalapril= 16,048 ($529) Sacubitril/valsartan = 144,146 ($4,756) Incremental= $4,227 |
162,276 THB/QALY (4857.11$US/QALY). 151,233 THB/life-year (4526.57 $US/life-year) |
160,000 THB per QALY (4,789$) or about 1.2 times per capita gross national income | At its current price in Thailand, Sacubitril/valsartan may not represent good value for the ntions's limited healthcare resources. The cost of sacubitril-valsartan needs to reduce by approximately 2% to yield an ICER below the threshold. |
| Zueger et al, 2018 | Patients with HFrEF | Markov model | - | - | - | Enalapril= 2.546 Sacubitril/valsartan = 2.647 Incremental=0.10 |
Enalapril= $714 Sacubitril/valsartan = $5,025 |
Enalapril= $67,287 Sacubitril/valsartan = $81,943 Incremental= $14,655 |
$143,891 $/QALY | $100,000/QALY | Sacubitril/Valsartan is not cost effective compared with enalapril. |
| Borges et al, 2019 | Patients with HFrEF | Markov model | - | - | Enalapril= 6.19 Sacubitril/valsartan = 6.71 Incremental= 0.52 |
Enalapril= 4.65 Sacubitril/valsartan = 5.09 Incremental= 0.44 |
- | Enalapril= 9,928 € (11,020$) Sacubitril/valsartan = 19,949 € (22,143$) Incremental= 10,021 € |
22,702 €/QALY | 30,000 €/QALY | Sacubitril/valsartan is a cost-effective therapeutic option in the treatment of Portuguese patients with HFrEF and translate into significant health gains and increased life expectancy versus the current standard of care. |
| Chin et al, 2019 | Patients with HFrEF | Markov model | CV deaths Enalapril= 7.3% Sac/Val = 5.9% HR= 0.8 |
HF hospitalization Enalapril= 6.9% Sac/Val = 5.7% HR= 0.82 |
Enalapril=5.81 Sacubitril/valsartan =6.42 Incremental=0.61 |
Enalapril=4.01 Sacubitril/valsartan =4.43 Incremental=0.42 |
Enalapril = $252 Sacubitril/valsartan = $1,873 |
Enalapril= $10,056 Sacubitril/valsartan = $24,909 Incremental= $14,852 |
$27,954 per YoLS, $40,513 per QALY | A$50,000 per QALY | Sacubitril/Valsartan is cost effective compared with enalapril. |
| Park et al, 2019 | Chronic Heart Failure and Reduced Ejection Fraction | Markov model | HR=0.77 | Monthly probability of hospitalization: Enalapril=3.53% Sac/Val = 2.96% HR= 0.83 |
Enalapril= 6.02 Sacubitril/valsartan = 6.70 Incremental=0.68 |
Enalapril= 5.15 Sacubitril/valsartan = 5.74 Incremental=0.59 |
Enalapril= $323 Sacubitril/valsartan = $1,446 |
Enalapril= $18,295 Sacubitril/valsartan = $25,831 Incremental= 7,536.4 |
11,130.1 $ Per life year gained. 12,721.9 Per QALY gained |
$20,000 | Sacubitril/valsartan is a cost-effective treatment for HFrEF compared with enalapril. |
| Perera et al, 2019 | Acute decompensated heart failure | Markov model | - | - | Enalapril= 3.34 Sacubitril/valsartan = 3.47 Incremental=0.12 |
Enalapril= 2.49 Sacubitril/Valsartan= 2.58 Incremental=0.09 |
Enalapril= $250 Sacubitril/valsartan = $1,809 |
Enalapril= $17,589 Sacubitril/valsartan =$25,053 Incremental= $7,464 |
$58,629 per life year gained, $77,889 per QALY | AU$50,000 per QALY | At its current acquisition price, sacubitril-valsartan in comparison to enalapril is not likely to be cost effective in the management of acute decompensated heart failure in Australia. A price reduction of more than 25% would confer cost-effectiveness. |
| Van der Pol et al, 2019 | Patients with HFrEF | Markov model | - | Hospitalizations per 10 000 patients: Enalapril= 10 192 Sacubitril/valsartan = 8121 Incremental=2071 HR= 0.79 |
Enalapril= 6.30 Sacubitril/valsartan = 7.24 Incremental=0.94 |
Enalapril=4.90 Sacubitril/valsartan =5.71 Incremental=0.81 |
Sacubitril/valsartan = $2,613 | Enalapril= €7,329 (8,136$) Sacubitril/valsartan = €23,114 (25,657$) Incremental= €14,978 |
€19 300 per QALY | €18,250 per QALY | Sacubitril/valsartan can be considered cost-effective at current price in Germany. |
HFrEF, Heart Failure reduced Ejection Fraction; HR, Hazard ratio; LYQ, Life-years gained; QALY, Quality-adjusted life-year; ICER, Incremental cost-effectiveness ratio
Figure 2.
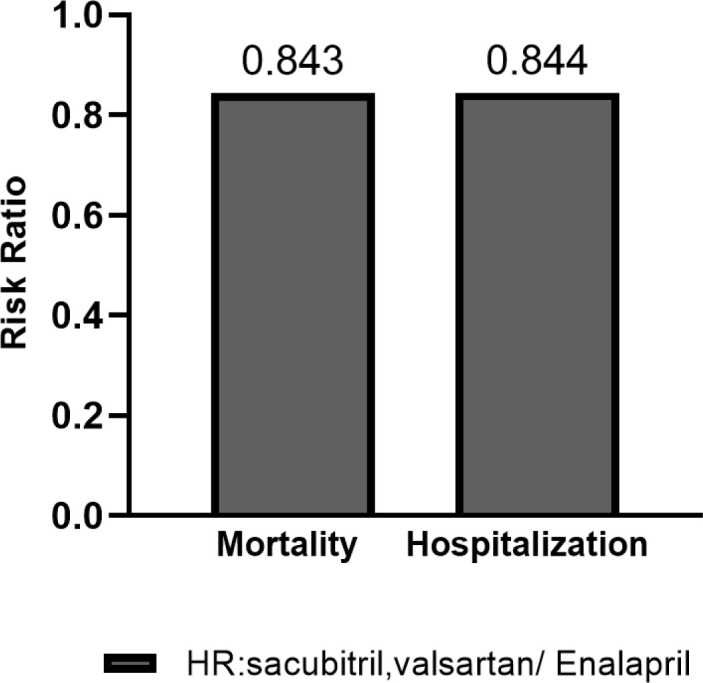
Mean of death and hospitalization Risk ratio
Discussion
Our systematic review and economic evaluation have identified four important findings, as follows:
Risk of mortality and hospitalization in Sacubitril/valsartan and Enalapril;
QALYs and LYQs in Sacubitril/valsartan vs Enalapril;
Annual and total lifetime costs;
ICER and Threshold to evaluate the cost-effectiveness of Sacubitril/valsartan.
Risk of mortality and hospitalization in Sacubitril/valsartan and Enalapril
All 15 studies included demonstrated that Sacubitril/valsartan reduces cardiovascular death and HF hospitalization. Figure 2 showed that mean values of mortality and hospitalization risk in Sacubitril-valsartan /Enalapril were 0.843 and 0.844, respectively. The most significant reduction in mortality was demonstrated in Park et al study29 (hazard ratio or HR=0.77) and the least one in McMurray et al study25 (Denmark, HR=0.90. 9). These results are in line with the PARADIGM-HF trial, which has randomized 8,399 patients with HFrEF and NYHA class II-IV symptoms to the ARNI LCZ696 (sacubitril) 200 mg or enalapril 10 mg. The PARADIGM-HF trial showed that the HRs of cardiovascular death and hospitalization were 0.80 and 0.79, respectively.8 Altogether, this suggests that the sacubitril/valsartan could lead to the prevention of thousands of premature deaths and hospitalizations for patients with HFrEF globally. For this reason, the FDA fast-tracked the Sacubitril/valsartan combination pill for approval in July 2015.
QALYs and LYQs in Sacubitril/valsartan vs Enalapril
QALY and LYQs are effectiveness measures commonly utilized in economic evaluation studies. Table 2 shows that Sacubitril/valsartan generated more QALY and LYQs than enalapril, in all studies. The decline in mortality and hospitalization rates in Sacubitril/valsartan versus enalapril, probably is one of the reasons for the increase in LYQs and QALYs. Figure 3 shows the mean values of the QALY for Sacubitril/valsartan and enalapril were 5.12 and 4.64, respectively. Moreover, LYQs were 6.97 and 6.35 in Sacubitril/valsartan and enalapril, respectively. The low QALY and LYQ in Perera et al30 study could be explained by different patient's population compared with other studies (acute HF versus chronic HF).
Figure 3.

Mean of LYQs and QALYs in studies
Annual and total lifetime costs
The highest annual price ratio (cost of Sacubitril-valsartan / enalapril) was reported in Thailand (228 times) and the lowest price ratio in Netherlands and Korea (4 times). Studies show that the new drug was far more expensive than the old one. The mean values of annual costs for Sacubitril-valsartan and enalapril were $2460 and $259, respectively (annual price ratio in Sacubitril-valsartan /enalapril= 9.5 times). As demonstrated in figure 4, the highest lifetime cost was reported in the US ($129,746 for Sacubitril/valsartan and $91,027 for enalapril) and the least in Thailand ($4,898 for Sacubitril/valsartan and $545 for enalapril). The mean values of lifetime cost in studies for Sacubitril/valsartan and enalapril were $43,498 and $28,467, respectively (total lifetime price ratio in Sacubitril-valsartan /enalapril= 1.5 times). These results showed that, despite the large differences in the annual cost of Sacubitril/valsartan vs enalapril, there is much less difference in lifetime costs, which can be explained by reduced hospitalization and mortality for Sacubitril/valsartan.
Figure 4.

Total lifetime cost Sacubitril/valsartan and enalapril in studies
ICER and Threshold to evaluate the cost-effectiveness of Sacubitril/valsartan
An ICER is calculated by dividing the difference in total costs (incremental cost) by the difference in the chosen measure of health outcome or effect (incremental effect) to provide a ratio of the ‘extra cost per extra unit of health effect’ – for the most expensive therapy vs its alternative/competitor.31 The cost-effectiveness threshold is the maximum amount a decision-maker is willing to pay for a unit of health outcome. If the cost-effectiveness (ICER) of a new therapy (compared with a relevant alternative) is estimated to be below the threshold, then (other things being equal) it is likely that the decision-maker will recommend the new therapy.32
The threshold spectrum in US in three studies ranged from $100,000 to $150,000. In Gaziano et al and King et al studies threshold was more than ICER (ICER:45,017$ and $50,959 per QALY, in threshold $150,000 and $100,000, respectively) and in Zueger et al study ICER was more than threshold ($143,891 vs $100,000 per QALY). This difference in ICER could be due to different incremental QALY in these studies. Incremental QALY in Gaziano et al and King et al studies were 0.78 and 0.75 respectively and in Zueger was 0.10. Maximum threshold, i.e., $150,000 could increase the chance of being cost-effective option for Sacubitril/valsartan. In studies conducted in the Netherlands, the ICER was lower than threshold (threshold was €20,000 and €50,000, and the ICER was €17,600 € and 19,113). Accordingly, Sacubitril/valsartan is cost effectiveness in the Netherlands and threshold of €50,000 could probably be more cost effective.
In Singapore, ICER is $54,700 / QALY and threshold is $14,600 and $73,300; data shows that in current price (SGD 9.00/day or $6.6/day) lower QALY and high annual and total lifetime cost probably make Sac/Val being not cost effective in Singapore. Studies done in Germany had diversity in results, in Gandjour et al study, ICER was lower than threshold (€26,278 vs €30,000 per QALY) and in Van der Pol study, ICER was more than threshold (€19 300 vs 18,250 per QALY). The higher ICER to threshold in Van der Pol et al study could explain the higher cost of Sacubitril/valsartan comparing to Gandjour et al study (€6.66 vs €5.33). However, since ICER values were near the threshold, Sacubitril/valsartan can be considered cost effective at current price in Germany. Chin and Perera et al study results were opposed to each other. The reason for this difference could be explained by lower QALY in acute (Perera et al) vs chronic (Chin et al) HF for Sacubitril/valsartan.
As demonstrated in Krittayaphong et al study in Thailand,33 the ICER was higher than threshold (162,276 vs 160,000 THB/QALY) and at its current price, Sacubitril/valsartan may not be cost-effective. Low threshold and limited healthcare resources in developing countries such as Thailand can make it not cost-effective. However, to make sacubitril/valsartan cost-effective, a reduction in cost to yield an ICER below the threshold is needed.
Studies conducted in UK, Denmark, Colombia, Portugal and South Korea25 showed that in all five countries, threshold was upper than ICER and sacubitril/valsartan was likely to be cost-effective compared with the current standard of care in patients with HFrEF, which could be attributed to higher threshold compared to developing countries such as Thailand. As a result, a high threshold is an important factor to make sacubitril/valsartan cost-effective.
Compared to the previous two review studies34 (Proudfoot C, Gautam R, Cristino J, Agrawal R, Thakur L, Tolley K. Model parameters influencing the cost-effectiveness of sacubitril/valsartan in heart failure: evidence from a systematic literature review. Eur J Health Econ. 2022 Jul 5.), the present study included 30% more articles compared to the study by Liu et al. and compared to the study by Proudfoot et al., included only full economic evaluation and model-based studies; Partial economic evaluations studies, conference abstracts have been excluded.
This study has some limitations. Effectiveness data of the majority studies was drawn from a single trial (PARADIGM-HF). It seems that the effectiveness measures and the results of the studies in the included studies are influenced by the trial data. We also excluded abstracts because there was not enough information. Our study compared findings from studies conducted in a variety of countries with different health systems. Theses difference are likely to have affected results of the included analyses. Health system characteristics such as reimbursement policies, prescribing patterns, and country-specific cost-effectiveness thresholds should be considered when interpreting and generalizing the findings.
Conclusion
Our study shows that in current acquisition price sacubitril-valsartan in western countries compared to enalapril is likely to be cost-effective for the management of HFrEF. However, in Asian countries such as Singapore and Thailand, the cost of sacubitril-valsartan needs to be reduced to yield an ICER below the threshold.
Acknowledgments
This study is an extract from the research project which has been conducted and supported at the Research Center for Emergency and Disaster Resilience, Red Crescent Society of the Islamic Republic of Iran, Tehran, Iran. We would like to thank all who helped us through writing the article.
Notes:
This paper should be cited as: Rezapour A, Azari S, Arabloo J, Kolivand P, Behzadifar M, Omidi N, et al. Cost-Effectiveness of Sacubitril/Valsartan Compared with Enalapril in Patients with Heart Failure with Reduced Ejection Fraction: A Systematic Review. J Teh Univ Heart Ctr 2022;17(4):168-179.
Supplements
Table 3.
Supplementary data
A. Search strategies and results for selected databases
| Database | Date conducted | Search strategy | Results |
|---|---|---|---|
| PubMed | January 1, 2020 | (“Valsartan”[Mesh] OR “sacubitril-valsartan” [Supplementary Concept] OR sacubitril [tiab] OR valsartan [tiab]) AND (“cost-benefit analysis” [MeSH] OR “cost-utility analysis” OR “cost-effectiveness analysis” OR economics [mesh] OR Cost* [tiab] OR Economic*[tiab]) | 151 |
| Embase | January 1, 2020 | (‘sacubitril’/exp OR sacubitril OR ‘sacubitrilat’/exp OR sacubitrilat OR ‘sacubitril plus valsartan’/exp OR ‘hydrochloro-thiazide plus valsartan’/exp OR ‘hydrochlorothiazide plus valsartan’ OR ‘amlodipine plus valsartan’/exp OR ‘am-lodipine plus valsartan’ OR ‘valsartan’/exp OR valsartan) AND (‘cost benefit analysis’/exp OR ‘cost benefit analysis’ OR ‘cost effectiveness analysis’/exp OR ‘cost effectiveness analysis’ OR ‘cost utility analysis’/exp OR ‘cost utility analysis’ OR economic*:ab,ti) | 530 |
| Web of Science | January 1, 2020 | TS=(( sacubitril OR “sacubitril-valsartan” OR “sacubitril/valsartan” OR valsartan) AND (cost* OR Economic* OR “cost-benefit analysis” OR “cost benefit analysis” OR “cost effectiveness analysis” OR “cost-effectiveness analysis” OR “cost utility analysis” OR “cost-utility analysis”)) | 229 |
| Scopus | January 1, 2020 | Timespan: All years. Indexes: SCI-EXPANDED, SSCI, A&HCI, ESCI. | 103 |
| NHS Economic Evaluation Database(NHS EED) and the health technology assessment | January 1, 2020 | TITLE-ABS-KEY (sacubitril OR “sacubitril-valsartan” OR valsartan) AND TITLE-ABS-KEY ( “cost benefit analysis” OR “cost-benefit analysis” OR “cost-effectiveness analysis” OR “cost effectiveness analysis” OR “cost utility analysis” OR “cost-utility analysis” OR cost*OR economic*) | 13 |
| Total | MeSH DESCRIPTOR valsartan EXPLODE ALL TREES IN NHSEED,HTA | 1026 | |
| Total with duplicates removed | 703 |
Table 4.
Supplementary data
B. Quality of reporting of included studies using CHEERS checklist
| Section/item | Item No | Gaziano, 2016 | King, 2016 | van der Pol, 2016 | Lin, 2017 | McMurray, 2017 | Ramos, 2017 | Ademi, 2017 | Gandjour, 2018 | Krittayaphong, 2018 | Zueger, 2018 | Borges, 2019 | Chin, 2019 | Park, 2019 | Perera, 2 019 | van der Pol, 2019 |
|---|---|---|---|---|---|---|---|---|---|---|---|---|---|---|---|---|
| Title and abstract | ||||||||||||||||
| Title | 1 | Y | Y | Y | Y | Y | Y | Y | Y | Y | Y | Y | Y | Y | Y | Y |
| Abstract | 2 | Y | Y | Y | Y | Y | Y | Y | Y | Y | Y | Y | Y | Y | Y | Y |
| Introduction | ||||||||||||||||
| Background and objectives | 3 | Y | Y | Y | Y | Y | Y | Y | Y | Y | Y | Y | Y | Y | Y | Y |
| Methods | ||||||||||||||||
| Target population and subgroups | 4 | Y | Y | - | Y | Y | Y | Y | Y | Y | Y | Y | Y | Y | Y | Y |
| Setting and location | 5 | Y | - | Y | Y | Y | Y | Y | Y | Y | Y | Y | Y | Y | Y | Y |
| Study perspective | 6 | N | Y | Y | Y | Y | Y | Y | Y | Y | Y | Y | Y | Y | Y | Y |
| Comparators | 7 | Y | Y | Y | Y | Y | Y | Y | Y | Y | Y | Y | Y | Y | Y | Y |
| Time horizon | 8 | Y | Y | Y | Y | Y | Y | Y | Y | N | Y | Y | Y | Y | Y | Y |
| Discount rate | 9 | Y | Y | Y | Y | Y | Y | Y | Y | Y | Y | Y | Y | Y | Y | Y |
| Choice of health outcomes | 10 | Y | Y | Y | Y | Y | Y | Y | Y | Y | Y | Y | Y | Y | Y | Y |
| Measurement of effectiveness | 11a | Y | Y | Y | - | Y | Y | Y | Y | Y | Y | Y | Y | Y | Y | Y |
| 11b | - | Y | Y | Y | Y | N | Y | Y | Y | Y | Y | Y | Y | Y | Y | |
| Measurement and valuation of preference based outcomes | 12 | Y | - | Y | Y | Y | Y | Y | Y | Y | Y | Y | Y | Y | Y | Y |
| Estimating resources and costs | 13a | Y | - | Y | Y | Y | Y | Y | Y | Y | Y | Y | Y | Y | Y | Y |
| 13b | Y | Y | Y | Y | Y | Y | Y | Y | Y | Y | Y | Y | Y | Y | Y | |
| Currency, price date, and conversion | 14 | Y | Y | Y | Y | Y | N | Y | Y | Y | Y | Y | Y | Y | Y | Y |
| Choice of model | 15 | Y | - | Y | Y | Y | N | Y | Y | Y | Y | Y | Y | Y | Y | Y |
| Assumptions | 16 | Y | Y | Y | Y | Y | Y | Y | Y | - | Y | Y | Y | Y | Y | |
| Analytical methods | 17 | Y | Y | - | Y | Y | Y | Y | Y | Y | Y | Y | Y | Y | Y | Y |
| Results | ||||||||||||||||
| Study parameters | 18 | Y | Y | Y | Y | Y | Y | Y | Y | Y | Y | Y | Y | Y | Y | Y |
| Incremental costs and outcomes | 19 | Y | Y | Y | Y | Y | Y | Y | Y | Y | Y | Y | Y | Y | Y | Y |
| Characterising uncertainty | 20a | Y | Y | Y | Y | Y | Y | Y | Y | Y | Y | Y | Y | Y | Y | Y |
| 20b | Y | Y | Y | Y | Y | - | Y | Y | Y | Y | Y | Y | Y | Y | Y | |
| Characterising heterogeneity | 21 | N | N | N | Y | - | N | Y | N | N | Y | Y | N | N | N | N |
| Discussion | ||||||||||||||||
| Study findings, limitations, generalisability, and current knowledge | 22 | Y | Y | Y | Y | Y | Y | Y | Y | Y | Y | Y | Y | Y | Y | Y |
| Other | ||||||||||||||||
| Source of funding | 23 | N | Y | Y | Y | Y | Y | Y | Y | Y | Y | Y | Y | Y | Y | Y |
| Conflicts of interest | 24 | Y | Y | Y | N | Y | N | N | N | Y | Y | Y | Y | Y | Y | Y |
References
- 1. Mozaffarian D, Benjamin EJ, Go AS, Arnett DK, Blaha MJ, Cushman M, de Ferranti S, Després JP, Fullerton HJ, Howard VJ, Huffman MD, Judd SE, Kissela BM, Lackland DT, Lichtman JH, Lisabeth LD, Liu S, Mackey RH, Matchar DB, McGuire DK, Mohler ER, 3rd, Moy CS, Muntner P, Mussolino ME, Nasir K, Neumar RW, Nichol G, Palaniappan L, Pandey DK, Reeves MJ, Rodriguez CJ, Sorlie PD, Stein J, Towfighi A, Turan TN, Virani SS, Willey JZ, Woo D, Yeh RW, Turner MB, American Heart Association Statistics Committee and Stroke Statistics Subcommittee . Heart disease and stroke statistics--2015 update: a report from the American Heart Association. Circulation 2015; 131: e29– 322. [DOI] [PubMed] [Google Scholar]
- 2. Roger VL. Epidemiology of heart failure. Circ Res 2013; 113: 646– 659. [DOI] [PMC free article] [PubMed] [Google Scholar]
- 3. Heidenreich PA, Trogdon JG, Khavjou OA, Butler J, Dracup K, Ezekowitz MD, Finkelstein EA, Hong Y, Johnston SC, Khera A, Lloyd-Jones DM, Nelson SA, Nichol G, Orenstein D, Wilson PW, Woo YJ, American Heart Association Advocacy Coordinating Committee; Stroke Council; Council on Cardiovascular Radiology and Intervention; Council on Clinical Cardiology; Council on Epidemiology and Prevention; Council on Arteriosclerosis; Thrombosis and Vascular Biology; Council on Cardiopulmonary; Critical Care; Perioperative and Resuscitation; Council on Cardiovascular Nursing; Council on the Kidney in Cardiovascular Disease; Council on Cardiovascular Surgery and Anesthesia, and Interdisciplinary Council on Quality of Care and Outcomes Research . Forecasting the future of cardiovascular disease in the United States: a policy statement from the American Heart Association. Circulation 2011; 123: 933– 944. [DOI] [PubMed] [Google Scholar]
- 4. Bui AL, Horwich TB, Fonarow GC. Epidemiology and risk profile of heart failure. Nat Rev Cardiol 2011; 8: 30– 41. [DOI] [PMC free article] [PubMed] [Google Scholar]
- 5. Stewart S, Jenkins A, Buchan S, McGuire A, Capewell S, McMurray JJ. The current cost of heart failure to the National Health Service in the UK. Eur J Heart Fail 2002; 4: 361– 371. [DOI] [PubMed] [Google Scholar]
- 6. Swedberg K, Kjekshus J. Effects of enalapril on mortality in severe congestive heart failure: results of the Cooperative North Scandinavian Enalapril Survival Study (CONSENSUS). Am J Cardiol 1988; 62: 60A– 66A. [DOI] [PubMed] [Google Scholar]
- 7. SOLVD Investigators. Yusuf S, Pitt B, Davis CE, Hood WB, Cohn JN. Effect of enalapril on survival in patients with reduced left ventricular ejection fractions and congestive heart failure. N Engl J Med 1991; 325: 293– 302. [DOI] [PubMed] [Google Scholar]
- 8. McMurray JJ, Packer M, Desai AS, Gong J, Lefkowitz MP, Rizkala AR, Rouleau JL, Shi VC, Solomon SD, Swedberg K, Zile MR, PARADIGM-HF Investigators and Committees . Angiotensin-neprilysin inhibition versus enalapril in heart failure. N Engl J Med 2014; 371: 993– 1004. [DOI] [PubMed] [Google Scholar]
- 9. Ponikowski P, Voors AA, Anker SD, Bueno H, Cleland JG, Coats AJ, Falk V, González-Juanatey JR, Harjola VP, Jankowska EA, Jessup M, Linde C, Nihoyannopoulos P, Parissis JT, Pieske B, Riley JP, Rosano GM, Ruilope LM, Ruschitzka F, Rutten FH, van der Meer P, Authors/Task Force Members; Document Reviewers . 2016 ESC Guidelines for the diagnosis and treatment of acute and chronic heart failure: The Task Force for the diagnosis and treatment of acute and chronic heart failure of the European Society of Cardiology (ESC). Developed with the special contribution of the Heart Failure Association (HFA) of the ESC. Eur J Heart Fail 2016; 18: 891– 975. [DOI] [PubMed] [Google Scholar]
- 10. Cristino J, Tang I, Ng C, Tan J, Trueman D, Lee D. RE: Cost-effectiveness of sacubitril/valsartan versus enalapril in patients with heart failure and reduced ejection fraction. J Med Econ 2018; 21: 1145– 1147. [DOI] [PubMed] [Google Scholar]
- 11. Husereau D, Drummond M, Petrou S, Carswell C, Moher D, Greenberg D, Augustovski F, Briggs AH, Mauskopf J, Loder E, CHEERS Task Force . Consolidated Health Economic Evaluation Reporting Standards (CHEERS) statement. Cost Eff Resour Alloc 2013; 11: 6. [DOI] [PMC free article] [PubMed] [Google Scholar]
- 12. Husereau D, Drummond M, Petrou S, Carswell C, Moher D, Greenberg D, Augustovski F, Briggs AH, Mauskopf J, Loder E, ISPOR Health Economic Evaluation Publication Guidelines-CHEERS Good Reporting Practices Task Force . Consolidated Health Economic Evaluation Reporting Standards (CHEERS)--explanation and elaboration: a report of the ISPOR Health Economic Evaluation Publication Guidelines Good Reporting Practices Task Force. Value Health 2013; 16: 231– 250. [DOI] [PubMed] [Google Scholar]
- 13. Hiligsmann M, Evers SM, Ben Sedrine W, Kanis JA, Ramaekers B, Reginster JY, Silverman S, Wyers CE, Boonen A. A systematic review of cost-effectiveness analyses of drugs for postmenopausal osteoporosis. Pharmacoeconomics 2015; 33: 205– 224. [DOI] [PubMed] [Google Scholar]
- 14. Moher D, Liberati A, Tetzlaff J, Altman DG, PRISMA Group . Preferred reporting items for systematic reviews and meta-analyses: the PRISMA statement. Ann Intern Med 2009; 151: 264– 9, W64. [DOI] [PubMed] [Google Scholar]
- 15. Gaziano TA, Fonarow GC, Claggett B, Chan WW, Deschaseaux-Voinet C, Turner SJ, Rouleau JL, Zile MR, McMurray JJ, Solomon SD. Cost-effectiveness Analysis of Sacubitril/Valsartan vs Enalapril in Patients With Heart Failure and Reduced Ejection Fraction. JAMA Cardiol 2016; 1: 666– 672. [DOI] [PubMed] [Google Scholar]
- 16. King JB, Shah RU, Bress AP, Nelson RE, Bellows BK. Cost-Effectiveness of Sacubitril-Valsartan Combination Therapy Compared With Enalapril for the Treatment of Heart Failure With Reduced Ejection Fraction. JACC Heart Fail 2016; 4: 392– 402. [DOI] [PubMed] [Google Scholar]
- 17. Zueger PM, Kumar VM, Harrington RL, Rigoni GC, Atwood A, DiDomenico RJ, Touchette DR. Cost-Effectiveness Analysis of Sacubitril/Valsartan for the Treatment of Heart Failure with Reduced Ejection Fraction in the United States. Pharmacotherapy 2018; 38: 520– 530. [DOI] [PubMed] [Google Scholar]
- 18. Gandjour A, Ostwald DA. Sacubitril/Valsartan (LCZ696): A Novel Treatment for Heart Failure and its Estimated Cost Effectiveness, Budget Impact, and Disease Burden Reduction in Germany. Pharmacoeconomics 2018; 36: 1285– 1296. [DOI] [PubMed] [Google Scholar]
- 19. van der Pol S, de Jong LA, Vemer P, Jansen DEMC, Postma MJ. Cost-Effectiveness of Sacubitril/Valsartan in Germany: An Application of the Efficiency Frontier. Value Health 2019; 22: 1119– 1127. [DOI] [PubMed] [Google Scholar]
- 20. van der Pol S, Degener F, Postma MJ, Vemer P. An Economic Evaluation of Sacubitril/Valsartan for Heart Failure Patients in the Netherlands. Value Health 2017; 20: 388– 396. [DOI] [PubMed] [Google Scholar]
- 21. Ramos IC, Versteegh MM, de Boer RA, Koenders JMA, Linssen GCM, Meeder JG, Rutten-van Mölken MPMH. Cost Effectiveness of the Angiotensin Receptor Neprilysin Inhibitor Sacubitril/Valsartan for Patients with Chronic Heart Failure and Reduced Ejection Fraction in the Netherlands: A Country Adaptation Analysis Under the Former and Current Dutch Pharmacoeconomic Guidelines. Value Health 2017; 20: 1260– 1269. [DOI] [PubMed] [Google Scholar]
- 22. Chin KL, Zomer E, Wang BH, Liew D. Cost-Effectiveness of Switching Patients With Heart Failure and Reduced Ejection Fraction to Sacubitril/Valsartan: The Australian Perspective. Heart Lung Circ 2020; 29: 1310– 1317. [DOI] [PubMed] [Google Scholar]
- 23. Perera K, Ademi Z, Liew D, Zomer E. Sacubitril-valsartan versus enalapril for acute decompensated heart failure: a cost-effectiveness analysis. Eur J Prev Cardiol 2021; 28: 966– 972. [DOI] [PubMed] [Google Scholar]
- 24. Liang L, Bin-Chia Wu D, Aziz MIA, Wong R, Sim D, Leong KTG, Wei YQ, Tan D, Ng K. Cost-effectiveness of sacubitril/valsartan versus enalapril in patients with heart failure and reduced ejection fraction. J Med Econ 2018; 21: 174– 181. [DOI] [PubMed] [Google Scholar]
- 25. McMurray JJV, Trueman D, Hancock E, Cowie MR, Briggs A, Taylor M, Mumby-Croft J, Woodcock F, Lacey M, Haroun R, Deschaseaux C. Cost-effectiveness of sacubitril/valsartan in the treatment of heart failure with reduced ejection fraction. Heart 2018; 104: 1006– 1013. [DOI] [PMC free article] [PubMed] [Google Scholar]
- 26. Ademi Z, Pfeil AM, Hancock E, Trueman D, Haroun RH, Deschaseaux C, Schwenkglenks M. Cost-effectiveness of sacubitril/valsartan in chronic heart-failure patients with reduced ejection fraction. Swiss Med Wkly 2017; 147: w14533. [DOI] [PubMed] [Google Scholar]
- 27. Krittayaphong R, Permsuwan U. Cost-Effectiveness Analysis of Sacubitril-Valsartan Compared with Enalapril in Patients with Heart Failure with Reduced Ejection Fraction in Thailand. Am J Cardiovasc Drugs 2018; 18: 405– 413. [DOI] [PubMed] [Google Scholar]
- 28. Borges M, Afonso-Silva M, Laires PA, Gouveia M, Alarcão J, Ascenção R, Costa J. Cost-effectiveness of sacubitril/valsartan for the treatment of patients with heart failure with reduced ejection fraction in Portugal. Expert Rev Pharmacoecon Outcomes Res 2020; 20: 199– 205. [DOI] [PubMed] [Google Scholar]
- 29. Park SK, Hong SH, Kim H, Kim S, Lee EK. Cost-Utility Analysis of Sacubitril/Valsartan Use Compared With Standard Care in Chronic Heart Failure Patients With Reduced Ejection Fraction in South Korea. Clin Ther 2019; 41: 1066– 1079. [DOI] [PubMed] [Google Scholar]
- 30. Perera K, Ademi Z, Liew D, Zomer E. Sacubitril-valsartan versus enalapril for acute decompensated heart failure: a cost-effectiveness analysis. European journal of preventive cardiology. 2019:2047487319878953. [DOI] [PubMed] [Google Scholar]
- 31. Consortium YHE . Incremental Cost-Effectiveness Ratio (ICER) UK2016.(29 August 2022).
- 32. Consortium YHE . Cost-Effectiveness Threshold: York Health Economics Consortium; 2016. (29 August 2022).
- 33. Krittayaphong R, Permsuwan U. Cost-Effectiveness Analysis of Sacubitril-Valsartan Compared with Enalapril in Patients with Heart Failure with Reduced Ejection Fraction in Thailand. Am J Cardiovasc Drugs 2018; 18: 405– 413. [DOI] [PubMed] [Google Scholar]
- 34. Liu XQ, He LS, Huang JQ, Xiong LJ, Xia C, Lao HY. Cost-effectiveness analyses of sacubitril-valsartan for heart failure. Heart Fail Rev 2021; 26: 1119– 1130. [DOI] [PubMed] [Google Scholar]
Associated Data
This section collects any data citations, data availability statements, or supplementary materials included in this article.
Supplementary Materials
Table 3.
Supplementary data
A. Search strategies and results for selected databases
| Database | Date conducted | Search strategy | Results |
|---|---|---|---|
| PubMed | January 1, 2020 | (“Valsartan”[Mesh] OR “sacubitril-valsartan” [Supplementary Concept] OR sacubitril [tiab] OR valsartan [tiab]) AND (“cost-benefit analysis” [MeSH] OR “cost-utility analysis” OR “cost-effectiveness analysis” OR economics [mesh] OR Cost* [tiab] OR Economic*[tiab]) | 151 |
| Embase | January 1, 2020 | (‘sacubitril’/exp OR sacubitril OR ‘sacubitrilat’/exp OR sacubitrilat OR ‘sacubitril plus valsartan’/exp OR ‘hydrochloro-thiazide plus valsartan’/exp OR ‘hydrochlorothiazide plus valsartan’ OR ‘amlodipine plus valsartan’/exp OR ‘am-lodipine plus valsartan’ OR ‘valsartan’/exp OR valsartan) AND (‘cost benefit analysis’/exp OR ‘cost benefit analysis’ OR ‘cost effectiveness analysis’/exp OR ‘cost effectiveness analysis’ OR ‘cost utility analysis’/exp OR ‘cost utility analysis’ OR economic*:ab,ti) | 530 |
| Web of Science | January 1, 2020 | TS=(( sacubitril OR “sacubitril-valsartan” OR “sacubitril/valsartan” OR valsartan) AND (cost* OR Economic* OR “cost-benefit analysis” OR “cost benefit analysis” OR “cost effectiveness analysis” OR “cost-effectiveness analysis” OR “cost utility analysis” OR “cost-utility analysis”)) | 229 |
| Scopus | January 1, 2020 | Timespan: All years. Indexes: SCI-EXPANDED, SSCI, A&HCI, ESCI. | 103 |
| NHS Economic Evaluation Database(NHS EED) and the health technology assessment | January 1, 2020 | TITLE-ABS-KEY (sacubitril OR “sacubitril-valsartan” OR valsartan) AND TITLE-ABS-KEY ( “cost benefit analysis” OR “cost-benefit analysis” OR “cost-effectiveness analysis” OR “cost effectiveness analysis” OR “cost utility analysis” OR “cost-utility analysis” OR cost*OR economic*) | 13 |
| Total | MeSH DESCRIPTOR valsartan EXPLODE ALL TREES IN NHSEED,HTA | 1026 | |
| Total with duplicates removed | 703 |
Table 4.
Supplementary data
B. Quality of reporting of included studies using CHEERS checklist
| Section/item | Item No | Gaziano, 2016 | King, 2016 | van der Pol, 2016 | Lin, 2017 | McMurray, 2017 | Ramos, 2017 | Ademi, 2017 | Gandjour, 2018 | Krittayaphong, 2018 | Zueger, 2018 | Borges, 2019 | Chin, 2019 | Park, 2019 | Perera, 2 019 | van der Pol, 2019 |
|---|---|---|---|---|---|---|---|---|---|---|---|---|---|---|---|---|
| Title and abstract | ||||||||||||||||
| Title | 1 | Y | Y | Y | Y | Y | Y | Y | Y | Y | Y | Y | Y | Y | Y | Y |
| Abstract | 2 | Y | Y | Y | Y | Y | Y | Y | Y | Y | Y | Y | Y | Y | Y | Y |
| Introduction | ||||||||||||||||
| Background and objectives | 3 | Y | Y | Y | Y | Y | Y | Y | Y | Y | Y | Y | Y | Y | Y | Y |
| Methods | ||||||||||||||||
| Target population and subgroups | 4 | Y | Y | - | Y | Y | Y | Y | Y | Y | Y | Y | Y | Y | Y | Y |
| Setting and location | 5 | Y | - | Y | Y | Y | Y | Y | Y | Y | Y | Y | Y | Y | Y | Y |
| Study perspective | 6 | N | Y | Y | Y | Y | Y | Y | Y | Y | Y | Y | Y | Y | Y | Y |
| Comparators | 7 | Y | Y | Y | Y | Y | Y | Y | Y | Y | Y | Y | Y | Y | Y | Y |
| Time horizon | 8 | Y | Y | Y | Y | Y | Y | Y | Y | N | Y | Y | Y | Y | Y | Y |
| Discount rate | 9 | Y | Y | Y | Y | Y | Y | Y | Y | Y | Y | Y | Y | Y | Y | Y |
| Choice of health outcomes | 10 | Y | Y | Y | Y | Y | Y | Y | Y | Y | Y | Y | Y | Y | Y | Y |
| Measurement of effectiveness | 11a | Y | Y | Y | - | Y | Y | Y | Y | Y | Y | Y | Y | Y | Y | Y |
| 11b | - | Y | Y | Y | Y | N | Y | Y | Y | Y | Y | Y | Y | Y | Y | |
| Measurement and valuation of preference based outcomes | 12 | Y | - | Y | Y | Y | Y | Y | Y | Y | Y | Y | Y | Y | Y | Y |
| Estimating resources and costs | 13a | Y | - | Y | Y | Y | Y | Y | Y | Y | Y | Y | Y | Y | Y | Y |
| 13b | Y | Y | Y | Y | Y | Y | Y | Y | Y | Y | Y | Y | Y | Y | Y | |
| Currency, price date, and conversion | 14 | Y | Y | Y | Y | Y | N | Y | Y | Y | Y | Y | Y | Y | Y | Y |
| Choice of model | 15 | Y | - | Y | Y | Y | N | Y | Y | Y | Y | Y | Y | Y | Y | Y |
| Assumptions | 16 | Y | Y | Y | Y | Y | Y | Y | Y | - | Y | Y | Y | Y | Y | |
| Analytical methods | 17 | Y | Y | - | Y | Y | Y | Y | Y | Y | Y | Y | Y | Y | Y | Y |
| Results | ||||||||||||||||
| Study parameters | 18 | Y | Y | Y | Y | Y | Y | Y | Y | Y | Y | Y | Y | Y | Y | Y |
| Incremental costs and outcomes | 19 | Y | Y | Y | Y | Y | Y | Y | Y | Y | Y | Y | Y | Y | Y | Y |
| Characterising uncertainty | 20a | Y | Y | Y | Y | Y | Y | Y | Y | Y | Y | Y | Y | Y | Y | Y |
| 20b | Y | Y | Y | Y | Y | - | Y | Y | Y | Y | Y | Y | Y | Y | Y | |
| Characterising heterogeneity | 21 | N | N | N | Y | - | N | Y | N | N | Y | Y | N | N | N | N |
| Discussion | ||||||||||||||||
| Study findings, limitations, generalisability, and current knowledge | 22 | Y | Y | Y | Y | Y | Y | Y | Y | Y | Y | Y | Y | Y | Y | Y |
| Other | ||||||||||||||||
| Source of funding | 23 | N | Y | Y | Y | Y | Y | Y | Y | Y | Y | Y | Y | Y | Y | Y |
| Conflicts of interest | 24 | Y | Y | Y | N | Y | N | N | N | Y | Y | Y | Y | Y | Y | Y |