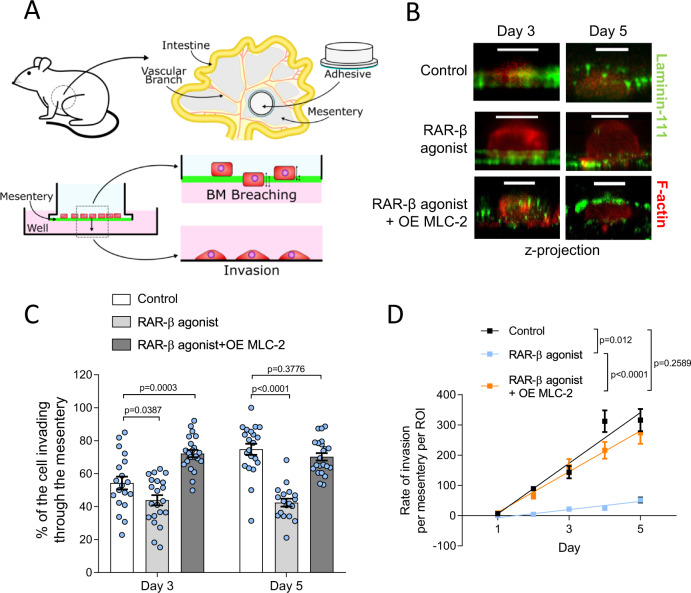
Fig. 4. RAR-β activation reduces cell invasion.
A Schematic of the mesentery preparation and invasion assay. Mesenteries from wild type mice are surgically extracted and bonded to hollow cylindrical tubes. After decellularisation, Suit2 cells are seeded on the mesentery transwells and cultured for up to 5 days. Every 24 h, mesenteries are transferred to a new well, and the number of cells attached to the well (complete migration) are counted. Mesenteries are fixed on days 3 and 5 to quantify percentage invasion. B Confocal fluorescence images (z-projection) of Suit2 cells in control, RAR-β agonist, and RAR-β agonist + MLC-2 overexpression (OE MLC-2) conditions invading through mesenteries. Laminin-111 (green), f-actin (red). Scale bar: 10 μm. C Quantification of the invasive capacity of Suit2 cells. The percentage of the cell body that had invaded through the bilayer was quantified at day 3 (mean ± s.e.m., n = 19, 21 and 22 cells for control, RAR-β agonist and RAR-β agonist + MLC-2 overexpression (OE MLC-2), respectively) and day 5 (mean ± s.e.m., n = 21, 18 and 22 cells for control, RAR-β agonist and RAR-β agonist + MLC-2 overexpression (OE MLC-2), respectively). P-values indicate significant difference relative to control by one way ANOVA test with Dunnett’s post-hoc test for Day 3 and Day 5. D Cumulative number of cells that have fully invaded through the membrane over a period of 5 days for Suit2 control, RAR-β agonist and RAR-β agonist + MLC-2 overexpression (OE MLC-2). Mean ± s.e.m., n = 28, 18, 26 (day 1), 53, 40, 48 (day 2), 67, 47, 56 (day 3), 71, 49, 60 (day 4), 78, 65, 68 (day 5). Lines represent linear regression model, with p-values indicating significant difference between the slopes of the linear regression.

