Abstract
OBJECTIVE
To evaluate the effects of tirzepatide on body composition, appetite, and energy intake to address the potential mechanisms involved in body weight loss with tirzepatide.
RESEARCH DESIGN AND METHODS
In a secondary analysis of a randomized, double-blind, parallel-arm study, the effects of tirzepatide 15 mg (N = 45), semaglutide 1 mg (N = 44), and placebo (N = 28) on body weight and composition, appetite, and energy intake were assessed at baseline and week 28.
RESULTS
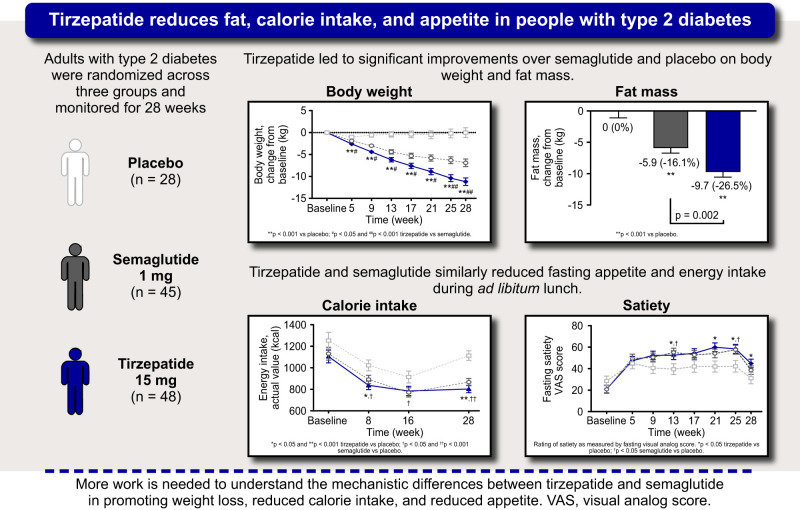
Tirzepatide treatment demonstrated significant reductions in body weight compared with placebo and semaglutide, resulting in greater fat mass reduction. Tirzepatide and semaglutide significantly reduced appetite versus placebo. Appetite scores and energy intake reductions did not differ between tirzepatide and semaglutide.
CONCLUSIONS
Differences in energy intake during ad libitum lunch were not sufficient to explain the different weight outcomes. Further evaluation is needed to assess mechanistic differences related to tirzepatide actions on 24-h energy intake, substrate utilization, and energy expenditure.
Graphical Abstract
Introduction
Tirzepatide, a glucose-dependent insulinotropic polypeptide (GIP) and glucagon-like peptide 1 (GLP-1) receptor agonist, is approved for the treatment of type 2 diabetes (T2D). Tirzepatide causes robust body weight loss mainly by reduction in energy intake and by increasing energy expenditure in preclinical models (1) and has demonstrated robust body weight reductions in people with T2D (2). We hypothesized that body weight loss with tirzepatide is mainly driven by reduced energy intake.
Research Design and Methods
Study Design and Participants
Measurements of body composition, appetite, and energy intake were performed as secondary assessments in a mechanism of action study, with main objectives and safety results published (3). Eligible patients were randomized (3:3:2) to receive once weekly 15 mg tirzepatide (N = 45), 1 mg semaglutide (N = 44), or placebo (N = 28) (Supplementary Material).
Procedures
Body weight was measured every 4 weeks, and body composition (BOD POD measurement system; COSMED, Rome, Italy) was assessed at baseline and week 28. Fasting visual analog scale (VAS) ratings of hunger, satiety, fullness, and prospective food consumption were completed, and a composite of the four scores was used to calculate an overall appetite score (4–6). Energy intake was determined by measuring ad libitum food intake during a 45-minute buffet-style lunch performed at baseline and weeks 8, 16, and 28 (Supplementary Material).
Objectives
Energy metabolism objectives assessed the effects of tirzepatide versus placebo and semaglutide on body weight, body composition, fasting appetite, and energy intake during ad libitum lunch.
Statistical Analysis
Analyses were conducted on data from all randomized patients who received at least one dose of the study drug and had evaluable pharmacodynamic data (pharmacodynamic analysis set). Analysis of variance was conducted for baseline comparisons across groups. Analysis of covariance was conducted for fat mass and fat-free mass with study treatment as a fixed effect and baseline measurement as a covariate. Mixed-model repeated measures were conducted for body weight, fasting overall appetite, the four individual VAS appetite scores, and energy intake using a restricted maximum likelihood–based approach for parameter estimation. Analyses included fixed effects of study treatment, visit, treatment-by-visit interaction, and baseline measurement as a covariate.
Significance tests were conducted at α = 0.05 (two-sided). Estimated treatment differences were presented as least squares mean and 95% CIs in brackets. We did not imputefor missing data and multiplicity adjustment in this exploratory analysis. Statistical analyses were done using SAS version 9.4, unless otherwise specified. Additional details are in Supplementary Material.
Data and Resource Availability
Eli Lilly and Company provides access to all individual participant data collected during the trial, after anonymization, with the exception of pharmacokinetic or genetic data. Data are available to request 6 months after the indication studied has been approved in the U.S. and European Union and after primary publication acceptance, whichever is later. No expiration date of data requests is currently set once data are made available. Access is provided after a proposal has been approved by an independent review committee identified for this purpose and after receipt of a signed data sharing agreement. Data and documents, including the study protocol, statistical analysis plan, clinical study report, and blank or annotated case report forms, will be provided in a secure data sharing environment. For details on submitting a request, see the instructions provided at www.vivli.org.
Results
Baseline demographics and clinical characteristics were balanced, except for longer T2D duration and more older patients randomly assigned to semaglutide (Table 1). Safety outcomes were published (3); the overall pattern of adverse events was consistent with incretin class molecules and comparable between treatment groups.
Table 1.
Patient demographics and clinical characteristics
| Parameters | Placebo, N = 28 | Semaglutide 1 mg, N = 44 | Tirzepatide 15 mg, N = 45 |
|---|---|---|---|
| Age, years | 60.4 ± 7.6 | 63.7 ± 5.9 | 61.1 ± 7.1 |
| Sex, male, n (%) | 21 (75.0) | 34 (77.3) | 31 (68.9) |
| Race, n (%) | |||
| Black or African American | 0 | 0 | 1 (2.2) |
| White | 28 (100.0) | 44 (100.0) | 44 (97.8) |
| Ethnicity, n (%) | |||
| Hispanic or Latino | 0 | 0 | 0 |
| Not Hispanic or Latino | 28 (100.0) | 44 (100.0) | 45 (100.0) |
| HbA1c concentration | |||
| % | 7.9 ± 0.5 | 7.7 ± 0.6 | 7.8 ± 0.7 |
| mmol/mol | 62.9 ± 5.5 | 60.7 ± 6.6 | 62.1 ± 7.9 |
| Fasting glucose, mg/dL | 126.6 ± 23.6 | 128.6 ± 25.0 | 139.3 ± 30.2 |
| Diabetes duration, years | 11.0 ± 6.8 | 12.7 ± 6.1 | 10.2 ± 5.8 |
| Waist circumference, cma | 109.2 ± 12.0 | 109.7 ± 9.2 | 113.5 ± 8.9 |
| BMI, kg/m2 | 32.2 ± 4.0 | 30.8 ± 3.8 | 31.3 ± 5.0 |
| Weight, kg | 98.7 ± 14.6 | 92.7 ± 14.0 | 94.2 ± 14.0 |
| Fat mass, kga | 38.6 ± 10.7 | 35.3 ± 8.0 | 36.8 ± 11.5 |
| Fat-free mass, kga | 59.1 ± 10.3 | 56.3 ± 10.3 | 57.7 ± 9.3 |
| Energy intake, kcala,b | 1,252.7 ± 483.2 | 1,131.0 ± 375.6 | 1,105.0 ± 343.7 |
Data are mean ± SD for the safety population, unless otherwise indicated. n, number of patients in the specified category; N, all randomly assigned patients who took at least one dose of study drug.
Total N = 112 (tirzepatide 15 mg, n = 43; semaglutide 1 mg, n = 43; placebo, n = 26) for waist circumference and energy intake; total N = 108 (tirzepatide 15 mg, n = 41; semaglutide, n = 43; placebo, n = 24) for fat mass and fat-free mass from the pharmacodynamic analysis set.
Energy intake during ad libitum buffet-style lunch.
Body Weight Assessment
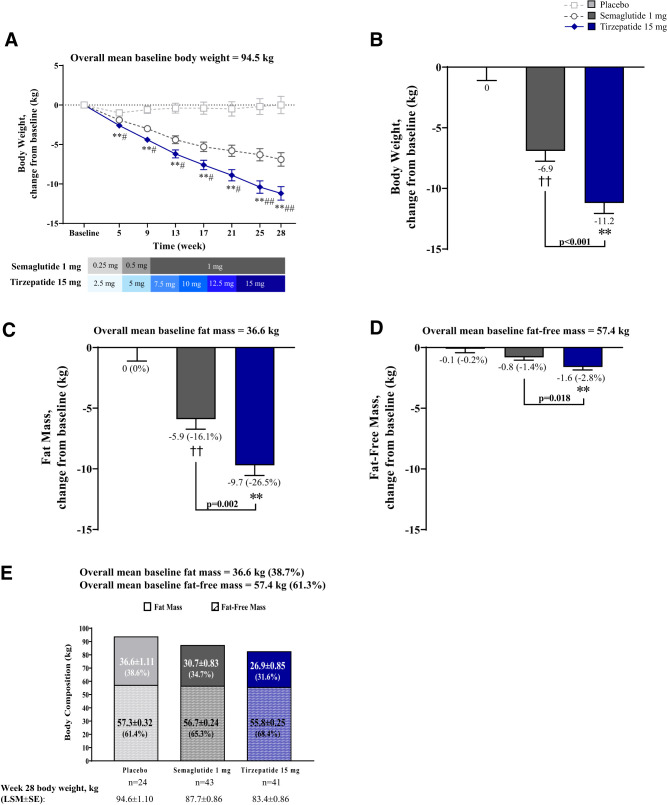
Body weight significantly reduced from baseline with tirzepatide and semaglutide (P < 0.001, all time points) (Fig. 1A). Treatment differences were observed as early as week 5 with tirzepatide (−2.6 kg) versus placebo (−1.0 kg; estimated treatment differences [95% CI]: −1.5 kg [−2.3, −0.8]; P < 0.001) and semaglutide (−1.9 kg; −0.7 kg [−1.4, −0.1]; P = 0.029), and continued throughout the trial. At week 28, tirzepatide-treated patients achieved ∼11 kg of weight reduction, vs. 0 kg with placebo (−11.2 kg [−14.0, −8.4]; P < 0.001) and ∼−7 kg with semaglutide (−4.3 kg [−6.8, −1.9]; P < 0.001) (Fig. 1B).
Figure 1.
Change from baseline in body weight and body composition and effect on fat mass reduction on body composition. Data are LSM ± SE of ANCOVA or MMRM on postbaseline or change from baseline values from the pharmacodynamic analysis set. (A) Change from baseline in body weight over time. (B) Change from baseline in body weight at 28 weeks. (C) Change from baseline in fat mass at 28 weeks (percent changes from baseline are in parentheses). (D) Change from baseline in fat-free mass at 28 weeks (percent changes from baseline are in parentheses). (E) Effect of fat mass on body composition (percent of fat or fat-free mass in body mass at 28 weeks are in parentheses). **P < 0.001 versus placebo, ##P < 0.05 and P < 0.001 tirzepatide versus semaglutide 1 mg for MMRM on change from baseline (A and B) and for ANCOVA on change from baseline (C and D). LSM, least squares mean; MMRM, mixed model repeated measures.
Body Composition Assessment
At week 28, fat mass and fat-free mass significantly reduced from baseline with tirzepatide and semaglutide, but not with placebo (Fig. 1C and D). Fat mass reductions differed in tirzepatide versus placebo (−9.6 kg [−12.4, −6.9]; P < 0.001) and semaglutide (−3.8 kg [−6.2, −1.4]; P = 0.002). Similarly, percentage of fat mass loss was greater with tirzepatide (−7.1%) versus semaglutide (−4.0%) (−3.1% [−4.9, −1.2]; P = 0.001) (Fig. 1C). Fat-free mass reductions differed in tirzepatide versus placebo (−1.5 kg [−2.3, −0.7]; P < 0.001) and semaglutide (−0.8 kg [−1.5, −0.1]; P = 0.018) (Fig. 1D). Body weight loss with tirzepatide was predominantly driven by fat mass reduction (Fig. 1B, D, E).
Fasting Appetite
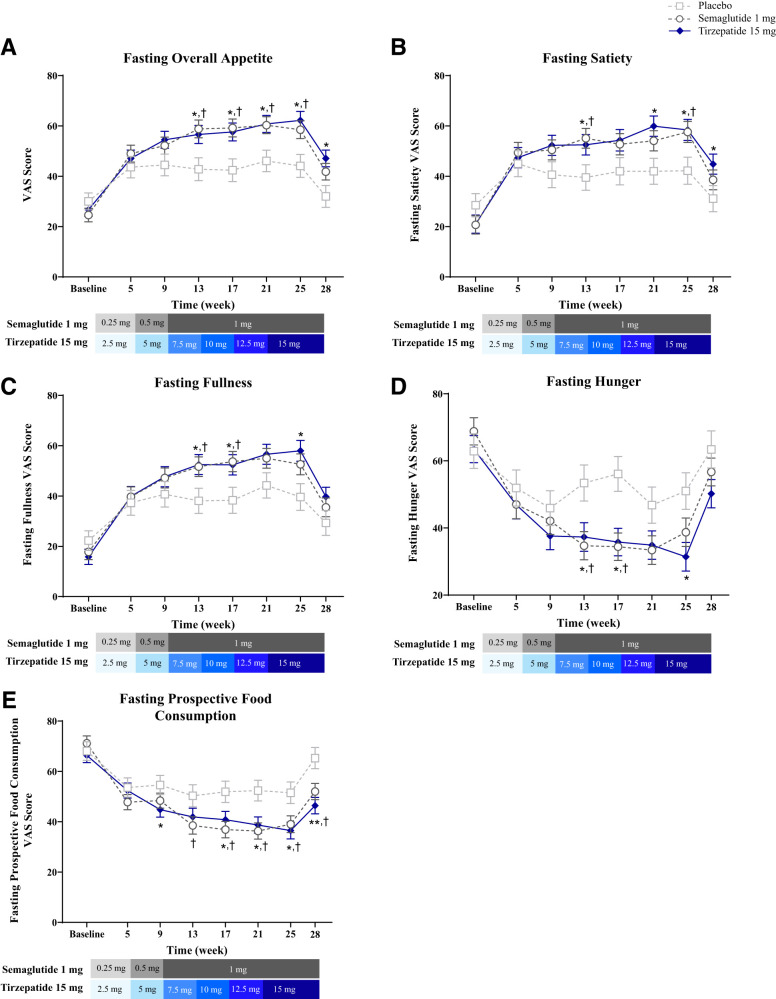
At week 28, appetite reduced from baseline, as reflected by higher overall appetite scores, with tirzepatide and semaglutide (P < 0.001) but not placebo (P = 0.241) (Fig. 2A). This effect differed in tirzepatide versus placebo (15.0 [4.1, 25.9]; P = 0.007) but not versus semaglutide (5.3 [−4.0, 14.6]; P = 0.260). Longitudinal increases in component VAS scores for satiety and fullness and decreases in scores for hunger and prospective food consumption were observed with tirzepatide and semaglutide (Fig. 2B–E).
Figure 2.
Fasting overall VAS score and individual components over time. Data are LSM ± SE of ANOVA on baseline (actual values) and MMRM postbaseline values over time from the pharmacodynamic analysis set. (A) Fasting overall appetite score over time. Note: A higher overall score indicated less appetite. (B) Fasting satiety score over time. Note: A higher overall score indicated less satiety. (C) Fasting fullness score over time. Note: A higher overall score indicated less fullness. (D) Fasting hunger score over time. (E) Fasting prospective food consumption score over time. *P < 0.05 and **P < 0.001 tirzepatide versus placebo; †P < 0.05 semaglutide versus placebo. LSM, least squares mean; MMRM, mixed-model repeated measures.
Energy Intake During Ad Libitum Buffet-Style Lunch
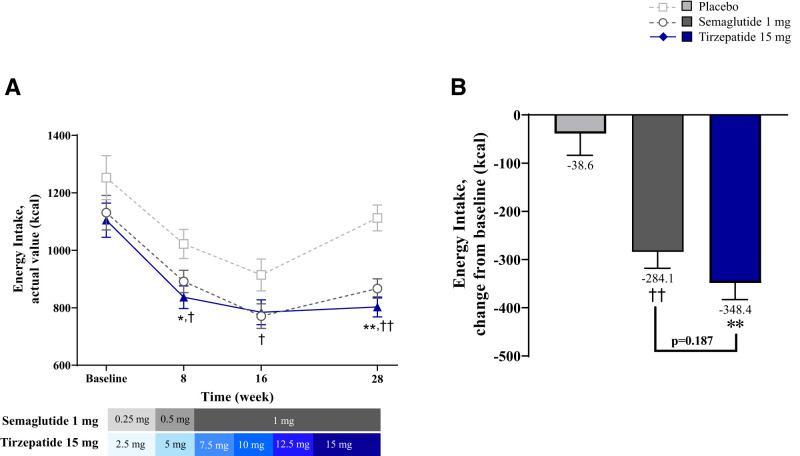
Baseline energy intake was similar between groups. At week 8, energy intake significantly reduced from baseline in all groups (Fig. 3A). Reductions were greater with tirzepatide versus placebo (−185.3 kcal [−312.7, −57.8]; P = 0.005), semaglutide versus placebo (−130.2 kcal [−257.4, −3.0]; P = 0.045), and were numerically, but not significantly, higher with tirzepatide versus semaglutide (−55.1 kcal [−165.0, 54.9]; P = 0.323). At week 16, all groups consumed significantly fewer calories compared with baseline (Fig. 3A). Compared with placebo, reductions from baseline in energy intake were greater with semaglutide (−143.4 kcal [−282.4, −4.4]; P = 0.043) and trended toward greater reductions with tirzepatide (−129.9 kcal [−269.5, 9.7]; P = 0.068). At week 28, energy intake significantly reduced from baseline with tirzepatide and semaglutide, but not with placebo. These reductions were greater with tirzepatide versus placebo (−309.8 kcal [−423.0, −196.6]; P < 0.001) and were numerically, but not significantly, greater with tirzepatide versus semaglutide (−64.3 kcal [−160.3, 31.7]; P = 0.187) (Fig. 3B).
Figure 3.
Energy intake during ad libitum buffet-style lunch. Data are LSM ± SE of ANOVA on baseline and MMRM on postbaseline or change from baseline values from the pharmacodynamic analysis set. (A) Energy intake during ad libitum buffet-style lunch actual values over time. (B) Energy intake during ad libitum buffet-style lunch change from baseline at 28 weeks. *P < 0.05 and **P < 0.001 tirzepatide versus placebo, †P < 0.05 semaglutide versus placebo, and ††P < 0.001 semaglutide versus placebo for MMRM on change from baseline. LSM, least squares mean; MMRM, mixed-model repeated measures.
Conclusions
Tirzepatide achieved significant weight reduction versus placebo in people with T2D. Body composition analyses demonstrated that the body weight loss was mainly due to fat mass reduction. Semaglutide produced substantial, albeit smaller, weight reduction that was also predominantly explained by fat mass loss. Tirzepatide and semaglutide significantly reduced fasting appetite and energy intake during ad libitum lunch. Assessing the effect of tirzepatide on 24-h energy intake and energy expenditure using respiratory chambers is ongoing (clinical trial no. NCT04081337).
Tirzepatide and semaglutide decreased weight primarily through a reduction in fat mass. Nevertheless, the absolute changes in total and fat mass were greater with tirzepatide, suggesting that the added efficacy of tirzepatide may be achieved by utilizing body fat more effectively than semaglutide. The underlying mechanisms of this effect are unclear, and not explained by changes in energy intake during lunch. Actions of tirzepatide to modulate adipose lipid storage through actions at GIP receptors have been described in preclinical and clinical studies (7) and may contribute to such differential actions of tirzepatide.
In a 12-week crossover trial, 1 mg semaglutide significantly reduced total energy intake across all ad libitum meals by ∼24% versus placebo (8). The effect was primarily observed during ad libitum lunch (35% reduction with semaglutide versus placebo) (8). Therefore, we focused on ad libitum lunch energy intake assessment and observed similar reductions in energy intake for the two active treatments versus placebo. At week 28, a numerically, but not significantly, greater reduction in energy intake during ad libitum lunch was observed with tirzepatide versus semaglutide (∼64 kcal difference). Such a difference during ad libitum lunch may contribute to the differences in weight reduction between tirzepatide and semaglutide, particularly if considering total daily energy intake. Hence, up to week 16, reductions in energy intake during lunch were similar for tirzepatide and semaglutide, whereas weight reductions started to separate as early as week 5. Therefore, the differences in total energy intake, in addition to other mechanisms, may contribute to the differences in body weight loss observed with tirzepatide versus semaglutide (8).
Study limitations include limited study population diversity, thus limiting generalizability, and modest differences in baseline characteristics between groups. Although these analyses were prespecified and hypothesis driven, the study sample size was not explicitly powered for these secondary and exploratory outcomes. The evaluation of energy intake was guided by lunch-specific treatment effects observed with semaglutide (8), which reflected a single meal. However, this focused measurement of energy intake may not fully reflect the treatment differences on total energy intake. Animal data suggest that food intake reduction is more prolonged with tirzepatide compared with selective GLP-1 receptor agonist (1), and maybe a separation of energy intake may occur later. The energy intake measures may have been influenced by the artificial setting of the research clinic, the specific food choices provided in the buffet, and the assessment being limited to only lunch. Overall, these observations emphasize the value of including a placebo group, particularly where the background treatment includes a study-wide dietary intervention to explain treatment effect. The measurement of appetite VAS under fasting conditions prevented observations of treatment group differences in meal-related appetite effects. While fat-free mass was calculated from body weight and fat mass rather than directly measured, previous studies showed a high reliability of these data compared with direct measurements (9).
These data highlight greater effects of tirzepatide than semaglutide on total body mass and fat mass reduction in people with T2D. As the effects of tirzepatide and semaglutide on appetite and energy intake were similar, we posit that additional mechanisms contributed to an energy balance that underlies the greater weight reduction benefit of tirzepatide. Whether and how the difference in weight reduction between tirzepatide and semaglutide is related to GIP receptor agonism by tirzepatide needs to be elucidated in future studies.
Article Information
Acknowledgments. The authors thank Charlie Harris (Eli Lilly and Company) for his critical review.
Funding and Duality of Interest. Funding for this study was provided by Eli Lilly and Company. T.H. is shareholder of the private research institute Profil, which received research funds from Adocia, AstraZeneca, Biocon, Boehringer Ingelheim, Crinetics, Eli Lilly and Company, Gan & Lee Pharmaceuticals, Genova, Nestlé, Neuraly, Novo Nordisk, Sanofi, and Zealand Pharma; received speaker honoraria and travel grants from Eli Lilly and Company, Gan & Lee Pharmaceuticals, and Novo Nordisk; and is a member of advisory panels for Novo Nordisk. J.H.D. was on advisory boards for Adocia, Novo Nordisk, and Zealand. He is now at the European Medicines Agency, where he will not be involved in matters relating to tirzepatide. The clinical studies presented here preceded his secondment to the European Medicines Agency. S.U., J.L., E.J.P., M.K.T., K.J.M., C.A.K., J.D., A.H., Z.M., and T.C. are employees and shareholders of Eli Lilly and Company. M.K.T. also reports support for patents (planned, issued, or pending) from Eli Lilly and Company and participation in the steering committee for the Accelerating Medicines Partnership for Common Metabolic Diseases. A.H. also reports participation on a data safety monitoring board for multiple compounds. No other potential conflicts of interest relevant to this article were reported.
Author Contributions. T.H., J.H.D., S.U., E.J.P., M.K.T., A.H., Z.M., and T.C. contributed to the study design. J.H.D. and Z.M. provided medical oversight during the trial. J.L. was responsible for the statistical analyses. All authors participated in interpretation of the data and critical review of the manuscript and approved of this manuscript to be submitted for publication. T.C. is the guarantor of this work and, as such, had full access to all the data in the study and takes responsibility for the integrity of the data and the accuracy of the data analysis.
Prior Presentation. Parts of this study were presented in abstract form at the 82nd Scientific Sessions of the American Diabetes Association, New Orleans, LA, 3–7 June 2022; at the 58th European Association for the Study of Diabetes Annual Meeting, Stockholm, Sweden, 19–23 September 2022; and at ObesityWeek 2022, San Diego, CA, 1–4 November 2022.
Footnotes
Clinical trial reg. no. NCT03951753, clinicaltrials.gov
This article contains supplementary material online at https://doi.org/10.2337/figshare.21984596.
References
- 1. Coskun T, Sloop KW, Loghin C, et al. LY3298176, a novel dual GIP and GLP-1 receptor agonist for the treatment of type 2 diabetes mellitus: from discovery to clinical proof of concept. Mol Metab 2018;18:3–14 [DOI] [PMC free article] [PubMed] [Google Scholar]
- 2. Frías JP, Davies MJ, Rosenstock J, et al.; SURPASS-2 Investigators . Tirzepatide versus semaglutide once weekly in patients with type 2 diabetes. N Engl J Med 2021;385:503–515 [DOI] [PubMed] [Google Scholar]
- 3. Heise T, Mari A, DeVries JH, et al. Effects of subcutaneous tirzepatide versus placebo or semaglutide on pancreatic islet function and insulin sensitivity in adults with type 2 diabetes: a multicentre, randomised, double-blind, parallel-arm, phase 1 clinical trial. Lancet Diabetes Endocrinol 2022;10:418–429 [DOI] [PubMed] [Google Scholar]
- 4. Aitken RC. Measurement of feelings using visual analogue scales. Proc R Soc Med 1969;62:989–993 [DOI] [PMC free article] [PubMed] [Google Scholar]
- 5. van Can J, Sloth B, Jensen CB, Flint A, Blaak EE, Saris WH. Effects of the once-daily GLP-1 analog liraglutide on gastric emptying, glycemic parameters, appetite and energy metabolism in obese, non-diabetic adults. Int J Obes 2014;38:784–793 [DOI] [PMC free article] [PubMed] [Google Scholar]
- 6. Flint A, Raben A, Blundell JE, Astrup A. Reproducibility, power and validity of visual analogue scales in assessment of appetite sensations in single test meal studies. Int J Obes Relat Metab Disord 2000;24:38–48 [DOI] [PubMed] [Google Scholar]
- 7. Samms RJ, Coghlan MP, Sloop KW. How may GIP enhance the therapeutic efficacy of GLP-1? Trends Endocrinol Metab 2020;31:410–421 [DOI] [PubMed] [Google Scholar]
- 8. Blundell J, Finlayson G, Axelsen M, et al. Effects of once-weekly semaglutide on appetite, energy intake, control of eating, food preference and body weight in subjects with obesity. Diabetes Obes Metab 2017;19:1242–1251 [DOI] [PMC free article] [PubMed] [Google Scholar]
- 9. Smith-Ryan AE, Mock MG, Ryan ED, Gerstner GR, Trexler ET, Hirsch KR. Validity and reliability of a 4-compartment body composition model using dual energy x-ray absorptiometry-derived body volume. Clin Nutr 2017;36:825–830 [DOI] [PMC free article] [PubMed] [Google Scholar]


