Abstract
OBJECTIVE
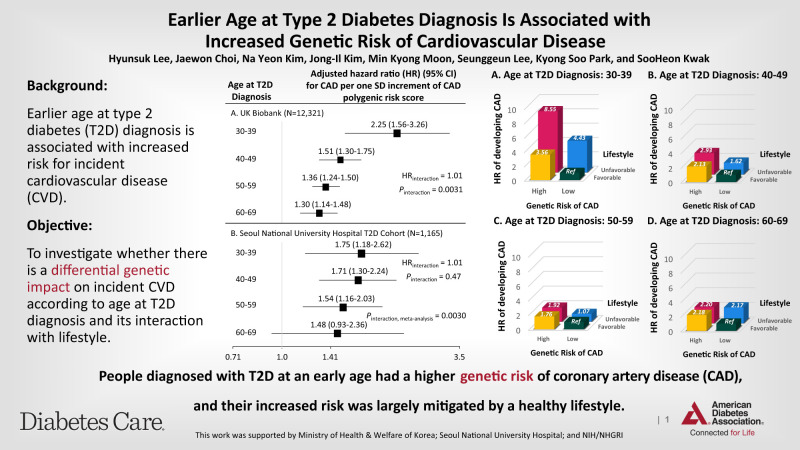
We investigated genetic risk of cardiovascular disease (CVD) by age at type 2 diabetes (T2D) diagnosis.
RESEARCH DESIGN AND METHODS
We compared incident CVD events by age at T2D diagnosis using UK Biobank (N = 12,321) and the Seoul National University Hospital (SNUH) cohort (N = 1,165). Genetic risk was quantified using polygenic risk score (PRS).
RESULTS
Individuals with earlier T2D diagnosis had higher CVD risk. In UK Biobank, the effect size of coronary artery disease (CAD) PRS on incident CAD was largest in individuals diagnosed with T2D at ages 30–39 years (hazard ratio 2.25; 95% CI 1.56–3.26) and decreased as age at diagnosis increased: ages 40–49 (1.51; 1.30–1.75), 50–59 (1.36; 1.24–1.50), and 60–69 years (1.30; 1.14–1.48) (Pinteraction = 0.0031). A similar trend was observed in the SNUH cohort. This increased genetic risk associated with earlier T2D diagnosis was largely mitigated by a healthy lifestyle.
CONCLUSIONS
Individuals with an earlier T2D diagnosis have a higher genetic risk of CAD, and this information could be used to tailor lifestyle interventions.
Graphical Abstract
Introduction
Individuals diagnosed with type 2 diabetes (T2D) at a young age are increasing in prevalence and have an elevated risk of cardiovascular disease (CVD) (1). Previous studies have suggested that diabetes subgroups divided by age at diagnosis exhibit differences in genetic risk factors (2) and that those with early-onset T2D have higher T2D polygenic risk score (PRS) (3). However, whether genetic heterogeneity associated with age at T2D diagnosis affects excess CVD risk remains largely unknown. In line with the common soil hypothesis (4), we postulated an increased genetic predisposition to CVD in individuals with early-onset diabetes. We analyzed data from two prospective cohorts to investigate whether there is an increased genetic impact on incident CVD with earlier T2D diagnosis. Moreover, because a healthy lifestyle is suggested to offset the increased genetic risk of CVD (5,6), we explored whether the genetic effect on CVD was modified by a healthy lifestyle stratified by age at T2D diagnosis.
Research Design and Methods
Participants in UK Biobank were recruited between 2007 and 2010 (7). Participants with T2D and their age at diagnosis were defined using a previously validated algorithm (8). Participants were observed until February 2018, and incident CVD events were defined as nonfatal myocardial infarction, nonfatal stroke, and death resulting from CVD that occurred at least 1 year after T2D diagnosis (Supplementary Table 1). Based on the definition of incident CVD event, participants with CVD events prior to or within 1 year after T2D diagnosis were excluded. The Seoul National University Hospital (SNUH) T2D cohort is a hospital-based prospective study that enrolled individuals with T2D between January 2001 and September 2018 as previously described (9).
UK Biobank participants were genotyped and imputed centrally by the UK Biobank team (7). Standardized PRSs for T2D, coronary artery disease (CAD), and stroke were calculated via Bayesian regression with continuous shrinkage priors (10) for participants of European ancestry, using summary statistics of DIAGRAM (Diabetes Genetics Replication and Meta-analysis), CARDIoGRAMplusC4D (Coronary Artery Disease Genome-Wide Replication and Meta-analysis Plus Coronary Artery Disease [C4D] Genetics), and MEGASTROKE consortia, respectively (11–13). SNUH T2D cohort participants were genotyped using the Affymetrix Axiom Biobank Plus Genotyping Array and imputed using the 1000 Genomes Project reference panel (9). PRSs for T2D and CAD were calculated using common variants and weights derived from transancestry meta-analysis of DIAGRAM, MEDIA (Meta-analysis of Type 2 Diabetes in African Americans) Consortium, and Biobank Japan (14) and transancestry meta-analysis of Biobank Japan, UK Biobank, and CARDIoGRAMplusC4D (15), respectively.
We adapted four lifestyle components associated with primary prevention of atherosclerotic CVD (ASCVD) (16): no current smoking, no obesity (BMI <30 kg/m2), healthy diet pattern, and physical activity at goal levels (Supplementary Table 2). Participants were categorized as having a favorable lifestyle (satisfying at least two lifestyle goals) or an unfavorable lifestyle (fewer than two).
Participants were divided into four groups by age at T2D diagnosis (ages 30–39, 40–49, 50–59, and 60–69 years). Risk of incident CVD compared with the reference group (age 60–69 years) was estimated using Cox proportional hazards models. Follow-up time was calculated as age, from birth to first incident CVD event, death, or end of follow-up. Model 1 was adjusted for age at enrollment and sex, and model 2 was additionally adjusted for ASCVD risk factors: ethnicity, systolic and diastolic blood pressure, use of antihypertensive medication, total cholesterol, HDL cholesterol, and smoking status (17). Log-minus-log plots and Schoenfeld residuals were evaluated.
Genetic risk of incident CVD was estimated with hazard ratio (HR) per one SD increment of PRS using the Cox model adjusting for the first 10 principal components that reflected ancestry in the aforementioned models. Effect modification of genetic risk by lifestyle was examined by categorizing genetic risk as high (PRS ≥0) or low (PRS <0) and calculating HRs for incident CVD in groups divided by genetic risk and lifestyle compared with the reference group (favorable lifestyle with low genetic risk).
We performed two sensitivity analyses: 1) including participants with CVD events before T2D diagnosis and 2) changing the start of observation from birth to age at cohort entrance (Supplementary Methods).
Results
Higher CVD Incidence by Earlier Age at T2D Diagnosis
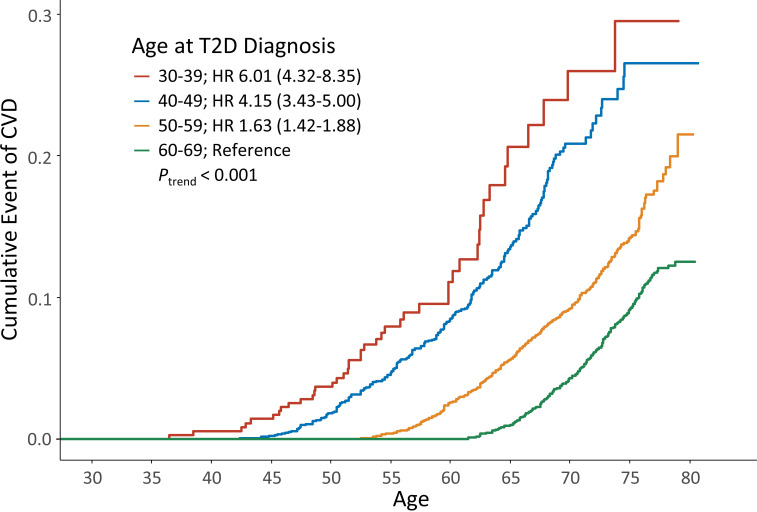
The percentages of UK Biobank participants diagnosed with T2D at ages 30–39, 40–49, 50–59, and 60–69 years were 2.9, 11.9, 47.2, and 31.9%, respectively (Ntotal = 12,321) (Table 1). During a median diabetes duration of 13.1 years, participants with an earlier age at T2D diagnosis had a higher risk of incident CVD (Fig. 1). Although adjustment for ASCVD risk factors attenuated the estimates, the increased CVD risk remained significant (Supplementary Table 3), and sensitivity analysis showed similar results (Supplementary Table 4). The increased CVD risk with earlier T2D diagnosis was also observed in the SNUH T2D cohort (Supplementary Tables 5 and 6).
Table 1.
Baseline characteristics of UK Biobank participants by age at diagnosis of T2D
| Age at T2D diagnosis, years | P * | P trend † | ||||
|---|---|---|---|---|---|---|
| 30–39 (n = 353) | 40–49 (n = 2,219) | 50–59 (n = 5,820) | 60–69 (n = 3,929) | |||
| Age at enrollment, years | 49.8 (7.9) | 53.3 (6.4) | 60.7 (4.4) | 65.8 (2.5) | <0.001 | <0.001 |
| Age at T2D diagnosis, years | 36.3 (2.9) | 45.5 (2.9) | 55.2 (2.9) | 63.3 (2.4) | <0.001 | <0.001 |
| Male sex, n (%) | 211 (59.8) | 1,469 (66.2) | 3,745 (64.3) | 2,339 (59.5) | <0.001 | <0.001 |
| Duration of T2D, years | 13.5 (8.9) | 7.8 (6.2) | 5.5 (4.1) | 2.6 (2.3) | <0.001 | <0.001 |
| Family history of T2D, n (%) | 166 (47.0) | 976 (44.0) | 1,964 (33.7) | 1,025 (26.1) | <0.001 | <0.001 |
| HbA1c, % | 7.56 (1.43) | 7.17 (1.25) | 6.92 (1.05) | 6.72 (0.94) | <0.001 | <0.001 |
| Insulin use, n (%) | 35 (9.9) | 100 (4.5) | 184 (3.2) | 52 (1.3) | <0.001 | <0.001 |
| BMI, kg/m2 | 33.7 (7.5) | 33.5 (6.4) | 32.2 (5.7) | 30.9 (5.2) | <0.001 | <0.001 |
| Current smoking, n (%) | 52 (14.7) | 325 (14.6) | 562 (9.7) | 327 (8.3) | <0.001 | <0.001 |
| Blood pressure, mmHg | ||||||
| Systolic | 136 (16) | 139 (16) | 142 (17) | 145 (17) | <0.001 | <0.001 |
| Diastolic | 82 (9.2) | 84 (9.4) | 82 (9.5) | 81 (9.5) | <0.001 | <0.001 |
| Lipid levels, mg/dL | ||||||
| Total cholesterol | 176 (41) | 172 (40) | 172 (38) | 173 (38) | 0.056 | 0.301 |
| HDL cholesterol | 44 (10) | 43 (11) | 45 (11) | 47 (12) | <0.001 | <0.001 |
| LDL cholesterol | 107 (29) | 104 (30) | 103 (28) | 104 (28) | 0.089 | 0.392 |
| Use of antihypertensive medication, n (%) | 205 (58.1) | 1,365 (61.5) | 3,836 (65.9) | 2,620 (66.7) | 0.09 | <0.001 |
| Use of lipid-lowering medication, n (%) | 255 (72.2) | 1,724 (77.7) | 4,626 (79.5) | 3,046 (77.5) | 0.003 | 0.473 |
| Incident event, n (%) | ||||||
| CVD | 43 (12.2) | 265 (11.9) | 585 (10.1) | 372 (9.5) | 0.011 | 0.0018 |
| CAD | 34 (9.6) | 180 (8.1) | 400 (6.9) | 227 (5.8) | 0.001 | <0.001 |
| Stroke | 17 (4.8) | 108 (4.9) | 222 (3.8) | 165 (4.2) | 0.177 | 0.278 |
| PRS | ||||||
| T2D | 0.18 (0.95) | 0.11 (1.00) | 0.00 (1.01) | −0.07 (0.98) | <0.001 | <0.001 |
| CAD | 0.07 (1.03) | 0.06 (1.00) | 0.01 (1.00) | −0.06 (1.00) | <0.001 | <0.001 |
| Stroke | 0.00 (1.01) | 0.04 (0.99) | 0.00 (0.99) | −0.02 (1.01) | 0.101 | 0.030 |
| Healthy lifestyle score, n (%)‡ | ||||||
| Favorable (≥2 ideal factors) | 190 (53.8) | 1,207 (54.4) | 3,684 (63.3) | 2,809 (71.5) | <0.001 | <0.001 |
| Unfavorable (0 or 1 ideal factor) | 163 (46.2) | 1,012 (45.6) | 2,136 (36.7) | 1,120 (28.5) | <0.001 | <0.001 |
| Townsend deprivation index§ | 0.22 (3.46) | −0.26 (3.37) | −0.97 (3.21) | −1.13 (3.09) | <0.001 | <0.001 |
Data are given as mean (SD) unless otherwise indicated.
P values for the difference between groups divided by age at T2D diagnosis were calculated with ANOVA and the χ2 test for continuous and categorical variables, respectively.
P values for trend between groups divided by age at T2D diagnosis were calculated with a linear regression test and the Cochran-Armitage test for continuous and categorical variables, respectively.
Refers to lifestyle factors adapted from strategic goals of the American Heart Association for primary prevention of ASCVD: no current smoking, no obesity, healthy diet pattern, and physical activity at goal levels.
Townsend deprivation index scores were derived from national census data about car ownership, household overcrowding, owner occupation, and unemployment aggregated for postcode of residence. A greater score implies a greater degree of socioeconomic deprivation.
Figure 1.
Cumulative event of CVD by age (years) at T2D diagnosis. Adjusted HRs for CVD in each group according to age at T2D diagnosis are shown. The 95% CIs for the HRs are provided in parentheses. HRs were risk of incident CVD in each age at T2D diagnosis group compared with the reference group (age at T2D diagnosis between 60 and 69 years). The model was adjusted for age at enrollment and sex.
Increased Genetic Risk of CVD by Earlier Age at T2D Diagnosis
UK Biobank participants with an earlier T2D diagnosis had a higher T2D PRS, as expected (Table 1). However, the effect of T2D PRS on incident CAD and stroke was only marginal (HR 1.10; 95% CI 1.03–1.18 and 1.09; 1.00–1.19, respectively). There was no difference in the effect size of T2D PRS on CAD or stroke according to age at T2D diagnosis (Supplementary Fig. 1).
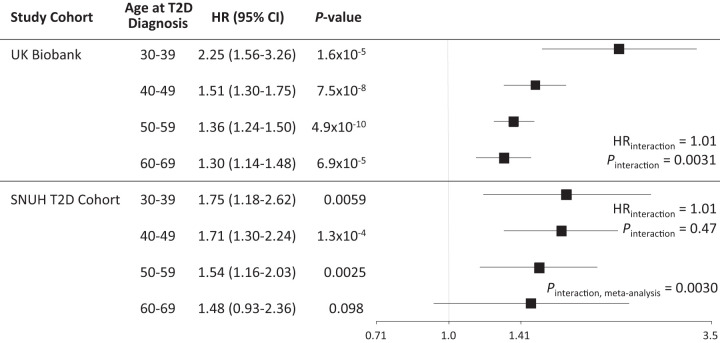
In contrast, CAD PRS was significantly associated with incident CAD, and its effect size was largest in participants diagnosed with T2D at age 30–39 years. The effect size decreased as the age at diagnosis increased: HR of 2.25 (95% CI 1.56–3.26) for ages 30–39, 1.51 (1.30–1.75) for 40–49, 1.36 (1.24–1.50) for 50–59, and 1.30 (1.14–1.48) for 60–69 years (Fig. 2). Notably, there was a significant interaction between age at T2D diagnosis and CAD PRS for incident CAD (HRinteraction 1.01; 95% CI 1.004–1.022; Pinteraction = 0.0031) (Fig. 2). This translated into an additional 14% increase (1.14; 1.05–1.25) in the effect of CAD PRS as age at T2D diagnosis decreased by 10 years. We observed similar results in various sensitivity analyses: 1) fully adjusting for ASCVD risk factors, 2) including participants with CAD events before T2D diagnosis, and 3) changing the start of observation to cohort entry (Supplementary Tables 7–9). Results from the SNUH T2D cohort further supported the findings with a similar trend (Fig. 2 and Supplementary Table 10). After meta-analysis of the two studies, the interaction remained statistically significant (Pinteraction, meta-analysis = 0.0030) (Fig. 2).
Figure 2.
Genetic risk of CAD according to age (years) at T2D diagnosis. Adjusted HRs for CAD in each group according to age at T2D diagnosis are shown. HRs were calculated for one SD increment of CAD PRS. The model was adjusted for age at enrollment, sex, and the first 10 principal components that reflected ancestry. The HR for the interaction term between age at T2D diagnosis and CAD PRS was estimated to express increased risk of CAD with earlier T2D diagnosis.
Lifestyle Mitigates Increased Genetic Effect
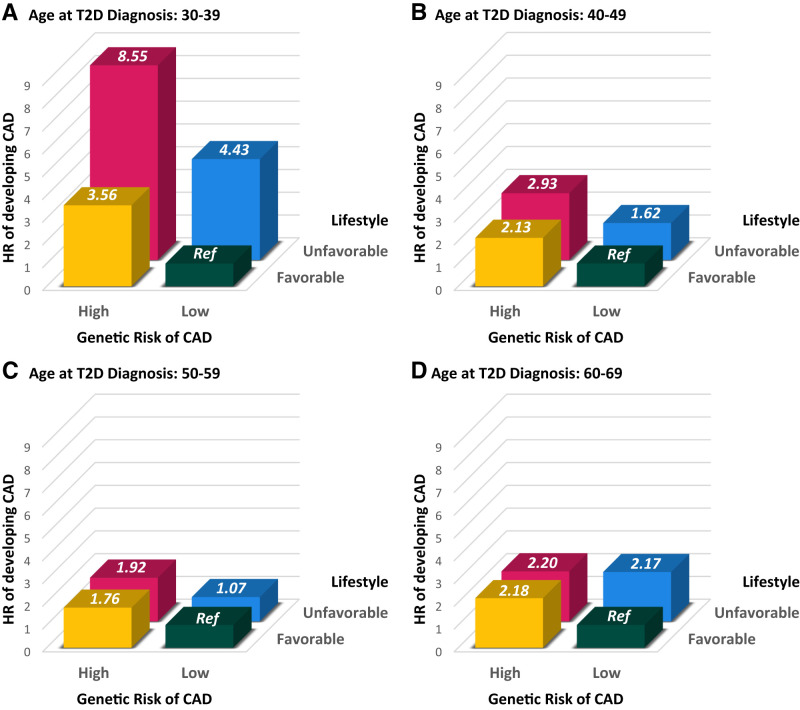
Among UK Biobank participants diagnosed with T2D between ages 30 and 39 years, the relative risk of developing CAD was 8.55-fold higher for those with high genetic risk of CAD and an unfavorable lifestyle compared with those with low genetic risk and a favorable lifestyle (Fig. 3 and Supplementary Table 11). Interestingly, participants with low genetic risk of CAD but an unfavorable lifestyle had a similar but slightly higher risk (4.43-fold) than those with high genetic risk of CAD and a favorable lifestyle (3.56-fold). The relative risk reduction of adherence to a favorable lifestyle compared with an unfavorable lifestyle was 69% (HR 0.31; 95% CI 0.15–0.64), whereas the risk difference for having low genetic risk of CAD compared with high genetic risk was 66% (0.34; 0.16–0.74).
Figure 3.
Risk of CAD according to age at T2D diagnosis, lifestyle, and genetic risk. Adjusted HRs for CAD according to lifestyle and genetic risk in each group according to age at T2D diagnosis are shown: ages 30–39 (A), 40–49 (B), 50–59 (C), and 60–69 years (D). Participants with a favorable lifestyle and low genetic risk of CAD served as the reference group (Ref) in these comparisons. The model was adjusted for age at enrollment, sex, and the first 10 principal components that reflected ancestry.
Conclusions
In this study of two independent prospective cohorts with different ethnicities and recruitment settings, we tried to determine why individuals with earlier T2D diagnosis had an increased risk of CVD. We show that CAD PRS was higher in participants with earlier T2D diagnosis and that there was a significant interaction between earlier age at T2D diagnosis and larger genetic effect of CAD PRS on incident CAD (14% additional risk increase for a 10-year earlier diagnosis). Moreover, having a favorable lifestyle had a similar risk-lowering effect to having a low CAD PRS in individuals diagnosed with T2D at age 30–39 years (69 and 66%, respectively).
Previous studies have reported an increased risk of CVD and mortality in individuals with early-onset T2D, even after adjustment for T2D duration (18), but the mechanism is not clearly understood. We demonstrate an increased genetic effect on CAD in individuals with earlier T2D diagnosis. One potential explanation is that those with earlier T2D diagnosis may have aggregation of multiple cardiometabolic risk factors, as suggested by the common soil hypothesis (4). The constellation of these predispositions in individuals with early-onset T2D might have caused the increased genetic risk of incident CAD. Second, there are shared genetic risk factors between T2D and CAD (19), and studies have identified T2D-related genetic variants showing pleiotropic effects on CAD (20). Finally, interaction with lifestyle factors might have increased the genetic impact in individuals with earlier T2D diagnosis (5).
The strengths of our study are that we 1) evaluated the association of age at T2D diagnosis and genetic risk of incident CVD in large-scale prospective cohorts, 2) performed multiple sensitivity analyses, and 3) evaluated the modification of genetic effects by comprehensive lifestyle factors. There were certain limitations in our study. First, we excluded participants with CVD events before T2D diagnosis. Although CVD can develop during the prediabetic stage, we focused on incident CVD events that were specifically related to T2D. Second, we were not able to investigate more detailed environmental risk factors or epigenetic factors, as they were beyond our scope. Finally, the number of participants with T2D diagnosed between ages 30 and 39 years was relatively small, and T2D status based on self-report in UK Biobank might have biased our results. In conclusion, individuals diagnosed with T2D at an early age have a higher genetic predisposition for CAD, and their increased risk was largely mitigated by a healthy lifestyle.
Article Information
Acknowledgments. The authors thank the participants and staff of UK Biobank and the SNUH T2D cohort for their dedication and contribution to the research. This research was conducted using the UK Biobank resource under application 44196. The biospecimens and data used in this study were provided by the SNUH Biobank, a member of the Korea Biobank Network.
Funding. This work was supported by a grant from the Korea Health Technology R&D Project through the Korea Health Industry Development Institute (KHIDI), funded by the Ministry of Health & Welfare, Republic of Korea (HI15C3131 to S.H.K.); by the MD-PhD/Medical Scientist Training Program through the KHIDI, funded by the Ministry of Health & Welfare, Republic of Korea (grant to H.L.); and by SNUH (0320220080). S.H.K. and J.C. are supported by the National Human Genome Research Institute (U01HG011723).
Duality of Interest. No potential conflicts of interest relevant to this article were reported.
Author Contributions. H.L. and S.H.K. researched and analyzed the data and wrote the manuscript. J.C., N.Y.K., and S.L. performed the statistical analysis and reviewed the manuscript. J.-I.K. reviewed the manuscript. M.K.M. and K.S.P. collected data, contributed to the study design, and reviewed the manuscript. H.L., K.S.P., and S.H.K. are the guarantors of this work and, as such, had full access to all the data in the study and take responsibility for the integrity of the data and the accuracy of the data analysis.
Prior Presentation. Parts of this study were presented orally at the American Diabetes Association 82nd Scientific Sessions, New Orleans, LA, 3–7 June 2022.
Footnotes
This article contains supplementary material online at https://doi.org/10.2337/figshare.22158395.
References
- 1. Lascar N, Brown J, Pattison H, Barnett AH, Bailey CJ, Bellary S. Type 2 diabetes in adolescents and young adults. Lancet Diabetes Endocrinol 2018;6:69–80 [DOI] [PubMed] [Google Scholar]
- 2. Noordam R, Läll K, Smit RAJ, et al.; Estonian Biobank Research Team; Estonian Biobank Research Team . Stratification of type 2 diabetes by age of diagnosis in the UK Biobank reveals subgroup-specific genetic associations and causal risk profiles. Diabetes 2021;70:1816–1825 [DOI] [PMC free article] [PubMed] [Google Scholar]
- 3. Mars N, Koskela JT, Ripatti P, et al.; FinnGen . Polygenic and clinical risk scores and their impact on age at onset and prediction of cardiometabolic diseases and common cancers. Nat Med 2020;26:549–557 [DOI] [PubMed] [Google Scholar]
- 4. Stern MP. Diabetes and cardiovascular disease. The “common soil” hypothesis. Diabetes 1995;44:369–374 [DOI] [PubMed] [Google Scholar]
- 5. Khera AV, Emdin CA, Drake I, et al. Genetic risk, adherence to a healthy lifestyle, and coronary disease. N Engl J Med 2016;375:2349–2358 [DOI] [PMC free article] [PubMed] [Google Scholar]
- 6. Rutten-Jacobs LC, Larsson SC, Malik R, et al.; MEGASTROKE Consortium; International Stroke Genetics Consortium . Genetic risk, incident stroke, and the benefits of adhering to a healthy lifestyle: cohort study of 306 473 UK Biobank participants. BMJ 2018;363:k4168. [DOI] [PMC free article] [PubMed] [Google Scholar]
- 7. Bycroft C, Freeman C, Petkova D, et al. The UK Biobank resource with deep phenotyping and genomic data. Nature 2018;562:203–209 [DOI] [PMC free article] [PubMed] [Google Scholar]
- 8. Eastwood SV, Mathur R, Atkinson M, et al. Algorithms for the capture and adjudication of prevalent and incident diabetes in UK Biobank. PLoS One 2016;11:e0162388. [DOI] [PMC free article] [PubMed] [Google Scholar]
- 9. Kwak SH, Chae J, Lee S, et al. Nonsynonymous variants in PAX4 and GLP1R are associated with type 2 diabetes in an East Asian population. Diabetes 2018;67:1892–1902 [DOI] [PubMed] [Google Scholar]
- 10. Ge T, Chen CY, Ni Y, Feng YA, Smoller JW. Polygenic prediction via Bayesian regression and continuous shrinkage priors. Nat Commun 2019;10:1776. [DOI] [PMC free article] [PubMed] [Google Scholar]
- 11. Scott RA, Scott LJ, Mägi R, et al.; DIAbetes Genetics Replication And Meta-analysis (DIAGRAM) Consortium . An expanded genome-wide association study of type 2 diabetes in Europeans. Diabetes 2017;66:2888–2902 [DOI] [PMC free article] [PubMed] [Google Scholar]
- 12. Nikpay M, Goel A, Won HH, et al. A comprehensive 1,000 Genomes-based genome-wide association meta-analysis of coronary artery disease. Nat Genet 2015;47:1121–1130 [DOI] [PMC free article] [PubMed] [Google Scholar]
- 13. Malik R, Chauhan G, Traylor M, et al.; AFGen Consortium; Cohorts for Heart and Aging Research in Genomic Epidemiology (CHARGE) Consortium; International Genomics of Blood Pressure (iGEN-BP) Consortium; INVENT Consortium; STARNET; BioBank Japan Cooperative Hospital Group; COMPASS Consortium; EPIC-CVD Consortium; EPIC-InterAct Consortium; International Stroke Genetics Consortium (ISGC); METASTROKE Consortium; Neurology Working Group of the CHARGE Consortium; NINDS Stroke Genetics Network (SiGN); UK Young Lacunar DNA Study; MEGASTROKE Consortium . Multiancestry genome-wide association study of 520,000 subjects identifies 32 loci associated with stroke and stroke subtypes. Nat Genet 2018;50:524–537 [DOI] [PMC free article] [PubMed] [Google Scholar]
- 14. Ge T, Irvin MR, Patki A, et al. Development and validation of a trans-ancestry polygenic risk score for type 2 diabetes in diverse populations. Genome Med 2022;14:70. [DOI] [PMC free article] [PubMed] [Google Scholar]
- 15. Koyama S, Ito K, Terao C, et al. Population-specific and trans-ancestry genome-wide analyses identify distinct and shared genetic risk loci for coronary artery disease. Nat Genet 2020;52:1169–1177 [DOI] [PubMed] [Google Scholar]
- 16. Lloyd-Jones DM, Hong Y, Labarthe D, et al.; American Heart Association Strategic Planning Task Force and Statistics Committee . Defining and setting national goals for cardiovascular health promotion and disease reduction: the American Heart Association’s strategic Impact Goal through 2020 and beyond. Circulation 2010;121:586–613 [DOI] [PubMed] [Google Scholar]
- 17. Arnett DK, Blumenthal RS, Albert MA, et al. 2019 ACC/AHA guideline on the primary prevention of cardiovascular disease: executive summary: a report of the American College of Cardiology/American Heart Association task force on clinical practice guidelines. Circulation 2019;140:e563–e595 [DOI] [PMC free article] [PubMed] [Google Scholar]
- 18. Sattar N, Rawshani A, Franzén S, et al. Age at diagnosis of type 2 diabetes mellitus and associations with cardiovascular and mortality risks. Circulation 2019;139:2228–2237 [DOI] [PubMed] [Google Scholar]
- 19. Goodarzi MO, Rotter JI. Genetics insights in the relationship between type 2 diabetes and coronary heart disease. Circ Res 2020;126:1526–1548 [DOI] [PMC free article] [PubMed] [Google Scholar]
- 20. Zhao W, Rasheed A, Tikkanen E, et al.; CHD Exome+ Consortium; EPIC-CVD Consortium; EPIC-Interact Consortium; Michigan Biobank . Identification of new susceptibility loci for type 2 diabetes and shared etiological pathways with coronary heart disease. Nat Genet 2017;49:1450–1457 [DOI] [PMC free article] [PubMed] [Google Scholar]


