Abstract
Combination therapy with anti‐cytotoxic T lymphocyte‐associated protein 4 (CTLA‐4) and anti‐programmed death‐1 (PD‐1) monoclonal antibodies (mAbs) has dramatically improved the prognosis of patients with multiple types of cancer, including renal cell carcinoma (RCC). However, more than half of RCC patients fail to respond to this therapy. Regulatory T cells (Treg cells) are a subset of highly immunosuppressive CD4+ T cells that promote the immune escape of tumors by suppressing effector T cells in the tumor microenvironment (TME) through various mechanisms. CTLA‐4 is constitutively expressed in Treg cells and is regarded as a key molecule for Treg‐cell‐mediated immunosuppressive functions, suppressing antigen‐presenting cells by binding to CD80/CD86. Reducing Treg cells in the TME with an anti‐CTLA‐4 mAb with antibody‐dependent cellular cytotoxicity (ADCC) activity is considered an essential mechanism to achieve tumor regression. In contrast, we demonstrated that CTLA‐4 blockade without ADCC activity enhanced CD28 costimulatory signaling pathways in Treg cells and promoted Treg‐cell proliferation in mouse models. CTLA‐4 blockade also augmented CTLA‐4‐independent immunosuppressive functions, including cytokine production, leading to insufficient antitumor effects. Similar results were also observed in human peripheral blood lymphocytes and tumor‐infiltrating lymphocytes from patients with RCC. Our findings highlight the importance of Treg‐cell depletion to achieve tumor regression in response to CTLA‐4 blockade therapies.
Keywords: antibody‐dependent cell cytotoxicity, cytotoxic T‐lymphocyte‐associated antigen 4, immune checkpoint inhibitors, regulatory T cell, renal cell carcinoma
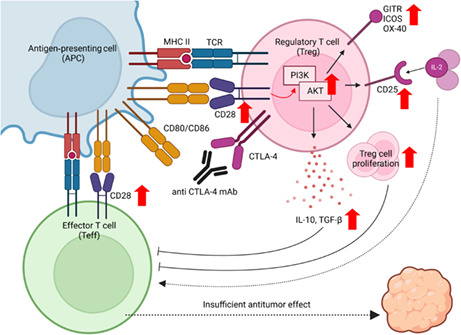
CTLA‐4 blockade without ADCC activity augments the proliferation and CTLA‐4‐independent immunosuppressive functions of Treg cells by enhancing CD28 costimulatory signaling pathways in Treg cells, leading to insufficient tumor regression. This figure was created with BioRender.com.
Abbreviations
- ADCC
antibody‐dependent cellular cytotoxicity
- APC
antigen‐presenting cell
- CFSE
carboxyfluorescein diacetate succinimidyl ester
- CTLA‐4
cytotoxic T lymphocyte‐associated protein 4
- FOXP3
forkhead box protein P3
- Fr
Fraction
- GITR
glucocorticoid‐induced tumor necrosis factor receptor‐related protein
- ICI
immune checkpoint inhibitor
- ICOS
inducible T‐cell co‐stimulator
- IL
interleukin
- LAP
latency‐associated peptide
- NK
natural killer
- OS
overall survival
- OVA
ovalbumin
- PD‐1
programmed death‐1
- PD‐L1
programmed death ligand‐1
- RCC
renal cell carcinoma
- Tconv cells
conventional CD4+ cells
- TGF‐β
transforming growth factor‐beta
- TIL
tumor‐infiltrating lymphocyte
- TME
tumor microenvironment
- Treg cell
regulatory T cell
1. INTRODUCTION
In 2020, over 430,000 individuals were newly diagnosed with RCC, and more than 170,000 patients died from RCC worldwide. 1 The median OS of patients with metastatic RCC was less than 20 months before the ICI era. 2 , 3 ICIs such as anti‐PD‐1, anti‐PD‐L1 mAbs, or combination therapies with anti‐CTLA‐4 mAbs have shown significant antitumor effects and greatly prolonged the OS of patients with various cancer types, including metastatic RCC. 3 , 4 , 5 , 6 , 7 , 8 Compared with molecular targeted therapies, combination therapy with anti‐PD‐1 mAb and anti‐CTLA‐4 mAb prolonged OS with a hazard ratio for death of 0.63. 4 However, more than half of RCC patients fail to respond to this combination therapy, and there is an urgent need to elucidate the detailed mechanisms and identify predictive biomarkers. 4
Immune checkpoint inhibitors exert antitumor effects by reactivating dysfunctional effector T cells. 9 , 10 In addition to this mechanism of direct activation, anti‐CTLA‐4 mAbs reportedly suppress Treg cells. 10 Treg cells, a subset of highly immunosuppressive CD4+ T cells that express the master regulatory transcription factor FOXP3, are characterized by constitutively higher expression of CTLA‐4 than Tconv cells or CD8+ T cells. 11 Treg cells contribute to maintaining immune homeostasis and protecting hosts from allergic diseases or autoimmune diseases. 12 However, in the TME, Treg cells promote the immune escape of tumors by suppressing antitumor immunity through various pathways: suppression of APCs via CTLA‐4, secretion of immunosuppressive cytokines such as IL‐10 and TGF‐β, and consumption of IL‐2. 12 , 13 , 14 Among these pathways, APC suppression via CTLA‐4 is regarded as a key mechanism of Treg‐cell‐mediated immunosuppression, and a previous study demonstrated that Treg‐cell‐specific deletion of CTLA‐4 in mice evoked the systemic hyperproliferation of Tconv cells, resulting in fatal autoimmune disorders. 15
The binding of CD28 on T cells to CD80 or CD86 on APCs results in the costimulation of T‐cell functions, including T‐cell proliferation, cytokine production, and survival. 16 In contrast, CTLA‐4 also binds to CD80/CD86 with higher affinity and avidity than to CD28. 11 Therefore, CTLA‐4 in T cells competes with CD28 to bind CD80/CD86 and acts as an antagonist of CD28‐mediated costimulation. Furthermore, CTLA‐4 in Treg cells binds to CD80/CD86 on APCs and removes CD80/86 from APCs by trans‐endocytosis and trogocytosis, resulting in APC suppression. 11 , 17 , 18 , 19 Thus, an anti‐CTLA‐4 mAb is considered to exert its antitumor effect in two main ways: by increasing CD28 costimulation of activated effector T cells and by blocking the CTLA‐4‐mediated suppressive function of Treg cells.
However, some previous studies have shown that both CTLA‐4 blockade and Treg‐cell depletion via the ADCC activity of NK cells and/or macrophages are indispensable for tumor regression. 20 , 21 , 22 Our previous studies demonstrated that PD‐1 blockade or deficiency promotes proliferation and activates PD‐1+ Treg cells. 23 , 24 Other studies have also shown that CTLA‐4 loss or blockade leads to CD28‐dependent Treg‐cell hyperproliferation. 25 , 26 , 27 , 28 However, how CD28 stimulation affects the immunosuppressive functions of Treg cells in the TME has not been fully demonstrated. 29 , 30 Here, we evaluated the expression of CTLA‐4 and CD28 in various T cells including Treg cells in the TME and detailed effects of CTLA‐4 blockade without ADCC activity on Treg‐cell‐mediated immunosuppressive functions via CD28 costimulation using both mouse models and human clinical samples.
2. MATERIALS AND METHODS
2.1. Murine tumor models
BALB/c (6–8‐week‐old females; SLC Japan) or C57BL/6 mice (6–8‐week‐old females; SLC Japan) were subcutaneously injected with RENCA (2 × 10⁵) or OVA‐overexpressing LL2 (LL2‐OVA) (5 × 10⁵) cells in 100 μL PBS, respectively. Tumor volume was calculated as length × width2 × 0.5. When tumors reached an average volume of approximately 50 mm3, mice were randomized into several groups (Day 0). Anti‐CTLA‐4 IgG2a mAb (clone 9D9, Absolute Antibody Ltd.), anti‐CTLA‐4 IgG2a Fc‐silent mAb (clone 9D9, Absolute Antibody Ltd.), and control isotype‐matched mAb were administered intraperitoneally three times at an interval of 3 days at 100 μg per dose in a volume of 100 μL. To analyze TILs, tumors were harvested on Day 7 including both regressed and progressed tumors in treated groups, and extracted TILs were subjected to flow cytometry.
2.2. Patients and samples
Patients with RCC who underwent surgical resection at Okayama University Hospital in 2022 were enrolled in this study. Fresh tumor samples were subjected to TIL analysis. Peripheral blood samples were obtained from healthy volunteers. All participants provided written informed consent, and this study was approved by the Institutional Review Board of Okayama University Hospital and was conducted in accordance with ethics guidelines, including the Declaration of Helsinki.
To collect TILs, tumor tissues were minced and treated with TTDR reagent (BD Biosciences) as previously reported. 31 PBMCs were isolated by density gradient centrifugation with Lymphocyte Separation Solution (Nakalai Tesque).
2.3. Proliferation assay for human Treg cells
CD4+CD25+ Treg cells were sorted from PBMCs of healthy donors using a CD4+CD25+ Regulatory T cell Isolation Kit (Miltenyi Biotec) and labeled with CFSE (Thermo Fisher Scientific) according to the manufacturer's instructions. In total, 2 × 10⁵ CFSE‐labeled Treg cells were cultured in the presence of human recombinant IL‐2 (20 IU/mL, PeproTech), anti‐CD3 mAb (2.5 μg/mL, clone OKT3, BD Biosciences), and human recombinant B7‐1/CD80 Fc chimera protein (soluble CD80 protein, 5.0 μg/mL, R&D Systems) 32 with or without anti‐CTLA‐4 mAb (Ipilimumab biosimilar, Bio X Cell). Cell proliferation was evaluated 3 days later by flow cytometry to assess the dilution of CFSE‐labeled cells.
2.4. Treg‐cell culture assay
Treg cells were sorted from PBMCs or TILs using a CD4+CD25+ Regulatory T cell Isolation Kit (Miltenyi Biotec) and were cultured with or without anti‐CTLA‐4 mAb in the presence of IL‐2 (20 IU/mL), anti‐CD3 mAb (2.5 μg/mL) and CD80 soluble protein (2.5, 5.0, 10, or 20 μg/mL) for 72 or 24 h. Subsequently, the samples were subjected to flow cytometry.
2.5. Suppression assay
CD4+CD25+ Treg cells and CD8+ T cells were sorted from PBMCs of healthy donors using a CD4+CD25+ Regulatory T cell Isolation Kit and MojoSort™ Human CD8 T Cell Isolation Kit (BioLegend), respectively. CFSE‐labeled (1 μM) responder CD8+ T cells (1 × 10⁴ cells) from PBMCs were cocultured with or without unlabeled Treg cells in the presence of IL‐2 (20 IU/mL), anti‐CD3 mAb (2.5 μg/mL), and CD80 soluble protein (5.0 μg/mL). Anti‐CTLA‐4 mAb or control isotype‐matched mAb was added to some wells. Proliferation was assessed 5 days later by the dilution of CFSE‐labeled cells using flow cytometry.
2.6. In vitro analysis of phosphorylation
Sorted Treg cells from PBMCs were incubated with or without anti‐CTLA‐4 mAb in the presence of anti‐CD3 mAb (5.0 μg/mL) for 30 min on ice, followed by 30 min of incubation with or without CD80 soluble protein (5.0 μg/mL). T cells were then transferred to 37°C for stimulation for 30 min and subjected to flow cytometry.
2.7. Flow cytometry analysis
Single‐cell suspensions were first incubated with Fc‐block (mouse: clone 2.4G2, BD Biosciences, human: polyclonal antibody, Thermo Fisher Scientific) and then stained with mAbs specific for cell surface antigens, and with Live/Dead cell viability dye. After staining for cell surface markers, the cells were intracellularly stained with FoxP3 staining buffer (Thermo Fisher Scientific) according to the manufacturer's instructions. After washing, the cells were analyzed with BD LSRFortessa™ X‐20 (BD Biosciences) and FlowJo software (BD Biosciences). For the analysis of phosphorylation, stimulated cells were fixed using FoxP3 staining buffer (Thermo Fisher Scientific), permeabilized with methanol according to the manufacturer's instructions and stained with mAbs. For the analysis of anti‐CTLA‐4 mAb‐binding Treg cells, we used Alexa Fluor 647‐conjugated anti‐human IgG‐Fc mAb as a secondary antibody after staining with ipilimumab. Staining antibodies were diluted according to the manufacturer's instructions. Detailed information on the antibodies is provided in Table S1.
2.8. Statistical analysis
The relationships of continuous variables among groups were compared using t‐tests or one‐way ANOVA. For multiple tests, Bonferroni corrections were used. The relationships between tumor volume curves were compared using two‐way ANOVA. All statistical analyses were performed using PRISM 9.3 software (GraphPad Software). All tests were two‐tailed, and a p‐value < 0.05 was considered to indicate statistical significance.
3. RESULTS
3.1. Anti‐CTLA‐4 mAb reduces Treg cells in TILs by ADCC activity and exerts antitumor activity
To evaluate differences in the antitumor effects of anti‐CTLA‐4 mAbs related to ADCC activity, we tested two types of anti‐CTLA‐4 IgG2a mAbs in mouse models: anti‐CTLA‐4 9D9‐IgG2a mAb with ADCC activity (anti‐CTLA‐4 IgG2a mAb) and anti‐CTLA‐4 9D9‐IgG2a mAb with a mutation in the Fc domain to abolish ADCC activity (anti‐CTLA‐4 IgG2a Fc‐silent mAb). 21 As a result, anti‐CTLA‐4 IgG2a mAb showed dramatic efficacy, whereas treatment with anti‐CTLA‐4 IgG2a Fc‐silent led to relatively limited tumor regression (Figure 1A; Figure S1). 21
FIGURE 1.
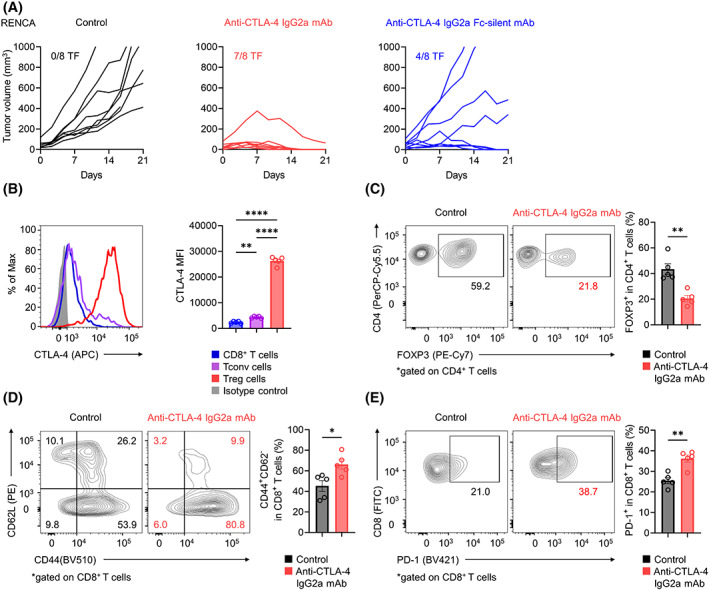
Anti‐CTLA‐4 mAb with ADCC activity and antitumor effects. (A) In vivo efficacy of various anti‐CTLA‐4 mAbs against RENCA tumors. BALB/c mice were injected subcutaneously with RENCA cells (2 × 10⁵). When the average tumor volume reached 50 mm3 (Day 0), various anti‐CTLA‐4 mAbs or control mAb was administered on Days 0, 3, and 6. Each tumor growth curve is shown according to the indicated groups. The number of tumor‐free (TF) mice per group is shown for each group. (B–E) CTLA‐4 expression, Treg cells, CD44+CD62L−CD8+ effector T cells, and PD‐1+CD8+ T cells in TILs. In vivo experiments were performed as described in (A). TILs were collected on Day 7 and subjected to flow cytometry. Representative flow cytometry staining (left) and summary data (right) of the mean fluorescence intensity (MFI) for CTLA‐4 in tumor‐infiltrating CD8+ T cells, Tconv cells, and Treg cells in the control group (B) and the frequencies of Treg cells (C), CD44+CD62L−CD8+ effector T cells (D), and PD‐1+CD8+ T cells (E) in TILs are shown. All in vivo experiments were performed in duplicate with similar results. One‐way ANOVA with the Bonferroni correction was used in (B). Unpaired t‐tests were used in (C–E). Bars, mean; error bars, SEM; *p < 0.05; **p < 0.01; ****p < 0.0001.
To address the effects of CTLA‐4 blockade with ADCC activity in vivo, we examined the kinetic changes in immune cells among TILs from the RENCA tumor model. Treg cells in the TME highly expressed CTLA‐4 compared with FOXP3−CD4+ Tconv cells or CD8+ T cells (Figure 1B). Accordingly, compared with the control, anti‐CTLA‐4 IgG2a mAb treatment resulted in a significant decrease in the frequency of tumor‐infiltrating Treg cells and a significant increase in the frequencies of CD44+CD62L−CD8+ effector T cells and PD‐1+CD8+ T cells in TILs (Figure 1C–E). These findings, in accordance with previous findings, show that the anti‐CTLA‐4 mAb with ADCC activity exerts antitumor effects by activating effector T cells and reducing Treg cells in the TME. 21 , 25
3.2. CTLA‐4 blockade without ADCC activity increased the proliferation, cytokine production, and expression of activation markers of Treg cells in the TME
As anti‐CTLA‐4 IgG2a Fc‐silent mAb, unlike anti‐CTLA‐4 IgG2a mAb, failed to induce complete tumor regression in mouse models, we conducted additional TIL analyses using the RENCA tumor model to assess the effects of CTLA‐4 blockade without ADCC activity. Anti‐CTLA‐4 Fc‐silent mAb also increased the frequencies of CD8+ effector T cells and PD‐1+CD8+ T cells and increased APC maturation, whereas the levels of increase were relatively low compared with those seen with anti‐CTLA‐4 IgG2a mAb (Figure 2A–C). In addition, Treg cells in the TME were not decreased but rather were slightly increased by anti‐CTLA‐4 IgG2a Fc‐silent mAb, and the expression of Ki67, a proliferation marker, was also increased (Figure 2D; Figure S2A). Moreover, the production of immunosuppressive cytokines such as LAP (the propeptide of TGF‐β) and IL‐10 also increased (Figure 2E,F). 33 Activation markers of Treg cells, such as GITR, ICOS, OX‐40, and CD25, also showed increased expression in the anti‐CTLA‐4 IgG2a Fc‐silent mAb treatment group (Figure 2G,H; Figure S2B,C). 17 Anti‐CTLA‐4 IgG2a mAb also affected surviving Treg cells in the TME (Figure S3). These results suggest that CTLA‐4 blockade without ADCC activity augments Treg‐cell proliferation and CTLA‐4‐independent Treg‐cell‐mediated immunosuppressive functions, which could disturb antitumor activities.
FIGURE 2.
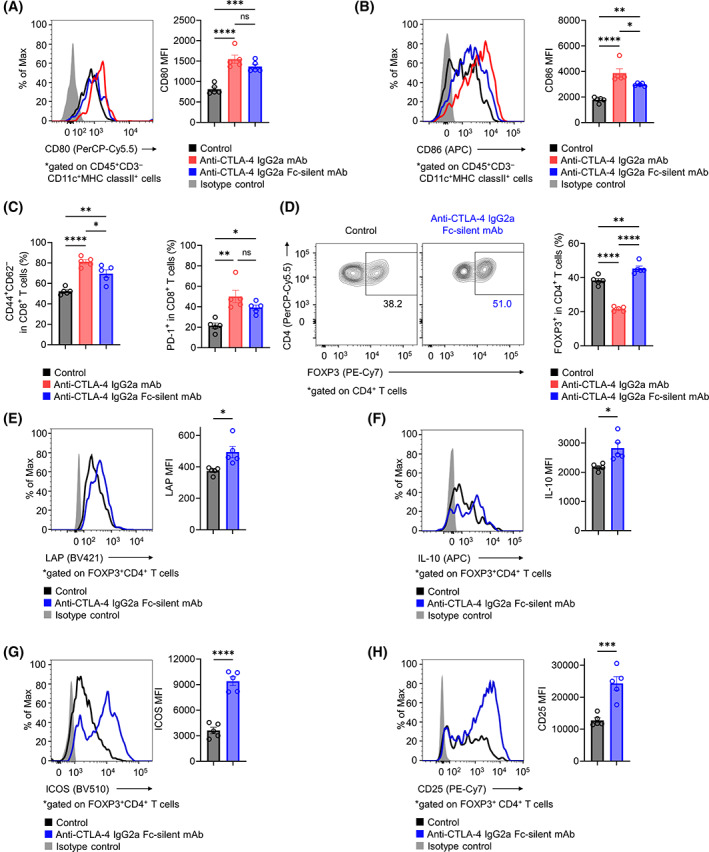
Influence of an anti‐CTLA‐4 mAb without ADCC activity on the TME. (A, B) CD80 and CD86 expression in APCs of TILs. BALB/c mice were injected subcutaneously with RENCA cells (2 × 10⁵). When the average tumor volume reached 50 mm3 (Day 0), various anti‐CTLA‐4 mAbs or control mAb was administered on Days 0, 3, and 6. TILs were collected on Day 7 and subjected to flow cytometry. Representative flow cytometry staining (left) and summary data of the mean fluorescence intensity (MFI) (right) for CD80 (A) and CD86 (B) in APCs of TILs are shown. (C) The frequencies of CD8+ effector T cells and PD‐1+CD8+ T cells in TILs. In vivo experiments were performed as described in (A) and (B). Summary data are shown (left, CD44+CD62L−CD8+ effector T cells; right, PD‐1+CD8+ T cells). (D) The frequencies of Treg cells in TILs. In vivo experiments were performed as described in (A) and (B). Representative flow cytometry staining (left) and summary data (right) are shown. (E–H) Immunosuppressive cytokines and activation markers in tumor‐infiltrating Treg cells. In vivo experiments were performed as described in (A) and (B). Representative flow cytometry staining (left) and summary data of the MFI for LAP (E), IL‐10 (F), ICOS (G), and CD25 (H) are shown. All in vivo experiments were performed in duplicate with similar results. One‐way ANOVA with the Bonferroni correction was used in (A–D). Unpaired t‐tests were used in (E–H). Bars, mean; error bars, SEM; ns, not significant; *p < 0.05; **p < 0.01; ***p < 0.001; ****p < 0.0001.
3.3. CTLA‐4hi Treg cells in TILs highly express CD28
While CTLA‐4 shows immunosuppressive activity by competing with CD28 to bind CD80/CD86 and acts as an antagonist of CD28‐mediated costimulation, CD28 also plays an important role in Treg‐cell activation. 10 Thus, we hypothesized that CD28 expressed in Treg cells further enhances Treg‐cell activation due to CTLA‐4 blockade without ADCC activity because CD28 can bind free CD80/CD86 after CTLA‐4 blockade. Thus, we examined CD28 expression in T cells from RENCA TILs. CD28 expression was significantly higher in Treg cells than in Tconv cells or CD8+ T cells (Figure 3A). Moreover, CD28 expression was higher in CTLA‐4hi Treg cells than in CTLA‐4lo Treg cells (Figure 3B).
FIGURE 3.
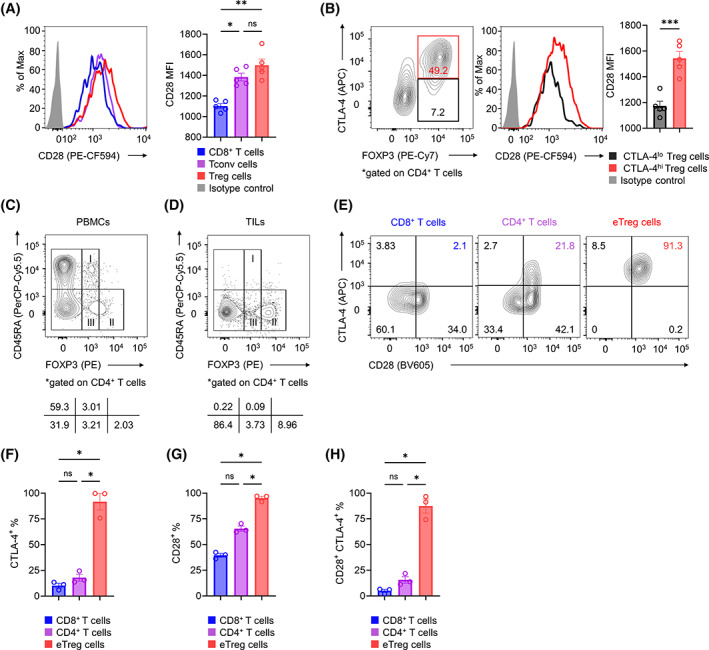
CTLA‐4 and CD28 coexpression in tumor‐infiltrating Treg cells. (A) CD28 expression in tumor‐infiltrating CD8+ T, Tconv, and Treg cells. BALB/c mice were subcutaneously injected with RENCA cells (2 × 10⁵). TILs were collected on Day 7 and subjected to flow cytometry. Representative flow cytometry staining (left) and summary data of the mean fluorescence intensity (MFI) for CD28 (right) are shown. (B) CD28 expression in tumor‐infiltrating Treg cells according to CTLA‐4 expression. In vivo experiments were performed as described in (A). The gating strategy for CTLA‐4hi and CTLA‐4lo Treg cells (left), representative flow cytometry staining (middle), and summary data of the MFI for CD28 (right) are shown. (C, D) Fractionation of CD4+ T cells from human PBMCs and TILs. RCC tumors from three patients were minced to collect TILs. PBMCs from healthy donors or RCC TILs were subjected to flow cytometry, and CD4+FOXP3+ T cells were fractionated into three subsets using FOXP3 and CD45RA. Representative flow cytometry staining of PBMCs (C) and TILs (D) are shown. (E–H) CD28 and CTLA‐4 expression in CD8+ T, CD4+ T, and eTreg cells from human RCC TILs. Flow cytometry was performed as described in (C) and (D). Representative flow cytometry staining (E) and the frequencies of CTLA‐4+ (F), CD28+ (G), and CD28+CTLA‐4+ cells (H) in TILs are shown. All in vivo experiments were performed in duplicate with similar results. One‐way ANOVA with the Bonferroni correction was used in (A) and (F–H). A paired t‐test was used in (B). Bars, mean; error bars, SEM; ns, not significant; *p < 0.05; **p < 0.01; ***p < 0.001.
We next investigated human Treg cells. As human naive CD4+ T cells transiently upregulate FOXP3 expression upon TCR stimulation, FOXP3+ T cells in humans comprise suppressive Treg cells and nonsuppressive Tconv cells. 34 Therefore, we fractionated FOXP3+CD4+ T cells into three subsets based on their expression levels of the naive T‐cell markers CD45RA and FOXP3: Fr I, naive Treg cells (CD45RA+FOXP3lowCD4+) with weak immunosuppressive function; Fr II, effector Treg (eTreg) cells (CD45RA−FOXP3highCD4+) with strong immunosuppressive function; and Fr III, non‐Treg cells (CD45RA−FOXP3lowCD4+) with no immunosuppressive function (Figure 3C). 13 , 17 , 31 , 35 , 36 We focused on Fr II eTreg cells as they are the predominant FOXP3+CD4+ T cells among TILs in various cancers (Figure 3D). 13 , 17 Fresh tumor samples were obtained from three patients with RCC for this analysis. As was observed in the mouse model, this analysis showed that eTreg cells in RCC TILs had significantly higher expression of CTLA‐4 and CD28 than did CD4+ or CD8+ T cells, and these factors were highly coexpressed in eTreg cells (Figure 3E–H). Collectively, Treg cells, particularly the CTLA‐4hi population, highly express CD28, which is consistent with activated CTLA‐4‐independent Treg‐cell‐mediated immunosuppression by CTLA‐4 blockade without ADCC activity.
3.4. Anti‐CTLA‐4 mAb without ADCC activity augments the proliferation and CTLA‐4‐independent immunosuppressive functions of Treg cells via enhanced CD28 costimulation
We next examined the activation status of Treg cells from human PBMCs in the context of CTLA‐4 blockade. We used Treg cells isolated from PBMCs for the following analysis to avoid Treg‐cell depletion due to the anti‐CTLA‐4 mAb with ADCC activity. We also used an anti‐CD3 mAb and soluble CD80 protein for Treg‐cell stimulation. We used a lower concentration of soluble CD80 protein (5.0 μg/mL) than that with saturated effects (Figure S4A), at which Treg cells were activated (Figure S5). Upon treatment with anti‐CTLA‐4 mAb, the proliferation of eTreg cells increased, as evaluated by CFSE dilution (Figure 4A). In addition, eTreg cells treated with CTLA‐4 blockade produced higher levels of immunosuppressive cytokines (LAP and IL‐10) and showed higher expression of GITR, ICOS, OX40, and CTLA‐4 (Figure 4B–F; Figure S6A). Accordingly, GITR, ICOS, and OX40 expression increased in CTLA‐4+ Treg cells, but not in CTLA‐4− Treg cells, after CTLA‐4 blockade (Figure S6B–G). The suppressive function was retained even with CTLA‐4 blockade despite decreased function (Figure S7). These results collectively indicated that CTLA‐4 blockade without ADCC activity augments the proliferation and CTLA‐4‐independent immunosuppressive functions of Treg cells in humans.
FIGURE 4.
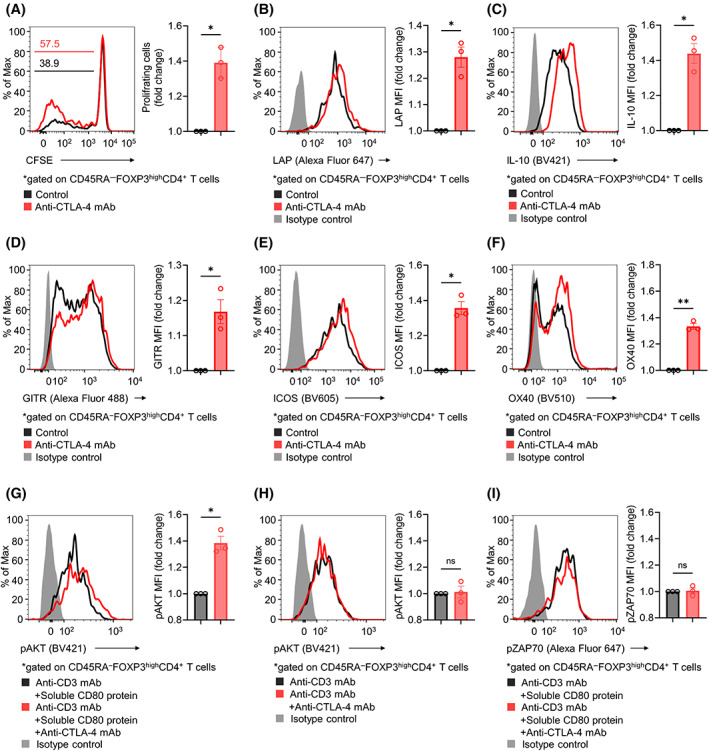
Influence of CTLA‐4 blockade on Treg cells in human PBMCs. (A) Proliferation of Treg cells in human PBMCs. CD4+CD25+ Treg cells were sorted from healthy donor PBMCs and subsequently labeled with CFSE. In total, 2 × 10⁵ CFSE‐labeled Treg cells were cultured in the presence of IL‐2, anti‐CD3 mAb, and soluble CD80 protein with or without anti‐CTLA‐4 mAb. Three days later, cell proliferation based on CFSE dilution was assessed by flow cytometry. The fold change in the frequency of proliferating Treg cells was calculated. Representative flow cytometry staining (left) and summary data (right) are shown. (B–F) Immunosuppressive cytokines and activation markers in Treg cells from human PBMCs. In vitro experiments were performed as described in (A). The cytokines and activation markers were analyzed with flow cytometry, and the fold change in mean fluorescence intensity (MFI) was calculated. Representative flow cytometry staining (left) and summary data (right) for LAP (B), IL‐10 (C), GITR (D), ICOS (E), and OX40 (F) are shown. (G–I) Phosphorylation of AKT and ZAP70 in Treg cells. Sorted Treg cells from healthy donor PBMCs were incubated with or without anti‐CTLA‐4 mAb in the presence of an anti‐CD3 mAb for 30 min on ice, followed by 30 min of incubation with or without soluble CD80 protein. T cells were then transferred to 37°C for stimulation for 30 min and subjected to flow cytometry, and the fold change in MFI was calculated. Representative flow cytometry staining (left) and summary data (right) for pAKT with (G) or without (H) soluble CD80 protein and of pZAP70 (I) are shown. Paired t‐tests were used. Bars, mean; error bars, SEM; ns, not significant; *p < 0.05; **p < 0.01.
To investigate the effect of CTLA‐4 blockade on the CD28 and TCR signaling pathways in Treg cells, we examined whether CTLA‐4 blockade affects the phosphorylation of AKT and ZAP70, which are downstream of the CD28 and TCR signaling pathways, respectively. Upon CD28 and TCR stimulation with soluble CD80 protein and anti‐CD3 mAb, respectively, CTLA‐4 blockade increased the phosphorylation of AKT in Treg cells (Figure 4G). In contrast, in the absence of soluble CD80 protein, CTLA‐4 blockade showed no such activity (Figure 4H). In addition, CTLA‐4 blockade showed no significant effect on the phosphorylation of ZAP70 (Figure 4I). When we used higher concentrations of soluble CD80 protein (10 or 20 μg/mL) with saturated effects, CTLA‐4 blockade did not affect Treg cells (Figure S4B). Taken together, CTLA‐4 blockade without ADCC activity could augment CD28‐mediated costimulation of CD28+CTLA‐4+ Treg cells by disrupting CTLA‐4‐competitive inhibition.
3.5. CTLA‐4 blockade without ADCC activity increases immunosuppressive cytokine production and activation markers by Treg cells among human RCC TILs
Finally, to confirm whether activated CTLA‐4‐independent Treg‐cell‐mediated suppression by CTLA‐4 blockade can be observed in tumor‐infiltrating eTreg cells from human clinical samples, we conducted ex vivo assays using fresh TILs from RCC patients. We used isolated Treg cells from TILs for the following analysis similar to the use of PBMCs. Consistently, anti‐CTLA‐4 mAb increased the production of immunosuppressive cytokines and activation markers by Treg cells (Figure 5A–E). We also analyzed FOXP3loCD4+ T cells (Fr III) in TILs, resulting in lower coexpression of CTLA‐4 and CD28 than eTreg cells (Figure S8A–C). Thus, anti‐CTLA‐4 mAb had little effect on Fr III (Figure S8D–F). Altogether, CTLA‐4 blockade without ADCC activity augments CTLA‐4‐independent Treg‐cell‐mediated immunosuppressive functions, which could disturb antitumor activities, leading to insufficient tumor regression (Figure 6).
FIGURE 5.
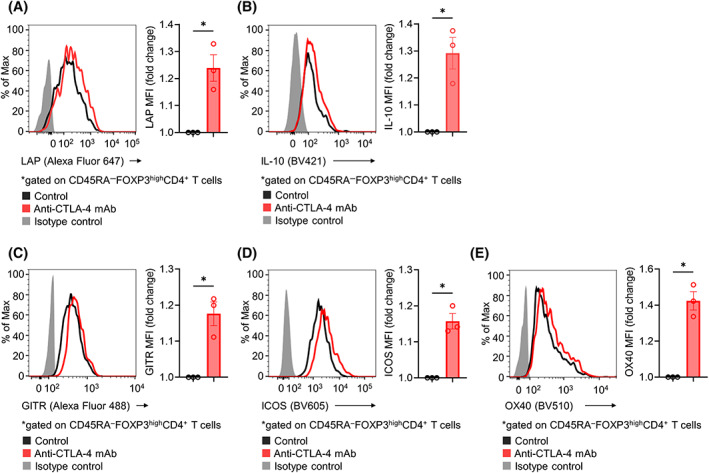
Influence of CTLA‐4 blockade on Treg cells in human RCC TILs. RCC tumors from three patients were minced to collect TILs. Sorted CD4+CD25+ Treg cells were cultured in the presence of IL‐2, anti‐CD3 mAb, and soluble CD80 protein with or without anti‐CTLA‐4 mAb for 24 h and were subsequently analyzed with flow cytometry. The fold change in mean fluorescence intensity (MFI) was calculated. Representative flow cytometry staining (left) and summary data (right) for LAP (A), IL‐10 (B), GITR (C), ICOS (D), and OX40 (E) are shown. Paired t‐tests were used. Bars, mean; error bars, SEM; ns, not significant; *p < 0.05.
FIGURE 6.
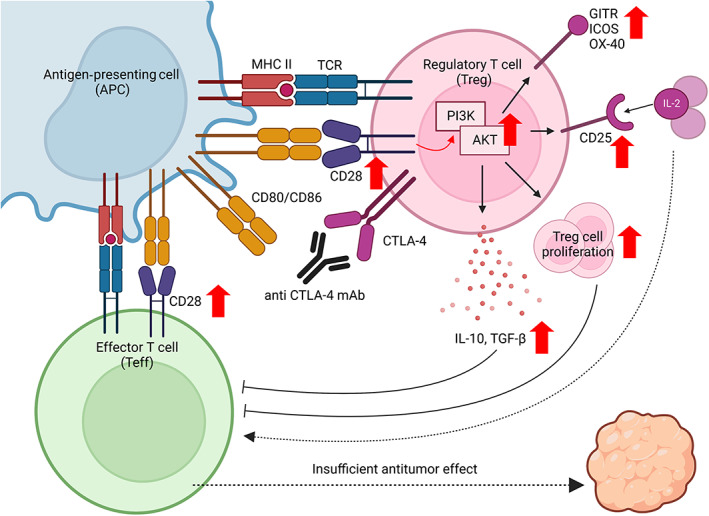
CTLA‐4 blockade without ADCC activity augments the proliferation and CTLA‐4‐independent immunosuppressive functions of Treg cells by enhancing CD28 costimulatory signaling pathways in Treg cells, leading to insufficient tumor regression. This figure was created using BioRender.com.
4. DISCUSSION
This study examined how CTLA‐4 blockade without ADCC activity affects Treg cells, the TME, and tumor regression. 21 CTLA‐4 blockade with ADCC activity showed dramatic efficacy against mouse tumors with a reduction in Treg cells in the TME, as was previously reported. Treg cells, particularly the CTLA‐4hi population, highly expressed CD28, and anti‐CTLA‐4 mAb treatment augmented the CD28‐mediated costimulation of CD28+CTLA‐4+ Treg cells. Through this mechanism, CTLA‐4 blockade without ADCC activity increased Treg‐cell proliferation and CTLA‐4‐independent Treg‐cell‐mediated immunosuppressive functions, which could disturb antitumor immunity. These findings highlight the importance of Treg‐cell depletion for tumor regression by anti‐CTLA‐4 mAbs.
Previous mouse studies have demonstrated that anti‐CTLA‐4 IgG2a mAb depletes Treg cells by ADCC activity with strong antitumor effects. 20 , 21 Another study showed that patients with melanoma who responded to anti‐CTLA‐4 mAb had reduced Treg cells in the TME after the treatment. 37 Moreover, anti‐CTLA‐4 mAbs were more effective in patients with melanoma who have FcγR variants that enhance ADCC activity than in those who did not. 38 These findings, in accordance with our observations in mouse models, suggest that reducing Treg cells through ADCC activity is potentially a crucial mechanism by which anti‐CTLA‐4 mAbs achieve tumor regression. Conversely, CTLA‐4 is known to be a fundamental immunosuppressive molecule of Treg cells, leading to the suppression of APCs, and CTLA‐4 blockade could also exert antitumor activity by suppressing Treg cells and inducing the maturation of APCs. 11 , 17 , 18 The reason why it is important to reduce Treg cells through ADCC activity, not just by blocking CTLA‐4, to achieve tumor regression is not fully understood. Our data from mouse models showed that anti‐CTLA‐4 mAbs with or without ADCC activity increased APC maturation. However, CTLA‐4 blockade without ADCC activity has shown insufficient antitumor effects with tumor‐infiltrating Treg‐cell proliferation, rather than a reduction. 39 Moreover, in addition to Treg‐cell proliferation, CTLA‐4 blockade without ADCC activity augmented the CTLA‐4‐independent immunosuppressive functions of Treg cells both in vivo and in vitro. These results are explained by CTLA‐4 functioning as an antagonist of CD28. In our data, CD28 and CTLA‐4 were more highly expressed in Treg cells than in Tconv cells or CD8+ T cells, and these factors were highly coexpressed in Treg cells. Moreover, CTLA‐4 blockade increased the phosphorylation of AKT in Treg cells downstream of CD28 signaling pathways. Taken together, CTLA‐4 blockade without ADCC activity augmented CD28‐mediated costimulatory signaling pathways in Treg cells, leading to Treg‐cell proliferation and activated CTLA‐4‐independent Treg‐cell‐mediated immunosuppressive functions. These negative effects could disrupt antitumor immunity, leading to insufficient tumor regression (Figure 6).
Paterson et al. 28 showed that conditional CTLA‐4 knockout in Treg cells increased their production of IL‐10 in the TME. Additionally, Marangoni et al. showed that CTLA‐4 blockade or depletion enhanced the CD28‐mediated costimulation of Treg cells, resulting in the hyperproliferation of Treg cells. 25 However, the detailed mechanisms remain unclear, and whether CTLA‐4‐independent immunosuppressive functions are activated by CTLA‐4 blockade without ADCC activity in the human TME has not been conclusively demonstrated. In our present study, Treg‐cell proliferation and CTLA‐4‐independent Treg‐cell‐mediated suppressive functions were clearly augmented in the TME under CTLA‐4 blockade without ADCC activity via CD28‐mediated costimulation, leading to insufficient antitumor effects. In particular, direct suppressive functions of Treg cells even with CTLA‐4 blockade, were demonstrated, despite decreased functions, in suppression assays. This could be reasonable because CTLA‐4 plays an important role in Treg‐cell‐mediated immunosuppressive functions, but CTLA‐4‐independent immunosuppression, such as cytokine production by Treg cells remains. In addition, we validated these findings using ex vivo experiments with human RCC TILs. These novel findings have not been previously reported, which we demonstrated for the first time in this study.
Our present study highlights the importance of Treg‐cell depletion for CTLA‐4 blockade‐mediated antitumor immunity. Ipilimumab, an anti‐CTLA‐4 mAb with an IgG1 Fc portion and known ADCC activity, 37 is reportedly effective against various cancer types, including metastatic RCC, in combination with PD‐1 blockade. 4 , 5 , 6 , 7 , 8 Tremelimumab, another anti‐CTLA‐4 mAb with an IgG2 Fc portion, is also reported to have ADCC activity, 38 , 40 and recent clinical trials have demonstrated its efficacy combined with PD‐1 blockade against lung cancer and hepatocellular carcinoma. 41 , 42 In addition, various anti‐CTLA‐4 mAbs with enhanced ADCC activity are now under development to improve efficacy with greater Treg‐cell depletion. 43 , 44
In summary, we have demonstrated that CTLA‐4 blockade without ADCC activity augments Treg‐cell proliferation and CTLA‐4‐independent Treg‐cell‐mediated immunosuppressive functions via CD28‐mediated costimulatory signaling pathways in both the human and murine TME. This activation could disturb antitumor immunity, leading to insufficient tumor regression in response to an anti‐CTLA‐4 mAb without ADCC activity. Our study has several limitations. In particular, we could not examine the relationship between the reduction in Treg cells and the prognosis of patients treated with anti‐CTLA‐4 mAbs. Instead, we performed ex vivo experiments using human RCC TILs. These results highlight the importance of Treg‐cell depletion to achieve tumor regression in response to CTLA‐4 blockade therapy and support the development of more effective anti‐CTLA‐4 mAbs with enhanced ADCC activity.
AUTHOR CONTRIBUTIONS
TW: Data curation; Formal analysis; Investigation; Visualization; Writing – original draft. TI: Investigation; Formal analysis; Writing – review & editing. YU: Investigation; Writing – review & editing. JN: Writing – review & editing. TS: Resources; Writing – review & editing. HD: Writing – review & editing. MA: Resources; Supervision; Writing – review & editing. YT: Conceptualization; Funding acquisition; Methodology; Project administration; Resources; Validation; Writing – review & editing.
FUNDING INFORMATION
This study was supported by Grants‐in‐Aid for Scientific Research (B grant no. 20H03694 [YT] and Challenging Exploratory Research no. 22K1945904 [YT]) from the Japan Society for the Promotion of Science (JSPS); the Project for Cancer Research and Therapeutic Evolution (P‐CREATE, no. 21cm0106383 [YT]); Practical Research for Innovative Cancer Control (22ck0106723h0001 [YT]) from the Japan Agency for Medical Research and Development (AMED); the Fusion Oriented Research for disruptive Science and Technology (FOREST, no. 21‐211033868 [YT]) from Japan Science and Technology Agency (JST); the Naito Foundation (YT); the Takeda Science Foundation (YT); the MSD Life Science Foundation (YT); the Senri Life Science Foundation (YT); the Japan Respiratory Foundation (YT); the Research Grant of the Princess Takamatsu Cancer Research Fund (YT); the Kato Memorial Bioscience Foundation (YT); the Ono Medical Research Foundation (YT); the Inamori Foundation (YT); The Ube Industries Foundation (YT); The Wesco Foundation (YT); The Pharmacology Research Foundation (YT).
CONFLICT OF INTEREST STATEMENT
YT received research grants from KOTAI Biotechnologies, Daiichi‐Sankyo, Ono Pharmaceutical, Bristol‐Myers Squibb, and KORTUC, and honoraria from Ono Pharmaceutical, Bristol‐Myers Squibb, AstraZeneca, Chugai Pharmaceutical, and MSD outside of this study. All other authors declare that they have no competing financial interests. Yosuke Togashi, the corresponding author for this study, is the Associate Editor of Cancer Science.
ETHICS STATEMENT
Approval of the research protocol by an Institutional Reviewer Board: This study was approved by the Okayama University Institutional Review Board prior to initiation (Registration no. K2110‐004 and K2203‐025).
Informed Consent: N/A.
Registry and the Registration No. of the study/trial: N/A.
Animal Studies: All animal experiments were reviewed and approved by Institutional Animal Care and Research Advisory Committee, Okayama University.
Supporting information
Figure S1.
Figure S2.
Figure S3.
Figure S4.
Figure S5.
Figure S6.
Figure S7.
Figure S8.
Table S1.
ACKNOWLEDGMENTS
We would like to thank S. Nakata, M. Iwado, Y. Nishimori, and R. Inukai for their technical and administrative assistance.
Watanabe T, Ishino T, Ueda Y, et al. Activated CTLA‐4‐independent immunosuppression of Treg cells disturbs CTLA‐4 blockade‐mediated antitumor immunity. Cancer Sci. 2023;114:1859‐1870. doi: 10.1111/cas.15756
REFERENCES
- 1. Sung H, Ferlay J, Siegel RL, et al. Global cancer statistics 2020: GLOBOCAN estimates of incidence and mortality worldwide for 36 cancers in 185 countries. CA Cancer J Clin. 2021;71:209‐249. [DOI] [PubMed] [Google Scholar]
- 2. Fisher R, Gore M, Larkin J. Current and future systemic treatments for renal cell carcinoma. Semin Cancer Biol. 2013;23:38‐45. [DOI] [PubMed] [Google Scholar]
- 3. Motzer RJ, Escudier B, McDermott DF, et al. Nivolumab versus Everolimus in advanced renal‐cell carcinoma. N Engl J Med. 2015;373:1803‐1813. [DOI] [PMC free article] [PubMed] [Google Scholar]
- 4. Motzer RJ, Tannir NM, McDermott DF, et al. Nivolumab plus Ipilimumab versus Sunitinib in advanced renal‐cell carcinoma. N Engl J Med. 2018;378:1277‐1290. [DOI] [PMC free article] [PubMed] [Google Scholar]
- 5. Larkin J, Chiarion‐Sileni V, Gonzalez R, et al. Combined Nivolumab and Ipilimumab or monotherapy in untreated melanoma. N Engl J Med. 2015;373:23‐34. [DOI] [PMC free article] [PubMed] [Google Scholar]
- 6. Hellmann MD, Paz‐Ares L, Bernabe Caro R, et al. Nivolumab plus Ipilimumab in advanced non‐small‐cell lung cancer. N Engl J Med. 2019;381:2020‐2031. [DOI] [PubMed] [Google Scholar]
- 7. Shitara K, Ajani JA, Moehler M, et al. Nivolumab plus chemotherapy or ipilimumab in gastro‐oesophageal cancer. Nature. 2022;603:942‐948. [DOI] [PMC free article] [PubMed] [Google Scholar]
- 8. Overman MJ, Lonardi S, Wong KYM, et al. Durable clinical benefit with Nivolumab plus Ipilimumab in DNA mismatch repair‐deficient/microsatellite instability‐high metastatic colorectal cancer. J Clin Oncol. 2018;36:773‐779. [DOI] [PubMed] [Google Scholar]
- 9. Zou W, Wolchok JD, Chen L. PD‐L1 (B7‐H1) and PD‐1 pathway blockade for cancer therapy: mechanisms, response biomarkers, and combinations. Sci Transl Med. 2016;8:328rv324. [DOI] [PMC free article] [PubMed] [Google Scholar]
- 10. Rowshanravan B, Halliday N, Sansom DM. CTLA‐4: a moving target in immunotherapy. Blood. 2018;131:58‐67. [DOI] [PMC free article] [PubMed] [Google Scholar]
- 11. Walker LS, Sansom DM. The emerging role of CTLA4 as a cell‐extrinsic regulator of T cell responses. Nat Rev Immunol. 2011;11:852‐863. [DOI] [PubMed] [Google Scholar]
- 12. Wing K, Sakaguchi S. Regulatory T cells exert checks and balances on self tolerance and autoimmunity. Nat Immunol. 2010;11:7‐13. [DOI] [PubMed] [Google Scholar]
- 13. Togashi Y, Nishikawa H. Regulatory T cells: molecular and cellular basis for Immunoregulation. Curr Top Microbiol Immunol. 2017;410:3‐27. [DOI] [PubMed] [Google Scholar]
- 14. Jarnicki AG, Lysaght J, Todryk S, Mills KH. Suppression of antitumor immunity by IL‐10 and TGF‐beta‐producing T cells infiltrating the growing tumor: influence of tumor environment on the induction of CD4+ and CD8+ regulatory T cells. J Immunol. 2006;177:896‐904. [DOI] [PubMed] [Google Scholar]
- 15. Wing K, Onishi Y, Prieto‐Martin P, et al. CTLA‐4 control over Foxp3+ regulatory T cell function. Science. 2008;322:271‐275. [DOI] [PubMed] [Google Scholar]
- 16. Keir ME, Sharpe AH. The B7/CD28 costimulatory family in autoimmunity. Immunol Rev. 2005;204:128‐143. [DOI] [PubMed] [Google Scholar]
- 17. Togashi Y, Shitara K, Nishikawa H. Regulatory T cells in cancer immunosuppression ‐ implications for anticancer therapy. Nat Rev Clin Oncol. 2019;16:356‐371. [DOI] [PubMed] [Google Scholar]
- 18. Qureshi OS, Zheng Y, Nakamura K, et al. Trans‐endocytosis of CD80 and CD86: a molecular basis for the cell‐extrinsic function of CTLA‐4. Science. 2011;332:600‐603. [DOI] [PMC free article] [PubMed] [Google Scholar]
- 19. Tekguc M, Wing JB, Osaki M, Long J, Sakaguchi S. Treg‐expressed CTLA‐4 depletes CD80/CD86 by trogocytosis, releasing free PD‐L1 on antigen‐presenting cells. Proc Natl Acad Sci USA. 2021;118:e2023739118. [DOI] [PMC free article] [PubMed] [Google Scholar]
- 20. Simpson TR, Li F, Montalvo‐Ortiz W, et al. Fc‐dependent depletion of tumor‐infiltrating regulatory T cells co‐defines the efficacy of anti‐CTLA‐4 therapy against melanoma. J Exp Med. 2013;210:1695‐1710. [DOI] [PMC free article] [PubMed] [Google Scholar]
- 21. Selby MJ, Engelhardt JJ, Quigley M, et al. Anti‐CTLA‐4 antibodies of IgG2a isotype enhance antitumor activity through reduction of intratumoral regulatory T cells. Cancer Immunol Res. 2013;1:32‐42. [DOI] [PubMed] [Google Scholar]
- 22. Liakou CI, Kamat A, Tang DN, et al. CTLA‐4 blockade increases IFNgamma‐producing CD4+ICOShi cells to shift the ratio of effector to regulatory T cells in cancer patients. Proc Natl Acad Sci USA. 2008;105:14987‐14992. [DOI] [PMC free article] [PubMed] [Google Scholar]
- 23. Kamada T, Togashi Y, Tay C, et al. PD‐1(+) regulatory T cells amplified by PD‐1 blockade promote hyperprogression of cancer. Proc Natl Acad Sci USA. 2019;116:9999‐10008. [DOI] [PMC free article] [PubMed] [Google Scholar]
- 24. Kumagai S, Togashi Y, Kamada T, et al. The PD‐1 expression balance between effector and regulatory T cells predicts the clinical efficacy of PD‐1 blockade therapies. Nat Immunol. 2020;21:1346‐1358. [DOI] [PubMed] [Google Scholar]
- 25. Marangoni F, Zhakyp A, Corsini M, et al. Expansion of tumor‐associated Treg cells upon disruption of a CTLA‐4‐dependent feedback loop. Cell. 2021;184:3998‐4015.e19. [DOI] [PMC free article] [PubMed] [Google Scholar]
- 26. Schubert D, Bode C, Kenefeck R, et al. Autosomal dominant immune dysregulation syndrome in humans with CTLA4 mutations. Nat Med. 2014;20:1410‐1416. [DOI] [PMC free article] [PubMed] [Google Scholar]
- 27. Schmidt EM, Wang CJ, Ryan GA, et al. Ctla‐4 controls regulatory T cell peripheral homeostasis and is required for suppression of pancreatic islet autoimmunity. J Immunol. 2009;182:274‐282. [DOI] [PubMed] [Google Scholar]
- 28. Paterson AM, Lovitch SB, Sage PT, et al. Deletion of CTLA‐4 on regulatory T cells during adulthood leads to resistance to autoimmunity. J Exp Med. 2015;212:1603‐1621. [DOI] [PMC free article] [PubMed] [Google Scholar]
- 29. Salomon B, Lenschow DJ, Rhee L, et al. B7/CD28 costimulation is essential for the homeostasis of the CD4+CD25+ immunoregulatory T cells that control autoimmune diabetes. Immunity. 2000;12:431‐440. [DOI] [PubMed] [Google Scholar]
- 30. Zhang R, Huynh A, Whitcher G, Chang J, Maltzman JS, Turka LA. An obligate cell‐intrinsic function for CD28 in Tregs. J Clin Invest. 2013;123:580‐593. [DOI] [PMC free article] [PubMed] [Google Scholar]
- 31. Saito T, Nishikawa H, Wada H, et al. Two FOXP3(+)CD4(+) T cell subpopulations distinctly control the prognosis of colorectal cancers. Nat Med. 2016;22:679‐684. [DOI] [PubMed] [Google Scholar]
- 32. Haile ST, Dalal SP, Clements V, Tamada K, Ostrand‐Rosenberg S. Soluble CD80 restores T cell activation and overcomes tumor cell programmed death ligand 1‐mediated immune suppression. J Immunol. 2013;191:2829‐2836. [DOI] [PMC free article] [PubMed] [Google Scholar]
- 33. Miyazono K, Ichijo H, Heldin CH. Transforming growth factor‐beta: latent forms, binding proteins and receptors. Growth Factors. 1993;8:11‐22. [DOI] [PubMed] [Google Scholar]
- 34. Tran DQ, Ramsey H, Shevach EM. Induction of FOXP3 expression in naive human CD4+FOXP3 T cells by T‐cell receptor stimulation is transforming growth factor‐beta dependent but does not confer a regulatory phenotype. Blood. 2007;110:2983‐2990. [DOI] [PMC free article] [PubMed] [Google Scholar]
- 35. Wing JB, Tanaka A, Sakaguchi S. Human FOXP3(+) regulatory T cell heterogeneity and function in autoimmunity and cancer. Immunity. 2019;50:302‐316. [DOI] [PubMed] [Google Scholar]
- 36. Miyara M, Yoshioka Y, Kitoh A, et al. Functional delineation and differentiation dynamics of human CD4+ T cells expressing the FoxP3 transcription factor. Immunity. 2009;30:899‐911. [DOI] [PubMed] [Google Scholar]
- 37. Romano E, Kusio‐Kobialka M, Foukas PG, et al. Ipilimumab‐dependent cell‐mediated cytotoxicity of regulatory T cells ex vivo by nonclassical monocytes in melanoma patients. Proc Natl Acad Sci USA. 2015;112:6140‐6145. [DOI] [PMC free article] [PubMed] [Google Scholar]
- 38. Arce Vargas F, Furness AJS, Litchfield K, et al. Fc effector function contributes to the activity of human anti‐CTLA‐4 antibodies. Cancer Cell. 2018;33:649‐663.e44. [DOI] [PMC free article] [PubMed] [Google Scholar]
- 39. Quezada SA, Peggs KS, Curran MA, Allison JP. CTLA4 blockade and GM‐CSF combination immunotherapy alters the intratumor balance of effector and regulatory T cells. J Clin Invest. 2006;116:1935‐1945. [DOI] [PMC free article] [PubMed] [Google Scholar]
- 40. Schneider‐Merck T, Lammerts van Bueren JJ, Berger S, et al. Human IgG2 antibodies against epidermal growth factor receptor effectively trigger antibody‐dependent cellular cytotoxicity but, in contrast to IgG1, only by cells of myeloid lineage. J Immunol. 2010;184:512‐520. [DOI] [PubMed] [Google Scholar]
- 41. Goldman JW, Dvorkin M, Chen Y, et al. Durvalumab, with or without tremelimumab, plus platinum‐etoposide versus platinum‐etoposide alone in first‐line treatment of extensive‐stage small‐cell lung cancer (CASPIAN): updated results from a randomised, controlled, open‐label, phase 3 trial. Lancet Oncol. 2021;22:51‐65. [DOI] [PubMed] [Google Scholar]
- 42. Abou‐Alfa GK, Lau G, Kudo M, et al. Tremelimumab plus durvalumab in unresectable hepatocellular carcinoma. NEJM Evidence. 2022;1:EVIDoa2100070. [DOI] [PubMed] [Google Scholar]
- 43. Ha D, Tanaka A, Kibayashi T, et al. Differential control of human Treg and effector T cells in tumor immunity by fc‐engineered anti‐CTLA‐4 antibody. Proc Natl Acad Sci USA. 2019;116:609‐618. [DOI] [PMC free article] [PubMed] [Google Scholar]
- 44. Gan X, Shan Q, Li H, et al. An anti‐CTLA‐4 heavy chain‐only antibody with enhanced T(reg) depletion shows excellent preclinical efficacy and safety profile. Proc Natl Acad Sci USA. 2022;119:e2200879119. [DOI] [PMC free article] [PubMed] [Google Scholar]
Associated Data
This section collects any data citations, data availability statements, or supplementary materials included in this article.
Supplementary Materials
Figure S1.
Figure S2.
Figure S3.
Figure S4.
Figure S5.
Figure S6.
Figure S7.
Figure S8.
Table S1.


