

Abstract
Mesenchymal stem cell‐ or osteoblast‐derived osteosarcoma is the most common malignant bone tumor. Its highly metastatic malignant phenotypes, which are often associated with a poor prognosis, have been correlated with the modulation of TP53‐ and cell‐cycle‐related pathways. MYC, which regulates the transcription of cell‐cycle modulating genes, is used as a representative prognostic marker for osteosarcoma. Another member of the MYC oncoprotein family, MYCN, is highly expressed in a subset of osteosarcoma, however its roles in osteosarcoma have not been fully elucidated. Here, we attempted to create an in vitro tumorigenesis model using hiPSC‐derived neural crest cells, which are precursors of mesenchymal stem cells, by overexpressing MYCN on a heterozygous TP53 hotspot mutation (c.733G>A; p.G245S) background. MYCN‐expressing TP53 mutated transformed clones were isolated by soft agar colony formation, and administered subcutaneously into the periadrenal adipose tissue of immunodeficient mice, resulting in the development of chondroblastic osteosarcoma. MYCN suppression decreased the proliferation of MYCN‐induced osteosarcoma cells, suggesting MYCN as a potential target for a subset of osteosarcoma treatment. Further, comprehensive analysis of gene expression and exome sequencing of MYCN‐induced clones indicated osteosarcoma‐specific molecular features, such as the activation of TGF‐β signaling and DNA copy number amplification of GLI1. The model of MYCN‐expressing chondroblastic osteosarcoma was developed from hiPSC‐derived neural crest cells, providing a useful tool for the development of new tumor models using hiPSC‐derived progenitor cells with gene modifications and in vitro transformation.
Keywords: human induced pluripotent stem cell, MYCN proto‐oncogene, neural crest cell, osteosarcoma, tumorigenesis
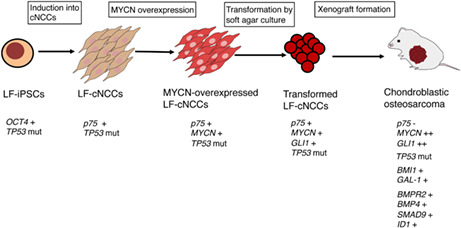
Transformed LF cNCCs by MYCN overexpression and soft agar culture generate chondroblastic osteosarcoma with upregulation of genes involved in osteosarcoma tumorigenesis (BMI1 and GAL‐1) and the TGF signaling pathway (BMPR2, BMP4, SMAD9, and ID1).
Abbreviations
- cNCCs
cranial NCCs
- CNVs
copy number variants
- DAVID
Database for Annotation, Visualization, and Integrated Discovery
- GSEA
gene set enrichment analysis
- hiPSCs
human induced pluripotent stem cells
- InDels
insertions/deletions
- KEGG
Kyoto Encyclopedia of Genes and Genomes
- LF
Li–Fraumeni
- MSCs
mesenchymal stem cells
- MYC
MYC proto‐oncogene bHLH transcription factor
- MYCN
MYCN proto‐oncogene, bHLH transcription factor
- NCCs
neural crest cells
- RP
replacement
- SNVs
single nucleotide variants
- TF
transformed
- tNCCs
trunk NCCs
1. INTRODUCTION
Many cancer studies have investigated the genetic and pharmacological actions on the mechanisms of tumor growth and cell death in tumor cells by comparing gene expression profiles between tumor and nontumor cells. However, conventional methods make it difficult to provide a complete understanding of the physiological mechanisms of tumorigenesis. Recent studies have shown the generation of sarcoma and neuroblastoma from hiPSCs. For instance, induction of EWS‐FLI1 oncogenic fusion transcript in sarcoma hiPSCs‐derived osteogenic cells led to the generation of a sarcoma. 1 In addition, the administration of human hiPSCs‐derived NCCs introducing neuroblastoma‐specific alternations into early mouse embryos resulted in the successful generation of a neuroblastoma. 2 The use of hiPSC‐derived tumor cells allows the tracking of temporal changes and facilitates animal tumorigenic experiments, thus making them useful for examining the efficacy of therapeutic drugs. In this study, we aimed to spontaneously induce tumorigenesis due to the introduction of an oncogene and genetic changes in genetically transformed differentiated cells.
Neural crest cells, progenitor cells of MSCs, have been efficiently differentiated from hiPSCs. 3 Moreover, NCCs are multipotent cells that are mainly divided into two subgroups, cNCCs and tNCCs. cNCCs differentiate into bone and cartilage, whereas tNCCs differentiate into sympathetic ganglia and melanocytes. 4 NCCs are of particular interest in cancer research as they constitute the origin of various tumors, including small‐cell lung cancer, osteosarcoma, neuroblastoma, and glioblastoma. 5 MYC is involved in the process of differentiation of NCCs into osteoblasts, while MYCN is involved in the process of differentiation of NCCs into sympathetic ganglia; consistently, hyperregulation of these processes is considered to lead to tumorigenesis. 6 , 7 The MYC family members, MYC and MYCN, are representative oncogenes and have been widely used to generate mouse models of cancer, such as breast cancer and neuroblastoma. 8 , 9
Using an established cNCC differentiation protocol, we induced the generation of cNCCs from WT hiPSCs and LF syndrome patient‐derived hiPSCs, and subsequently introduced MYCN into these cNCCs using lentiviral transfection to study the MYCN‐related oncogenic mechanism in the hiPSC‐derived cNCCs. 3 Transfected NCCs were cultured in soft agar medium and TF clones were isolated. We administered these LF‐derived/MYCN‐transduced TF clones both subcutaneously and into the periadrenal adipose tissue of immunodeficient mice, resulting in the generation of high‐grade chondroblastic osteosarcoma. Here, we investigated the molecular features of tumorigenesis of this high‐grade osteosarcoma using comprehensive gene expression and whole‐exome analyses compared with previous reports on osteosarcoma.
2. METHODS AND MATERIALS
Expanded methods can be found in Appendix S1.
2.1. Pluripotent stem cell maintenance
The 414C2 and LF human iPSC lines were provided by Dr. Kenji Osafune (Kyoto University, Kyoto, Japan). LF hiPSCs carry a heterozygous TP53 hotspot mutation (c.733G>A; p.G245S). Both cell lines were maintained on a feeder layer of mitomycin C‐treated embryonic mouse fibroblasts in primate embryonic stem (ES) cell medium (REPROCELL, Tokyo, Japan) supplemented with 4 ng/mL recombinant human FGF2 (FUJIFILM, Tokyo, Japan). The 414C2 hiPSC cell line was generated from a healthy person. 10 The LF hiPSC cell line was generated by transducing episomal vectors (OCT3/4, SOX2, KLF4, L‐MYC, LIN28, and p53shRNA) in dermal fibroblasts from a patient with LF syndrome.
3. RESULTS
3.1. Differentiation of 414C2 and LF hiPSCs into cNCCs and preparation of MYCN‐overexpressing cells
We subjected 414C2 and LF hiPSCs to differentiation into cNCCs according to the reported protocol. 3 Using the neurotrophin receptor (p75, a cell surface marker of NCCs), we collected the p75‐positive cells by cell sorting (Figure S1). We then subjected the sorted cNCCs to gene expression analysis of stem cell and NCC markers (Figure 1A). We found that the sorted cNCCs expressed representative markers of NCCs, such as PAX3, p75, SOX10, and ETS1. 3 In contrast, we detected that the expression of OCT4 was clearly downregulated in cNCCs compared with that in hiPSCs. We infected these cNCCs with either control (mock) or MYCN‐expressing (MYCN) lentiviruses. Subsequently, we analyzed the infected cNCCs by RT‐PCR and western blotting to confirm the induction of the gene and protein expression of MYCN. Notably, we observed that the expression of MYCN was increased in LF‐derived cNCCs compared with that in 414C2‐derived cNCCs (Figure 1B,C).
FIGURE 1.
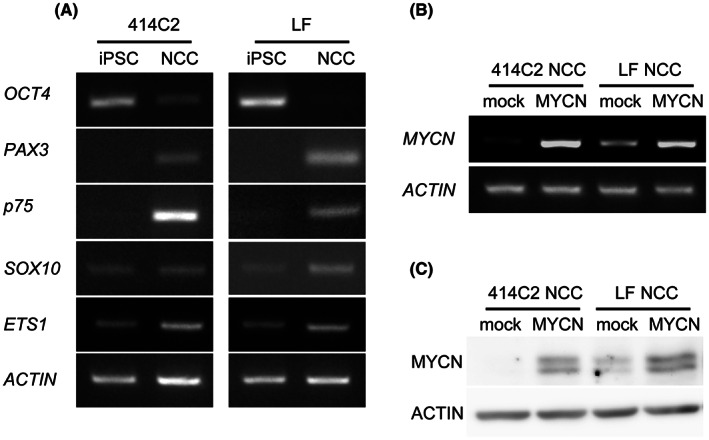
Expression profiles of cNCCs differentiated from hiPSCs and preparation of MYCN‐overexpressing cNCCs. (A) Semiquantitative RT‐PCR analysis of the expression of pluripotency (OCT4) and neural crest (PAX3, p75, SOX10, and ETS1) markers in 414C2, LF hiPSCs, and cNCCs. Primers used were specific for transcripts from the respective endogenous locus. ACTIN was used as a loading control. (B, C) 414C2 and LF cNCCs were infected with control (mock) or MYCN‐expressing (MYCN) lentivirus. Infected cells were analyzed for expression of the gene and protein of MYCN.
3.2. Transformation using the soft agar colony formation assay
We performed the soft agar colony formation assay using mock‐ or MYCN‐expressing 414C2‐ and LF cNCCs. We found that for 414C2 cNCCs, MYCN‐expressing cells formed more colonies than mock‐transduced cells. However, LF cNCCs formed many colonies regardless of MYCN transduction, suggesting that the elevated levels of MYCN in LF NCCs caused anchorage‐independent proliferation (Figures 1C and 2A). We isolated the clones from four 414C2 mock, 20 414C2 MYCN, 17 LF mock, and 23 LF MYCN colonies (Figure 2B). We cultured these clones in complete CDMi medium‐containing culture plates, and successfully established 20 414C2 MYCN, 11 LF mock, and 14 LF MYCN clones. We confirmed the level of expression of MYCN in the selected clones by western blotting and RT‐PCR, and found that MYCN‐transduced clones had higher levels of expression of MYCN compared with that in mock cNCCs (Figure 2C: upper panel). Additionally, the selected clones showed a higher capacity for colony formation than either mock‐ or MYCN‐transduced cNCC (Figure 2C: lower panel).
FIGURE 2.
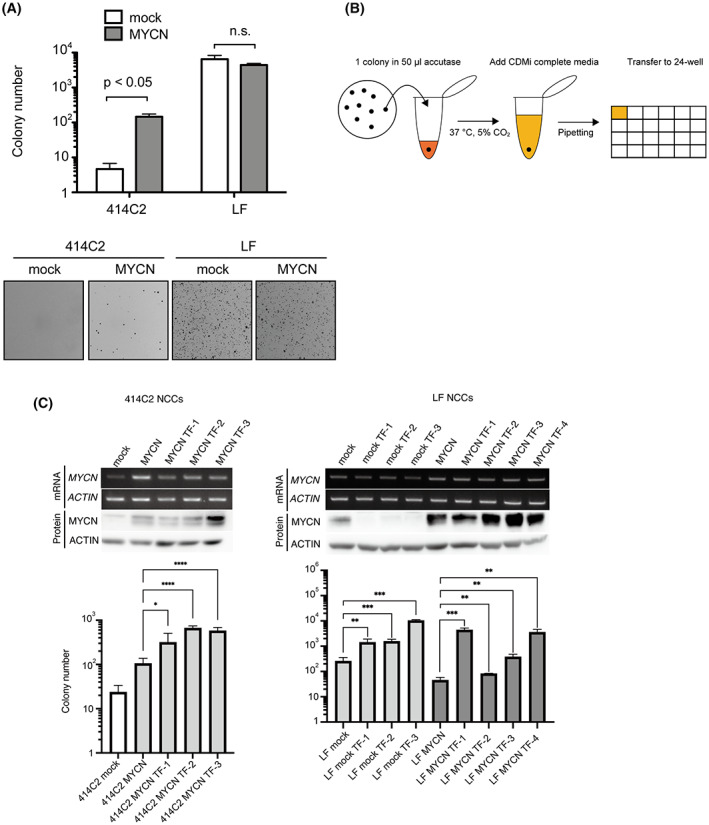
Isolation of transformed cells using the soft agar colony formation assay. (A) Anchorage‐independent growth ability was evaluated by soft agar colony formation assay. Colonies were counted using the Clono‐Counter software. Results were represented as the mean ± SD of triplicate samples. (B) Protocol for the isolation of colonies from soft agar dishes. A single colony was isolated in a 1.5 mL tube containing 50 μL accutase and pipetted with CDMi medium. Pipetted clones were cultured in 24‐well plates. (C) Western blotting and semiquantitative RT‐PCR analysis (upper panel) of the expression of MYCN in isolated 414C2 MYCN TF 1–3, LF mock TF 1–4, and LF MYCN TF 1–4 clones. ACTIN was used as loading control. The lower panel shows anchorage‐independent growth ability evaluated by soft agar colony formation assay. Results are represented as the mean ± SD of four replicates.
3.3. Tumorigenesis experiments by subcutaneous administration
We selected the well‐grown clones (Figure 2C: upper panel) and subcutaneously administered 414C2 (MYCN TF‐1 to TF‐3) and LF (mock TF‐1 to TF‐3 and MYCN TF‐1 to TF‐4) cNCC clones to BALB/c Ajcl nu/nu mice. We observed that 414C2 MYCN TF clones did not generate any tumor masses (three out of three). However, we detected the generation of tumor masses in two out of four LF mock TF‐3, one out of four LF MYCN TF‐1, and two out of four LF MYCN TF‐4 clones (Figure 3A). In contrast, LF mock TF‐1, and ‐2, as well as LF MYCN TF‐2 and ‐3 did not generate any tumor masses. We found the apparent development of bone and cartilage with atypical spindle cells in all masses and identified all generated tumors as chondroblastic osteosarcoma according to H&E staining (Figure 3B). PCNA (proliferation marker) immunostaining showed cell proliferation in all masses (Figure 3B). We also detected a high PCNA labeling index (98.3%) in the tumor derived from LF MYCN TF‐4 (Figure 3C). According to the percentage of PCNA, we defined more than 70% as high grade (LF MYCN TF‐4), between 30% and 70% as intermediate, and less than 30% as low grade. In addition, to examine the effects of tumorigenesis in TP53 and MYCN, lentivirus‐infected mock‐ or MYCN‐expressing 414C2‐ and LF cNCCs were administered subcutaneously to SCID/Beige mice, which are more severely immunodeficient than BALB/c Ajcl nu/nu mice. We found that LF mock‐ and LF MYCN‐expressing cNCCs generated masses that were larger than the 414C2 mock‐ and 414C2 MYCN‐expressing cNCC masses, respectively, suggesting a positive effect of the TP53 mutation on osteosarcoma tumorigenesis (Figures S3 and S4). H&E staining showed that all tumor sections contained bone tissues, which were assumed to be due to differentiation into cNCCs (Figure 3D). Also, the mutation of TP53 and expression of MYCN induced the formation of nuclear atypia (H&E; Figure 3B,D) and increased the PCNA expression in LF MYCN‐expressing clones (PCNA, Figure 3B,D). These results indicated that the co‐occurrence of overexpression of MYCN with TP53 mutation and transformation by anchorage‐independent proliferation induced high‐grade tumorigenesis.
FIGURE 3.
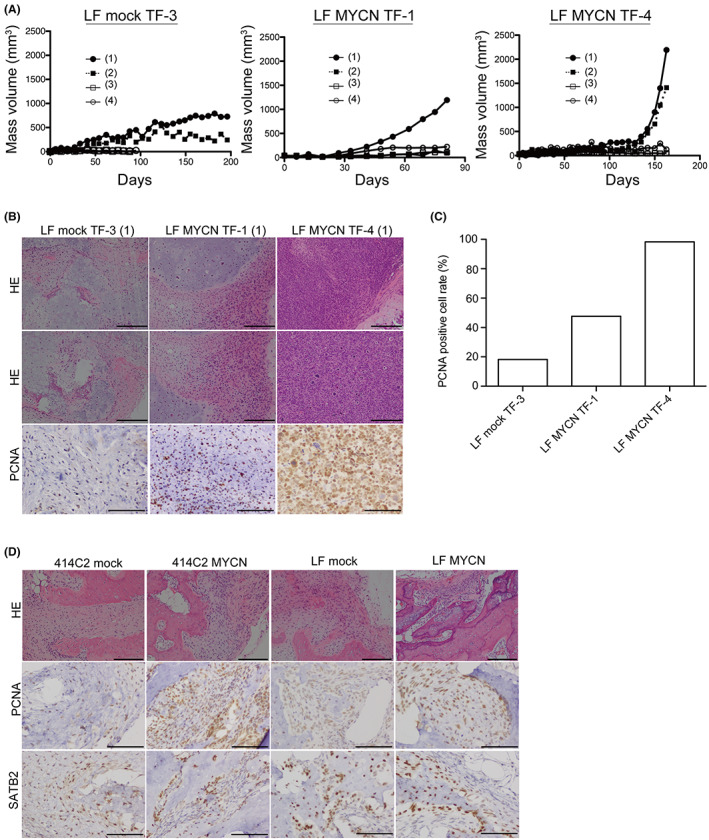
Subcutaneous administration with mock and MYCN cNCCs/TF clones of 414C2 and LF into BALB/c AJcl‐nu/nu mice. (A) BALB/c AJcl‐nu/nu mice were subjected to subcutaneous xenografts using 414C2 MYCN, LF mock, or LF MYCN TF clones. Respective TF clones were administered to four independent parts, as described in Methods. Proliferating TF clones are shown. Mice whose tumor mass volume did not reach 50 mm3 after 3 months were not included. (B) H&E staining from regions with bone and chondroblastic osteosarcoma of generated masses in LF mock TF‐3 (1), LF MYCN TF‐1 (1), and LF MYCN TF‐4 (1). Scale bars: 200 μm. Tissue samples were analyzed immunohistochemically for PCNA‐positive cells. Scale bars: 200 μm. (C) Quantitation of PCNA‐positive cells in LF mock TF‐3 (1), LF MYCN TF‐1 (1), and LF MYCN TF‐4 (1) by counting >1000 tumor cells. (D) H&E staining from regions with bone and chondroblastic osteosarcoma of generated masses in lentiviral‐infected mock and MYCN cNCCs of 414C2 and LF cells. Scale bars: 200 μm. Tissue samples were analyzed immunohistochemically for PCNA‐ and SATB2‐positive cells. Scale bars: 200 μm.
3.4. Tumorigenesis experiments by administration of transformed clones into the periadrenal adipose tissue of mice
NCCs are embryonic precursor cells that are involved in the development of multiple pediatric malignancies, including neuroblastoma, peripheral primitive neuroectodermal tumors, and osteosarcoma. 11 , 12 To investigate the tumorigenic ability of the tumor‐generated TF clones (Figure 3) when implanted into mice that are more immunodeficient compared with BALB/c Ajcl nu/nu mice, we implanted LF mock and MYCN‐expressing cNCCs, and TF clones into the periadrenal adipose tissue of SCID/Beige mice. We observed that all generated masses contained bone tissues. Although only one out of five LF mock TF‐3 led to the generation of tumors, we detected 100% tumor generation by LF MYCN TF‐1, TF‐4 clones, and LF MYCN‐expressing cNCCs (Tables 1 and 2). We specifically identified these generated tumors as chondroblastic osteosarcoma and designated them: LF MYCN CO‐1 (generated by LF MYCN cNCCs), LF MYCN CO‐2 (generated by LF MYCN TF‐1), and LF MYCN CO‐3 (generated by LF MYCN TF‐4) (Figure 4A). The H&E staining showed a higher tumor cell density, more prominent cell division, and higher necrosis in LF MYCN CO‐3 compared with LF MYCN CO‐2 (Figure 4A). We further observed that all histologically assessed tumors were positive for PCNA and SATB2 (a marker for osteoblastic differentiation), with LF MYCN CO‐1 being intermediate;CO‐3 tumors were high grade, and LF MYCN CO‐2 tumor were low grade. Interestingly, the LF mock CO tumor was an intermediate tumor of chondroblastic osteosarcoma generated by LF mock TF‐3 (Figure 4A,B). We analyzed the osteosarcoma‐related gene (BMI1, GAL‐1, EZR, and RUNX2) expression in LF mock‐ and LF MYCN‐expressing cNCCs, LF mock TF‐3, LF MYCN TF‐1, and LF MYCN TF‐4 clones, as well as in LF mock CO/LF MYCN CO‐1, ‐2, and ‐3 tumors (Figure 4C). In particular, we detected that tumorigenesis further increased the expression of MYCN compared with that in the administered clones. We found that the levels of osteosarcoma‐related genes were upregulated in LF MYCN CO‐1, ‐2, and ‐3, and in LF mock CO tumors, indicating that all generated tissues had genetic features of osteoblasts or osteosarcoma, including chondroblastic osteosarcoma. In addition, we detected that RUNX2 and its downstream genes (FGFR2, FGFR3, SP7, and SMOC2) were downregulated in the highly aggressive LF MYCN CO‐3 clone (Figure 4C). RUNX2 is reported to regulate osteoblast differentiation 13 , 14 and suppress osteosarcoma cell proliferation. 15 We also found that LF MYCN CO‐3 had the same PCNA rate as LF MYCN CO‐1, but exhibited higher grade features in terms of H&E staining and lower expression of RUNX2, suggesting the tumor suppressor function of RUNX2 in cNCC‐derived chondroblastic osteosarcomas.
TABLE 1.
Incidence of tumorigenesis in mice administered with cNCCs or transformed clones into the periadrenal adipose tissue.
| Clone name | Number of tumor mass/injected mice |
|---|---|
| 414C2 MYCN TF‐1 | 0/2 |
| LF mock NCCs | 0/4 |
| LF mock TF‐3 | 1/5 |
| LF MYCN NCCs | 3/3 |
| LF MYCN TF‐1 | 3/3 |
| LF MYCN TF‐4 | 2/2 |
TABLE 2.
Tumor sizes and the periods of tumorigenesis related to Table.
| Line | Size (mm3) | Period (days) |
|---|---|---|
| LF Mock TF‐3 (LF Mock CO) | 84.91 | 259 |
| LF MYCN (LF MYCN CO‐1) | 564.93 | 235 |
| LF MYCN | 84.79 | 291 |
| LF MYCN | ND | 117 |
| LF MYCN TF‐1 (LF MYCN CO‐2) | 158.16 | 120 |
| LF MYCN TF‐1 | 77.58 | 228 |
| LF MYCN TF‐1 | ND | 359 |
| LF MYCN TF‐4 | 8.38 | 118 |
| LF MYCN TF‐4 (LF MYCN CO‐3) | 4203.00 | 198 |
Abbreviation: ND, not detected due to post‐freezing.
FIGURE 4.
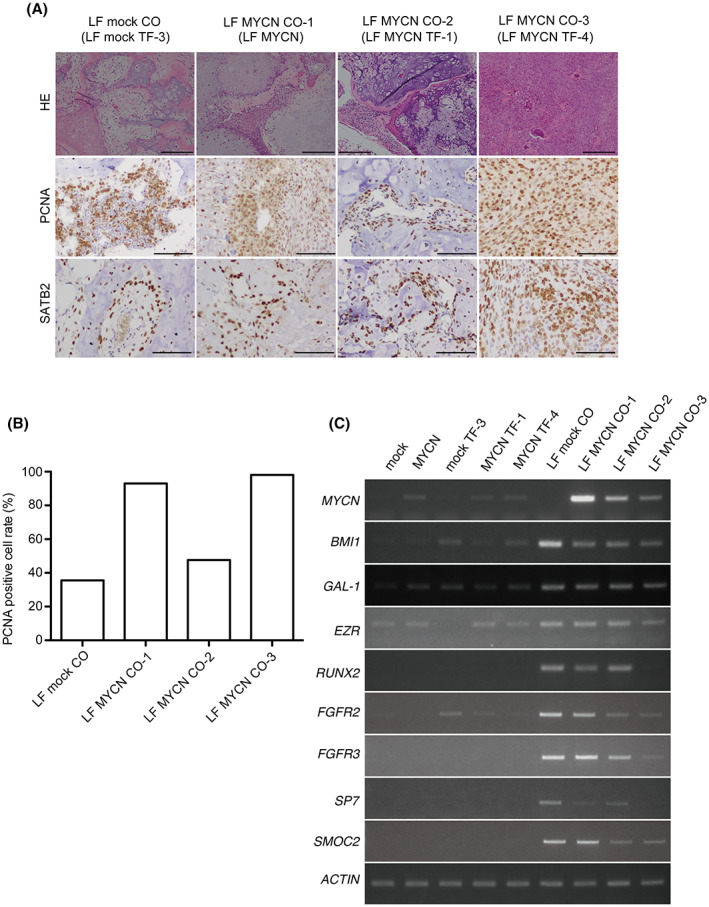
Tumorigenesis experiments by administration of transformed clones into the periadrenal adipose tissue of SCID/Beige mice. (A) Indicated cell lines in Matrigel® were administered into the periadrenal adipose tissue of mice. H&E staining of bone and chondroblastic osteosarcoma developed from LF mock CO (LF mock TF‐3), LF MYCN CO‐1 (LF MYCN cNCCs), LF MYCN CO‐2 (LF MYCN TF‐1), and LF MYCN CO‐3 (LF MYCN TF‐4) are shown. Scale bars: 200 μm. Tissue samples were analyzed immunohistochemically for PCNA‐ and SATB2‐positive cells. Scale bars: 200 μm. (B) Quantitation of PCNA‐positive cells in LF mock CO, LF MYCN CO‐1, CO‐2, and CO‐3 by counting >1000 tumor cells. (C) Semiquantitative RT‐PCR analyses of the expression of MYCN, BMI1, GAL‐1, EZR, and RUNX2 among LF‐infected cNCCs, TF clones, and COs samples. ACTIN was used as loading control.
3.5. Genetic changes during the transition from cNCCs to tumorigenic clones
To uncover the mechanisms underlying tumorigenesis, we performed gene expression profiling using microarray analyses of LF mock cNCCs, LF MYCN cNCCs, LF MYCN TF‐4 clones, and LF MYCN CO‐3 tumors. Our principal component analysis separated distinctly the four different groups of samples (Figure 5A). Previous studies have reported the activation of pathways such as TGF‐β, NF‐kappa B, and WNT signaling in osteosarcoma. 16 , 17 Therefore, we analyzed the upregulated genes (moderated t‐test of <0.01 and fold changes of >2) using the KEGG pathway analysis program from DAVID v6.8. Functional annotation of upregulated genes suggested that the NF‐kappa B signaling pathway, basal cell carcinoma, TGF‐β signaling pathway, and cytokine–cytokine receptor interaction were significantly enriched in the process of tumorigenesis (Figure 5B). Subsequently, among these pathways, we focused on the genes in the TGF‐β signaling pathway and basal cell carcinoma, including bone morphogenetic proteins, and compared the expression of representative genes among cells, clones, and tumors using RT‐PCR (Figure 5C). We found that LF MYCN CO‐3 showed significantly higher expression of genes involved in the TGF‐β signaling pathway affecting osteosarcoma tumor growth and basal cell carcinoma, suggesting the increased expression of cell proliferation‐related genes during the process of transition to becoming a high‐grade tumor (Figure 5C; Table S1). In addition, GSEA suggested that LF MYCN CO‐3 displayed tumor characteristics that were more associated with MSC‐derived sarcomas obtained from soft tissue and bone compared with LF mock cNCCs (Figure 5D). 18 , 19 , 20 , 21 , 22 These results indicated that LF MYCN CO‐3 exhibited features characteristic of osteosarcoma, as indicated in Figures 4 and 5.
FIGURE 5.
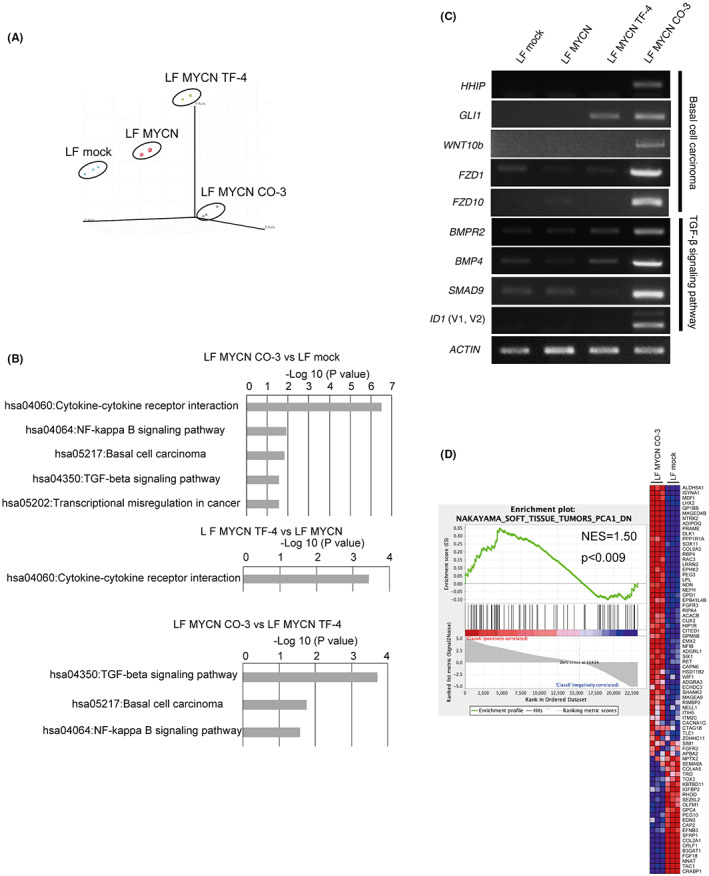
Microarray analysis of the process of tumorigenesis. (A) 3D principal component analysis showed variations in gene expression among LF mock cNCCs (n = 3), LF MYCN cNCCs (n = 3), LF MYCN TF‐4 (n = 3), and LF MYCN CO‐3 (n = 3). (B) Pathway analysis using the KEGG pathway (DAVID Bioinformatics Resources 6.8) for genes upregulated more than two‐fold (p < 0.01) in LF MYCN CO‐3 compared with LF mock cNCCs, in LF MYCN TF‐4 compared with LF MYCN‐cNCC, and in LF MYCN CO‐3 compared with LF MYCN TF‐4. (C) Semiquantitative RT‐PCR analyses of the expression of genes related to basal cell carcinoma (HHIP, GLI1, WNT10b, FZD1, and FZD10) and TGF‐β signaling (BMPR2, BMP4, SMAD9, and ID1) pathways in LF‐infected cNCCs, LF MYCN TF‐4, and LF MYCN CO‐3. ACTIN was used as loading control. (D) Genes differentially expressed between LF MYCN CO‐3 and LF mock cNCCs share molecular signatures as determined by gene set enrichment analysis (GSEA) with gene sets downstream of “NAKAYAMA_SOFT_TISSUE_TUMORS_PCA1_DN.”
3.6. Suppression of MYCN in osteosarcoma cell lines
Although the malignant phenotypes of osteosarcoma are known to be related to the high expression of c‐MYC, little has been reported on the relationship between MYCN and osteosarcoma. 23 Interestingly, the expression of MYCN has been shown to be higher in osteosarcoma than that in MSC and this higher expression has been related to a lower overall survival probability in osteosarcoma (Figure S2). To investigate the level of expression of MYCN in osteosarcoma cell lines, we analyzed the expression of both MYC and MYCN in Saos‐2, SJSA‐1, NY, and G‐292 cells. As SJSA‐1 and NY expressed low levels of MYCN (Figure 6A,B), we knocked down MYCN in these two osteosarcoma cell lines using two types of shRNA (shMYCN2 and shMYCN3). After infection, we assessed the expression of MYCN using RT‐PCR and western blotting, and found that the levels of both MYCN mRNA (Figure 6C,D: upper panel) and protein were decreased by either of the shMYCNs (Figure 6C,D: middle panel). We further performed a viability assay of the infected cell lines and found that shMYCNs clearly suppressed the proliferation of SJSA‐1 and NY (Figure 6C,D: lower panel).
FIGURE 6.
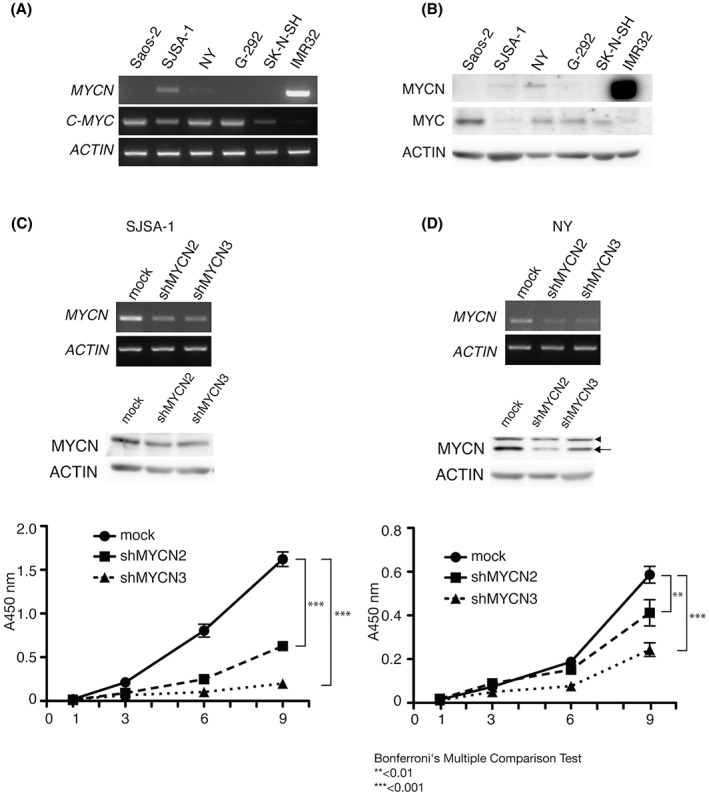
MYCN depletion in MYCN‐expressing osteosarcoma cells. Semiquantitative RT‐PCR (A) and western blotting (B) analyses of the expression of MYCN (MYCN) and c‐MYC (MYC) in osteosarcoma (Saos‐2, SJSA‐1, NY, and G‐292) and neuroblastoma (SK‐N‐SH and IMR32) cell lines. SK‐N‐SH was used as a negative control, whereas IMR32 was used as a positive control for the expression of MYCN. ACTIN (ACTIN) was used as a loading control. (C) SJSA‐1 and (D) NY were infected with control (mock) or shMYCN‐expressing lentivirus. Infected cells were analyzed for the expression of the gene (upper panel) and protein (middle panel) of MYCN. SJSA‐1 and NY cells (mock, shMYCN2, and shMYCN3) were seeded on a 96‐well plate at a concentration of 700 cells/well in 100 μL culture medium. Cell proliferation was studied at the indicated time points (1, 3, 6, and 9 days) (lower panel). Bars indicate standard deviation from four replicates.
3.7. Analysis of genomic changes using whole‐exome sequencing
Although both LF MYCN CO‐2 and CO‐3 tumors had a molecular background of TP53 mutation and overexpression of MYCN, compared with LF MYCN CO‐2, LF MYCN CO‐3 showed a higher grade tumor phenotype, as revealed from pathological analysis (Figures 3B and 4A). To address this difference, we performed whole‐exome sequencing of LF hiPSC, LF MYCN CO‐2, and CO‐3. Whole‐exome sequencing of LF MYCN CO‐2 and CO‐3 revealed the presence of SNVs, RP, and InDels on LF hiPSCs as the reference, and mutations that were only found in LF MYCN CO‐3, as shown in Table S2. Among the 29 extracted mutations collated using dbSNP and ClinVar, we detected three mutations in AQP7, DYX1C1, and NOL12, which mutations are reported as benign or unknown (Table S2). Annotation was performed for the pathogenicity of all extracted mutations using specific prediction tools (FATHMM CScape for SNVs and PredCID for RP and indels) to analyze the mutations in LF MYCN CO‐3 related to high‐grade phenotypes. FATHMM CScape showed high‐confidence predictions for oncogenic mutations in USP2, POTEM, and DYX1C1. PredCID predicted driver mutations in MAP3K1 and AR, specifically stop‐gain mutations (Figures S5 and S6).
We analyzed all sequencing data for LF MYCN CO‐2 and LF MYCN CO‐3 with LF hiPSCs as the reference, utilizing a custom workflow in CLC Genomics Workbench version 20.0 to identify CNVs of genes detected only in LF MYCN CO‐3. We found that despite no amplifications and 74 deletions of CNVs in LF MYCN CO‐2 versus LF hiPSCs, CNVs in LF MYCN CO‐3 included 143 amplifications and 1855 deletions of genes versus LF hiPSCs (p < 0.01, fold change FC: 1.8). Homozygous deletions were not detected. Interestingly, among the LF MYCN CO‐3 unique genetic changes, we analyzed specific osteosarcoma‐associated CNVs using previous reports 24 , 25 and databases for osteosarcoma (osteosarcoma markers in the MY CANCER GENOME database), and detected 15 amplifications and 50 deletions (Table S3). Additionally, these identified genes were examined for fold changes in their downregulated (FC <0.5, for a candidate tumor suppressor gene, TSG) or upregulated (FC >2, for a candidate oncogene) expression in LF MYCN CO‐3 compared with that in either LF mock or LF MYCN cNCCs in our microarray data (Figure 7). We accordingly identified 13 candidate TSGs and six candidate oncogenes, and especially found that GLI1 was highly upregulated in the LF MYCN CO‐3 tumor (Figure 5C; Table S3).
FIGURE 7.
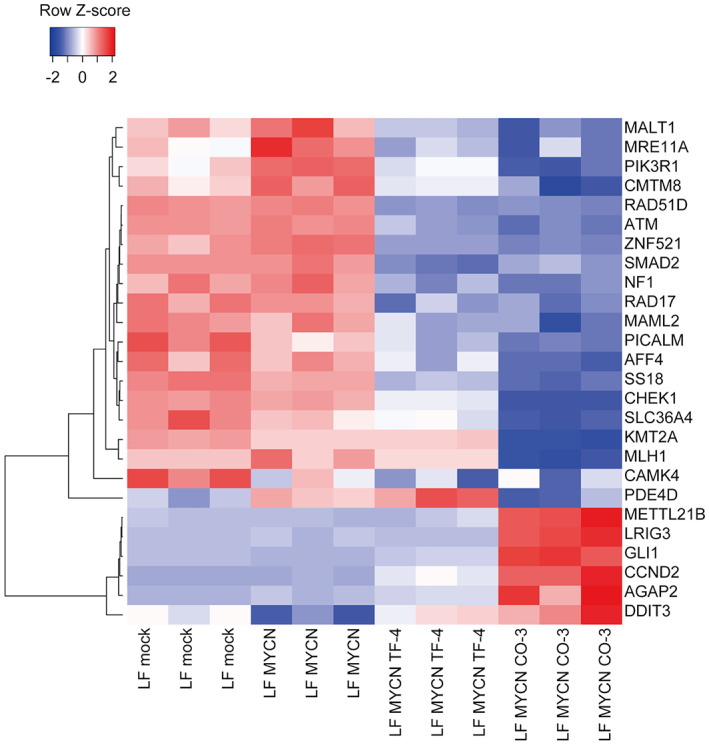
Expression profiles of downregulated and upregulated genes in LF MYCN CO‐3. Clustering analyses using average linkage and Pearson's correlation distance were performed for downregulated genes in focal deletions (FC < 0.5) and upregulated genes in focal amplifications (FC >2) in LF MYCN CO‐3 compared with those in LF mock or LF MYCN cNCCs.
4. DISCUSSION
In recent years, there has been an increased interest in exploring the transformation of stem and progenitor cells in the research of tumorigenic mechanisms. Sato et al. demonstrated that in vitro transformation of human lung epithelial cells, as defined by anchorage‐independent growth in soft agar, led to tumorigenesis. 26 Also in our study, the transformation of cNCCs by soft agar colony formation generated high‐grade tumors. These previous reports and finding suggested that high‐grade in vivo tumorigenicity requires anchorage‐independent transformation, accompanied by genetic mutations and epigenetic modifications. In fact, in our microarray analysis, we observed that the introduction of the MYCN alone did not result in extensive alternations in pathways, but the activation of pathways related to the generation of osteosarcoma was achieved due to transformation and tumorigenesis. These findings revealed that the introduction of a single oncogene to stem and progenitor cells seems to not be enough for the induction of tumorigenesis. In addition to oncogene transduction, additional genetic and epigenetic modifications induced by cellular stress mediated by anchorage‐independent colony formation appear to be required. Previous studies of models using differentiated cells from hiPSCs achieved effective tumorigenesis following the transplantation of differentiated cells in which two or more genes had been manipulated, and showing the potential for clinical application, 2 , 27 , 28 similar to our results in immunodeficient mice. Furthermore, in this study, the soft agar colony formation assay had the potential to promote tumorigenesis of chondroblastic osteosarcoma from cNCCs. Therefore, our study suggested that soft agar colony formation would be useful for inducing spontaneously oncogenic events in hiPSC‐originated progenitor cells, thereby enabling the acquisition of the desired cancer type through the simple operation of transplantation.
It has been previously suggested that p53 dysfunction leads to osteosarcoma tumorigenesis, which has been shown in vitro using LF hiPS cell‐derived osteoblasts. 29 MSCs and osteoblasts are predicted as the origin of osteosarcoma, 30 and in this study, osteosarcoma was generated from NCCs, which is a further undifferentiated state. Amplification of MYC is frequently observed in osteosarcoma, and thus c‐MYC is used as a prognostic biomarker. 16 The MYC family also includes MYCN and MYCL. A previous study showed the relationship between the expression of MYCN and osteosarcoma, although it was considerably less than that of C‐MYC. 31 In our study, all generated tumors were pathologically diagnosed as chondroblastic osteosarcoma. Microarray analysis of the molecular profile revealed the activation of pathways such as cytokine–cytokine receptor interaction, NF‐kappa B signaling, and TGF‐β signaling, which are known to be frequently activated in osteosarcoma (Figure 5B). 16 BMI1 is known to function as an oncogene in osteosarcoma, promoting tumorigenesis. Interestingly, tumorigenesis has been shown to upregulate BMI1, 32 which is the same finding in the expression of MYCN in our study. In addition, the expression of GAL‐1 33 and EZR, 34 which have been reported as chondroblastic osteosarcoma markers, was increased during tumorigenesis (Figure 4C). RUNX2 is the earliest determinant of osteoblast differentiation, and its forced expression has been shown to suppress the proliferation of osteosarcoma cell lines, suggesting that LF MYCN CO‐3 is high grade compared with LF MYCN CO‐1. 15 Although the relationship between chondroblastic osteosarcoma and TP53 mutation is known, its relationship to MYCN status has not been reported. 30 , 35 Our study showed that MYCN appears to be an indispensable molecule for the proliferation of MYCN‐expressing osteosarcoma cells and is the first to identify the oncogenic roles and mutagenic effects of MYCN transduction into hiPSCs‐derived cNCCs. These findings will be helpful for the functional study of mutated or modified genes in osteosarcoma. Osteosarcomas include fibroblastic, osteoblastic, and chondroblastic subtypes; the unique changes in gene expression in chondroblastic osteosarcoma include the upregulation of ACAN, a cartilage‐specific proteoglycan core protein, and MATN4, a major component of the extracellular matrix of cartilage. 36 It hence might be possible to induce chondroblastic osteosarcoma by introducing ACAN or MATN4 using TP53‐deficient cNCCs. Additionally, it might be possible to generate fibroblastic or osteoblastic osteosarcoma by introducing specific genes in osteosarcoma cells.
When we compared LF MYCN CO‐2 (low‐grade) and LF MYCN CO‐3 (high‐grade) tumors, we found that the CNV alterations were more frequent in LF MYCN CO‐3. This finding indicated that CNVs in LF MYCN CO‐3 might have an important role in osteosarcoma aggressiveness. Interestingly, a previous study on CNVs in osteosarcoma showed both gain and loss on multiple chromosomes in chondroblastic types. 37 In particular, loss of chromosome 3q, loss of chromosome 17q, and gain of chromosome 12q were also found in this study, suggesting that CNVs in these regions might be unique to chondroblastic osteosarcoma and might thus serve as diagnostic markers. In addition, we focused on six genes showing a gain on chromosome 12 and upregulation of transcription as chondroblastic osteosarcoma oncogene candidates: GLI1, DDIT3, CCND2, AGAP2, METTL21B, and LRIG3 (Figure 7; Table S3). As many studies have previously demonstrated, 12q gains and several genes on 12q have been strongly correlated with osteosarcoma malignancies. Apart from DDIT3 and LRIG3, oncogenic roles have been reported for GLI1, CCND2, AGAP2, and METTL21B in several tumors. 38 , 39 , 40 , 41 For instance, GLI1 has been reported to be amplified in osteosarcoma; GLI1 copy number was similarly amplified in LF MYCN CO‐3 (Tables S3 and S4). 42 In addition, GLI1 inhibition by shRNA decreased colony and sphere formation in cultured osteosarcoma cells, whereas upregulation of GLI1 has been shown in other tumor types, 38 , 42 consistent with the observed upregulation of GLI1 in LF MYCN CO‐3 in our study. Hence, the CNVs of these genes might be involved in a complex manner in the development of high‐grade phenotypes of LF MYCN CO‐3.
Based on SNVs and CNVs studies, 11 genes were identified as candidates mediating chondroblastic osteosarcoma tumorigenesis and aggressiveness (Figure 7; Tables S2 and S3). Among them, driver gene candidates, for which inhibitors exist, were MAP3K1, AR, USP2, and GLI1. Several stop‐gain mutations, such as the R183X mutation in MAP3K1 (genomic mutation ID: COSV68128873), have been registered in the COSMIC and dbSNP databases (Figure S5). This MAP3K1 (R183X) mutation was registered as pathogenic in the COSMIC database. Likewise, the Q59X mutation in AR has also been registered in the COSMIC and dbSNP databases as a stop‐gain mutation (genomic mutation ID: COSV65954985) (Figure S6), while it has also been registered as pathogenic in the ClinVar database (ClinVar accession: VCV000643319.1). These driver gene candidates, shorter MAP3K1, and AR in chondroblastic osteosarcoma, might not be functional, and therefore tumor progression is expected to be blocked by inhibitors of their downstream JNK (such as tanzisertib) for MAP3K1 or Src (such as dasatinib) for AR. In addition, there are USP2 [ML364 (#S6748)] and GLI1 [GANT61 (#S8075)] inhibitors. Although these inhibitors are now only for research use, the USP2 and GLI1 inhibitors have been reported to be effective against breast cancer and chondrosarcoma cells, respectively. 43 , 44 In addition, although CCND2 is not a druggable target, there are CDK4/CDK6 inhibitors, such as palbociclib, that form a complex with CCND2. Adding these to the treatment options for chondroblastic osteosarcoma might lead to an improved prognosis. 45
In conclusion, we developed a model of chondroblastic osteosarcoma with high expression of MYCN using LF hiPSCs‐derived cNCCs. Genetic analysis of the acquired mutations in the MYCN‐transduced cNCCs, as well as transformation by soft agar colony formation and xenograft chondroblastic osteosarcoma assays, clarified the process of stepwise genetic mutations during osteosarcoma tumorigenesis (Figure 8). Although the number of clones examined in this study was limited, the pathological and genetic analyses of these clones confirmed the previous reports from osteosarcoma studies. A wide variety of tumorigenesis models can be developed by differentiating optimal progenitor cells from hiPSCs and introducing specific gene modifications of oncogenes/TSGs when applying this system. In vitro tumorigenesis models using hiPSCs‐derived differentiated cells are an invaluable tool for assessing the contribution of specific genes to the pathogenesis of tumors and screening therapeutic compounds for tumorigenesis models derived from individual patients.
FIGURE 8.
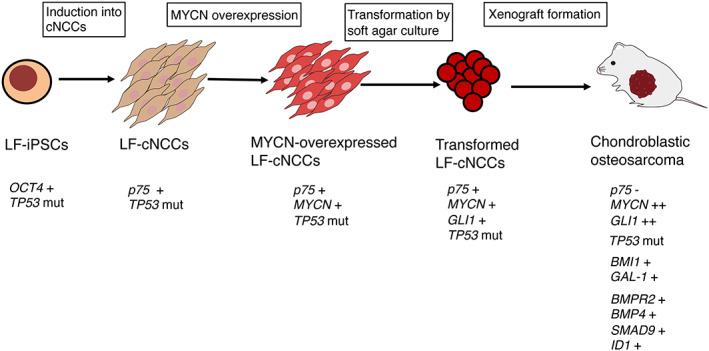
Development of a chondroblastic osteosarcoma model from iPSC‐based NCCs. Transformed LF cNCCs by MYCN overexpression and soft agar culture generate chondroblastic osteosarcoma with the upregulation of genes involved in osteosarcoma tumorigenesis (BMI1 and GAL‐1) and the TGF‐β signaling pathway (BMPR2, BMP4, SMAD9, and ID1).
AUTHOR CONTRIBUTIONS
K.M., H.T., and T.K. designed this study; K.M. performed most of the experiments; H.T., Y.E., M.H., T.S., S.S., M.F., J.T., K.O., T.N., and H.K. assisted in some experiments; K.M., T.K., and M.O. wrote the paper.
FUNDING INFORMATION
This study was supported by grants from the Japan Society for the Promotion of Science (JSPS) KAKENHI grant nos. JP 19K16759, JP 19H03625, and JP 22H04922 (AdAMS).
CONFLICT OF INTEREST STATEMENT
Takehiko Kamijo, Miki Ohira, and Junya Toguchida are Editors of Cancer Science. The other authors have no conflict of interest.
ETHICS STATEMENT
The authors declare:
Approval of the research protocol by an Institutional Reviewer Board. The study was approved by the Ethics Committee of the Saitama Cancer Center (approval number 1060) and consent for the use of LF hiPSC and publication of the data was obtained from the patient. The study was performed in accordance with the Declaration of Helsinki.
Informed Consent. Written informed consent was obtained from all patients.
Registry and the Registration No. of the study/trial: N/A.
Animal Studies. All animals were maintained and used for experiments in accordance with the guidelines of the Institutional Animal Experiments Committee of Saitama Cancer Center.
Supporting information
Figure S1
Figure S2
Figure S3
Figure S4
Figure S5
Figure S6
Appendix S1
Tables S1–S5
ACKNOWLEDGMENTS
We thank Editage (www.editage.jp) for English language editing, and Ms. Kimie Nomura for technical assistance.
Mukae K, Takenobu H, Endo Y, et al. Development of an osteosarcoma model with MYCN amplification and TP53 mutation in hiPS cell‐derived neural crest cells. Cancer Sci. 2023;114:1898‐1911. doi: 10.1111/cas.15730
REFERENCES
- 1. Komura S, Semi K, Itakura F, et al. An EWS‐FLI1‐induced osteosarcoma model unveiled a crucial role of impaired osteogenic differentiation on osteosarcoma development. Stem Cell Rep. 2016;6(4):592‐606. doi: 10.1016/j.stemcr.2016.02.009 [DOI] [PMC free article] [PubMed] [Google Scholar]
- 2. Cohen MA, Zhang S, Sengupta S, et al. Formation of human neuroblastoma in mouse‐human neural crest chimeras. Cell Stem Cell. 2020;26(4):579‐592. doi: 10.1016/j.stem.2020.02.001 [DOI] [PMC free article] [PubMed] [Google Scholar]
- 3. Fukuta M, Nakai Y, Kirino K, et al. Derivation of mesenchymal stromal cells from pluripotent stem cells through a neural crest lineage using small molecule compounds with defined media. PLoS One. 2014;9(12):e112291. doi: 10.1371/journal.pone.0112291 [DOI] [PMC free article] [PubMed] [Google Scholar]
- 4. Delaney SP, Julian LM, Stanford WL. The neural crest lineage as a driver of disease heterogeneity in tuberous sclerosis complex and Lymphangioleiomyomatosis. Front Cell Dev Biol. 2014;2:69. doi: 10.3389/fcell.2014.00069 [DOI] [PMC free article] [PubMed] [Google Scholar]
- 5. Donato G, Ivan P, Arcidiacono B, et al. Innate and adaptive immunity linked to recognition of antigens shared by neural crest‐derived tumors. Cancer. 2020;12(4):840. doi: 10.3390/cancers12040840 [DOI] [PMC free article] [PubMed] [Google Scholar]
- 6. Wu T, Chen G, Tian F, Liu HX. Contribution of cranial neural crest cells to mouse skull development. Int J Dev Biol. 2017;61(8–9):495‐503. doi: 10.1387/ijdb.170051gc [DOI] [PubMed] [Google Scholar]
- 7. Otte J, Dyberg C, Pepich A, Johesen JI. MYCN function in neuroblastoma development. Front Oncol. 2020;10:624079. doi: 10.3389/fonc.2020.624079 [DOI] [PMC free article] [PubMed] [Google Scholar]
- 8. Poli V, Fagnocchi L, Fasciani A, et al. MYC‐driven epigenetic reprogramming favors the onset of tumorigenesis by inducing a stem cell‐like state. Nat Commun. 2018;9(1):1‐16. doi: 10.1038/s41467-018-03264-2 [DOI] [PMC free article] [PubMed] [Google Scholar]
- 9. Althoff K, Beckers A, Bell E, et al. A Cre‐conditional MYCN‐driven neuroblastoma mouse model as an improved tool for preclinical studies. Oncogene. 2015;34(26):3357‐3368. doi: 10.1038/onc.2014.269 [DOI] [PMC free article] [PubMed] [Google Scholar]
- 10. Okita K, Matsumura Y, Sato Y, et al. A more efficient method to generate integration‐free human iPS cells. Nat Methods. 2011;8(5):409‐412. doi: 10.1038/nmeth.1591 [DOI] [PubMed] [Google Scholar]
- 11. Geens L, Robays JV, Geert V, et al. An unusual location of extraosseous Ewing's sarcoma. Case Rep Oncol. 2013;6(2):293‐302. doi: 10.1159/000351836 [DOI] [PMC free article] [PubMed] [Google Scholar]
- 12. Minas TZ, Surdez D, Javaheri T, et al. Combined experience of six independent laboratories attempting to create an Ewing sarcoma mouse model. Oncotarget. 2017;8(21):34141. doi: 10.18632/oncotarget.9388 [DOI] [PMC free article] [PubMed] [Google Scholar]
- 13. Kawane T, Qin X, Jiang Q, et al. Runx2 is required for the proliferation of osteoblast progenitors and induces proliferation by regulating Fgfr2 and Fgfr3. Sci Rep. 2018;8(1):1‐17. doi: 10.1038/s41598-018-31853-0 [DOI] [PMC free article] [PubMed] [Google Scholar]
- 14. Takahata Y, Hagino H, Kimura A, et al. Smoc1 and Smoc2 regulate bone formation as downstream molecules of Runx2. Commun Biol. 2021;4(1):1‐11. doi: 10.1038/s42003-021-02717-7 [DOI] [PMC free article] [PubMed] [Google Scholar]
- 15. Lucero CMJ, Vega OA, Osorio MM, et al. The cancer‐related transcription factor Runx2 modulates cell proliferation in human osteosarcoma cell lines. J Cell Physiol. 2013;228(4):714‐723. doi: 10.1002/jcp.24218 [DOI] [PMC free article] [PubMed] [Google Scholar]
- 16. Kleinerman MD. Current Advances in Osteosarcoma. Vol 804. Springer International Publishing; 2014. [Google Scholar]
- 17. Fang F, VanCleave A, Helmuth R, et al. Targeting the Wnt/β‐catenin pathway in human osteosarcoma cells. Oncotarget. 2018;9(95):36780. doi: 10.18632/oncotarget.26377 [DOI] [PMC free article] [PubMed] [Google Scholar]
- 18. Recine F, Bongiovanni A, Riva N, et al. Update on the role of trabectedin in the treatment of intractable soft tissue sarcomas. Onco Targets Ther. 2017;10:1155‐1164. doi: 10.2147/OTT.S127955 [DOI] [PMC free article] [PubMed] [Google Scholar]
- 19. López‐Pousa A, Martin Broto J, Martinez Trufero J, et al. SEOM clinical guideline of management of soft‐tissue sarcoma (2016). Clin Transl Oncol. 2016;18(12):1213‐1220. doi: 10.1007/s12094-016-1574-1 [DOI] [PMC free article] [PubMed] [Google Scholar]
- 20. Naka N, Takenaka S, Araki N, et al. Synovial sarcoma is a stem cell malignancy. Stem Cells. 2010;28(7):1119‐1131. doi: 10.1002/stem.452 [DOI] [PubMed] [Google Scholar]
- 21. Spiguel A. Soft Tissue Sarcomas. Vol 162. Springer Orthopaedic Oncology; 2014:203‐223. doi: 10.1007/978-3-319-07323-1_10 [DOI] [PubMed] [Google Scholar]
- 22. Li X, Liu R, Shi T, et al. Primary pulmonary malignant fibrous histiocytoma: case report and literature review. J Thorac Dis. 2017;9(8):E702. doi: 10.21037/jtd.2017.07.59 [DOI] [PMC free article] [PubMed] [Google Scholar]
- 23. Feng W, Dean DC, Hornicek FJ, et al. Myc is a prognostic biomarker and potential therapeutic target in osteosarcoma. Ther Adv Med Oncol. 2020;12:1758835920922055. doi: 10.1177/1758835920922055 [DOI] [PMC free article] [PubMed] [Google Scholar] [Retracted]
- 24. Both J, Krijgsman O, Bras J, et al. Focal chromosomal copy number aberrations identify CMTM8 and GPR177 as new candidate driver genes in osteosarcoma. PLoS One. 2014;9(12):e115835. doi: 10.1371/journal.pone.0115835 [DOI] [PMC free article] [PubMed] [Google Scholar]
- 25. Smida J, Xu H, Zhang Y, et al. Genome‐wide analysis of somatic copy number alterations and chromosomal breakages in osteosarcoma. Int J Cancer. 2017;141(4):816‐828. doi: 10.1002/ijc.30778 [DOI] [PubMed] [Google Scholar]
- 26. Sato M, Larsen JE, Lee W, et al. Human lung epithelial cells progressed to malignancy through specific oncogenic manipulations. Mol Cancer Res. 2013;11(6):638‐650. doi: 10.1158/1541-7786.MCR-12-0634-T [DOI] [PMC free article] [PubMed] [Google Scholar]
- 27. Terada Y, Jo N, Arakawa Y, et al. Human pluripotent stem cell‐derived tumor model uncovers the embryonic stem cell signature as a key driver in atypical teratoid/rhabdoid tumor. Cell Rep. 2019;26(10):2608‐2621. doi: 10.1016/j.celrep.2019.02.009 [DOI] [PubMed] [Google Scholar]
- 28. Xue Y, Fu Y, Zhao F, et al. Frondoside a inhibits an MYC‐driven medulloblastoma model derived from human‐induced pluripotent stem cells. Mol Cancer Ther. 2021;20(6):1199‐1209. doi: 10.1158/1535-7163.MCT-20-0603 [DOI] [PMC free article] [PubMed] [Google Scholar]
- 29. Lee DF, Su J, Kim HS, et al. Modeling familial cancer with induced pluripotent stem cells. Cell. 2015;161(2):240‐254. doi: 10.1016/j.cell.2015.02.045 [DOI] [PMC free article] [PubMed] [Google Scholar]
- 30. Mutsaers AJ, Walkley CR. Cells of origin in osteosarcoma: mesenchymal stem cells or osteoblast committed cells? Bone. 2014;62:56‐63. doi: 10.1016/j.bone.2014.02.003 [DOI] [PubMed] [Google Scholar]
- 31. Pompetti F, Rizzo P, Simon RM, et al. Oncogene alterations in primary, recurrent, and metastatic human bone tumors. J Cell Biochem. 1996;63(1):37‐50. doi: 10.1158/1535-7163.MCT-20-0603 [DOI] [PubMed] [Google Scholar]
- 32. Wu Z, Min L, Chen D, et al. Overexpression of BMI‐1 promotes cell growth and resistance to cisplatin treatment in osteosarcoma. PLoS One. 2011;6(2):e14648. doi: 10.1371/journal.pone.0014648 [DOI] [PMC free article] [PubMed] [Google Scholar]
- 33. Gomez‐Brouchet A, Mourcin F, Gourraud PA, et al. Galectin‐1 is a powerful marker to distinguish chondroblastic osteosarcoma and conventional chondrosarcoma. Hum Pathol. 2010;41(9):1220‐1230. doi: 10.1016/j.humpath.2009.10.028 [DOI] [PubMed] [Google Scholar]
- 34. Salas S, de Pinieux G, Gomez‐Brouchet A, et al. Ezrin immunohistochemical expression in cartilaginous tumours: a useful tool for differential diagnosis between chondroblastic osteosarcoma and chondrosarcoma. Virchows Arch. 2009;454(1):81‐87. doi: 10.1007/s00428-008-0692-8 [DOI] [PubMed] [Google Scholar]
- 35. Robles AI, Jen J, Harris CC. Clinical outcomes of TP53 mutations in cancers. Cold Spring Harb Perspect Med. 2016;6(9):a026294. doi: 10.1101/cshperspect.a026294 [DOI] [PMC free article] [PubMed] [Google Scholar]
- 36. Kuijjer ML, Namløs HM, Hauben EI, et al. mRNA expression profiles of primary high‐grade central osteosarcoma are preserved in cell lines and xenografts. BMC Med Genomics. 2011;4(1):1‐12. doi: 10.1186/1755-8794-4-66 [DOI] [PMC free article] [PubMed] [Google Scholar]
- 37. Zhou Y, Yang D, Yang Q, et al. Single‐cell RNA landscape of intratumoral heterogeneity and immunosuppressive microenvironment in advanced osteosarcoma. Nat Commun. 2020;11(1):1‐17. doi: 10.1038/s41467-020-20059-6 [DOI] [PMC free article] [PubMed] [Google Scholar]
- 38. Katoh Y, Katoh M. Integrative genomic analyses on GLI1: positive regulation of GLI1 by hedgehog‐GLI, TGFβ‐Smads, and RTK‐PI3K‐AKT signals, and negative regulation of GLI1 by notch‐CSL‐HES/HEY, and GPCR‐Gs‐PKA signals. Int J Oncol. 2009;35(1):187‐192. doi: 10.3892/ijo_00000328 [DOI] [PubMed] [Google Scholar]
- 39. Takano Y, Kato Y, Masuda M, Ohshima Y, Okayasu I. Cyclin D2, but not cyclin D1, overexpression closely correlates with gastric cancer progression and prognosis. J Pathol. 1999;189(2):194‐200. doi: 10.1002/(SICI)1096-9896(199910)189:2<194::AID-PATH426>3.0.CO;2-P [DOI] [PubMed] [Google Scholar]
- 40. Doush Y, Surani AA, Navarro‐Corcuera A, McArdle S, Billett EE, Montiel‐Duarte C. SP1 and RARα regulate AGAP2 expression in cancer. Sci Rep. 2019;9:1‐12. doi: 10.1038/s41598-018-36888-x [DOI] [PMC free article] [PubMed] [Google Scholar]
- 41. Shu X, Li X, Xiang X, Wang Q, Wu Q. METTL21B is a prognostic biomarker and potential therapeutic target in low‐grade gliomas. Aging. 2021;13(16):20661‐20683. doi: 10.18632/aging.203454 [DOI] [PMC free article] [PubMed] [Google Scholar]
- 42. Iwata S, Tatsumi Y, Yonemoto T, et al. CDK4 overexpression is a predictive biomarker for resistance to conventional chemotherapy in patients with osteosarcoma. Oncol Rep. 2021;46(1):1‐11. doi: 10.3892/or.2021.8086 [DOI] [PubMed] [Google Scholar]
- 43. Zhang J, Liu S, Li Q, et al. The deubiquitylase USP2 maintains ErbB2 abundance via counteracting endocytic degradation and represents a therapeutic target in ErbB2‐positive breast cancer. Cell Death Differ. 2020;27(9):2710‐2725. doi: 10.1038/s41418-020-0538-8 [DOI] [PMC free article] [PubMed] [Google Scholar]
- 44. Wang W, Yan T, Guo W, et al. Constitutive GLI1 expression in chondrosarcoma is regulated by major vault protein via mTOR/S6K1 signaling cascade. Cell Death Differ. 2021;28(7):2221‐2237. doi: 10.1038/s41418-021-00749-4 [DOI] [PMC free article] [PubMed] [Google Scholar]
- 45. Fry DW, Harvey PF, Keller PR, et al. Specific inhibition of cyclin‐dependent kinase 4/6 by PD 0332991 and associated antitumor activity in human tumor xenografts. Mol Cancer Ther. 2004;3(11):1427‐1438. doi: 10.1158/1535-7163.1427.3.11 [DOI] [PubMed] [Google Scholar]
Associated Data
This section collects any data citations, data availability statements, or supplementary materials included in this article.
Supplementary Materials
Figure S1
Figure S2
Figure S3
Figure S4
Figure S5
Figure S6
Appendix S1
Tables S1–S5