

Abstract
Aim
The National Clinical Database (NCD) of Japan is a nationwide data entry system for surgery, and it marked its 10th anniversary in 2020. The aim was to present the 2020 annual report of gastroenterological surgery of the NCD.
Methods
The data of the surgical procedures stipulated by the training curriculum for board‐certified surgeons of the Japanese Society of Gastroenterological Surgery in the NCD from 2011 to 2020 were summarized.
Results
In total, 5 622 845 cases, including 593 088 cases in 2020, were extracted from the NCD. The total number of gastroenterological surgeries increased gradually in these 10 years, except for the year 2020 due to the COVID‐19 pandemic. The annual number of surgeries of each organ, except the pancreas and liver, decreased by 0.4%–13.1% in 2020 compared to 2019. The surgical patients were consistently aging, with more than 20% of all gastroenterological surgeries in 2020 involving patients aged 80 years or older. The participation of board‐certified surgeons increased for each organ (75.9%–95.7% in 2020). The rates of endoscopic surgery also increased constantly. Although the incidences of postoperative complications of each organ increased by 0.7%–7.9% in these 10 years, postoperative mortality rates decreased by 0.2%–1.5%.
Conclusions
We present here the short‐term outcomes of each gastroenterological operative procedure in 2020. This review of the 10‐years of NCD data of gastroenterological surgery revealed a consistent increase of the number of surgeries (except for in 2020), especially endoscopic procedures, and aging of the Japanese population. The good safety of Japanese gastroenterological surgeries was also indicated.
Keywords: annual report, gastroenterological surgery, National Clinical Database, short‐term outcome, surgical outcome
This study presents the annual report on the National Clinical Database 2020 for gastroenterological surgery in Japan. This manuscript revealed a consistent increase of the number of surgeries, especially with endoscopic surgeries, and aging of the Japanese population. Moreover, it indicated the good safety of Japanese gastroenterological surgeries, most of which have been increasingly carried out by the board‐certified surgeons.

1. INTRODUCTION
The Japanese National Clinical Database (NCD) is a large‐scale, nationwide, web‐based data entry system for surgical procedures that was established with major support from the many Japanese professional surgical societies, including the Japanese Society of Gastroenterological Surgery (JSGS), and it marked its 10th anniversary in 2020. 1 The NCD has grown into a large, nationwide database covering more than 95% of the surgeries performed by general surgeons in Japan. 2 The NCD started its data registration in 2011, and since then over 5500 facilities have enrolled, and over 14 000 000 cases have been registered in 10 years. 3
The JSGS specified the 121 gastroenterological operative procedures as a requirement for board certification. Gastroenterological surgical procedures are classified into three groups according to their technical level: low, medium, and high degree of difficulty. In addition, the JSGS specified the eight major procedures (esophagectomy, distal gastrectomy, total gastrectomy, right hemicolectomy, low anterior resection, hepatectomy, pancreaticoduodenectomy, and acute diffuse peritonitis surgery) for special emphasis in terms of medical standards for improvement of surgical quality. 4 All surgical cases were registered in the NCD with the data for postoperative short‐term outcomes and detailed data, such as comorbidities and morbidities, for the eight major procedures. Risk models of mortality 5 , 6 , 7 , 8 , 9 , 10 , 11 , 12 and morbidity 13 , 14 , 15 , 16 , 17 , 18 , 19 , 20 , 21 for these eight major procedures have been reported, which were the risk stratification studies based on all real‐world Japanese data from the NCD. Based on these studies, a real‐time feedback system, which includes a risk calculator for the expected mortalities and morbidities of preoperative patients, was established on the NCD website. 4 This feedback system shows each facility's severity‐adjusted clinical performance compared to the national data. It also indicates the risk‐adjusted cumulative expected and observed number of deaths in individual institutions.
The major purpose of the NCD is to contribute to the maintenance or improvement of medical quality. Therefore, the data registered in the NCD have been used steadily, as mentioned above. Data reliability and disclosure are also vitally important. For the former, to assure the reliability of data of gastroenterological surgeries that had been collected by the NCD, the JSGS started data verification annually in 2015 and demonstrated the high accuracy of the accumulated data. 22 , 23 As for the latter, NCD annual reports, which reflect the real‐world surgical outcomes of Japanese gastroenterological surgeries, have been published. 24 , 25 , 26 , 27 In this paper, following previous annual reports, the short‐term outcomes of each gastroenterological operative procedure in 2020 will be reported. Additionally, important findings on the changes over time in gastroenterological surgeries in Japan between 2011 and 2020 will be described.
2. SUBJECTS AND METHODS
The subjects were patients who underwent one or more of the 121 surgical procedures specified by the Training Curriculum for Board‐Certified Surgeons in Gastroenterology and had their surgical data recorded from 2011 to 2020 in the NCD system. As previously reported, 24 , 25 , 26 , 27 the clinical data of these patients were collected from the NCD database. Data were extracted in a secure system without any external connection, and basic statistical analysis was carried out by NCD statisticians. For each surgical procedure, the mortality rate and the number of surgical cases by sex, age, and postoperative complications were calculated. Postoperative complications that were grade III or more severe in the Clavien–Dindo (C‐D) classification 28 were defined as severe complications. The proportion of the institutions certified by the JSGS and participation of specialists (anesthesiologists and board‐certified surgeons) were also calculated for each surgical procedure.
The training institutions (board‐certified institutions and their affiliated hospitals) and board‐certified surgeons in gastroenterology are stipulated by the JSGS. The major requirements for board‐certified institutions include (A) 600 or more gastroenterological operations stipulated by the certification committee, of which more than 120 are bound to be essential major surgeries, in the last 3 years, (B) one or more consultant surgeons (board‐certified surgeons who are certified as educators by the JSGS based on the clinical and academic experiences), and (C) sufficient educational opportunities and academic activity. For affiliated institutions of board‐certified institutions, at least one board‐certified surgeon, 20 beds for gastroenterological division, and specified curriculum systems are required. Board‐certified surgeons need the experience of 300 or more gastroenterological operations and gastroenterological surgical training for more than 4 years according to the training curriculum in training institutions of the JSGS as noted above.
The following points need to be considered in the interpretation of the data reported here. First, cases in which several operative methods were performed simultaneously were tallied per individual operative methods. Since a maximum of eight operative procedures can be recorded per case in the NCD, the total number of surgeries for each result does not represent the actual total number of surgical cases. Second, cases with errors in patient age, sex, and postoperative 30‐day status were excluded. Thus, four surgical procedures (hemorrhoidectomy, perianal abscess drainage, surgery for anal fistula, and abdominal/inguinal hernioplasty) were excluded in this report, because postoperative 30‐day status was unknown. Finally, postoperative 30‐day mortality included all cases of death within 30 days from surgery, whether or not the patient was discharged. Operative mortality was a number that combined 30‐day mortality and in‐hospital deaths 31–90 days after surgery.
3. RESULTS
3.1. Gastroenterological operative procedures in the “Training Curriculum for Board‐Certified Surgeons in Gastroenterology” in 2020
The total number of patients who underwent gastroenterological surgeries recorded in the NCD from January 1 to December 31 in 2020 was 593 088. In the analyses regarding the treated organ, 8713 cases included the esophagus (1.5%); 57 171 cases, the stomach and duodenum (9.6%); 238 631 cases, the small intestine and colon (40.2%); 55 536 cases, the rectum and anus (9.3%); 26 614 cases the liver (4.5%); 134 332 cases, the gallbladder (22.6%); 19 947 cases, the pancreas (3.4%); 2096 cases, the spleen (0.4%); and 50 048 cases, other organs (8.4%).
Table 1 shows the number of surgeries and characteristics of each operative procedure in the “Training Curriculum for Board‐Certified Surgeons in Gastroenterology” in 2020. The percentage of surgeries performed with the participation of an anesthesiologist was approximately 95%, except for anal surgeries (e.g., anal sphincteroplasty, 21.5%; transanal rectal tumor resection, 36.0%; proctocele surgery, 55.2%). The rates of participation of JSGS board‐certified surgeons in 2020 were approximately 95% for the surgeries of esophagus, liver, and pancreas. In contrast, the rates were relatively low for surgeries of the small intestine and colon (mean: 75.9%), gallbladder (77.7%), and other organs (76.1%).
TABLE 1.
Characteristics of each operative procedures of the “Training Curriculum for Board‐Certified Surgeons in Gastroenterology” in 2020
| Organ | Difficulty level | Operative procedure | No. of surgeries | Sex male (%) | Age ≥ 80 (%) | Anesthesiologist participation (%) | Board‐certified surgeon participation (%) | Operating surgeon (%) | |
|---|---|---|---|---|---|---|---|---|---|
| Board‐certified surgeon | Non‐board‐ certified surgeon | ||||||||
| Esophagus | Low | Cervical periesophageal abscess drainage | 34 | 79.4 | 14.7 | 97.1 | 94.1 | 70.6 | 29.4 |
| Med | Esophageal suture (perforation, injury) | 178 | 78.1 | 20.2 | 94.9 | 87.1 | 59.0 | 41.0 | |
| Med | Thoracic periesophageal abscess drainage | 18 | 94.4 | 16.7 | 100.0 | 94.4 | 83.3 | 16.7 | |
| Med | Esophageal foreign body extraction | 30 | 63.3 | 23.3 | 96.7 | 86.7 | 70.0 | 30.0 | |
| Med | Esophageal diverticulum resection | 40 | 57.5 | 12.5 | 100.0 | 85.0 | 77.5 | 22.5 | |
| Med | Benign esophageal tumor removal | 44 | 40.9 | 0.0 | 100.0 | 100.0 | 84.1 | 15.9 | |
| Med | Esophageal resection (removal only) | 607 | 80.4 | 14.2 | 98.4 | 91.6 | 72.3 | 27.7 | |
| Med | Esophageal reconstruction (gastric tube reconstruction) | 535 | 80.0 | 7.7 | 98.9 | 96.4 | 79.4 | 20.6 | |
| Med | Esophageal fistula construction | 172 | 87.2 | 12.8 | 94.2 | 94.8 | 83.1 | 16.9 | |
| Med | Esophagocardioplasty | 218 | 43.1 | 30.3 | 95.0 | 80.3 | 54.6 | 45.4 | |
| Med | Achalasia surgery | 189 | 54.0 | 10.1 | 97.4 | 57.7 | 32.3 | 67.7 | |
| High | Esophagectomy | 6111 | 80.4 | 8.2 | 99.3 | 98.0 | 82.1 | 17.9 | |
| High | Esophageal reconstruction (colon reconstruction) | 21 | 90.5 | 19.0 | 100.0 | 95.2 | 85.7 | 14.3 | |
| High | Esophageal bypass | 135 | 85.9 | 9.6 | 99.3 | 94.8 | 58.5 | 41.5 | |
| High | Bronchoesophageal fistula surgery | 7 | 57.1 | 0.0 | 100.0 | 100.0 | 42.9 | 57.1 | |
| High | Secondary esophageal reconstruction | 374 | 88.2 | 11.2 | 99.2 | 98.1 | 75.4 | 24.6 | |
| Stomach and duodenum | Low | Gastrostomy and suture gastrorrhaphy | 69 | 46.4 | 15.9 | 94.2 | 73.9 | 27.5 | 72.5 |
| Low | Diverticulectomy, polypectomy (excluding endoscopic resection) | 162 | 51.2 | 16.0 | 95.1 | 88.9 | 54.9 | 45.1 | |
| Low | Truncal vagotomy | 1 | 100.0 | 0.0 | 100.0 | 100.0 | 0.0 | 100.0 | |
| Low | Gastroenterostomy (Including duodenal jejunostomy) | 5908 | 62.5 | 27.7 | 95.4 | 83.5 | 38.8 | 61.2 | |
| Low | Gastric fistula construction (Excluding PEG) | 1511 | 68.0 | 29.3 | 92.1 | 76.2 | 40.9 | 59.1 | |
| Low | Gastric pyloroplasty | 109 | 75.2 | 6.4 | 95.4 | 66.1 | 31.2 | 68.8 | |
| Low | Gastric volvulus surgery and rectopexy | 60 | 45.0 | 38.3 | 95.0 | 76.7 | 40.0 | 60.0 | |
| Low | Gastric suture (including gastric suture for gastric rupture, suture closure for gastroduodenal perforation, omental implantation and omental transposition) | 5246 | 65.5 | 24.6 | 93.2 | 72.1 | 28.7 | 71.3 | |
| Low | Local gastrectomy (including wedge resection) | 4504 | 49.6 | 13.9 | 96.6 | 88.6 | 49.5 | 50.5 | |
| Med | Gastrectomy (including distal, pylorus preserving and segmental) | 28 944 | 67.1 | 25.4 | 96.1 | 87.9 | 51.4 | 48.6 | |
| Med | Selective vagotomy | 2 | 100.0 | 0.0 | 100.0 | 100.0 | 50.0 | 50.0 | |
| High | Total gastrectomy (including proximal gastrectomy) | 10 652 | 75.2 | 22.0 | 96.0 | 86.7 | 51.8 | 48.2 | |
| High | Left upper abdominal exenteration | 3 | 66.7 | 0.0 | 100.0 | 100.0 | 100.0 | 0.0 | |
| Small intestine and colon | Low | Enterotomy and enterorrhaphy | 4477 | 57.4 | 23.9 | 93.3 | 78.2 | 38.1 | 61.9 |
| Low | Disinvagination (invasive) | 168 | 56.5 | 25.0 | 94.0 | 69.0 | 22.0 | 78.0 | |
| Low | Partial small bowel resection (benign) | 9046 | 57.0 | 30.6 | 94.6 | 76.0 | 33.2 | 66.8 | |
| Low | Ileocecal resection (benign) | 4783 | 57.1 | 17.7 | 94.4 | 76.6 | 31.5 | 68.5 | |
| Low | Partial colectomy and sigmoid colectomy (benign) | 8204 | 61.0 | 26.7 | 94.4 | 76.8 | 32.8 | 67.2 | |
| Low | Appendectomy | 57 282 | 55.7 | 6.0 | 92.2 | 63.8 | 21.7 | 78.3 | |
| Low | Enterostomy and closure (without enterectomy) | 27 445 | 63.2 | 20.0 | 95.4 | 79.9 | 41.6 | 58.4 | |
| Med | Small bowel resection (malignant) | 3853 | 54.5 | 18.8 | 96.4 | 80.6 | 40.3 | 59.7 | |
| Med | Ileocecal resection (malignant) | 14 587 | 46.0 | 32.2 | 96.0 | 82.2 | 34.6 | 65.4 | |
| Med | Partial colectomy and sigmoid colectomy (malignant) | 30 372 | 57.1 | 24.1 | 96.1 | 84.3 | 43.4 | 56.6 | |
| Med | Right hemicolectomy | 21 626 | 51.1 | 32.9 | 95.4 | 81.5 | 40.3 | 59.7 | |
| Med | Left hemicolectomy | 6037 | 58.1 | 23.8 | 95.8 | 80.9 | 44.2 | 55.8 | |
| Med | Total colectomy | 1565 | 58.8 | 22.3 | 96.1 | 81.1 | 45.4 | 54.6 | |
| Med | Intestinal obstruction surgery (with enterectomy) | 25 480 | 49.8 | 37.5 | 93.8 | 73.4 | 30.7 | 69.3 | |
| Med | Enterostomy and closure (with enterectomy) | 23 316 | 63.4 | 18.0 | 95.5 | 79.7 | 38.2 | 61.8 | |
| High | Proctocolectomy and ileoanal (canal) anastomosis | 390 | 64.4 | 1.3 | 96.4 | 95.4 | 67.9 | 32.1 | |
| Rectum | Low | Transanal rectal tumor resection | 3469 | 49.9 | 13.2 | 36.0 | 58.0 | 38.7 | 61.3 |
| Low | Proctocele surgery (transanal) | 2330 | 14.4 | 63.6 | 55.2 | 59.5 | 34.1 | 65.9 | |
| Med | Abdominoperineal resection (benign) | 1120 | 60.5 | 18.8 | 95.0 | 81.4 | 49.6 | 50.4 | |
| Med | High anterior resection | 11 276 | 58.8 | 18.3 | 96.1 | 86.5 | 48.4 | 51.6 | |
| Med | Hartmann's procedure | 6518 | 54.8 | 38.2 | 95.1 | 79.9 | 35.5 | 64.5 | |
| Med | Proctocele surgery (abdominoperineal) | 1983 | 10.9 | 59.1 | 90.7 | 76.6 | 46.4 | 53.6 | |
| Med | Malignant anorectal tumor excision (transanal) | 707 | 53.7 | 29.1 | 81.0 | 78.5 | 52.1 | 47.9 | |
| Med | Anal sphincteroplasty (by tissue replacement) | 2591 | 53.5 | 11.3 | 21.5 | 56.1 | 40.4 | 59.6 | |
| High | Abdominoperineal resection (malignant) | 4959 | 63.4 | 22.1 | 96.5 | 88.6 | 60.3 | 39.7 | |
| High | Low anterior resection | 20 022 | 63.9 | 13.7 | 96.1 | 88.2 | 60.6 | 39.4 | |
| High | Total pelvic exenteration | 517 | 68.1 | 5.2 | 97.7 | 91.5 | 73.9 | 26.1 | |
| High | Anorectal malignant tumor excision (posterior approach) | 44 | 47.7 | 11.4 | 88.6 | 79.5 | 45.5 | 54.5 | |
| Liver | Low | Hepatorrhaphy | 70 | 68.6 | 17.1 | 88.6 | 72.9 | 37.1 | 62.9 |
| Low | Liver abscess drainage (excluding percutaneous procedures) | 52 | 57.7 | 44.2 | 96.2 | 84.6 | 38.5 | 61.5 | |
| Low | Hepatic cyst resection, suture, drainage | 900 | 26.4 | 19.8 | 96.2 | 87.9 | 47.3 | 52.7 | |
| Low | Liver biopsy (excluding percutaneous procedures) | 291 | 52.9 | 4.8 | 82.5 | 84.9 | 38.8 | 61.2 | |
| Low | Liver coagulo‐necrotic therapy (excluding percutaneous procedures) | 534 | 74.3 | 19.1 | 97.9 | 94.4 | 65.7 | 34.3 | |
| Med | Partial hepatectomy | 12 668 | 66.7 | 14.2 | 98.0 | 94.8 | 65.3 | 34.7 | |
| Med | Lateral segmentectomy | 1451 | 65.8 | 18.7 | 97.6 | 93.3 | 60.6 | 39.4 | |
| Med | Esophageal and gastric varix surgery | 44 | 54.5 | 4.5 | 68.2 | 38.6 | 20.5 | 79.5 | |
| High | Surgery for hepatic trauma (excluding drainage only) | 363 | 73.6 | 14.9 | 79.6 | 63.4 | 35.0 | 65.0 | |
| High | Hepatectomy (segmentectomy or more; excluding lateral segmentectomy) | 6753 | 68.4 | 14.7 | 98.1 | 97.3 | 76.5 | 23.5 | |
| High | Subsegmentectomy | 2664 | 71.7 | 14.1 | 97.4 | 96.8 | 74.2 | 25.8 | |
| High | Liver transplantation | 692 | 52.7 | 0.0 | 98.8 | 98.6 | 78.8 | 21.2 | |
| High | Hepatopancreatoduodenectomy | 132 | 77.3 | 7.6 | 98.5 | 99.2 | 81.1 | 18.9 | |
| Gall bladder | Low | Cholangiotomy | 78 | 56.4 | 43.6 | 93.6 | 88.5 | 44.9 | 55.1 |
| Low | Cysticolithectomy | 74 | 58.1 | 32.4 | 89.2 | 75.7 | 28.4 | 71.6 | |
| Low | Cholecystectomy | 127 454 | 55.8 | 17.2 | 94.7 | 77.1 | 32.7 | 67.3 | |
| Low | External cholecystostomy | 104 | 61.5 | 43.3 | 70.2 | 78.8 | 48.1 | 51.9 | |
| Low | Cystoenteric anastomosis | 37 | 51.4 | 45.9 | 97.3 | 73.0 | 40.5 | 59.5 | |
| Med | Cysticolithectomy | 2360 | 60.5 | 40.5 | 93.6 | 82.1 | 40.6 | 59.4 | |
| Med | Biliary tract reconstruction | 325 | 53.2 | 18.2 | 98.8 | 95.1 | 69.8 | 30.2 | |
| Med | Biliary bypass | 1112 | 57.0 | 25.6 | 95.8 | 91.1 | 53.7 | 46.3 | |
| Med | Cholangioplasty | 114 | 57.0 | 16.7 | 96.5 | 93.9 | 73.7 | 26.3 | |
| Med | Duodenal papilloplasty | 15 | 66.7 | 26.7 | 100.0 | 80.0 | 46.7 | 53.3 | |
| Med | Choledocal dilatation | 265 | 22.6 | 1.1 | 98.5 | 88.3 | 55.8 | 44.2 | |
| Med | Biliary fistula closure | 35 | 69.7 | 15.2 | 97.0 | 75.8 | 36.4 | 63.6 | |
| High | Surgery for bile duct trauma (excluding drainage only) | 225 | 58.2 | 25.3 | 96.9 | 83.6 | 45.8 | 54.2 | |
| High | Malignant gallbladder tumor surgery (excluding simple cholecystectomy) | 1019 | 55.4 | 23.6 | 97.4 | 93.4 | 57.5 | 42.5 | |
| High | Malignant bile duct tumor surgery | 1093 | 68.5 | 20.9 | 97.3 | 96.7 | 76.9 | 23.1 | |
| High | Biliary atresia surgery | 24 | 16.7 | 4.2 | 100.0 | 58.3 | 16.7 | 83.3 | |
| Pancreas | Low | External pancreatic cyst drainage | 2 | 0.0 | 0.0 | 100.0 | 50.0 | 0.0 | 100.0 |
| Low | External pancreatic duct drainage | 12 | 66.7 | 8.3 | 75.0 | 83.3 | 58.3 | 41.7 | |
| Med | Pancreatorrhaphy | 6 | 33.3 | 0.0 | 100.0 | 83.3 | 50.0 | 50.0 | |
| Med | Partial pancreatic resection | 174 | 45.4 | 10.9 | 97.7 | 93.1 | 73.6 | 26.4 | |
| Med | Distal pancreatectomy (benign) | 1401 | 43.3 | 9.0 | 96.7 | 94.8 | 69.7 | 30.3 | |
| Med | Pancreatic cyst‐enterostomy | 27 | 77.8 | 18.5 | 96.3 | 96.3 | 59.3 | 40.7 | |
| Med | Pancreatic (duct) enterostomy | 289 | 68.2 | 7.6 | 94.5 | 96.9 | 74.7 | 25.3 | |
| Med | Acute pancreatitis surgery | 78 | 80.8 | 19.2 | 73.1 | 64.1 | 38.5 | 61.5 | |
| Med | Pancreatolithiasis surgery | 27 | 81.5 | 0.0 | 96.3 | 88.9 | 63.0 | 37.0 | |
| Med | Plexus pancreaticus capitalis resection | 0 | ‐ | ‐ | ‐ | ‐ | ‐ | ‐ | |
| High | Surgery for pancreatic trauma (excluding drainage only) | 54 | 70.4 | 11.1 | 90.7 | 77.8 | 42.6 | 57.4 | |
| High | Pancreaticoduodenectomy | 11 953 | 60.6 | 16.0 | 97.9 | 96.4 | 71.2 | 28.8 | |
| High | Distal pancreatectomy (malignant) | 4912 | 56.2 | 18.0 | 97.7 | 94.8 | 68.5 | 31.5 | |
| High | Total pancreatectomy | 636 | 0.0 | 0.0 | 100.0 | 100.0 | 100.0 | 0.0 | |
| High | Duodenum preserving pancreas head resection | 34 | 57.7 | 11.6 | 98.3 | 98.1 | 75.0 | 25.0 | |
| High | Segmental pancreatic resection | 157 | 61.8 | 14.7 | 97.1 | 100.0 | 70.6 | 29.4 | |
| High | Pancreatic transplantation | 20 | 49.7 | 5.1 | 98.1 | 94.3 | 72.0 | 28.0 | |
| Spleen | Low | Splenorrhaphy | 36 | 66.7 | 19.4 | 94.4 | 69.4 | 33.3 | 66.7 |
| Med | Splenectomy | 2045 | 54.3 | 12.3 | 96.5 | 88.7 | 56.1 | 43.9 | |
| Med | Partial splenectomy | 15 | 33.3 | 6.7 | 100.0 | 86.7 | 53.3 | 46.7 | |
| Other | Low | Localized intra‐abdominal abscess surgery | 2376 | 60.1 | 18.0 | 93.1 | 73.4 | 33.5 | 66.5 |
| Low | Exploratory laparotomy | 12 401 | 60.3 | 18.0 | 94.3 | 78.5 | 40.4 | 59.6 | |
| Med | Acute diffuse peritonitis surgery | 15 542 | 58.9 | 27.8 | 94.6 | 76.1 | 31.7 | 68.3 | |
| Med | Ventral hernia surgery | 14 136 | 46.4 | 21.6 | 93.6 | 71.8 | 35.2 | 64.8 | |
| Med | Diaphragm suture | 294 | 56.1 | 18.7 | 94.2 | 81.3 | 44.6 | 55.4 | |
| Med | Esophageal hiatus hernia surgery | 1217 | 33.5 | 39.6 | 96.1 | 87.9 | 56.0 | 44.0 | |
| Med | Retroperitoneal tumor surgery | 1551 | 48.2 | 9.4 | 96.6 | 85.1 | 58.3 | 41.7 | |
| Med | Abdominal wall/mesenteric/omental tumor resection | 2054 | 50.1 | 11.0 | 96.4 | 80.6 | 44.4 | 55.6 | |
| Med | Gastrointestinal perforation closure | 421 | 64.1 | 29.5 | 90.0 | 75.3 | 35.4 | 64.6 | |
| High | Diaphragmatic hiatus hernia surgery | 56 | 44.6 | 25.0 | 96.4 | 87.5 | 53.6 | 46.4 | |
The short‐term outcomes of each operative procedure are presented in Table 2. Among the 121 gastroenterological procedures that had been performed in over 100 cases in 2020, those with high operative mortality (>10%) were surgeries for hepatic trauma (excluding drainage only) (27.5%), gastrointestinal perforation closure (16.2%), hepatopancreatoduodenectomy (13.6%), total colectomy (13.5%), external cholecystostomy (13.5%), esophageal fistula construction (12.8%), acute diffuse peritonitis surgery (11.5%), and partial small bowel resection (for benign) (10.6%). Of these eight procedures, the difficulty level was high in two procedures (surgery for hepatic trauma and hepatopancreatoduodenectomy) and moderate or low in the others.
TABLE 2.
Number of surgeries and short‐term outcome of each operative procedures of the “Training Curriculum for Board‐Certified Surgeons in Gastroenterology” in 2020
| Organ | Difficulty level | Operative procedure | No. of surgeries | Endoscopic surgeries (%) | Emergency surgeries (%) | Postoperative complications a (%) | re‐operations (%) | Postoperative 30‐day mortalities (%) | Operative mortalities b (%) |
|---|---|---|---|---|---|---|---|---|---|
| Esophagus | Low | Cervical periesophageal abscess drainage | 34 | 17.6 | 73.5 | 29.4 | 8.8 | 2.9 | 8.8 |
| Med | Esophageal suture (perforation, injury) | 178 | 11.8 | 70.8 | 35.4 | 12.9 | 4.5 | 9.0 | |
| Med | Thoracic periesophageal abscess drainage | 18 | 11.1 | 100.0 | 50.0 | 27.8 | 0.0 | 0.0 | |
| Med | Esophageal foreign body extraction | 30 | 16.7 | 76.7 | 13.3 | 10.0 | 0.0 | 3.3 | |
| Med | Esophageal diverticulum resection | 40 | 22.5 | 5.0 | 7.5 | 7.5 | 0.0 | 0.0 | |
| Med | Benign esophageal tumor removal | 44 | 77.3 | 0.0 | 6.8 | 2.3 | 0.0 | 0.0 | |
| Med | Esophageal resection (removal only) | 607 | 60.1 | 6.3 | 16.6 | 14.8 | 1.5 | 4.6 | |
| Med | Esophageal reconstruction (gastric tube reconstruction) | 535 | 67.1 | 0.4 | 20.2 | 4.7 | 1.1 | 3.4 | |
| Med | Esophageal fistula construction | 172 | 46.5 | 27.9 | 33.1 | 29.1 | 5.2 | 12.8 | |
| Med | Esophagocardioplasty | 218 | 72.5 | 3.2 | 11.0 | 5.5 | 1.4 | 1.8 | |
| Med | Achalasia surgery | 189 | 86.8 | 0.5 | 2.1 | 1.1 | 0.5 | 0.5 | |
| High | Esophagectomy | 6111 | 71.3 | 73.5 | 23.0 | 8.8 | 0.8 | 1.5 | |
| High | Esophageal reconstruction (colon reconstruction) | 21 | 47.6 | 70.8 | 28.6 | 12.9 | 0.0 | 0.0 | |
| High | Esophageal bypass | 135 | 17.8 | 100.0 | 31.1 | 27.8 | 3.7 | 8.9 | |
| High | Bronchoesophageal fistula surgery | 7 | 14.3 | 76.7 | 57.1 | 10.0 | 14.3 | 28.6 | |
| High | Secondary esophageal reconstruction | 374 | 12.0 | 5.0 | 32.6 | 7.5 | 1.3 | 3.5 | |
| Stomach and duodenum | Low | Gastrostomy and suture gastrorrhaphy | 69 | 21.7 | 47.8 | 5.8 | 4.3 | 2.9 | 2.9 |
| Low | Diverticulectomy, polypectomy (excluding endoscopic resection) | 162 | 12.3 | 13.0 | 7.4 | 3.1 | 0.6 | 0.6 | |
| Low | Truncal vagotomy | 1 | 100.0 | 0.0 | 0.0 | 0.0 | 0.0 | 0.0 | |
| Low | Gastroenterostomy (including duodenal jejunostomy) | 5908 | 29.5 | 9.2 | 15.9 | 4.4 | 4.8 | 8.9 | |
| Low | Gastric fistula construction (excluding PEG) | 1511 | 17.6 | 16.1 | 18.9 | 5.4 | 4.5 | 8.9 | |
| Low | Gastric pyloroplasty | 109 | 20.2 | 41.3 | 4.6 | 1.8 | 0.0 | 0.9 | |
| Low | Gastric volvulus surgery and rectopexy | 60 | 58.3 | 23.3 | 5.0 | 1.7 | 3.3 | 3.3 | |
| Low | Gastric suture (including gastric suture for gastric rupture, Suture closure for gastroduodenal perforation, omental implantation and omental transposition) | 5246 | 35.0 | 89.8 | 18.1 | 5.1 | 4.4 | 7.0 | |
| Low | Local gastrectomy (including wedge resection) | 4504 | 69.3 | 3.0 | 3.2 | 1.5 | 0.3 | 0.6 | |
| Med | Gastrectomy (including distal, pylorus preserving and segmental) | 28 944 | 53.8 | 1.9 | 7.7 | 2.5 | 0.8 | 1.3 | |
| Med | Selective vagotomy | 2 | 50.0 | 50.0 | 0.0 | 0.0 | 0.0 | 0.0 | |
| High | Total gastrectomy (including proximal gastrectomy) | 10 652 | 30.4 | 1.9 | 12.0 | 4.0 | 1.3 | 2.2 | |
| High | Left upper abdominal exenteration | 3 | 66.7 | 0.0 | 33.3 | 0.0 | 0.0 | 33.3 | |
| Small intestine and colon | Low | Enterotomy and enterorrhaphy | 4477 | 16.8 | 29.7 | 18.1 | 7.6 | 4.5 | 8.4 |
| Low | Disinvagination (invasive) | 168 | 27.4 | 81.5 | 11.9 | 4.8 | 5.4 | 6.5 | |
| Low | Partial small bowel resection (benign) | 9046 | 19.0 | 63.3 | 21.8 | 10.1 | 7.3 | 10.2 | |
| Low | Ileocecal resection (benign) | 4783 | 43.8 | 48.3 | 9.6 | 3.8 | 2.3 | 2.8 | |
| Low | Partial colectomy and sigmoid colectomy (benign) | 8204 | 33.3 | 46.6 | 16.0 | 6.3 | 4.1 | 5.6 | |
| Low | Appendectomy | 57 282 | 70.8 | 69.2 | 1.8 | 0.9 | 0.1 | 0.2 | |
| Low | Enterostomy and closure (without enterectomy) | 27 445 | 37.0 | 28.5 | 17.3 | 7.7 | 4.0 | 6.6 | |
| Med | Small bowel resection (malignant) | 3853 | 29.2 | 18.1 | 11.9 | 5.2 | 2.4 | 3.9 | |
| Med | Ileocecal resection (malignant) | 14 587 | 62.5 | 5.3 | 5.2 | 2.1 | 0.6 | 1.1 | |
| Med | Partial colectomy and sigmoid colectomy (malignant) | 30 372 | 61.9 | 3.7 | 6.7 | 3.5 | 0.6 | 1.0 | |
| Med | Right hemicolectomy | 21 626 | 54.2 | 8.5 | 8.0 | 3.3 | 1.4 | 2.2 | |
| Med | Left hemicolectomy | 6037 | 54.2 | 9.6 | 10.2 | 5.5 | 2.0 | 2.7 | |
| Med | Total colectomy | 1565 | 30.1 | 36.9 | 26.5 | 8.9 | 10.6 | 13.5 | |
| Med | Intestinal obstruction surgery (with enterectomy) | 25 480 | 23.7 | 66.6 | 10.3 | 4.2 | 2.4 | 3.4 | |
| Med | Enterostomy and closure (with enterectomy) | 23 316 | 17.3 | 21.2 | 14.0 | 5.1 | 3.2 | 4.8 | |
| High | Proctocolectomy and ileoanal (canal) anastomosis | 390 | 55.6 | 5.4 | 13.8 | 7.7 | 0.0 | 0.3 | |
| Rectum | Low | Transanal rectal tumor resection | 3469 | 2.8 | 2.0 | 0.4 | 0.4 | 0.0 | 0.1 |
| Low | Proctocele surgery (transanal) | 2330 | 0.4 | 0.9 | 1.5 | 1.9 | 0.3 | 0.5 | |
| Med | Abdominoperineal resection (benign) | 1120 | 12.1 | 18.8 | 17.9 | 6.3 | 1.9 | 2.9 | |
| Med | High anterior resection | 11 276 | 71.4 | 3.7 | 6.2 | 3.3 | 0.5 | 0.7 | |
| Med | Hartmann's procedure | 6518 | 21.2 | 57.4 | 20.7 | 5.7 | 5.4 | 7.3 | |
| Med | Proctocele surgery (abdominoperineal) | 1983 | 57.2 | 0.7 | 1.9 | 1.7 | 0.2 | 0.2 | |
| Med | Malignant anorectal tumor excision (transanal) | 707 | 13.4 | 6.4 | 5.8 | 5.0 | 1.0 | 1.6 | |
| Med | Anal sphincteroplasty (by tissue replacement) | 2591 | 1.7 | 2.2 | 1.1 | 1.3 | 0.1 | 0.2 | |
| High | Abdominoperineal resection (malignant) | 4959 | 70.9 | 1.0 | 12.3 | 4.6 | 0.6 | 1.1 | |
| High | Low anterior resection | 20 022 | 72.9 | 1.4 | 11.1 | 6.7 | 0.3 | 0.5 | |
| High | Total pelvic exenteration | 517 | 26.3 | 0.6 | 26.3 | 8.5 | 0.8 | 2.1 | |
| High | Anorectal malignant tumor excision (posterior approach) | 44 | 6.8 | 2.3 | 2.3 | 2.3 | 0.0 | 0.0 | |
| Liver | Low | Hepatorrhaphy | 70 | 8.6 | 87.1 | 28.6 | 18.6 | 12.9 | 15.7 |
| Low | Liver abscess drainage (excluding percutaneous procedures) | 52 | 25.0 | 42.3 | 17.3 | 7.7 | 3.8 | 3.8 | |
| Low | Hepatic cyst resection, Suture, Drainage | 900 | 75.7 | 4.6 | 4.8 | 1.0 | 0.3 | 0.3 | |
| Low | Liver biopsy (excluding percutaneous procedures) | 291 | 12.0 | 19.6 | 5.2 | 5.5 | 1.4 | 2.1 | |
| Low | Liver coagulo‐necrotic therapy (excluding percutaneous procedures) | 534 | 20.8 | 0.4 | 5.8 | 2.1 | 0.4 | 0.4 | |
| Med | Partial hepatectomy | 12 668 | 40.3 | 0.7 | 7.1 | 2.0 | 0.5 | 0.7 | |
| Med | Lateral segmentectomy | 1451 | 36.2 | 0.6 | 5.1 | 1.0 | 0.8 | 1.0 | |
| Med | Esophageal and gastric varix surgery | 44 | 47.7 | 22.7 | 11.4 | 2.3 | 2.3 | 4.5 | |
| High | Surgery for hepatic trauma (excluding drainage only) | 363 | 5.8 | 83.2 | 49.3 | 43.8 | 25.6 | 27.5 | |
| High | Hepatectomy (segmentectomy or more; excluding lateral segmentectomy) | 6753 | 15.5 | 0.3 | 15.2 | 3.0 | 1.4 | 2.3 | |
| High | Subsegmentectomy | 2664 | 28.4 | 0.3 | 9.0 | 1.5 | 0.5 | 0.9 | |
| High | Liver transplantation | 692 | 1.0 | 11.7 | 25.7 | 11.3 | 5.5 | 7.4 | |
| High | Hepatopancreatoduodenectomy | 132 | 0.0 | 0.8 | 60.6 | 7.6 | 8.3 | 13.6 | |
| Gall bladder | Low | Cholangiotomy | 78 | 6.4 | 23.1 | 17.9 | 6.4 | 2.6 | 3.8 |
| Low | Cysticolithectomy | 74 | 9.5 | 13.5 | 13.5 | 1.4 | 1.4 | 2.7 | |
| Low | Cholecystectomy | 127 454 | 70.9 | 15.7 | 3.7 | 1.1 | 0.4 | 0.6 | |
| Low | External cholecystostomy | 104 | 8.7 | 56.7 | 25.0 | 17.3 | 9.6 | 13.5 | |
| Low | Cystoenteric anastomosis | 37 | 8.1 | 13.5 | 8.1 | 2.7 | 5.4 | 5.4 | |
| Med | Cysticolithectomy | 2360 | 31.8 | 13.1 | 9.4 | 2.4 | 1.3 | 2.2 | |
| Med | Biliary tract reconstruction | 325 | 5.2 | 4.6 | 21.2 | 4.0 | 1.8 | 3.1 | |
| Med | Biliary bypass | 1112 | 5.2 | 9.6 | 15.4 | 4.8 | 2.4 | 4.3 | |
| Med | Cholangioplasty | 114 | 7.9 | 9.6 | 27.2 | 6.1 | 0.9 | 1.8 | |
| Med | Duodenal papilloplasty | 15 | 0.0 | 6.7 | 13.3 | 13.3 | 0.0 | 0.0 | |
| Med | Choledocal dilatation | 265 | 29.1 | 2.6 | 9.8 | 4.2 | 0.0 | 0.0 | |
| Med | Biliary fistula closure | 35 | 18.2 | 45.5 | 15.2 | 6.1 | 0.0 | 3.0 | |
| High | Surgery for bile duct trauma (excluding drainage only) | 225 | 28.9 | 40.9 | 26.7 | 10.7 | 7.1 | 9.8 | |
| High | Malignant gallbladder tumor surgery (excluding simple cholecystectomy) | 1019 | 7.5 | 0.7 | 12.2 | 2.7 | 0.5 | 0.5 | |
| High | Malignant bile duct tumor surgery | 1093 | 1.1 | 0.5 | 36.1 | 7.5 | 4.8 | 6.9 | |
| High | Biliary atresia surgery | 24 | 41.7 | 33.3 | 8.3 | 4.2 | 0.0 | 0.0 | |
| Pancreas | Low | External pancreatic cyst drainage | 2 | 0.0 | 50.0 | 0.0 | 50.0 | 0.0 | 0.0 |
| Low | External pancreatic duct drainage | 12 | 16.7 | 50.0 | 58.3 | 8.3 | 0.0 | 8.3 | |
| Med | Pancreatorrhaphy | 6 | 0.0 | 83.3 | 0.0 | 16.7 | 0.0 | 0.0 | |
| Med | Partial pancreatic resection | 174 | 30.5 | 0.6 | 20.7 | 3.4 | 0.6 | 1.1 | |
| Med | Distal pancreatectomy (benign) | 1401 | 49.4 | 3.0 | 18.2 | 2.6 | 0.3 | 0.7 | |
| Med | Pancreatic cyst‐enterostomy | 27 | 7.4 | 3.7 | 7.4 | 3.7 | 0.0 | 0.0 | |
| Med | Pancreatic (duct) enterostomy | 289 | 0.7 | 9.7 | 21.5 | 3.5 | 2.1 | 2.8 | |
| Med | Acute pancreatitis surgery | 78 | 3.8 | 44.9 | 41.0 | 39.7 | 9.0 | 20.5 | |
| Med | Pancreatolithiasis surgery | 27 | 3.7 | 0.0 | 11.1 | 0.0 | 0.0 | 0.0 | |
| Med | Plexus pancreaticus capitalis resection | 0 | ‐ | ‐ | ‐ | ‐ | ‐ | ‐ | |
| High | Surgery for pancreatic trauma (excluding drainage only) | 54 | 3.7 | 75.9 | 48.1 | 27.8 | 9.3 | 16.7 | |
| High | Pancreaticoduodenectomy | 11 953 | 3.4 | 0.6 | 24.1 | 3.4 | 1.2 | 1.8 | |
| High | Distal pancreatectomy (malignant) | 4912 | 26.4 | 0.7 | 20.6 | 2.5 | 0.5 | 1.1 | |
| High | Total pancreatectomy | 636 | 1.4 | 3.5 | 14.3 | 4.1 | 2.7 | 3.9 | |
| High | Duodenum preserving pancreas head resection | 34 | 0.0 | 2.9 | 26.5 | 2.9 | 2.9 | 2.9 | |
| High | Segmental pancreatic resection | 157 | 8.9 | 0.6 | 34.4 | 2.5 | 0.6 | 1.3 | |
| High | Pancreatic transplantation | 20 | 0.0 | 55.0 | 65.0 | 40.0 | 0.0 | 5.0 | |
| Spleen | Low | Splenorrhaphy | 36 | 25.0 | 66.7 | 33.3 | 22.2 | 11.1 | 19.4 |
| Med | Splenectomy | 2045 | 29.8 | 13.1 | 14.7 | 5.8 | 2.9 | 3.9 | |
| Med | Partial splenectomy | 15 | 53.3 | 13.3 | 0.0 | 0.0 | 0.0 | 0.0 | |
| Other | Low | Localized intra‐abdominal abscess surgery | 2376 | 32.7 | 70.5 | 14.6 | 6.6 | 2.2 | 3.2 |
| Low | Exploratory laparotomy | 12 401 | 49.3 | 30.3 | 16.8 | 13.2 | 6.2 | 9.0 | |
| Med | Acute diffuse peritonitis surgery | 15 542 | 22.1 | 92.6 | 27.3 | 7.8 | 8.0 | 11.5 | |
| Med | Ventral hernia surgery | 14 136 | 32.0 | 11.4 | 3.9 | 2.0 | 0.6 | 0.9 | |
| Med | Diaphragm suture | 294 | 34.0 | 40.5 | 19.7 | 9.5 | 4.4 | 6.5 | |
| Med | Esophageal hiatus hernia surgery | 1217 | 62.8 | 7.9 | 8.0 | 4.1 | 1.4 | 2.2 | |
| Med | Retroperitoneal tumor surgery | 1551 | 10.9 | 2.1 | 9.2 | 3.5 | 0.3 | 0.5 | |
| Med | Abdominal wall/mesenteric/omental tumor resection | 2054 | 31.3 | 15.3 | 7.7 | 4.3 | 0.9 | 1.9 | |
| Med | Gastrointestinal perforation closure | 421 | 11.9 | 90.5 | 35.4 | 14.0 | 11.6 | 16.2 | |
| High | Diaphragmatic hiatus hernia surgery | 56 | 37.5 | 42.9 | 12.5 | 3.6 | 10.7 | 12.5 |
Complications were defined by Clavien–Dindo grade IIIa–V.
Operative mortality was a rate that combined 30‐day mortality and hospitalization death in 31–90 days after surgery.
3.2. Annual changes in surgeries of each organ
The annual number of surgeries for each organ was decreased in 2020 compared to the prior year (esophagus, 5.5% decrease year‐on‐year; stomach and duodenum, 10.1%; small intestine and colon, 0.4%; rectum and anus, 3.8%; gallbladder, 4.2%; spleen, 13.1%; other organs; 0.9%), except for the pancreas (increase by 1.2% year‐on‐year) and liver (0.1%). The number of surgeries for the liver was almost stable, and the pancreas maintained the trend of slightly increasing through the 10 years (Figure 1).
FIGURE 1.
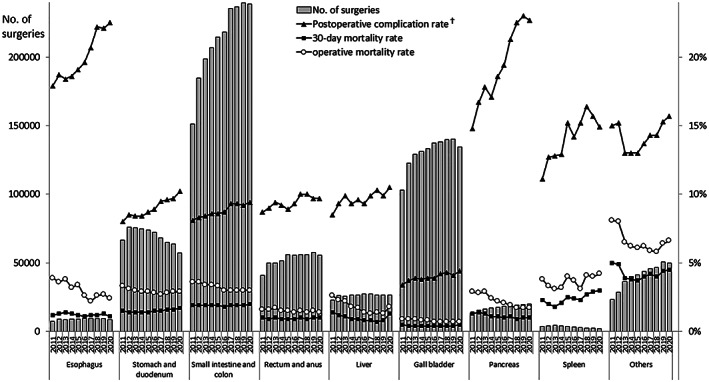
Annual changes in the number of surgeries, 30‐day and operative mortality rates, and complication rates of each organ. †Postoperative complication was defined as grades IIIa–V in the Clavien–Dindo classification
The male‐to‐female ratio was approximately 8:2 for surgeries involving the esophagus, 7:3 for surgeries involving the liver and the stomach and duodenum, and 6:4 for surgeries involving other organs. For the spleen, the proportion of female increased by almost 7% in the last 10 years. The ratio of age ≥80 years increased 3.8%–6.1% in the last decade (Table 3). In terms of the institution types, most cases (93%–98% in 2020) for each organ were performed in certified or affiliated institutions of the JSGS (Table 4).
TABLE 3.
Annual changes in surgeries of each organ by sex and age of patients
| Organ | Year | No. of surgeries | Sex (%) | Age (%) | ||||||
|---|---|---|---|---|---|---|---|---|---|---|
| Male | Female | <60 | 60–64 | 65–69 | 70–74 | 75–79 | ≥80 | |||
| Esophagus | 2011 | 7246 | 81.8 | 18.2 | 22.5 | 19.6 | 21.1 | 18.7 | 12.0 | 6.0 |
| 2012 | 8819 | 82.2 | 17.8 | 22.1 | 19.7 | 20.0 | 19.5 | 12.9 | 6.0 | |
| 2013 | 8642 | 81.5 | 18.5 | 20.8 | 17.5 | 21.0 | 20.6 | 13.2 | 6.9 | |
| 2014 | 9021 | 81.5 | 18.4 | 20.8 | 16.5 | 21.4 | 20.9 | 13.8 | 6.6 | |
| 2015 | 8943 | 80.8 | 19.2 | 19.6 | 15.3 | 22.4 | 22.5 | 13.1 | 7.1 | |
| 2016 | 9212 | 79.6 | 20.4 | 20.1 | 14.4 | 22.9 | 20.5 | 14.5 | 7.5 | |
| 2017 | 9359 | 80.0 | 20.0 | 19.3 | 13.4 | 24.4 | 19.4 | 15.5 | 8.0 | |
| 2018 | 9286 | 78.4 | 21.6 | 19.0 | 12.8 | 21.3 | 21.6 | 16.7 | 8.7 | |
| 2019 | 9224 | 78.6 | 21.4 | 18.8 | 13.1 | 19.4 | 22.8 | 17.3 | 8.6 | |
| 2020 | 8713 | 79.0 | 21.0 | 18.4 | 13.5 | 18.3 | 23.5 | 16.5 | 9.8 | |
| Stomach and duodenum | 2011 | 66 740 | 68.0 | 32.0 | 20.1 | 14.4 | 14.0 | 17.1 | 16.4 | 18.0 |
| 2012 | 76 186 | 68.3 | 31.7 | 18.9 | 14.4 | 14.5 | 17.1 | 16.4 | 18.6 | |
| 2013 | 75 583 | 67.9 | 32.1 | 18.6 | 13.1 | 15.5 | 17.2 | 16.9 | 18.7 | |
| 2014 | 74 920 | 67.6 | 32.4 | 17.9 | 12.1 | 16.0 | 17.8 | 16.7 | 19.5 | |
| 2015 | 73 877 | 67.8 | 32.2 | 17.4 | 11.1 | 17.1 | 17.8 | 16.6 | 19.9 | |
| 2016 | 72 234 | 67.8 | 32.2 | 17.0 | 10.2 | 18.1 | 17.1 | 16.6 | 21.0 | |
| 2017 | 68 287 | 67.2 | 32.8 | 16.3 | 9.9 | 17.5 | 17.3 | 17.2 | 21.8 | |
| 2018 | 65 152 | 66.9 | 33.1 | 16.0 | 9.0 | 16.4 | 18.0 | 17.5 | 23.2 | |
| 2019 | 63 610 | 66.5 | 33.5 | 15.6 | 8.8 | 15.0 | 19.0 | 18.5 | 23.2 | |
| 2020 | 57 171 | 66.6 | 33.4 | 15.3 | 8.2 | 13.8 | 20.1 | 18.5 | 24.1 | |
| Small intestine and colon | 2011 | 151 143 | 56.7 | 43.3 | 37.4 | 10.9 | 10.5 | 12.1 | 12.2 | 16.9 |
| 2012 | 184 810 | 56.7 | 43.3 | 36.4 | 10.7 | 10.7 | 12.2 | 12.5 | 17.4 | |
| 2013 | 198 677 | 56.9 | 43.1 | 35.6 | 10.1 | 11.3 | 12.7 | 12.4 | 17.8 | |
| 2014 | 206 857 | 56.9 | 43.1 | 34.7 | 9.4 | 12.0 | 13.1 | 12.4 | 18.4 | |
| 2015 | 214 453 | 57.1 | 42.9 | 34.0 | 8.9 | 12.9 | 13.1 | 12.3 | 18.7 | |
| 2016 | 218 228 | 57.3 | 42.7 | 33.7 | 8.4 | 13.6 | 12.5 | 12.4 | 19.3 | |
| 2017 | 235 359 | 56.7 | 43.3 | 32.7 | 8.0 | 13.2 | 12.7 | 12.9 | 20.5 | |
| 2018 | 236 496 | 56.9 | 43.1 | 32.2 | 7.7 | 12.6 | 13.4 | 13.2 | 21.1 | |
| 2019 | 239 612 | 56.3 | 43.7 | 32.1 | 7.4 | 11.7 | 13.9 | 13.5 | 21.2 | |
| 2020 | 238 631 | 56.2 | 43.8 | 32.6 | 7.3 | 10.7 | 14.6 | 13.4 | 21.5 | |
| Rectum and anus | 2011 | 41 061 | 59.1 | 40.9 | 22.0 | 16.1 | 14.6 | 15.4 | 14.2 | 17.7 |
| 2012 | 49 704 | 58.3 | 41.7 | 22.3 | 14.8 | 14.6 | 15.5 | 14.3 | 18.5 | |
| 2013 | 49 980 | 58.0 | 42.0 | 20.9 | 13.9 | 15.2 | 16.1 | 14.6 | 19.3 | |
| 2014 | 51 454 | 58.3 | 41.7 | 20.4 | 13.1 | 16.0 | 16.4 | 14.2 | 19.9 | |
| 2015 | 56 092 | 57.8 | 42.2 | 22.3 | 11.8 | 16.7 | 15.7 | 14.0 | 19.4 | |
| 2016 | 55 666 | 57.3 | 42.7 | 22.0 | 11.1 | 17.9 | 15.0 | 13.6 | 20.4 | |
| 2017 | 56 144 | 56.7 | 43.3 | 22.2 | 10.2 | 17.3 | 15.1 | 14.2 | 21.0 | |
| 2018 | 56 162 | 56.9 | 43.1 | 22.2 | 9.8 | 15.9 | 15.8 | 14.6 | 21.6 | |
| 2019 | 57 706 | 56.3 | 43.7 | 22.5 | 9.5 | 14.8 | 16.5 | 14.9 | 21.9 | |
| 2020 | 55 536 | 56.2 | 43.8 | 22.7 | 9.2 | 13.7 | 17.6 | 14.7 | 22.1 | |
| Liver | 2011 | 22 855 | 67.3 | 32.7 | 22.2 | 16.5 | 16.3 | 18.7 | 17.2 | 9.2 |
| 2012 | 26 288 | 66.3 | 33.7 | 22.1 | 15.7 | 16.7 | 18.0 | 17.4 | 10.2 | |
| 2013 | 25 814 | 66.1 | 33.9 | 21.3 | 14.6 | 17.6 | 18.7 | 17.3 | 10.5 | |
| 2014 | 26 518 | 66.3 | 33.7 | 21.5 | 13.7 | 18.1 | 19.8 | 16.6 | 10.3 | |
| 2015 | 26 378 | 65.7 | 34.3 | 20.8 | 12.8 | 18.9 | 19.4 | 16.5 | 11.5 | |
| 2016 | 27 212 | 66.4 | 33.6 | 20.3 | 11.5 | 20.5 | 18.6 | 17.0 | 12.1 | |
| 2017 | 27 397 | 65.8 | 34.2 | 20.1 | 11.0 | 20.2 | 18.8 | 17.2 | 12.7 | |
| 2018 | 26 531 | 66.5 | 33.5 | 19.6 | 10.3 | 18.8 | 19.6 | 17.8 | 13.8 | |
| 2019 | 26 582 | 66.3 | 33.7 | 19.4 | 10.1 | 16.5 | 21.1 | 18.6 | 14.2 | |
| 2020 | 26 614 | 66.0 | 34.0 | 20.6 | 9.5 | 15.1 | 21.7 | 18.7 | 14.4 | |
| Gall bladder | 2011 | 103 183 | 54.5 | 45.4 | 34.3 | 14.0 | 12.2 | 13.8 | 12.8 | 13.0 |
| 2012 | 122 513 | 55.2 | 44.8 | 32.9 | 13.8 | 12.4 | 13.9 | 13.2 | 13.8 | |
| 2013 | 129 162 | 55.3 | 44.7 | 32.6 | 12.9 | 13.0 | 14.2 | 13.2 | 14.0 | |
| 2014 | 131 182 | 55.6 | 44.4 | 32.1 | 11.8 | 13.9 | 14.5 | 13.2 | 14.5 | |
| 2015 | 133 126 | 55.6 | 44.4 | 32.0 | 11.2 | 15.0 | 14.1 | 13.0 | 14.8 | |
| 2016 | 137 360 | 55.4 | 44.6 | 32.6 | 10.6 | 15.5 | 13.1 | 12.9 | 15.3 | |
| 2017 | 138 267 | 55.6 | 44.4 | 32.2 | 10.2 | 15.1 | 13.5 | 13.2 | 15.8 | |
| 2018 | 139 844 | 55.3 | 44.7 | 31.8 | 9.7 | 14.2 | 14.2 | 13.4 | 16.7 | |
| 2019 | 140 214 | 55.4 | 44.6 | 31.6 | 9.6 | 13.3 | 14.7 | 13.9 | 16.9 | |
| 2020 | 134 332 | 55.9 | 44.1 | 31.3 | 9.1 | 12.2 | 15.6 | 14.0 | 17.8 | |
| Pancreas | 2011 | 13 477 | 59.9 | 40.1 | 20.0 | 15.6 | 16.9 | 19.7 | 17.7 | 10.2 |
| 2012 | 15 550 | 60.0 | 40.0 | 19.8 | 15.2 | 17.0 | 19.5 | 18.2 | 10.3 | |
| 2013 | 16 380 | 59.7 | 40.3 | 19.1 | 13.6 | 18.0 | 20.7 | 17.7 | 10.9 | |
| 2014 | 17 313 | 59.5 | 40.5 | 18.4 | 12.4 | 19.0 | 21.0 | 18.2 | 11.1 | |
| 2015 | 17 407 | 59.1 | 40.9 | 18.2 | 11.3 | 19.4 | 21.6 | 18.1 | 11.4 | |
| 2016 | 18 238 | 58.9 | 41.1 | 18.2 | 10.4 | 19.9 | 20.4 | 19.0 | 12.2 | |
| 2017 | 19 138 | 59.2 | 40.8 | 17.7 | 9.9 | 19.5 | 19.9 | 20.1 | 12.9 | |
| 2018 | 19 152 | 58.6 | 41.4 | 16.9 | 9.2 | 18.2 | 21.5 | 20.4 | 13.7 | |
| 2019 | 19 703 | 58.3 | 41.7 | 17.0 | 9.2 | 16.5 | 21.6 | 21.1 | 14.6 | |
| 2020 | 19 947 | 58.1 | 41.9 | 16.7 | 8.4 | 14.6 | 22.8 | 21.9 | 15.6 | |
| Spleen | 2011 | 3609 | 61.3 | 38.7 | 35.3 | 15.6 | 14.7 | 14.8 | 11.9 | 7.8 |
| 2012 | 4142 | 61.4 | 38.6 | 32.9 | 16.3 | 15.0 | 15.1 | 12.9 | 7.8 | |
| 2013 | 4509 | 61.8 | 38.2 | 30.8 | 14.9 | 15.9 | 16.5 | 13.1 | 8.7 | |
| 2014 | 4272 | 61.8 | 38.2 | 29.9 | 13.0 | 17.3 | 17.0 | 13.8 | 9.1 | |
| 2015 | 3568 | 60.4 | 39.6 | 29.7 | 11.4 | 17.3 | 16.6 | 14.1 | 10.8 | |
| 2016 | 3171 | 57.3 | 42.7 | 31.9 | 11.7 | 17.7 | 15.7 | 12.5 | 10.5 | |
| 2017 | 2864 | 58.7 | 41.3 | 31.6 | 11.0 | 18.1 | 16.0 | 13.3 | 10.0 | |
| 2018 | 2544 | 56.6 | 43.4 | 32.6 | 9.9 | 15.6 | 16.9 | 13.9 | 11.1 | |
| 2019 | 2413 | 55.2 | 44.8 | 31.3 | 10.5 | 16.8 | 15.8 | 13.1 | 12.5 | |
| 2020 | 2096 | 54.4 | 45.6 | 32.8 | 11.4 | 12.6 | 16.7 | 14.1 | 12.4 | |
| Others | 2011 | 23 218 | 55.0 | 45.0 | 32.0 | 11.9 | 11.3 | 13.3 | 13.8 | 17.6 |
| 2012 | 28 779 | 55.4 | 44.6 | 31.1 | 11.7 | 11.7 | 13.8 | 13.7 | 18.0 | |
| 2013 | 36 363 | 53.1 | 46.9 | 28.3 | 10.9 | 12.7 | 14.1 | 14.8 | 19.1 | |
| 2014 | 39 854 | 53.7 | 46.3 | 28.1 | 10.1 | 13.1 | 14.5 | 14.4 | 19.8 | |
| 2015 | 41 465 | 53.2 | 46.8 | 27.4 | 9.4 | 14.0 | 14.5 | 14.2 | 20.6 | |
| 2016 | 43 523 | 54.0 | 46.0 | 27.5 | 9.2 | 14.6 | 13.5 | 14.0 | 21.2 | |
| 2017 | 45 622 | 54.1 | 45.9 | 27.0 | 8.2 | 14.7 | 13.5 | 14.6 | 21.9 | |
| 2018 | 46 587 | 54.1 | 45.9 | 26.8 | 8.2 | 14.0 | 14.4 | 14.7 | 21.9 | |
| 2019 | 50 525 | 54.8 | 45.2 | 27.0 | 8.1 | 12.7 | 15.3 | 15.0 | 21.9 | |
| 2020 | 50 048 | 54.5 | 45.5 | 27.2 | 7.9 | 11.9 | 16.0 | 14.9 | 22.1 | |
| Total | 2011 | 432 532 | 59.2 | 40.8 | 30.6 | 13.3 | 12.6 | 14.4 | 13.7 | 15.4 |
| 2012 | 516 791 | 59.2 | 40.8 | 29.9 | 13.0 | 12.8 | 14.4 | 13.9 | 16.0 | |
| 2013 | 545 110 | 58.8 | 41.2 | 29.3 | 12.1 | 13.5 | 14.8 | 14.0 | 16.4 | |
| 2014 | 561 391 | 58.9 | 41.1 | 28.7 | 11.1 | 14.1 | 15.2 | 13.9 | 17.0 | |
| 2015 | 575 309 | 58.8 | 41.2 | 28.5 | 10.4 | 15.0 | 15.0 | 13.7 | 17.4 | |
| 2016 | 584 844 | 58.7 | 41.3 | 28.5 | 9.8 | 15.8 | 14.2 | 13.7 | 18.0 | |
| 2017 | 602 437 | 58.3 | 41.7 | 28.1 | 9.2 | 15.3 | 14.3 | 14.2 | 18.9 | |
| 2018 | 601 754 | 58.2 | 41.8 | 27.7 | 8.8 | 14.4 | 15.0 | 14.4 | 19.6 | |
| 2019 | 609 589 | 57.9 | 42.1 | 27.7 | 8.6 | 13.3 | 15.7 | 14.9 | 19.8 | |
| 2020 | 593 088 | 57.8 | 42.2 | 28.0 | 8.3 | 12.2 | 16.5 | 14.8 | 20.3 | |
TABLE 4.
Annual changes in surgeries of each organ by institution type and specialist participation rate
| Organ | Year | No. of surgeries | Institution type (%) | Anesthesiologist participation (%) | Board‐certified surgeon participation (%) | Operating surgeon (%) | |||
|---|---|---|---|---|---|---|---|---|---|
| Certified institution | Affiliated institution | Others | Board‐certified surgeon | Non‐board‐ certified surgeon | |||||
| Esophagus | 2011 | 7246 | 93.5 | 5.9 | 0.6 | 97.0 | 87.0 | 62.8 | 37.2 |
| 2012 | 8819 | 78.1 | 5.9 | 16.0 | 97.4 | 87.0 | 62.7 | 37.3 | |
| 2013 | 8642 | 90.6 | 7.1 | 2.4 | 97.3 | 88.4 | 64.4 | 35.6 | |
| 2014 | 9021 | 91.1 | 6.1 | 2.8 | 97.9 | 90.1 | 67.6 | 32.4 | |
| 2015 | 8943 | 91.5 | 6.0 | 2.5 | 97.9 | 91.1 | 69.4 | 30.6 | |
| 2016 | 9212 | 92.4 | 5.0 | 2.6 | 98.2 | 91.2 | 70.0 | 30.0 | |
| 2017 | 9359 | 92.7 | 4.0 | 3.3 | 97.9 | 92.5 | 71.8 | 28.2 | |
| 2018 | 9286 | 93.8 | 4.0 | 2.2 | 98.5 | 94.7 | 75.2 | 24.8 | |
| 2019 | 9224 | 94.3 | 3.8 | 1.9 | 98.4 | 94.2 | 76.4 | 23.6 | |
| 2020 | 8713 | 95.2 | 3.2 | 1.5 | 98.9 | 95.7 | 78.3 | 21.7 | |
| Stomach and duodenum | 2011 | 66 740 | 80.2 | 17.3 | 2.6 | 92.8 | 69.3 | 35.1 | 64.9 |
| 2012 | 76 186 | 63.5 | 15.6 | 20.9 | 93.5 | 70.3 | 35.6 | 64.4 | |
| 2013 | 75 583 | 76.3 | 19.3 | 4.4 | 93.3 | 73.5 | 37.7 | 62.3 | |
| 2014 | 74 920 | 77.0 | 18.2 | 4.8 | 93.6 | 75.9 | 39.2 | 60.8 | |
| 2015 | 73 877 | 77.1 | 18.3 | 4.6 | 93.9 | 76.1 | 39.2 | 60.8 | |
| 2016 | 72 234 | 79.6 | 16.1 | 4.3 | 94.6 | 78.7 | 41.0 | 59.0 | |
| 2017 | 68 287 | 79.6 | 15.3 | 5.1 | 94.8 | 79.7 | 41.8 | 58.2 | |
| 2018 | 65 152 | 80.0 | 14.8 | 5.1 | 95.1 | 81.4 | 43.2 | 56.8 | |
| 2019 | 63 610 | 81.3 | 14.2 | 4.5 | 95.4 | 83.8 | 46.1 | 53.9 | |
| 2020 | 57 171 | 80.8 | 14.8 | 4.4 | 95.7 | 85.4 | 47.6 | 52.4 | |
| Small intestine and colon | 2011 | 151 143 | 76.8 | 20.2 | 2.9 | 88.1 | 59.2 | 25.1 | 74.9 |
| 2012 | 184 810 | 60.6 | 18.2 | 21.2 | 88.9 | 59.9 | 25.4 | 74.6 | |
| 2013 | 198 677 | 72.6 | 22.2 | 5.2 | 89.6 | 62.7 | 26.6 | 73.4 | |
| 2014 | 206 857 | 73.0 | 21.4 | 5.6 | 90.8 | 65.4 | 28.1 | 71.9 | |
| 2015 | 214 453 | 73.8 | 20.7 | 5.5 | 91.6 | 66.3 | 28.5 | 71.5 | |
| 2016 | 218 228 | 75.6 | 19.0 | 5.5 | 92.4 | 68.1 | 29.5 | 70.5 | |
| 2017 | 235 359 | 76.0 | 18.0 | 6.0 | 92.9 | 70.1 | 31.1 | 68.9 | |
| 2018 | 236 496 | 76.3 | 17.5 | 6.1 | 93.3 | 71.8 | 32.6 | 67.4 | |
| 2019 | 239 612 | 77.1 | 17.1 | 5.8 | 94.1 | 74.0 | 33.2 | 66.8 | |
| 2020 | 238 631 | 76.5 | 17.9 | 5.6 | 94.5 | 75.9 | 34.2 | 65.8 | |
| Rectum and anus | 2011 | 41 061 | 76.9 | 19.0 | 4.1 | 86.3 | 68.3 | 36.9 | 63.1 |
| 2012 | 49 704 | 60.4 | 18.2 | 21.4 | 85.7 | 68.6 | 37.6 | 62.4 | |
| 2013 | 49 980 | 72.9 | 21.7 | 5.4 | 87.3 | 71.2 | 39.4 | 60.6 | |
| 2014 | 51 454 | 73.5 | 20.9 | 5.6 | 87.9 | 73.7 | 41.6 | 58.4 | |
| 2015 | 56 092 | 72.5 | 20.8 | 6.7 | 84.9 | 73.5 | 41.5 | 58.5 | |
| 2016 | 55 666 | 74.1 | 19.4 | 6.6 | 85.7 | 74.7 | 42.1 | 57.9 | |
| 2017 | 56 144 | 73.8 | 18.2 | 8.0 | 84.8 | 76.1 | 43.9 | 56.1 | |
| 2018 | 56 162 | 74.1 | 17.9 | 8.0 | 85.2 | 77.2 | 46.7 | 53.3 | |
| 2019 | 57 706 | 74.9 | 17.3 | 7.8 | 86.0 | 80.1 | 48.9 | 51.1 | |
| 2020 | 55 536 | 74.5 | 18.6 | 6.8 | 86.7 | 81.7 | 51.0 | 49.0 | |
| Liver | 2011 | 22 855 | 89.3 | 9.7 | 1.1 | 95.6 | 85.2 | 55.2 | 44.8 |
| 2012 | 26 288 | 74.2 | 9.2 | 16.7 | 95.4 | 85.7 | 57.4 | 42.6 | |
| 2013 | 25 814 | 86.3 | 10.7 | 2.9 | 96.3 | 87.5 | 57.1 | 42.9 | |
| 2014 | 26 518 | 86.3 | 10.0 | 3.7 | 96.4 | 89.0 | 59.6 | 40.4 | |
| 2015 | 26 378 | 87.3 | 9.5 | 3.2 | 96.6 | 89.1 | 59.1 | 40.9 | |
| 2016 | 27 212 | 88.4 | 8.8 | 2.9 | 96.8 | 90.0 | 59.6 | 40.4 | |
| 2017 | 27 397 | 89.0 | 7.8 | 3.1 | 97.1 | 91.8 | 62.5 | 37.5 | |
| 2018 | 26 531 | 89.4 | 7.1 | 3.5 | 97.3 | 92.8 | 64.1 | 35.9 | |
| 2019 | 26 582 | 89.7 | 6.8 | 3.6 | 97.3 | 94.1 | 66.4 | 33.6 | |
| 2020 | 26 614 | 89.6 | 7.2 | 3.1 | 97.4 | 94.7 | 67.7 | 32.3 | |
| Gall bladder | 2011 | 103 183 | 73.9 | 22.5 | 3.6 | 91.8 | 61.9 | 26.4 | 73.6 |
| 2012 | 122 513 | 57.5 | 19.6 | 22.9 | 92.1 | 62.8 | 26.3 | 73.7 | |
| 2013 | 129 162 | 69.9 | 24.1 | 5.9 | 92.2 | 65.4 | 27.3 | 72.7 | |
| 2014 | 131 182 | 70.3 | 23.3 | 6.4 | 92.3 | 67.4 | 28.1 | 71.9 | |
| 2015 | 133 126 | 70.8 | 22.8 | 6.4 | 92.9 | 68.4 | 28.1 | 71.9 | |
| 2016 | 137 360 | 72.4 | 21.3 | 6.3 | 93.5 | 69.4 | 28.9 | 71.1 | |
| 2017 | 138 267 | 72.6 | 20.1 | 7.3 | 93.7 | 71.4 | 29.9 | 70.1 | |
| 2018 | 139 844 | 72.5 | 20.1 | 7.4 | 94.1 | 73.1 | 31.1 | 68.9 | |
| 2019 | 140 214 | 73.5 | 19.4 | 7.1 | 94.4 | 75.7 | 32.3 | 67.7 | |
| 2020 | 134 332 | 72.9 | 20.2 | 6.9 | 94.8 | 77.7 | 33.8 | 66.2 | |
| Pancreas | 2011 | 13 477 | 88.1 | 10.8 | 1.2 | 95.8 | 85.2 | 57.7 | 42.3 |
| 2012 | 15 550 | 72.8 | 8.7 | 18.5 | 96.3 | 86.5 | 59.9 | 40.1 | |
| 2013 | 16 380 | 86.5 | 11.0 | 2.4 | 95.9 | 87.6 | 60.2 | 39.8 | |
| 2014 | 17 313 | 86.9 | 9.9 | 3.3 | 96.2 | 89.1 | 61.3 | 38.7 | |
| 2015 | 17 407 | 88.4 | 9.1 | 2.4 | 96.4 | 90.3 | 61.6 | 38.4 | |
| 2016 | 18 238 | 89.8 | 8.0 | 2.3 | 96.8 | 91.1 | 62.4 | 37.6 | |
| 2017 | 19 138 | 90.4 | 7.1 | 2.5 | 97.2 | 92.3 | 63.9 | 36.1 | |
| 2018 | 19 152 | 91.3 | 6.4 | 2.3 | 97.3 | 93.4 | 66.5 | 33.5 | |
| 2019 | 19 703 | 91.9 | 6.2 | 1.9 | 97.2 | 95.1 | 69.2 | 30.8 | |
| 2020 | 19 947 | 91.9 | 6.3 | 1.8 | 97.6 | 95.7 | 70.4 | 29.6 | |
| Spleen | 2011 | 3609 | 87.0 | 11.6 | 1.4 | 94.6 | 75.2 | 44.9 | 55.1 |
| 2012 | 4142 | 70.5 | 9.5 | 20.0 | 81.7 | 75.8 | 44.4 | 55.6 | |
| 2013 | 4509 | 83.2 | 13.8 | 3.0 | 95.2 | 75.4 | 43.3 | 56.7 | |
| 2014 | 4272 | 85.4 | 11.5 | 3.1 | 94.6 | 77.5 | 45.2 | 54.8 | |
| 2015 | 3568 | 85.6 | 12.3 | 2.1 | 94.8 | 78.9 | 45.5 | 54.5 | |
| 2016 | 3171 | 86.8 | 10.1 | 3.1 | 95.7 | 80.5 | 48.0 | 52.0 | |
| 2017 | 2864 | 87.4 | 9.3 | 3.3 | 95.3 | 82.3 | 49.1 | 50.9 | |
| 2018 | 2544 | 86.9 | 9.7 | 3.4 | 95.3 | 84.7 | 49.3 | 50.7 | |
| 2019 | 2413 | 88.1 | 8.7 | 3.2 | 96.2 | 86.8 | 54.0 | 46.0 | |
| 2020 | 2096 | 88.6 | 9.2 | 2.2 | 96.5 | 88.3 | 55.7 | 44.3 | |
| Others | 2011 | 23 218 | 80.2 | 17.0 | 2.8 | 90.3 | 60.4 | 27.2 | 72.8 |
| 2012 | 28 779 | 65.7 | 15.2 | 19.1 | 91.0 | 61.1 | 27.6 | 72.4 | |
| 2013 | 36 363 | 76.1 | 19.3 | 4.6 | 91.5 | 63.4 | 28.5 | 71.5 | |
| 2014 | 39 854 | 76.6 | 18.2 | 5.1 | 91.9 | 64.9 | 29.7 | 70.3 | |
| 2015 | 41 465 | 78.0 | 17.2 | 4.8 | 92.4 | 65.6 | 29.4 | 70.6 | |
| 2016 | 43 523 | 79.4 | 15.8 | 4.8 | 92.7 | 67.3 | 30.3 | 69.7 | |
| 2017 | 45 622 | 80.1 | 14.8 | 5.1 | 93.1 | 69.7 | 32.3 | 67.7 | |
| 2018 | 46 587 | 80.2 | 14.2 | 5.7 | 93.8 | 71.2 | 33.1 | 66.9 | |
| 2019 | 50 525 | 80.9 | 13.9 | 5.3 | 94.3 | 74.0 | 35.2 | 64.8 | |
| 2020 | 50 048 | 80.4 | 14.7 | 4.9 | 94.3 | 76.1 | 37.0 | 63.0 | |
The rates of postoperative complications, 30‐day postoperative mortality, and operative mortality in each organ are shown in Table 5. The incidence of severe postoperative complications in the last decade was less than 5% in the gallbladder and almost 10% in the stomach and duodenum, the small intestine and colon, the rectum and anus, and the liver. Although the rate of severe complications of the esophagus and pancreas increased (4.6% and 7.9% increase in 10 years, respectively), the operative mortality rates for surgery on these organs decreased slightly in this period (Figure 1).
TABLE 5.
Annual changes in surgeries of each organ by complication and mortality rates
| Organ | Year | No. of surgeries | No. of postoperative complications a (%) | No. of postoperative 30‐day mortalities (%) | No. of operative mortalities b (%) |
|---|---|---|---|---|---|
| Esophagus | 2011 | 7246 | 1294 (17.9) | 87 (1.2) | 279 (3.9) |
| 2012 | 8819 | 1653 (18.7) | 117 (1.3) | 315 (3.6) | |
| 2013 | 8642 | 1593 (18.4) | 121 (1.4) | 327 (3.8) | |
| 2014 | 9021 | 1679 (18.6) | 115 (1.3) | 289 (3.2) | |
| 2015 | 8943 | 1709 (19.1) | 103 (1.2) | 304 (3.4) | |
| 2016 | 9212 | 1805 (19.6) | 100 (1.1) | 238 (2.6) | |
| 2017 | 9359 | 1938 (20.7) | 108 (1.2) | 208 (2.2) | |
| 2018 | 9286 | 2065 (22.2) | 108 (1.2) | 246 (2.6) | |
| 2019 | 9224 | 2035 (22.1) | 119 (1.3) | 246 (2.7) | |
| 2020 | 8713 | 1963 (22.5) | 95 (1.1) | 212 (2.4) | |
| Stomach and duodenum | 2011 | 66 740 | 5354 (8.0) | 992 (1.5) | 2183 (3.3) |
| 2012 | 76 186 | 6447 (8.5) | 1085 (1.4) | 2381 (3.1) | |
| 2013 | 75 583 | 6380 (8.4) | 1059 (1.4) | 2269 (3.0) | |
| 2014 | 74 920 | 6328 (8.4) | 1064 (1.4) | 2174 (2.9) | |
| 2015 | 73 877 | 6418 (8.7) | 1007 (1.4) | 2110 (2.9) | |
| 2016 | 72 234 | 6413 (8.9) | 1066 (1.5) | 2016 (2.8) | |
| 2017 | 68 287 | 6455 (9.5) | 1046 (1.5) | 1863 (2.7) | |
| 2018 | 65 152 | 6228 (9.6) | 1048 (1.6) | 1833 (2.8) | |
| 2019 | 63 610 | 6159 (9.7) | 1022 (1.6) | 1826 (2.9) | |
| 2020 | 57 171 | 5849 (10.2) | 977 (1.7) | 1679 (2.9) | |
| Small intestine and colon | 2011 | 151 143 | 12 184 (8.1) | 2943 (1.9) | 5390 (3.6) |
| 2012 | 184 810 | 15 395 (8.3) | 3564 (1.9) | 6583 (3.6) | |
| 2013 | 198 677 | 16 709 (8.4) | 3723 (1.9) | 6803 (3.4) | |
| 2014 | 206 857 | 17 776 (8.6) | 3822 (1.9) | 6961 (3.4) | |
| 2015 | 214 453 | 18 372 (8.6) | 4019 (1.9) | 7092 (3.3) | |
| 2016 | 218 228 | 19 020 (8.7) | 3933 (1.8) | 6621 (3.0) | |
| 2017 | 235 359 | 21 854 (9.3) | 4588 (1.9) | 7118 (3.0) | |
| 2018 | 236 496 | 21 881 (9.3) | 4452 (1.9) | 7116 (3.0) | |
| 2019 | 239 612 | 22 061 (9.2) | 4671 (1.9) | 7298 (3.0) | |
| 2020 | 238 631 | 22 344 (9.4) | 4791 (2.0) | 7261 (3.0) | |
| Rectum and anus | 2011 | 41 061 | 3584 (8.7) | 395 (1.0) | 676 (1.6) |
| 2012 | 49 704 | 4488 (9.0) | 462 (0.9) | 802 (1.6) | |
| 2013 | 49 980 | 4684 (9.4) | 517 (1.0) | 858 (1.7) | |
| 2014 | 51 454 | 4711 (9.2) | 449 (0.9) | 792 (1.5) | |
| 2015 | 56 092 | 4986 (8.9) | 519 (0.9) | 824 (1.5) | |
| 2016 | 55 666 | 5194 (9.3) | 503 (0.9) | 766 (1.4) | |
| 2017 | 56 144 | 5600 (10.0) | 556 (1.0) | 829 (1.5) | |
| 2018 | 56 162 | 5622 (10.0) | 522 (0.9) | 803 (1.4) | |
| 2019 | 57 706 | 5573 (9.7) | 563 (1.0) | 839 (1.5) | |
| 2020 | 55 536 | 5383 (9.7) | 555 (1.0) | 797 (1.4) | |
| Liver | 2011 | 22 855 | 1933 (8.5) | 309 (1.4) | 590 (2.6) |
| 2012 | 26 288 | 2454 (9.3) | 310 (1.2) | 605 (2.3) | |
| 2013 | 25 814 | 2549 (9.9) | 275 (1.1) | 575 (2.2) | |
| 2014 | 26 518 | 2466 (9.3) | 246 (0.9) | 481 (1.8) | |
| 2015 | 26 378 | 2537 (9.6) | 234 (0.9) | 451 (1.7) | |
| 2016 | 27 212 | 2543 (9.3) | 222 (0.8) | 382 (1.4) | |
| 2017 | 27 397 | 2724 (9.9) | 214 (0.8) | 364 (1.3) | |
| 2018 | 26 531 | 2737 (10.3) | 189 (0.7) | 372 (1.4) | |
| 2019 | 26 582 | 2624 (9.9) | 201 (0.8) | 334 (1.3) | |
| 2020 | 26 614 | 2804 (10.5) | 338 (1.3) | 475 (1.8) | |
| Gall bladder | 2011 | 103 183 | 3473 (3.4) | 483 (0.5) | 946 (0.9) |
| 2012 | 122 513 | 4587 (3.7) | 531 (0.4) | 1082 (0.9) | |
| 2013 | 129 162 | 4982 (3.9) | 546 (0.4) | 1130 (0.9) | |
| 2014 | 131 182 | 5020 (3.8) | 569 (0.4) | 1097 (0.8) | |
| 2015 | 133 126 | 5231 (3.9) | 541 (0.4) | 1036 (0.8) | |
| 2016 | 137 360 | 5320 (3.9) | 559 (0.4) | 980 (0.7) | |
| 2017 | 138 267 | 5761 (4.2) | 576 (0.4) | 968 (0.7) | |
| 2018 | 139 844 | 5964 (4.3) | 584 (0.4) | 954 (0.7) | |
| 2019 | 140 214 | 5748 (4.1) | 565 (0.4) | 935 (0.7) | |
| 2020 | 134 332 | 5888 (4.4) | 620 (0.5) | 978 (0.7) | |
| Pancreas | 2011 | 13 477 | 1994 (14.8) | 175 (1.3) | 386 (2.9) |
| 2012 | 15 550 | 2595 (16.7) | 213 (1.4) | 437 (2.8) | |
| 2013 | 16 380 | 2917 (17.8) | 211 (1.3) | 482 (2.9) | |
| 2014 | 17 313 | 2966 (17.1) | 195 (1.1) | 423 (2.4) | |
| 2015 | 17 407 | 3229 (18.6) | 185 (1.1) | 379 (2.2) | |
| 2016 | 18 238 | 3543 (19.4) | 185 (1.0) | 390 (2.1) | |
| 2017 | 19 138 | 4076 (21.3) | 219 (1.1) | 365 (1.9) | |
| 2018 | 19 152 | 4309 (22.5) | 178 (0.9) | 325 (1.7) | |
| 2019 | 19 703 | 4522 (23.0) | 199 (1.0) | 335 (1.7) | |
| 2020 | 19 947 | 4520 (22.7) | 205 (1.0) | 345 (1.7) | |
| Spleen | 2011 | 3609 | 400 (11.1) | 83 (2.3) | 137 (3.8) |
| 2012 | 4142 | 528 (12.7) | 84 (2.0) | 138 (3.3) | |
| 2013 | 4509 | 575 (12.8) | 79 (1.8) | 139 (3.1) | |
| 2014 | 4272 | 549 (12.9) | 88 (2.1) | 137 (3.2) | |
| 2015 | 3568 | 543 (15.2) | 88 (2.5) | 144 (4.0) | |
| 2016 | 3171 | 449 (14.2) | 76 (2.4) | 117 (3.7) | |
| 2017 | 2864 | 434 (15.2) | 65 (2.3) | 89 (3.1) | |
| 2018 | 2544 | 418 (16.4) | 69 (2.7) | 104 (4.1) | |
| 2019 | 2413 | 380 (15.7) | 71 (2.9) | 97 (4.0) | |
| 2020 | 2096 | 313 (14.9) | 63 (3.0) | 87 (4.2) | |
| Others | 2011 | 23 218 | 3494 (15.0) | 1163 (5.0) | 1887 (8.1) |
| 2012 | 28 779 | 4388 (15.2) | 1399 (4.9) | 2293 (8.0) | |
| 2013 | 36 363 | 4712 (13.0) | 1401 (3.9) | 2346 (6.5) | |
| 2014 | 39 854 | 5176 (13.0) | 1521 (3.8) | 2489 (6.2) | |
| 2015 | 41 465 | 5380 (13.0) | 1541 (3.7) | 2545 (6.1) | |
| 2016 | 43 523 | 5975 (13.7) | 1760 (4.0) | 2684 (6.2) | |
| 2017 | 45 622 | 6539 (14.3) | 1909 (4.2) | 2699 (5.9) | |
| 2018 | 46 587 | 6645 (14.3) | 1865 (4.0) | 2710 (5.8) | |
| 2019 | 50 525 | 7750 (15.3) | 2221 (4.4) | 3220 (6.4) | |
| 2020 | 50 048 | 7838 (15.7) | 2267 (4.5) | 3284 (6.6) |
Complications were defined by Clavien–Dindo grade IIIa–V.
Operative mortality was a rate that combined 30‐day mortality and hospitalization death in 31–90 days after surgery.
3.3. Annual changes in surgeries of the eight major operative procedures
As shown in Figure 2, the number of surgeries of the eight major operative procedures in 2020 decreased from 2019 (esophagectomy, 3.0% decrease year‐on‐year; distal gastrectomy, 12.8%; total gastrectomy, 12.6%; right hemicolectomy, 3.5%; low anterior resection, 5.8%; hepatectomy, 3.8%; acute diffuse peritonitis surgery, 1.4%), except for pancreaticoduodenectomy (1.2% increase year‐on‐year).
FIGURE 2.
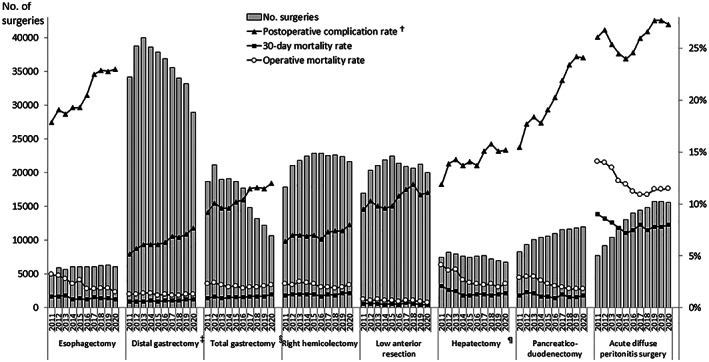
Annual changes in number of the surgeries, 30‐day and operative mortality rates, and complication rates of the eight major surgical procedures. †Postoperative complication was defined as grades IIIa–V in the Clavien–Dindo classification. ‡Including pylorus‐preserving gastrectomy and segmental gastrectomy, §including proximal gastrectomy, ¶segmentectomy or more; excluding lateral segmentectomy
The ratio of age ≥80 years increased 2.0%–7.0% in the last decade (Table 6). In terms of the institution types, most cases (94%–99% in 2020) of each procedure were performed in certified or affiliated institutions of the JSGS (Table 7). In 2020, the percentages of surgeries with participation of an anesthesiologist in each procedure were generally more than 95%. Board‐certified surgeon participation rates have been increasing year by year for all procedures. The percentage of the participation of JSGS board‐certified surgeons in 2020 was 96% to 98% for esophagectomy, hepatectomy, and pancreaticoduodenectomy. In contrast, the percentages were relatively low for acute diffuse peritonitis surgery (76.1% in 2020) (Table 7).
TABLE 6.
Annual changes in surgeries of the eight major operative procedures by sex and age of patients
| Procedure | Year | No. of surgeries | Sex (%) | Age (%) | ||||||
|---|---|---|---|---|---|---|---|---|---|---|
| Male | Female | <60 | 60 to <65 | 65 to <70 | 70 to <75 | 75 to <80 | ≥80 | |||
| Esophagectomy | 2011 | 4916 | 84.1 | 15.9 | 20.4 | 20.8 | 22.5 | 19.4 | 12.2 | 4.7 |
| 2012 | 5946 | 84.4 | 15.6 | 19.7 | 21.3 | 20.7 | 20.3 | 13.1 | 4.9 | |
| 2013 | 5694 | 83.6 | 16.4 | 18.3 | 18.3 | 22.6 | 21.3 | 13.8 | 5.8 | |
| 2014 | 6091 | 84.0 | 16.0 | 18.7 | 17.8 | 22.8 | 22.0 | 13.4 | 5.2 | |
| 2015 | 6060 | 82.9 | 17.1 | 17.9 | 16.3 | 23.6 | 23.5 | 13.1 | 5.7 | |
| 2016 | 6041 | 81.7 | 18.3 | 17.8 | 15.8 | 25.3 | 21.6 | 14.3 | 5.2 | |
| 2017 | 6100 | 82.3 | 17.7 | 17.0 | 14.6 | 25.6 | 20.6 | 15.8 | 6.3 | |
| 2018 | 6207 | 80.5 | 19.5 | 17.2 | 14.2 | 22.6 | 22.8 | 16.8 | 6.5 | |
| 2019 | 6298 | 81.0 | 19.0 | 17.0 | 13.9 | 20.7 | 24.1 | 17.2 | 7.0 | |
| 2020 | 6111 | 80.4 | 19.6 | 17.0 | 14.5 | 19.5 | 24.0 | 16.8 | 8.2 | |
| Distal gastrectomy a | 2011 | 34 160 | 66.6 | 33.4 | 18.1 | 15.0 | 14.2 | 17.4 | 16.8 | 18.5 |
| 2012 | 38 750 | 66.9 | 33.1 | 16.9 | 14.8 | 15.0 | 17.8 | 16.5 | 18.8 | |
| 2013 | 39 957 | 66.7 | 33.3 | 16.3 | 13.5 | 15.8 | 17.8 | 17.6 | 19.0 | |
| 2014 | 38 584 | 66.4 | 33.6 | 15.7 | 12.4 | 16.6 | 18.4 | 17.3 | 19.5 | |
| 2015 | 37 819 | 66.6 | 33.4 | 14.8 | 11.3 | 17.5 | 18.2 | 17.5 | 20.6 | |
| 2016 | 36 852 | 66.6 | 33.4 | 14.5 | 10.4 | 18.5 | 17.6 | 17.4 | 21.6 | |
| 2017 | 35 517 | 66.8 | 33.2 | 13.4 | 9.9 | 18.0 | 18.1 | 18.0 | 22.6 | |
| 2018 | 33 988 | 66.6 | 33.4 | 12.9 | 9.1 | 16.9 | 19.0 | 18.1 | 24.0 | |
| 2019 | 33 177 | 66.5 | 33.5 | 12.2 | 8.6 | 15.3 | 20.4 | 19.3 | 24.3 | |
| 2020 | 28 944 | 67.1 | 32.9 | 11.6 | 8.1 | 14.1 | 21.2 | 19.6 | 25.4 | |
| Total gastrectomy b | 2011 | 18 652 | 73.7 | 26.3 | 16.6 | 14.7 | 16.0 | 19.7 | 18.0 | 15.0 |
| 2012 | 21 122 | 74.2 | 25.8 | 15.5 | 14.8 | 15.7 | 19.2 | 18.5 | 16.3 | |
| 2013 | 19 035 | 74.0 | 26.0 | 14.7 | 13.5 | 16.9 | 19.4 | 19.2 | 16.3 | |
| 2014 | 19 071 | 73.7 | 26.3 | 14.0 | 12.3 | 17.2 | 20.1 | 18.9 | 17.5 | |
| 2015 | 18 695 | 74.5 | 25.5 | 13.7 | 11.1 | 18.9 | 20.8 | 18.2 | 17.4 | |
| 2016 | 17 670 | 74.4 | 25.6 | 12.6 | 10.3 | 19.6 | 19.5 | 19.0 | 19.0 | |
| 2017 | 14 840 | 74.2 | 25.8 | 12.2 | 9.9 | 19.0 | 19.6 | 19.8 | 19.5 | |
| 2018 | 13 223 | 74.4 | 25.6 | 10.8 | 9.1 | 18.0 | 20.6 | 20.6 | 20.9 | |
| 2019 | 12 188 | 74.3 | 25.7 | 10.7 | 9.0 | 16.9 | 21.4 | 21.5 | 20.6 | |
| 2020 | 10 652 | 75.2 | 24.8 | 10.6 | 8.0 | 15.3 | 23.5 | 20.6 | 22.0 | |
| Right hemicolectomy | 2011 | 17 890 | 50.5 | 49.5 | 12.8 | 11.6 | 13.1 | 17.3 | 18.8 | 26.5 |
| 2012 | 21 034 | 50.3 | 49.7 | 13.1 | 10.9 | 13.1 | 17.0 | 19.0 | 26.9 | |
| 2013 | 21 814 | 50.6 | 49.4 | 13.0 | 10.0 | 13.4 | 17.6 | 18.9 | 27.1 | |
| 2014 | 22 446 | 50.6 | 49.4 | 12.0 | 9.2 | 13.8 | 18.2 | 18.6 | 28.2 | |
| 2015 | 22 850 | 50.5 | 49.5 | 11.5 | 8.6 | 14.6 | 18.1 | 18.1 | 29.1 | |
| 2016 | 22 829 | 51.3 | 48.7 | 11.4 | 7.7 | 15.9 | 16.7 | 18.5 | 29.8 | |
| 2017 | 22 543 | 50.9 | 49.1 | 11.3 | 7.4 | 14.9 | 16.3 | 19.3 | 30.8 | |
| 2018 | 22 610 | 51.4 | 48.6 | 10.7 | 6.9 | 13.9 | 17.7 | 19.6 | 31.2 | |
| 2019 | 22 410 | 51.5 | 48.5 | 11.0 | 6.6 | 12.9 | 17.7 | 19.7 | 32.1 | |
| 2020 | 21 626 | 51.1 | 48.9 | 11.4 | 6.4 | 11.2 | 18.3 | 19.8 | 32.9 | |
| Low anterior resection | 2011 | 16 984 | 64.8 | 35.2 | 24.1 | 18.5 | 16.5 | 16.2 | 12.9 | 11.7 |
| 2012 | 20 321 | 64.8 | 35.2 | 24.2 | 17.6 | 16.5 | 16.6 | 13.1 | 12.0 | |
| 2013 | 21 096 | 64.2 | 35.8 | 23.8 | 16.5 | 17.4 | 16.9 | 13.5 | 11.8 | |
| 2014 | 21 861 | 64.8 | 35.2 | 23.1 | 15.7 | 18.3 | 17.9 | 13.1 | 11.9 | |
| 2015 | 22 493 | 64.4 | 35.6 | 23.5 | 14.2 | 19.6 | 17.1 | 13.6 | 12.0 | |
| 2016 | 21 387 | 64.4 | 35.6 | 23.4 | 13.6 | 20.7 | 16.8 | 13.2 | 12.2 | |
| 2017 | 20 879 | 64.2 | 35.8 | 23.2 | 12.6 | 20.9 | 16.7 | 13.5 | 13.2 | |
| 2018 | 20 636 | 64.9 | 35.1 | 22.9 | 12.5 | 19.3 | 18.0 | 14.4 | 12.9 | |
| 2019 | 21 262 | 63.9 | 36.1 | 23.3 | 11.6 | 18.4 | 18.6 | 14.6 | 13.5 | |
| 2020 | 20 022 | 63.9 | 36.1 | 23.9 | 11.9 | 16.6 | 19.8 | 14.2 | 13.7 | |
| Hepatectomy c | 2011 | 7434 | 70.4 | 29.6 | 20.1 | 16.4 | 16.5 | 20.4 | 18.0 | 8.7 |
| 2012 | 8239 | 69.5 | 30.5 | 19.8 | 16.1 | 17.4 | 19.5 | 18.5 | 8.8 | |
| 2013 | 7937 | 69.4 | 30.6 | 19.4 | 14.2 | 18.0 | 20.3 | 18.2 | 9.9 | |
| 2014 | 7666 | 69.2 | 30.8 | 18.5 | 13.8 | 18.5 | 21.5 | 17.6 | 10.0 | |
| 2015 | 7439 | 68.9 | 31.1 | 18.7 | 12.5 | 19.3 | 20.9 | 17.6 | 11.1 | |
| 2016 | 7610 | 68.7 | 31.3 | 18.0 | 11.9 | 21.1 | 20.4 | 17.5 | 11.1 | |
| 2017 | 7698 | 69.5 | 30.5 | 17.2 | 11.3 | 20.5 | 20.4 | 18.7 | 11.9 | |
| 2018 | 7192 | 69.5 | 30.5 | 17.2 | 9.6 | 19.1 | 21.4 | 19.4 | 13.3 | |
| 2019 | 7018 | 69.2 | 30.8 | 16.7 | 9.2 | 16.8 | 22.6 | 20.9 | 13.8 | |
| 2020 | 6753 | 68.4 | 31.6 | 16.7 | 9.3 | 15.4 | 22.8 | 21.1 | 14.7 | |
| Pancreaticoduodenectomy | 2011 | 8305 | 61.9 | 38.1 | 16.1 | 16.0 | 17.3 | 20.9 | 18.8 | 10.9 |
| 2012 | 9329 | 62.0 | 38.0 | 14.7 | 15.8 | 18.0 | 20.6 | 20.2 | 10.6 | |
| 2013 | 10 068 | 60.9 | 39.1 | 14.0 | 12.6 | 19.6 | 22.5 | 19.4 | 11.8 | |
| 2014 | 10 400 | 59.5 | 40.5 | 18.4 | 12.4 | 19.0 | 21.0 | 18.2 | 11.1 | |
| 2015 | 10 576 | 60.7 | 39.3 | 14.2 | 11.7 | 20.0 | 22.9 | 19.3 | 12.0 | |
| 2016 | 11 028 | 61.1 | 38.9 | 14.2 | 10.3 | 20.6 | 21.8 | 20.3 | 12.7 | |
| 2017 | 11 580 | 61.1 | 38.9 | 13.8 | 9.8 | 20.4 | 20.8 | 21.6 | 13.6 | |
| 2018 | 11 626 | 60.3 | 39.7 | 13.3 | 9.1 | 18.9 | 22.2 | 22.0 | 14.6 | |
| 2019 | 11 813 | 60.7 | 39.3 | 13.1 | 9.1 | 17.4 | 22.6 | 22.1 | 15.6 | |
| 2020 | 11 953 | 60.6 | 39.4 | 12.9 | 8.5 | 15.4 | 24.1 | 23.1 | 16.0 | |
| Acute diffuse peritonitis surgery | 2011 | 7753 | 60.0 | 40.0 | 31.4 | 11.2 | 9.7 | 11.7 | 13.2 | 22.9 |
| 2012 | 9177 | 61.0 | 39.0 | 30.3 | 11.2 | 10.1 | 11.6 | 13.4 | 23.4 | |
| 2013 | 10 447 | 60.1 | 39.9 | 29.1 | 10.3 | 11.5 | 11.8 | 13.1 | 24.1 | |
| 2014 | 12 085 | 61.2 | 38.8 | 28.4 | 9.5 | 12.2 | 12.3 | 12.9 | 24.7 | |
| 2015 | 13 030 | 59.4 | 40.6 | 28.2 | 8.9 | 12.5 | 13.1 | 12.3 | 25.0 | |
| 2016 | 13 981 | 60.2 | 39.8 | 27.4 | 8.6 | 13.4 | 12.4 | 12.3 | 26.0 | |
| 2017 | 14 423 | 59.4 | 40.6 | 26.5 | 7.8 | 13.0 | 12.0 | 13.6 | 27.1 | |
| 2018 | 14 835 | 59.2 | 40.8 | 26.1 | 7.7 | 12.7 | 13.1 | 13.5 | 26.9 | |
| 2019 | 15 765 | 59.2 | 40.8 | 25.2 | 7.7 | 11.6 | 13.6 | 14.1 | 27.7 | |
| 2020 | 15 542 | 58.9 | 41.1 | 25.4 | 7.6 | 11.0 | 14.2 | 14.0 | 27.8 | |
Including pylorus preserving gastrectomy and segmental gastrectomy.
Including proximal gastrectomy.
Segmentectomy or more; excluding lateral segmentectomy.
TABLE 7.
Annual changes in surgeries of the eight major operative procedures by institution type and specialist participation rate
| Procedure | Year | No. of surgeries | Institution type (%) | Anesthesiologist participation (%) | Board‐certified surgeon participation (%) | Operating surgeon (%) | |||
|---|---|---|---|---|---|---|---|---|---|
| Certified institution | Affiliated institution | Others | Board‐ certified surgeon | Non‐board‐ certified surgeon | |||||
| Esophagectomy | 2011 | 4916 | 94.2 | 5.3 | 0.5 | 97.6 | 88.4 | 63.5 | 36.5 |
| 2012 | 5946 | 78.3 | 4.9 | 16.8 | 98.1 | 89.0 | 64.8 | 35.2 | |
| 2013 | 5694 | 92.9 | 5.9 | 1.2 | 98.0 | 90.8 | 66.6 | 33.4 | |
| 2014 | 6091 | 93.6 | 4.7 | 1.7 | 98.6 | 92.6 | 70.2 | 29.8 | |
| 2015 | 6060 | 93.6 | 4.6 | 1.8 | 98.5 | 93.5 | 72.1 | 27.9 | |
| 2016 | 6041 | 94.5 | 3.8 | 1.7 | 98.8 | 93.7 | 73.2 | 26.8 | |
| 2017 | 6100 | 95.3 | 3.1 | 1.7 | 98.8 | 94.8 | 74.7 | 25.3 | |
| 2018 | 6207 | 95.9 | 2.7 | 1.4 | 99.1 | 96.6 | 78.8 | 21.2 | |
| 2019 | 6298 | 96.3 | 2.3 | 1.5 | 98.9 | 96.4 | 80.6 | 19.4 | |
| 2020 | 6111 | 96.9 | 2.1 | 1.0 | 99.3 | 98.0 | 82.1 | 17.9 | |
| Distal gastrectomy a | 2011 | 34 160 | 81.1 | 16.6 | 2.3 | 93.2 | 71.3 | 37.0 | 63.0 |
| 2012 | 38 750 | 64.5 | 15.2 | 20.3 | 93.9 | 72.5 | 37.9 | 62.1 | |
| 2013 | 39 957 | 76.6 | 19.2 | 4.1 | 93.6 | 76.1 | 40.6 | 59.4 | |
| 2014 | 38 584 | 77.7 | 17.8 | 4.5 | 94.0 | 78.4 | 42.1 | 57.9 | |
| 2015 | 37 819 | 77.3 | 18.3 | 4.4 | 94.1 | 78.1 | 41.3 | 58.7 | |
| 2016 | 36 852 | 80.2 | 15.9 | 4.0 | 95.0 | 81.8 | 43.8 | 56.2 | |
| 2017 | 35 517 | 80.2 | 14.9 | 4.8 | 95.4 | 82.4 | 45.2 | 54.8 | |
| 2018 | 33 988 | 80.7 | 14.4 | 4.8 | 95.6 | 84.2 | 46.6 | 53.4 | |
| 2019 | 33 177 | 82.4 | 13.5 | 4.0 | 95.7 | 86.4 | 50.1 | 49.9 | |
| 2020 | 28 944 | 81.6 | 14.5 | 3.9 | 96.1 | 87.9 | 51.4 | 48.6 | |
| Total gastrectomy b | 2011 | 18 652 | 80.9 | 16.8 | 2.3 | 93.9 | 71.6 | 37.4 | 62.6 |
| 2012 | 21 122 | 63.0 | 15.3 | 21.7 | 94.3 | 72.1 | 38.0 | 62.0 | |
| 2013 | 19 035 | 77.2 | 18.9 | 3.9 | 94.2 | 75.0 | 39.5 | 60.5 | |
| 2014 | 19 071 | 77.8 | 17.9 | 4.3 | 94.4 | 77.7 | 41.7 | 58.3 | |
| 2015 | 18 695 | 77.9 | 17.9 | 4.1 | 94.5 | 78.2 | 42.6 | 57.4 | |
| 2016 | 17 670 | 80.0 | 15.9 | 4.0 | 95.0 | 81.4 | 45.0 | 55.0 | |
| 2017 | 14 840 | 79.3 | 15.8 | 4.9 | 95.0 | 80.7 | 44.3 | 55.7 | |
| 2018 | 13 223 | 79.6 | 15.5 | 4.9 | 95.4 | 82.6 | 46.2 | 53.8 | |
| 2019 | 12 188 | 80.0 | 15.5 | 4.4 | 95.7 | 85.5 | 49.2 | 50.8 | |
| 2020 | 10 652 | 79.0 | 16.4 | 4.6 | 96.0 | 86.7 | 51.8 | 48.2 | |
| Right hemicolectomy | 2011 | 17 890 | 75.7 | 21.2 | 3.1 | 92.7 | 66.0 | 30.5 | 69.5 |
| 2012 | 21 034 | 60.0 | 18.3 | 21.7 | 93.0 | 67.1 | 30.8 | 69.2 | |
| 2013 | 21 814 | 72.1 | 22.3 | 5.6 | 92.9 | 69.7 | 32.6 | 67.4 | |
| 2014 | 22 446 | 71.2 | 23.1 | 5.7 | 93.4 | 71.9 | 33.6 | 66.4 | |
| 2015 | 22 850 | 72.1 | 22.0 | 5.9 | 94.1 | 72.4 | 33.5 | 66.5 | |
| 2016 | 22 829 | 73.8 | 20.1 | 6.1 | 94.5 | 74.2 | 34.3 | 65.7 | |
| 2017 | 22 543 | 75.0 | 18.4 | 6.6 | 94.7 | 76.4 | 37.1 | 62.9 | |
| 2018 | 22 610 | 74.8 | 19.0 | 6.2 | 94.7 | 77.8 | 38.2 | 61.8 | |
| 2019 | 22 410 | 75.8 | 18.1 | 6.1 | 95.6 | 80.1 | 39.2 | 60.8 | |
| 2020 | 21 626 | 74.6 | 19.3 | 6.1 | 95.4 | 81.5 | 40.3 | 59.7 | |
| Low anterior resection | 2011 | 16 984 | 79.4 | 17.7 | 2.9 | 93.4 | 72.7 | 41.6 | 58.4 |
| 2012 | 20 321 | 64.0 | 16.2 | 19.7 | 93.8 | 73.0 | 42.3 | 57.7 | |
| 2013 | 21 096 | 76.3 | 19.5 | 4.2 | 93.7 | 75.5 | 44.3 | 55.7 | |
| 2014 | 21 861 | 76.2 | 19.0 | 4.9 | 94.4 | 78.2 | 47.2 | 52.8 | |
| 2015 | 22 493 | 76.9 | 18.3 | 4.8 | 94.6 | 79.2 | 47.7 | 52.3 | |
| 2016 | 21 387 | 79.0 | 16.4 | 4.7 | 95.0 | 81.0 | 48.8 | 51.2 | |
| 2017 | 20 879 | 79.3 | 15.6 | 5.1 | 95.2 | 83.1 | 51.2 | 48.8 | |
| 2018 | 20 636 | 80.9 | 14.3 | 4.8 | 95.2 | 84.5 | 54.4 | 45.6 | |
| 2019 | 21 262 | 81.2 | 14.1 | 4.6 | 95.6 | 86.8 | 58.3 | 41.7 | |
| 2020 | 20 022 | 80.3 | 15.4 | 4.3 | 96.1 | 88.2 | 60.6 | 39.4 | |
| Hepatectomy c | 2011 | 7434 | 91.1 | 8.0 | 0.8 | 96.4 | 88.9 | 61.5 | 38.5 |
| 2012 | 8239 | 75.9 | 7.9 | 16.3 | 96.8 | 89.3 | 64.0 | 36.0 | |
| 2013 | 7937 | 88.1 | 9.7 | 2.2 | 96.9 | 91.0 | 65.2 | 34.8 | |
| 2014 | 7666 | 88.2 | 8.7 | 3.1 | 96.7 | 92.3 | 66.6 | 33.4 | |
| 2015 | 7439 | 89.2 | 8.6 | 2.2 | 97.2 | 92.3 | 66.6 | 33.4 | |
| 2016 | 7610 | 90.7 | 7.1 | 2.1 | 97.1 | 93.3 | 67.7 | 32.3 | |
| 2017 | 7698 | 91.2 | 6.6 | 2.2 | 97.7 | 95.1 | 72.3 | 27.7 | |
| 2018 | 7192 | 92.8 | 5.2 | 2.0 | 97.7 | 95.8 | 72.8 | 27.2 | |
| 2019 | 7018 | 92.7 | 5.2 | 2.1 | 97.8 | 96.3 | 74.2 | 25.8 | |
| 2020 | 6753 | 91.8 | 6.1 | 2.0 | 98.1 | 97.3 | 76.5 | 23.5 | |
| Pancreaticoduodenectomy | 2011 | 8305 | 87.8 | 11.0 | 1.2 | 95.9 | 85.7 | 58.7 | 41.3 |
| 2012 | 9329 | 72.4 | 8.8 | 18.8 | 96.6 | 87.2 | 60.9 | 39.1 | |
| 2013 | 10 068 | 85.9 | 11.7 | 2.4 | 96.0 | 87.9 | 60.5 | 39.5 | |
| 2014 | 10 400 | 86.4 | 10.4 | 3.3 | 96.4 | 90.3 | 62.2 | 37.8 | |
| 2015 | 10 576 | 88.5 | 9.2 | 2.4 | 96.9 | 90.9 | 62.1 | 37.9 | |
| 2016 | 11 028 | 89.4 | 8.3 | 2.3 | 97.1 | 91.7 | 63.3 | 36.7 | |
| 2017 | 11 580 | 90.5 | 7.2 | 2.3 | 97.3 | 93.0 | 65.0 | 35.0 | |
| 2018 | 11 626 | 91.4 | 6.4 | 2.2 | 97.4 | 94.0 | 67.6 | 32.4 | |
| 2019 | 11 813 | 92.0 | 6.2 | 1.9 | 97.2 | 95.5 | 69.6 | 30.4 | |
| 2020 | 11 953 | 91.8 | 6.4 | 1.7 | 97.9 | 96.4 | 71.2 | 28.8 | |
| Acute diffuse peritonitis surgery | 2011 | 7753 | 80.6 | 16.9 | 2.4 | 90.0 | 58.5 | 23.5 | 76.5 |
| 2012 | 9177 | 65.2 | 16.4 | 18.4 | 90.4 | 59.4 | 22.7 | 77.3 | |
| 2013 | 10 447 | 77.7 | 18.1 | 4.2 | 91.2 | 62.4 | 23.9 | 76.1 | |
| 2014 | 12 085 | 77.7 | 17.2 | 5.1 | 91.9 | 63.3 | 25.1 | 74.9 | |
| 2015 | 13 030 | 79.8 | 15.9 | 4.3 | 92.2 | 64.5 | 24.9 | 75.1 | |
| 2016 | 13 981 | 82.2 | 13.8 | 4.0 | 93.0 | 66.8 | 26.1 | 73.9 | |
| 2017 | 14 423 | 83.1 | 13.0 | 3.8 | 93.3 | 69.0 | 27.2 | 72.8 | |
| 2018 | 14 835 | 83.4 | 12.4 | 4.2 | 93.6 | 70.4 | 28.7 | 71.3 | |
| 2019 | 15 765 | 83.8 | 12.2 | 4.0 | 94.6 | 73.7 | 29.8 | 70.2 | |
| 2020 | 15 542 | 82.0 | 13.8 | 4.2 | 94.6 | 76.1 | 31.7 | 68.3 | |
Including pylorus preserving gastrectomy and segmental gastrectomy.
Including proximal gastrectomy.
Segmentectomy or more; excluding lateral segmentectomy.
The rates of postoperative complications, re‐operation, 30‐day postoperative mortality, and operative mortality in the eight major operative procedures are shown in Table 8. The incidences of severe complications in these procedures, except acute diffuse peritonitis surgery, were on a rising trend in the past decade. Meanwhile, the re‐operation rates of all eight procedures were stable in the same period, and the 30‐day mortality rates of these procedures also remained relatively constant for all procedures. The operative mortality rates of esophagectomy, hepatectomy, pancreaticoduodenectomy, and acute diffuse peritonitis surgery in 2020 decreased by 1.1%–2.6% from 2011.
TABLE 8.
Annual changes in surgeries of the eight major operative procedures by complication and mortality rates
| Procedure | Year | No. of surgeries | No. of postoperative complications a (%) | No. of re‐operations (%) | No. of postoperative 30‐day mortalities (%) | No. of operative mortalities b (%) |
|---|---|---|---|---|---|---|
| Esophagectomy | 2011 | 4916 | 879 (17.9) | 310 (6.3) | 55 (1.1) | 158 (3.2) |
| 2012 | 5946 | 1135 (19.1) | 345 (5.8) | 63 (1.1) | 183 (3.1) | |
| 2013 | 5694 | 1067 (18.7) | 375 (6.6) | 67 (1.2) | 161 (2.8) | |
| 2014 | 6091 | 1178 (19.3) | 367 (6.0) | 49 (0.8) | 140 (2.3) | |
| 2015 | 6060 | 1171 (19.3) | 392 (6.5) | 57 (0.9) | 166 (2.7) | |
| 2016 | 6041 | 1240 (20.5) | 357 (5.9) | 49 (0.8) | 109 (1.8) | |
| 2017 | 6100 | 1374 (22.5) | 355 (5.8) | 61 (1.0) | 108 (1.8) | |
| 2018 | 6207 | 1420 (22.9) | 367 (5.9) | 53 (0.9) | 115 (1.9) | |
| 2019 | 6298 | 1435 (22.8) | 353 (5.6) | 54 (0.9) | 120 (1.9) | |
| 2020 | 6111 | 1403 (23.0) | 384 (6.3) | 47 (0.8) | 92 (1.5) | |
| Distal gastrectomy c | 2011 | 34 160 | 1774 (5.2) | 709 (2.1) | 208 (0.6) | 451 (1.3) |
| 2012 | 38 750 | 2205 (5.7) | 849 (2.2) | 232 (0.6) | 516 (1.3) | |
| 2013 | 39 957 | 2450 (6.1) | 892 (2.2) | 239 (0.6) | 542 (1.4) | |
| 2014 | 38 584 | 2356 (6.1) | 941 (2.4) | 264 (0.7) | 523 (1.4) | |
| 2015 | 37 819 | 2325 (6.1) | 851 (2.3) | 222 (0.6) | 452 (1.2) | |
| 2016 | 36 852 | 2314 (6.3) | 825 (2.2) | 249 (0.7) | 473 (1.3) | |
| 2017 | 35 517 | 2445 (6.9) | 859 (2.4) | 253 (0.7) | 437 (1.2) | |
| 2018 | 33 988 | 2327 (6.8) | 737 (2.2) | 227 (0.7) | 393 (1.2) | |
| 2019 | 33 177 | 2361 (7.1) | 739 (2.2) | 253 (0.8) | 427 (1.3) | |
| 2020 | 28 944 | 2235 (7.7) | 721 (2.5) | 238 (0.8) | 387 (1.3) | |
| Total gastrectomy d | 2011 | 18 652 | 1716 (9.2) | 634 (3.4) | 177 (0.9) | 427 (2.3) |
| 2012 | 21 122 | 2135 (10.1) | 758 (3.6) | 224 (1.1) | 503 (2.4) | |
| 2013 | 19 035 | 1831 (9.6) | 642 (3.4) | 169 (0.9) | 428 (2.2) | |
| 2014 | 19 071 | 1840 (9.6) | 698 (3.7) | 185 (1.0) | 379 (2.0) | |
| 2015 | 18 695 | 1907 (10.2) | 654 (3.5) | 178 (1.0) | 387 (2.1) | |
| 2016 | 17 670 | 1835 (10.4) | 638 (3.6) | 174 (1.0) | 336 (1.9) | |
| 2017 | 14 840 | 1702 (11.5) | 514 (3.5) | 161 (1.1) | 293 (2.0) | |
| 2018 | 13 223 | 1529 (11.6) | 487 (3.7) | 148 (1.1) | 265 (2.0) | |
| 2019 | 12 188 | 1406 (11.5) | 427 (3.5) | 136 (1.1) | 258 (2.1) | |
| 2020 | 10 652 | 1275 (12.0) | 425 (4.0) | 137 (1.3) | 230 (2.2) | |
| Right hemicolectomy | 2011 | 17 890 | 1150 (6.4) | 588 (3.3) | 213 (1.2) | 410 (2.3) |
| 2012 | 21 034 | 1470 (7.0) | 677 (3.2) | 263 (1.3) | 471 (2.2) | |
| 2013 | 21 814 | 1527 (7.0) | 721 (3.3) | 280 (1.3) | 538 (2.5) | |
| 2014 | 22 446 | 1544 (6.9) | 771 (3.4) | 287 (1.3) | 530 (2.4) | |
| 2015 | 22 850 | 1607 (7.0) | 769 (3.4) | 301 (1.3) | 534 (2.3) | |
| 2016 | 22 829 | 1510 (6.6) | 791 (3.5) | 253 (1.1) | 449 (2.0) | |
| 2017 | 22 543 | 1648 (7.3) | 785 (3.5) | 296 (1.3) | 450 (2.0) | |
| 2018 | 22 610 | 1679 (7.4) | 740 (3.3) | 276 (1.2) | 424 (1.9) | |
| 2019 | 22 410 | 1666 (7.4) | 713 (3.2) | 306 (1.4) | 449 (2.0) | |
| 2020 | 21 626 | 1724 (8.0) | 713 (3.3) | 313 (1.4) | 471 (2.2) | |
| Low anterior resection | 2011 | 16 984 | 1616 (9.5) | 1213 (7.1) | 75 (0.4) | 136 (0.8) |
| 2012 | 20 321 | 2092 (10.3) | 1413 (6.9) | 88 (0.4) | 149 (0.7) | |
| 2013 | 21 096 | 2059 (9.8) | 1473 (7.0) | 80 (0.4) | 175 (0.8) | |
| 2014 | 21 861 | 2098 (9.6) | 1546 (7.1) | 70 (0.3) | 152 (0.7) | |
| 2015 | 22 493 | 2210 (9.8) | 1550 (6.9) | 95 (0.4) | 156 (0.7) | |
| 2016 | 21 387 | 2306 (10.8) | 1492 (7.0) | 68 (0.3) | 126 (0.6) | |
| 2017 | 20 879 | 2376 (11.4) | 1330 (6.4) | 96 (0.5) | 148 (0.7) | |
| 2018 | 20 636 | 2454 (11.9) | 1424 (6.9) | 90 (0.4) | 142 (0.7) | |
| 2019 | 21 262 | 2320 (10.9) | 1346 (6.3) | 73 (0.3) | 119 (0.6) | |
| 2020 | 20 022 | 2229 (11.1) | 1341 (6.7) | 69 (0.3) | 102 (0.5) | |
| Hepatectomy e | 2011 | 7434 | 886 (11.9) | 203 (2.7) | 155 (2.1) | 303 (4.1) |
| 2012 | 8239 | 1146 (13.9) | 248 (3.0) | 142 (1.7) | 293 (3.6) | |
| 2013 | 7937 | 1135 (14.3) | 226 (2.8) | 130 (1.6) | 290 (3.7) | |
| 2014 | 7666 | 1052 (13.7) | 242 (3.2) | 94 (1.2) | 208 (2.7) | |
| 2015 | 7439 | 1049 (14.1) | 213 (2.9) | 87 (1.2) | 182 (2.4) | |
| 2016 | 7610 | 1046 (13.7) | 220 (2.9) | 96 (1.3) | 178 (2.3) | |
| 2017 | 7698 | 1160 (15.1) | 221 (2.9) | 97 (1.3) | 169 (2.2) | |
| 2018 | 7192 | 1137 (15.8) | 211 (2.9) | 83 (1.2) | 163 (2.3) | |
| 2019 | 7018 | 1058 (15.1) | 189 (2.7) | 94 (1.3) | 143 (2.0) | |
| 2020 | 6753 | 1027 (15.2) | 202 (3.0) | 93 (1.4) | 155 (2.3) | |
| Pancreaticoduodenectomy | 2011 | 8305 | 1285 (15.5) | 299 (3.6) | 97 (1.2) | 238 (2.9) |
| 2012 | 9329 | 1654 (17.7) | 365 (3.9) | 137 (1.5) | 281 (3.0) | |
| 2013 | 10 068 | 1853 (18.4) | 407 (4.0) | 142 (1.4) | 307 (3.0) | |
| 2014 | 10 400 | 1847 (17.8) | 374 (3.6) | 111 (1.1) | 267 (2.6) | |
| 2015 | 10 576 | 2025 (19.1) | 378 (3.6) | 120 (1.1) | 247 (2.3) | |
| 2016 | 11 028 | 2242 (20.3) | 393 (3.6) | 98 (0.9) | 232 (2.1) | |
| 2017 | 11 580 | 2539 (21.9) | 413 (3.6) | 145 (1.3) | 232 (2.0) | |
| 2018 | 11 626 | 2716 (23.4) | 402 (3.5) | 111 (1.0) | 204 (1.8) | |
| 2019 | 11 813 | 2854 (24.2) | 402 (3.4) | 119 (1.0) | 210 (1.8) | |
| 2020 | 11 953 | 2882 (24.1) | 404 (3.4) | 138 (1.2) | 216 (1.8) | |
| Acute diffuse peritonitis surgery | 2011 | 7753 | 2022 (26.1) | 634 (8.2) | 697 (9.0) | 1096 (14.1) |
| 2012 | 9177 | 2456 (26.8) | 685 (7.5) | 785 (8.6) | 1289 (14.0) | |
| 2013 | 10 447 | 2652 (25.4) | 786 (7.5) | 861 (8.2) | 1408 (13.5) | |
| 2014 | 12 085 | 2966 (24.5) | 937 (7.8) | 927 (7.7) | 1472 (12.2) | |
| 2015 | 13 030 | 3126 (24.0) | 1051 (8.1) | 943 (7.2) | 1551 (11.9) | |
| 2016 | 13 981 | 3445 (24.6) | 1068 (7.6) | 1052 (7.5) | 1572 (11.2) | |
| 2017 | 14 423 | 3756 (26.0) | 1125 (7.8) | 1152 (8.0) | 1575 (10.9) | |
| 2018 | 14 835 | 3943 (26.6) | 1183 (8.0) | 1117 (7.5) | 1617 (10.9) | |
| 2019 | 15 765 | 4367 (27.7) | 1247 (7.9) | 1233 (7.8) | 1795 (11.4) | |
| 2020 | 15 542 | 4239 (27.3) | 1208 (7.8) | 1247 (8.0) | 1794 (11.5) |
Complications were defined by Clavien–Dindo grade IIIa–V.
Operative mortality was a rate that combined 30‐day mortality and hospitalization death in 31–90 days after surgery.
Including pylorus preserving gastrectomy and segmental gastrectomy.
Including proximal gastrectomy.
Segmentectomy or more; excluding lateral segmentectomy.
The rates of endoscopic surgery for the eight major operative procedures are shown in Figure 3. From 2015, endoscopic surgery increased at a constant rate for each in all eight procedures. The endoscopic surgery rate of esophagectomy reached over 70% in 2020 and almost caught up with that of low anterior resection.
FIGURE 3.
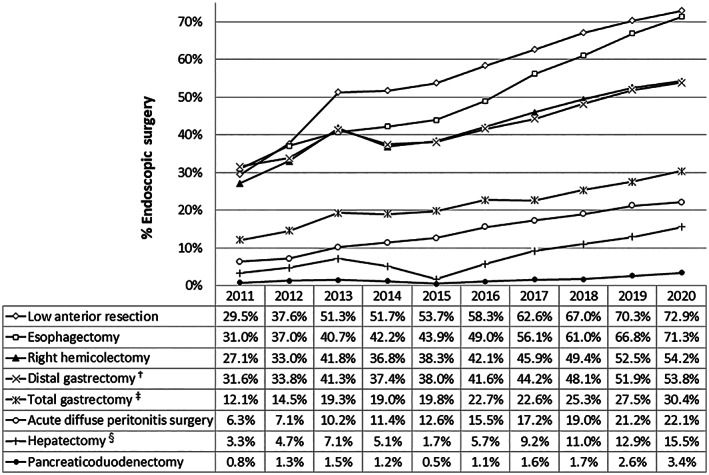
Annual changes in the rate of endoscopic surgery in the eight major surgical procedures. †Including pylorus‐preserving gastrectomy and segmental gastrectomy, ‡including proximal gastrectomy, §segmentectomy or more; excluding lateral segmentectomy
4. DISCUSSION
This is the first annual report of each operative procedure in the latest version of the “Training Curriculum for Board‐Certified Surgeons in Gastroenterology,” which was partially revised in 2019. The four procedures, i.e., surgery for hepatic trauma, surgery for bile duct trauma, surgery for pancreatic trauma and pancreatic transplantation, were newly registrable in the NCD from 2019. All three, hepatic, biliary, and pancreatic surgeries for trauma, showed high operative mortalities (27.5% for hepatic trauma, 16.7% for pancreatic trauma, and 9.8% for bile duct trauma) in 2020, and the rates of participation of JSGS board‐certified surgeons were in inverse relation to the mortalities (participation rate: 63.4%, 77.8%, and 83.6%, respectively). To improve the outcomes of these surgical procedures, continuous accumulation and analysis of further data regarding short‐term outcomes and patients' characteristics are warranted.
There were seven high mortality procedures that were performed in over 100 cases in 2020, with the exception of trauma surgeries. Of these, five procedures (gastrointestinal perforation closure, total colectomy, external cholecystostomy, esophageal fistula construction, and acute diffuse peritonitis surgery) constantly showed high mortalities, at a rate of more than 10%, in recent years. 24 , 25 The difficulty levels of these procedures are defined as moderate or low in the JSGS, and the rate of participation of board‐certified surgeons was relatively low (approximately 75%, except for esophageal fistula construction). Most of them were emergency surgeries and were considered to have included many patients in a moribund condition.
In this report, the 10‐year data of the gastroenterological section of the NCD were also summarized. The total number of gastroenterological surgeries registered in the NCD has gradually increased in the last 10 years, except for the year 2020. The first patient with novel coronavirus disease 2019 (COVID‐19) in Japan was diagnosed in January 2020, and then COVID‐19 infection spread rapidly in this country as a pandemic. 29 The annual total number of gastroenterological surgeries was decreased by 2.7% in 2020 compared to the prior year. However, this reduction rate was relatively less compared to those reported for surgeries in some other fields (e.g., coronary artery bypass grafting, 8.7%; lobectomy, 7.8%; thyroidectomy, 12.7%; and pediatric inguinal hernia repair, 15.0%). 30 In particular, the total numbers of pancreatic and liver surgeries in 2020 increased compared to those in 2019. One of the reasons might be that the timing of diagnosis of these tumors was not affected by the reduction of common cancer screenings caused by the pandemic. Another reason for the increase in pancreatic and liver surgeries might be that most of these procedures are indicated for malignant tumors, including pancreatic and biliary cancers, which are well‐recognized to show rapid growth and poor prognosis, prompting surgeons to perform surgeries without delay even in the COVID‐19 situation. On the other hand, the number of splenic surgeries, most of which are performed for benign diseases, decreased greatly in 2020 (13.1% decrease year‐on‐year). The surgical indications under the catastrophic situation of a pandemic need further investigations.
There are several trends for all gastroenterological surgeries in the last decade. The 30‐day mortalities were stable, and the operative mortalities were slightly improved for almost all digestive organs. Meanwhile, the incidence of postoperative complications in alimentary tract surgery, except the esophagus, increased slightly to 10% from 8% in these 10 years. Furthermore, in pancreas and esophagus surgery, these incidences showed a rapid increase (up to more than 20%). Otherwise, there were the following trends: surgical cases were consistently aging; participation of board‐certified surgeons increased progressively; and rates of endoscopic surgery increased. The year 2020 was the third year that robotic surgery procedures in the gastroenterological field became widely covered by insurance in Japan. The number of robotic surgeries is rapidly increasing, 31 , 32 and the statistics for these procedures were included as endoscopic surgeries in this report.
More than half of all patients who underwent surgical treatment in the gastroenterological field were aged 70 years or over in recent years. The rate of surgical cases for patients aged more than 70 years was 51.6% for all gastroenterological surgeries in 2020, although it was less than 40% in 2011. In particular, 2020 was the first year that the percentage of surgeries for patients aged 80 years or older was more than 20% for all gastroenterological surgeries (Table 3). However, the operative mortalities in this decade showed a decrease rather than an increase. There are several possible reasons for such favorable results and one of these might be a positive aspect of the increase of the participation rate of board‐certified surgeons in gastroenterological surgeries because the contribution of board‐certified surgeons to favorable outcomes was demonstrated in the major gastroenterological surgeries. 33
The board‐certification system of the JSGS consists of board‐certified training institutions and board‐certified surgeons in gastroenterology. 33 The rates of participation of JSGS board‐certified surgeons in alimentary tract surgery, except the esophagus, increased by approximately 15% compared to 10 years earlier. Moreover, more than 95% of esophagus or pancreas surgeries that had been performed in 2020 involved board‐certified surgeons. The decreases of operative mortalities and the paradoxical increases of postoperative complications in pancreas and esophagus surgery may be explained by the participation of board‐certified surgeons. The re‐operation rates of esophagectomy or pancreaticoduodenectomy stayed constant through the last 10 years. To avoid re‐operation or surgical death, invasive treatments for postoperative complications (grade IIIa of the C‐D classification) such as image‐guided percutaneous drainage might have been selected by board‐certified surgeons.
Many studies are in progress to improve the quality control of surgical procedures using the NCD. The JSGS approved 92 studies from 2013 to 2021 and many high‐impact articles that could contribute to the improvement of surgical quality have been published so far. Fifteen articles using the data of the NCD were published in 2021. For instance, the importance of board‐certified surgeons to reduce operative mortality was reported in hepatectomy and hepatopancreatoduodenectomy. 34 , 35 Additionally, hospital volume affected postoperative mortality after eight major gastroenterological surgeries. 36
Regarding the studies of older patients in the NCD, the safety and feasibility in older rectal cancer patients were reported. 37 Furthermore, with the aging society, the number of surgeries with ileostomy or colostomy has increased gradually in Japan. 22 On the other hand, advanced age is associated with significantly worse short‐term outcomes in older patients undergoing major gastroenterological elective surgeries. 38 However, any distinct cutoff age beyond which major gastroenterological surgery could be considered as being contraindicated was not identified.
In the investigation of minimally invasive surgery in the NCD, laparoscopic surgery was becoming common in surgery for acute diffuse peritonitis of gastrointestinal perforation in the data of the NCD. 39 In the pancreatic field, the outcomes of laparoscopic pancreaticoduodenectomy under the strict limitations on institutions and indications were reported comparable to those of open procedures. 40 Furthermore, robotic gastrectomy and low anterior resection in the NCD were safely performed, with low mortality and morbidity rates, either equaling or surpassing those of laparoscopic surgery. 31 , 32
With respect to the other issues of postoperative mortality and morbidity rates in the NCD, the impact of reconstruction route on postoperative morbidity after esophagectomy was reported. 41 The Glasgow prognostic score was shown to be strongly correlated with postoperative outcomes. 42 Moreover, the mortalities after right hemicolectomy or pancreatoduodenectomy were not affected by day of the week. 43 , 44 In addition, in emergency surgery for acute diffuse peritonitis, antithrombotic drug usage was associated with a slight increase of intraoperative blood loss, which was thought to have little effect on clinical practice. 45
Much new evidence using the huge database of the NCD has been successively published. The NCD has contributed to quality assessment and improvement of surgery by feedback of accurate data in Japan. In conclusion, the good quality and safety of Japanese gastroenterological surgeries, which might be positively affected by the board‐certification system of the JSGS, were confirmed by the 10‐year data of the NCD. It is our hope that this report contributes to improving the quality of gastroenterological surgery in this country.
CONFLICT OF INTEREST
Yuko Kitagawa is Editor in Chief of Annals of Gastroenterological Surgery. Hideki Ueno, Yoshihiro Kakeji, Susumu Eguchi, Akio Saiura, Hiroya Takeuchi, Naoki Hiki, Akihiko Horiguchi, Satoru Matsuda, Tsunekazu Mizushima, and Yasuyuki Seto are editorial board members of Annals of Gastroenterological Surgery. Arata Takahashi, Hiroyuki Yamamoto, and Hiroaki Miyata are affiliated with the Department of Healthcare Quality Assessment at the University of Tokyo. The department is a social collaboration department supported by grants from the National Clinical Database, Johnson & Johnson K.K., and Nipro Co and Intuitive Surgical Sàrl. Other authors have no conflict of interest.
ETHICS STATEMENTS
Approval of the research protocol: N/A.
Informed Consent: N/A.
Registry and the Registration No. of the study/trial: N/A.
Animal Studies: N/A.
ACKNOWLEDGMENTS
The authors would like to thank all the medical staff, surgical clinical reviewers, and hospitals for their continued efforts in participating and entering the data for this NCD. The authors would also like to thank Mr. Keita Shimoakasho of the JSGS and Ms. Hitomi Okamoto of the NCD for their generous cooperation and providing important information for this article.
Kajiwara Y, Takahashi A, Ueno H, Kakeji Y, Hasegawa H, Eguchi S, et al. The National Clinical Database. Annual report on National Clinical Database 2020 for gastroenterological surgery in Japan. Ann Gastroenterol Surg. 2023;7:367–406. 10.1002/ags3.12662
REFERENCES
- 1. Kakeji Y, Yamamoto H, Ueno H, Eguchi S, Endo I, Sasaki A, et al. Development of gastroenterological surgery over the last decade in Japan: analysis of the National Clinical Database. Surg Today. 2021;51(2):187–93. [DOI] [PubMed] [Google Scholar]
- 2. Seto Y, Kakeji Y, Miyata H, Iwanaka T. National Clinical Database (NCD) in Japan for gastroenterological surgery: brief introduction. Ann Gastroenterol Surg. 2017;1(2):80–1. [DOI] [PMC free article] [PubMed] [Google Scholar]
- 3. National Clinical Database Home page. [Accessed 2022 Jul 31]. Available from: http://www.ncd.or.jp/
- 4. Gotoh M, Miyata H, Hashimoto H, Wakabayashi G, Konno H, Miyakawa S, et al. National Clinical Database feedback implementation for quality improvement of cancer treatment in Japan: from good to great through transparency. Surg Today. 2016;46(1):38–47. [DOI] [PMC free article] [PubMed] [Google Scholar]
- 5. Nakagoe T, Miyata H, Gotoh M, Anazawa T, Baba H, Kimura W, et al. Surgical risk model for acute diffuse peritonitis based on a Japanese nationwide database: an initial report on the surgical and 30‐day mortality. Surg Today. 2015;45(10):1233–43. [DOI] [PubMed] [Google Scholar]
- 6. Kurita N, Miyata H, Gotoh M, Shimada M, Imura S, Kimura W, et al. Risk model for distal gastrectomy when treating gastric cancer on the basis of data from 33,917 Japanese patients collected using a nationwide web‐based data entry system. Ann Surg. 2015;262(2):295–303. [DOI] [PubMed] [Google Scholar]
- 7. Matsubara N, Miyata H, Gotoh M, Tomita N, Baba H, Kimura W, et al. Mortality after common rectal surgery in Japan: a study on low anterior resection from a newly established nationwide large‐scale clinical database. Dis Colon Rectum. 2014;57(9):1075–81. [DOI] [PubMed] [Google Scholar]
- 8. Kobayashi H, Miyata H, Gotoh M, Baba H, Kimura W, Kitagawa Y, et al. Risk model for right hemicolectomy based on 19,070 Japanese patients in the National Clinical Database. J Gastroenterol. 2014;49(6):1047–55. [DOI] [PubMed] [Google Scholar]
- 9. Watanabe M, Miyata H, Gotoh M, Baba H, Kimura W, Tomita N, et al. Total gastrectomy risk model: data from 20,011 Japanese patients in a nationwide internet‐based database. Ann Surg. 2014;260(6):1034–9. [DOI] [PubMed] [Google Scholar]
- 10. Kimura W, Miyata H, Gotoh M, Hirai I, Kenjo A, Kitagawa Y, et al. A pancreaticoduodenectomy risk model derived from 8575 cases from a national single‐race population (Japanese) using a web‐based data entry system: the 30‐day and in‐hospital mortality rates for pancreaticoduodenectomy. Ann Surg. 2014;259(4):773–80. [DOI] [PubMed] [Google Scholar]
- 11. Kenjo A, Miyata H, Gotoh M, Kitagawa Y, Shimada M, Baba H, et al. Risk stratification of 7,732 hepatectomy cases in 2011 from the National Clinical Database for Japan. J Am Coll Surg. 2014;218(3):412–22. [DOI] [PubMed] [Google Scholar]
- 12. Takeuchi H, Miyata H, Gotoh M, Kitagawa Y, Baba H, Kimura W, et al. A risk model for esophagectomy using data of 5354 patients included in a Japanese nationwide web‐based database. Ann Surg. 2014;260(2):259–66. [DOI] [PubMed] [Google Scholar]
- 13. Ohkura Y, Miyata H, Konno H, Udagawa H, Ueno M, Shindoh J, et al. Development of a model predicting the risk of eight major postoperative complications after esophagectomy based on 10 826 cases in the Japan National Clinical Database. J Surg Oncol. 2020;121(2):313–21. [DOI] [PubMed] [Google Scholar]
- 14. Marubashi S, Ichihara N, Kakeji Y, Miyata H, Taketomi A, Egawa H, et al. “Real‐time” risk models of postoperative morbidity and mortality for liver transplants. Ann Gastroenterol Surg. 2019;3(1):75–95. [DOI] [PMC free article] [PubMed] [Google Scholar]
- 15. Yoshida T, Miyata H, Konno H, Kumamaru H, Tangoku A, Furukita Y, et al. Risk assessment of morbidities after right hemicolectomy based on the National Clinical Database in Japan. Ann Gastroenterol Surg. 2018;2(3):220–30. [DOI] [PMC free article] [PubMed] [Google Scholar]
- 16. Kikuchi H, Miyata H, Konno H, Kamiya K, Tomotaki A, Gotoh M, et al. Development and external validation of preoperative risk models for operative morbidities after total gastrectomy using a Japanese web‐based nationwide registry. Gastric Cancer. 2017;20(6):987–97. [DOI] [PMC free article] [PubMed] [Google Scholar]
- 17. Watanabe T, Miyata H, Konno H, Kawai K, Ishihara S, Sunami E, et al. Prediction model for complications after low anterior resection based on data from 33,411 Japanese patients included in the National Clinical Database. Surgery. 2017;161(6):1597–608. [DOI] [PubMed] [Google Scholar]
- 18. Aoki S, Miyata H, Konno H, Gotoh M, Motoi F, Kumamaru H, et al. Risk factors of serious postoperative complications after pancreaticoduodenectomy and risk calculators for predicting postoperative complications: a nationwide study of 17,564 patients in Japan. J Hepatobiliary Pancreat Sci. 2017;24(5):243–51. [DOI] [PMC free article] [PubMed] [Google Scholar]
- 19. Kunisaki C, Miyata H, Konno H, Saze Z, Hirahara N, Kikuchi H, et al. Modeling preoperative risk factors for potentially lethal morbidities using a nationwide Japanese web‐based database of patients undergoing distal gastrectomy for gastric cancer. Gastric Cancer. 2017;20(3):496–507. [DOI] [PubMed] [Google Scholar]
- 20. Yokoo H, Miyata H, Konno H, Taketomi A, Kakisaka T, Hirahara N, et al. Models predicting the risks of six life‐threatening morbidities and bile leakage in 14,970 hepatectomy patients registered in the National Clinical Database of Japan. Medicine (Baltimore). 2016;95(49):e5466. [DOI] [PMC free article] [PubMed] [Google Scholar]
- 21. Saze Z, Miyata H, Konno H, Gotoh M, Anazawa T, Tomotaki A, et al. Risk models of operative morbidities in 16,930 critically ill surgical patients based on a Japanese Nationwide Database. Medicine (Baltimore). 2015;94(30):e1224. [DOI] [PMC free article] [PubMed] [Google Scholar]
- 22. Ando Y, Takahashi A, Fujii M, Hasegawa H, Kimura T, Yamamoto H, et al. Survey regarding gastrointestinal stoma construction and closure in Japan. Ann Gastroenterol Surg. 2021;6(2):212–26. [DOI] [PMC free article] [PubMed] [Google Scholar]
- 23. Kanaji S, Takahashi A, Miyata H, Marubashi S, Kakeji Y, Konno H, et al. Initial verification of data from a clinical database of gastroenterological surgery in Japan. Surg Today. 2019;49(4):328–33. [DOI] [PubMed] [Google Scholar]
- 24. Marubashi S, Takahashi A, Kakeji Y, Hasegawa H, Ueno H, Eguchi S, et al. Surgical outcomes in gastroenterological surgery in Japan: report of the National Clinical Database 2011‐2019. Ann Gastroenterol Surg. 2021;5(5):639–58. [DOI] [PMC free article] [PubMed] [Google Scholar]
- 25. Kakeji Y, Takahashi A, Hasegawa H, Ueno H, Eguchi S, Endo I, et al. Surgical outcomes in gastroenterological surgery in Japan: report of the National Clinical Database 2011‐2018. Ann Gastroenterol Surg. 2020;4(3):250–74. [DOI] [PMC free article] [PubMed] [Google Scholar]
- 26. Hasegawa H, Takahashi A, Kakeji Y, Ueno H, Eguchi S, Endo I, et al. Surgical outcomes of gastroenterological surgery in Japan: report of the National Clinical Database 2011‐2017. Ann Gastroenterol Surg. 2019;3(4):426–50. [DOI] [PMC free article] [PubMed] [Google Scholar]
- 27. Kakeji Y, Takahashi A, Udagawa H, Unno M, Endo I, Kunisaki C, et al. Surgical outcomes in gastroenterological surgery in Japan: report of National Clinical database 2011‐2016. Ann Gastroenterol Surg. 2018;2(1):37–54. [DOI] [PMC free article] [PubMed] [Google Scholar]
- 28. Katayama H, Kurokawa Y, Nakamura K, Ito H, Kanemitsu Y, Masuda N, et al. Extended Clavien‐Dindo classification of surgical complications: Japan Clinical Oncology Group postoperative complications criteria. Surg Today. 2016;46(6):668–85. [DOI] [PMC free article] [PubMed] [Google Scholar]
- 29. Ministry of Health, Labour and Welfare . [Accessed 2022 Jul 31]. Available from: https://www.mhlw.go.jp/content/000936655.pdf (in Japanese).
- 30. Ikeda N, Yamamoto H, Taketomi A, Hibi T, Ono M, Niikura N, et al. The impact of COVID‐19 on surgical procedures in Japan: analysis of data from the National Clinical Database. Surg Today. 2022;52(1):22–35. [DOI] [PMC free article] [PubMed] [Google Scholar]
- 31. Suda K, Yamamoto H, Nishigori T, Obama K, Yoda Y, Hikage M, et al. Safe implementation of robotic gastrectomy for gastric cancer under the requirements for universal health insurance coverage: a retrospective cohort study using a nationwide registry database in Japan. Gastric Cancer. 2021;25(2):438–49. [DOI] [PMC free article] [PubMed] [Google Scholar]
- 32. Matsuyama T, Endo H, Yamamoto H, Takemasa I, Uehara K, Hanai T, et al. Outcomes of robot‐assisted versus conventional laparoscopic low anterior resection in patients with rectal cancer: propensity‐matched analysis of the National Clinical Database in Japan. BJS Open. 2021;5(5):zrab083. [DOI] [PMC free article] [PubMed] [Google Scholar]
- 33. Konno H, Kamiya K, Kikuchi H, Miyata H, Hirahara N, Gotoh M, et al. Association between the participation of board‐certified surgeons in gastroenterological surgery and operative mortality after eight gastroenterological procedures. Surg Today. 2017;47(5):611–8. [DOI] [PubMed] [Google Scholar]
- 34. Arita J, Yamamoto H, Kokudo T, Hasegawa K, Miyata H, Toh Y, et al. Impact of board certification system and adherence to the clinical practice guidelines for liver cancer on post‐hepatectomy risk‐adjusted mortality rate in Japan: a questionnaire survey of departments registered with the National Clinical Database. J Hepatobiliary Pancreat Sci. 2021;28(10):801–11. [DOI] [PMC free article] [PubMed] [Google Scholar]
- 35. Endo I, Hirahara N, Miyata H, Yamamoto H, Matsuyama R, Kumamoto T, et al. Mortality, morbidity, and failure to rescue in hepatopancreatoduodenectomy: an analysis of patients registered in the National Clinical Database in Japan. J Hepatobiliary Pancreat Sci. 2021;28(4):305–16. [DOI] [PubMed] [Google Scholar]
- 36. Konno H, Kamiya K, Takahashi A, Kumamaru H, Kakeji Y, Marubashi S, et al. Profiles of institutional departments affect operative outcomes of eight gastroenterological procedures. Ann Gastroenterol Surg. 2021;5(3):304–13. [DOI] [PMC free article] [PubMed] [Google Scholar]
- 37. Seishima R, Miyata H, Okabayashi K, Hasegawa H, Tsuruta M, Shigeta K, et al. Safety and feasibility of laparoscopic surgery for elderly rectal cancer patients in Japan: a nationwide study. BJS Open. 2021;5(2):zrab007. [DOI] [PMC free article] [PubMed] [Google Scholar]
- 38. Omichi K, Hasegawa K, Kumamaru H, Miyata H, Konno H, Seto Y, et al. Association between age and short‐term outcomes of gastroenterological surgeries in older patients: an analysis using the National Clinical Database in Japan. Langenbecks Arch Surg. 2021;406(8):2827–36. [DOI] [PubMed] [Google Scholar]
- 39. Hoshino N, Endo H, Hida K, Kumamaru H, Hasegawa H, Ishigame T, et al. Laparoscopic surgery for acute diffuse peritonitis due to gastrointestinal perforation: a nationwide epidemiologic study using the National Clinical Database. Ann Gastroenterol Surg. 2022;6(3):430–44. [DOI] [PMC free article] [PubMed] [Google Scholar]
- 40. Nakata K, Yamamoto H, Miyata H, Kakeji Y, Kitagawa Y, Nakamura M. Comparison of outcomes between laparoscopic and openpancreaticoduodenectomy without radicallymphadenectomy: results of coarsened exact matchinganalysis using national database systems. Asian J Endosc Surg. 2021;15(1):15–21. [DOI] [PubMed] [Google Scholar]
- 41. Kikuchi H, Endo H, Yamamoto H, Ozawa S, Miyata H, Kakeji Y, et al. Impact of reconstruction route on postoperative morbidity after esophagectomy: analysis of esophagectomies in the Japanese National Clinical Database. Ann Gastroenterol Surg. 2022;6(1):46–53. [DOI] [PMC free article] [PubMed] [Google Scholar]
- 42. Hiramatsu Y, Kumamaru H, Kikuchi H, Usune S, Kamiya K, Miyata H, et al. Significance of the Glasgow prognostic score for short‐term surgical outcomes: a nationwide survey using the Japanese National Clinical Database. Ann Gastroenterol Surg. 2021;5(5):659–68. [DOI] [PMC free article] [PubMed] [Google Scholar]
- 43. Maeda H, Endo H, Ichihara N, Miyata H, Hasegawa H, Kamiya K, et al. Association of day of the week with mortality after elective right hemicolectomy for colon cancer: case analysis from the National Clinical Database. Ann Gastroenterol Surg. 2021;5(3):331–7. [DOI] [PMC free article] [PubMed] [Google Scholar]
- 44. Uemura S, Endo H, Ichihara N, Miyata H, Maeda H, Hasegawa H, et al. Day of surgery and mortality after pancreatoduodenectomy: a retrospective analysis of 29 270 surgical cases of pancreatic head cancer from Japan. J Hepatobiliary Pancreat Sci. 2021;29(7):778–84. [DOI] [PubMed] [Google Scholar]
- 45. Matsuoka T, Ichihara N, Shinozaki H, Kobayashi K, Lefor KA, Kimura T, et al. Antithrombotic drugs have a minimal effect on intraoperative blood loss during emergency surgery for generalized peritonitis: a nationwide retrospective cohort study in Japan. World J Emerg Surg. 2021;16(1):27. [DOI] [PMC free article] [PubMed] [Google Scholar]