

Abstract
Pathogenic Escherichia coli associated with urinary tract infections (UTIs) in otherwise healthy individuals frequently produce cytotoxic necrotizing factor type 1 (CNF1), a member of the family of bacterial toxins that target the Rho family of small GTP-binding proteins. To gain insight into the function of CNF1 in the development of E. coli-mediated UTIs, we examined the effects of CNF1 intoxication on a panel of human cell lines derived from physiologically relevant sites (bladder, ureters, and kidneys). We identified one uroepithelial cell line that exhibited a distinctly different CNF1 intoxication phenotype from the prototypic one of multinucleation without cell death that is seen when HEp-2 or other epithelial cells are treated with CNF1. The 5637 bladder cell line detached from the growth surface within 72 h of CNF1 intoxication, a finding that suggested frank cytotoxicity. To determine the basis for the unexpected toxic effect of CNF1 on 5637 cells, we compared the degree of toxin binding, actin fiber formation, and Rho modification with those CNF1-induced events in HEp-2 cells. We found no apparent difference in the amount of CNF1 bound to 5637 cells and HEp-2 cells. Moreover, CNF1 modified Rho, in vivo and in vitro, in both cell types. In contrast, one of the classic responses to CNF1 in HEp-2 and other epithelial cell lines, the formation of actin stress fibers, was markedly absent in 5637 cells. Indeed, actin stress fiber induction by CNF1 did not occur in any of the other human bladder cell lines that we tested (J82, SV-HUC-1, or T24). Furthermore, the appearance of lamellipodia and filopodia in 5637 cells suggested that CNF1 activated the Cdc42 and Rac proteins. Finally, apoptosis was observed in CNF1-intoxicated 5637 cells. If our results with 5637 cells reflect the interaction of CNF1 with the transitional uroepithelium in the human bladder, then CNF1 may be involved in the exfoliative process that occurs in that organ after infection with uropathogenic E. coli.
Cytotoxic necrotizing factor type 1 (CNF1), an ∼115-kDa cytoplasmic protein (9, 13, 18) present in certain diarrheagenic and uropathogenic strains of Escherichia coli (UPEC) (4–6, 10, 11, 41), is a member of a family of bacterial toxins that target the Rho family of small GTP-binding proteins in mammalian cells (3). CNF1 catalyzes the deamidation of the glutamine residue at position 63 in RhoA (23, 51), and removal of this amine group changes glutamine into glutamic acid, a conversion that causes the constitutive activation of RhoA in the target cell. This activation is a consequence of both the inhibition of the intrinsic GTP hydrolysis of RhoA and the prevention of GTPase activity stimulation by the Rho-GTPase-activating protein (23, 51). The recent discoveries that CNF1 also deamidates glutamine residues at positions 61 in both Cdc42 and Rac1, but not in Ras (37, 38), have led to the hypothesis that CNF1 may be a general activator of the Rho family of GTPases (38). These CNF1-activatable GTPases function as molecular switches to regulate the spatial organization of the actin cytoskeleton (29, 30, 45, 49, 50).
A number of somewhat disparate biological manifestations of CNF1 have been reported, many, but not all, of which relate to the effects of CNF1 on RhoA. These effects include the following: (i) necrosis of rabbit or guinea pig skin when these animals are inoculated intradermally with E. coli lysates that contain the toxin (10); (ii) enlargement and multinucleation of tissue culture cells (CHO, HeLa, and Vero) after treatment with crude toxin preparations, reflective of endomitosis occurring without concomitant cytokinesis (10); (iii) membrane ruffling and actin stress fiber formation after exposure of cells to CNF1 (21); (iv) induction of phagocytic activity in human epithelial HEp-2 cells incubated with CNF1 (19); (v) impairment of repair in an injured T24 human bladder cell monolayer treated with CNF1 (34), apparently by toxin-mediated inhibition of the migration and proliferation of bladder cells at the wound site on that monolayer; (vi) decreased transmigration of polymorphonuclear leukocytes across a polarized monolayer of T84 human intestinal epithelial cells after the monolayer was incubated with CNF1 (33); and (vii) increased permeability of polarized monolayers of human intestinal Caco-2 cells treated with CNF1 (28).
CNF1 was originally identified in E. coli strains from patients with enteritis (10), but the toxin was not shown to be a major factor in the pathogenesis of diarrhea in a piglet model (24). Furthermore, no link between production of CNF1 by E. coli and gastrointestinal illness in humans was demonstrated in a retrospective epidemiological study in Brazil (A. T. Tavechio, T. A. T. Gomes, C. M. Abe, and L. R. M. Marques, Abstr. 97th Gen. Meet. Am. Soc. Microbiol., abstr. C-172, 1997). Conversely, CNF1 is frequently produced by extraintestinal E. coli strains that cause urinary tract infections (UTIs) such as cystitis, prostatitis, and pyelonephritis (4–6, 11, 41). A particularly striking finding is the association of CNF1 with prostatitis in otherwise healthy men (5, 41). Strains of UPEC that make CNF1 also often produce two established urovirulence determinants, α-hemolysin and P fimbriae. The genes for all three factors are typically linked on the same pathogenicity island within certain UPEC strains (8, 15, 52). In spite of the association of CNF1 with urovirulent E. coli and the provocative findings on the effects of CNF1 on tissue culture cells and in animals, a precise role for this toxin in the pathogenesis of UTIs has not been defined.
To examine the contribution of CNF1 to uropathogenesis, we evaluated the effects of CNF1 intoxication on a panel of cultured human cell lines derived from physiologically relevant sites, namely the bladder, ureters, and kidneys. Here, we report the identification of a uroepithelial cell line with a CNF1 intoxication phenotype that has not been seen in any other cell line to date. CNF1 caused frank cytotoxicity in 5637 human bladder cells. To characterize the cytotoxic phenotype, we compared several features of CNF1 intoxication in 5637 cells and HEp-2 cells which display the classic CNF1-intoxication phenotype, multinucleation. Furthermore, the mechanism of CNF1-induced 5637 cell death was investigated.
MATERIALS AND METHODS
Cell lines and culture conditions.
Cell lines were cultivated as follows. HEp-2 cells (ATCC CCL23) were cultured in Eagle's minimal essential medium (EMEM) with Earle's balanced salt solution (EBSS) supplemented with 10% fetal bovine serum (FBS). Y-1 cells (ATCC CCL 79) were cultured in RPMI 1640 medium supplemented with 10% FBS. 5637 cells (ATCC HTB-9) were cultured in RPMI 1640 medium supplemented with 20% FBS. J82 cells (ATCC HTB-1) were cultured in EMEM with EBSS supplemented with nonessential amino acids (NEAA) and 10% FBS. A498 cells (ATCC HTB 44) were cultured in EMEM with EBSS supplemented with NEAA, 1 mM sodium pyruvate, and 10% FBS. ACHN cells (ATCC CRL-1611) were cultured in EMEM with EBSS supplemented with NEAA and 10% FBS. SV-HUC-1 cells (ATCC CRL 9520) were cultured in Ham's F-12 medium supplemented with 7% FBS. T24 cells (ATCC HTB 4) were cultured in McCoy's 5a modified medium supplemented with 10% FBS. All tissue culture media contained 2 mM l-glutamine, 10 μg of gentamicin per ml, 10 U of penicillin G per ml, and 10 μg of streptomycin per ml. Cell lines were maintained in a humidified atmosphere of 5% CO2 at 37°C.
Preparation of bacterial sonic extracts.
CNF1 was expressed from E. coli M15/pREP4 transformed with pHLK102. Plasmid pHLK102 contains a copy of cnf1 (generated by PCR from the O4:K6 UPEC strain J96) ligated into pBluescript II SK(−) (H. A. Lockman and A. D. O'Brien, Abstr. 97th Gen. Meet. Am. Soc. Microbiol., abstr. B-156, 1997). The histidine-tagged fusion protein (His-CNF1) was expressed from E. coli M15/pREP4 transformed with plasmid pCNF24. Plasmid pCNF24 contains cnf1 cloned into the QIAexpress vector pQE-30 (Qiagen, Inc., Chatsworth, Calif.) (K. C. Meysick, M. Mills, and A. D. O'Brien, Abstr. 97th Gen. Meet. Am. Soc. Microbiol., abstr. B-158, 1997). CNF1, His-CNF1, and the amino-terminal His-tagged dihydrofolate reductase protein control (His-DHFR, expressed in pQE-40) were produced in accordance with Qiagen protocols for growth of small- and large-scale expression cultures. The solubility of His-CNF1 was optimal when cultures were induced with 0.1 or 1 mM isopropyl-β-d-thiogalactopyranoside and then incubated aerobically at room temperature. Aliquots of clarified lysates were frozen at −80°C until use or collected and used immediately as the source of toxin (His-CNF1) for further purification as detailed below.
Metal-affinity chromatography.
Supernatants that contained His-CNF1 first were subjected to metal-affinity chromatography according to the Qiagen protocol for purification of native cytoplasmic proteins with minor alterations. After the His-CNF1 in lysates was permitted to bind to nickel-nitrilotriacetic acid resin, the column was washed with 20 mM imidazole in sonication buffer, and the toxin was eluted with 250 mM imidazole sonication buffer. Samples of the whole-cell lysate, flowthrough, washes, and eluted fractions were analyzed by sodium dodecyl sulfate-polyacrylamide gel electrophoresis (SDS-PAGE). Proteins present in the 250 mM imidazole eluant then were precipitated by 60% ammonium sulfate fractionation at 4°C followed by centrifugation at 12,000 × g for 30 min at 4°C. Precipitated proteins were resuspended in phosphate-buffered saline (PBS) (pH 7.4), dialyzed against the same buffer overnight at 4°C, and then stored at −20°C. Dialyzed samples were analyzed by SDS-PAGE, HEp-2 multinucleation assays, and Western blotting with goat polyclonal CNF1-specific antiserum as a probe.
Anion-exchange chromatography.
Samples of His-CNF1 purified by metal affinity chromatography were dialyzed in 25 mM Tris-HCl (pH 7.5) prior to mixing with DEAE cellulose (DE52; Whatman International, Ltd., Maidstone, England) previously equilibrated in the same buffer. The His-tagged toxin was eluted by a step gradient of NaCl (50 mM, 100 mM, 250 mM, 500 mM in 25 mM Tris-HCl [pH 8.0]). The fractions were analyzed by SDS-PAGE, in HEp-2 multinucleation assays, and by Western blotting as described above.
Gel filtration chromatography.
The 500 mM NaCl fraction from the anion-exchange procedure was applied to a HiPrep 16/60 Sephacryl S100 high resolution gel filtration column, and the fractions were collected. The column flow was controlled with a P1 peristaltic pump according to the manufacturer's instructions (Amersham Pharmacia Biotech, Piscataway, N.J.). The column was equilibrated in 500 mM NaCl–25 mM Tris-HCl (pH 7.8) buffer, and Blue Dextran 2000 was used to determine the column void volume. Fractions were analyzed by SDS-PAGE, HEp-2 multinucleation assays, and 5637 cytotoxicity assays.
Immunoaffinity chromatography.
The gamma globulin fraction and the immunoglobulin G (IgG)-specific fraction in CNF1-specific polyclonal goat antiserum were each used as immunoadsorbents. Antibodies within the gamma globulin fraction of the serum were purified by ammonium sulfate precipitation and anion exchange according to the method of Harlow and Lane (31). Purified antibodies were coupled to cyanogen bromide-activated Sepharose 4B (Amersham Pharmacia Biotech) at a ratio of 10 mg of antibodies to 1 ml of resin, according to the manufacturer's suggested procedure. The final antibody-resin product was dialyzed in TEAN buffer (50 mM Tris-HCl [pH 7.4], 1 mM EDTA, 300 mM NaCl, 0.02% NaN3) and stored at 4°C. Clarified sonicates of E. coli strain M15/pREP4/pCNF24 in TEAN buffer plus 20 μg of phenylmethyl sulfonyl fluoride (PMSF) per ml served as the antigen in small-scale purification experiments with 100 mM glycine (pH 2.8) as an elution buffer. Fractions were analyzed as described above.
The IgG fraction of the polyclonal antiserum was isolated with protein G and then coupled to protein G (10 mg of antibodies to 1 ml of resin) with the Immunopure Protein G IgG Orientation kit (Pierce Chemical Company, Rockford, Ill.) according to the manufacturer's instructions and suggestions. His-CNF1-containing clarified lysates of E. coli strain UT5600/pREP4/pCNF24 in 10 mM Tris-HCl (pH 7.4) supplemented with 1 ml of Complete protease inhibitor cocktail (Boehringer Mannheim division of Roche Molecular Biochemicals, Indianapolis, Ind.) were passed over this immunoadsorbent column. Bound His-CNF1 was eluted from the column with 4.0 M MgCl2–60 mM Tris-HCl (pH 6.97). Fractions were dialyzed in 10 mM Tris-HCl (pH 7.4) and then analyzed as described above. Protein concentrations of biologically active eluant fractions were measured with the bicinchoninic acid protein assay reagent (Pierce Chemical Company), and the specific activity of these samples was determined. The 50% multinucleation dose (MD50) for a given toxin sample was defined as the reciprocal of the dilution at which 50% of the monolayer was multinucleated: specific activity = MD50/amount of protein (milligrams).
Electroelution.
Nickel-purified His-CNF1 was separated on preparative gels that consisted of a 4% polyacrylamide stacking layer and a 7.5% polyacrylamide resolving layer prepared under nondenaturing conditions (53). Proteins on the gels were separated by electrophoresis at 200 V for 40 to 50 min with the Mini-PROTEAN II electrophoresis system (Bio-Rad Laboratories, Hercules, Calif.). The proteins then were electroeluted from the gels with either the model 422 Electro-Eluter or the Mini Whole Gel Eluter (Bio-Rad Laboratories) according to the manufacturer's protocols. Eluted samples from both systems were analyzed by SDS-PAGE and tested for biological activity in HEp-2 multinucleation assays.
Isoelectric focusing.
Metal affinity-purified His-CNF1 was separated on the basis of isoelectric point (pI) values in the Rotofor system (Bio-Rad Laboratories) according to the manufacturer's directions. Approximately 3 mg of His-CNF1 in PBS (pH 7.4) was mixed with 1 ml of Bio-Lyte 4/6 ampholytes and 15 ml of sterile 10% glycerol. The pH value of each fraction was determined, and the fractions were stored at 4°C. The fractions were analyzed by SDS-PAGE, HEp-2 multinucleation assays, and Western blot analysis.
SDS-PAGE.
Proteins were separated on SDS-polyacrylamide gels, fixed with 12% trichloroacetic acid (TCA), and stained with colloidal Coomassie brilliant blue G-250 (Bio-Rad Laboratories) (44) overnight. Prestained high- and low-range protein standards were obtained from Bio-Rad Laboratories.
Preparation of CNF1-specific polyclonal goat antiserum.
His-CNF1 was expressed in E. coli strain M15/pREP-4 transformed with pCNF19. Plasmid pCNF19 is analogous to pCNF24, but lacks sequences that code for an enterokinase cleavage site between the His tag and CNF1. Large-scale cultures were prepared and sonicated prior to metal affinity chromatography as described previously. Full-length His-CNF1 was separated from other protein species in the metal affinity-purified samples on preparative SDS-polyacrylamide gels under denaturing conditions. Gels were treated with a copper stain and destain kit (Bio-Rad Laboratories) to permit visualization and removal of the portion containing full-length toxin. His-CNF1 was eluted from the gel slices with the model 422 Electro-Eluter under denaturing conditions and electrodialyzed according to the manufacturer's protocols. Next, the protein samples were concentrated with a Centricon-100 concentrator (Amicon, Inc., Beverly, Mass.), and residual SDS was removed by treatment with Extracti-Gel detergent-removing resin (Pierce Chemical Company) per the manufacturers' instructions. The final sample consisted of pure, full-length, inactive toxin, as assessed by SDS-PAGE analysis and HEp-2 multinucleation assays.
The toxin was sent to Duncroft, Inc., Lovettsville, Va., for preparation of antiserum in a goat. A prebleed was collected, and then the goat was injected intramuscularly on four separate occasions with 350 μg of His-CNF1 emulsified with complete Freund's adjuvant. The three booster doses were delivered at 28, 42, and 56 days after the primary immunization. Preimmune and CNF1-specific antisera were tested by Western analysis and assessed for the ability to neutralize multinucleation of HEp-2 cells.
Western blot analysis.
After separation of proteins by SDS-PAGE or PAGE (nondenaturing conditions), proteins were electrophoretically transferred (15 V for 20 min) onto nitrocellulose membranes (Optitran; Schleicher & Schuell, Keene, N.H.) with a Trans-Blot SD semidry electrophoretic transfer cell (Bio-Rad Laboratories) per the manufacturer's instructions. Efficiency of transfer was determined visually by staining the transferred proteins on the membrane with Ponceau S (Sigma-Aldrich Co., St. Louis, Mo.) (31). The membranes were blocked overnight at 4°C in BLOTTO; primary and horseradish peroxidase (HRP)-conjugated secondary antibodies were diluted in BLOTTO. Chemiluminescence was used for detection with the ECL enhanced chemiluminescence system (Amersham Pharmacia Biotech Inc., Piscataway, N.J.).
CNF1 intoxication assays.
Multinucleation assays (all cell lines) and cytotoxicity assays (5637 cell line only) were done according to the following protocol. Ninety-six-well microtiter tissue culture plates were seeded with 4 × 10³ to 8 × 10³ cells/well and incubated at 37°C in 5% CO2 for 4 to 5 h. One hundred microliters of twofold serial dilutions in tissue culture medium of purified His-CNF1 or the His-CNF1-, His-DHFR-, or CNF1-containing extracts was added to wells (1:2 dilution), and the plates were incubated as described above for an additional 72 h. Cells in the wells were fixed and stained with Leukostat (Fisher Scientific, Pittsburgh, Pa.). Stained cells were assessed for multinucleation by microscopy or for cytotoxicity (loss of cells) by measuring the A600 with an ELx800 automated microplate reader. Photomicrographs of cells were taken with 35-mm film with the 20× and 40× objective on a Nikon Diaphot inverted microscope that was fitted with a Nikon FE camera. The 50% cytotoxic dose (CD50) for a given toxin sample was defined as the reciprocal of the dilution at which 50% of the monolayer was destroyed: specific activity = CD50 or MD50/amount of protein (milligrams).
Neutralization assays.
Twofold serial dilutions (1:2 to 1:1,024) of either preimmune or CNF1-specific polyclonal goat antiserum mixed with 4 or 40 CD50s of His-CNF1 (from a bacterial extract containing His-CNF1) were incubated for 2 h at 37°C in 5% CO2 and then at 4°C overnight. On the following morning, microtiter plate wells were seeded with 100 μl of 8 × 10⁴ 5637 cells/ml and incubated at 37°C in 5% CO2 for 4 to 5 h. Next, 100 μl of each toxin-antiserum mixture was added to the appropriate wells, and then the plates were incubated for 72 h in 5% CO2. Cells were fixed, stained, and assessed for cytotoxicity as described above. Neutralization of cytotoxic activity was calculated by comparing the A600 of toxin alone versus that of toxin plus antibody according to the formula
 |
Binding of CNF1 to HEp-2 or 5637 cells as assessed by immunofluorescence.
Eight-well Permanox chamber slides were seeded with 1 × 10⁴ to 2 × 10⁴ HEp-2 or 5637 cells per well and incubated overnight at 37°C in 5% CO2. Purified His-CNF1 was diluted into cold binding solution (minus maltose) (25) to concentrations of 9.33, 18.67, 37.33, or 74.67 μg/ml. Toxin dilutions were added in 300-μl volumes (therefore, 2.8, 5.6, 11.2, or 22.4 μg of toxin per well) to chamber slides that previously had been chilled to 4°C and washed twice with cold Hank's balanced salt solution. Control wells received cold binding solution alone. The cells were incubated in the presence or absence of the fusion protein for 1 h at 4°C and then washed four or five times with cold PBS at pH 7.4. Next, His-CNF1 monospecific polyclonal goat antiserum at a 1:100 dilution in protein binding buffer was incubated with the cells for 1 h at 4°C. The chamberslide wells were washed with PBS as before, and then the secondary antibody, fluorescein isothiocyanate (FITC)-conjugated rabbit anti-goat IgG (Sigma-Aldrich-Co.), was added to the wells at a dilution of 1:300 in protein binding buffer, and the mixture was incubated for 1 h at 4°C. Chamber slide wells were washed with cold PBS again as described above. The cells were fixed with ice-cold 95% ethanol–5% glacial acetic acid for 20 min at −20°C. The wells were rinsed twice with distilled, deionized water (ddH2O) and treated with SlowFade reagents (Molecular Probes, Inc., Eugene, Oreg.). Binding of His-CNF1 to cells was observed microscopically by immunofluorescence, and cells were photographed with the 40× objective on an Olympus microscope model BX60 fitted with the Olympus photomicrographic system model PM-30.
Quantitative analysis of His-CNF1 binding to HEp-2 and 5637 cells.
Microtiter plates were seeded with 2 × 10⁴ cells per well and incubated at 37°C with 5% CO2 overnight. Plates were chilled to 4°C before adding 100 μl of twofold serial dilutions (40 μg to 610 pg) of nickel-purified His-CNF1 in cold protein binding buffer to the wells. Primary antibody consisted of a pool of four anti-CNF1 monoclonal antibodies (K. C. Meysick, unpublished data), each at a concentration of 11 μg/ml in protein binding buffer. The pool was diluted 1:20 prior to use. Goat anti-mouse IgG (H+L)-HRP conjugate (Bio-Rad Laboratories) was used as a secondary antibody at dilutions of 1:50 and 1:200. All incubations were at 4°C for 1 h, and cells were washed three times with cold PBS between each step. Tetramethylbenzidine (Boehringer Mannheim division of Roche Molecular Biochemicals) served as a substrate for the secondary HRP-conjugated antibody, according to the method of Harlow and Lane (31), to allow the detection of CNF1 bound to cells. The A450 was measured with a microplate reader, and the observed values were used to compare the amounts of toxin bound to the two cell types.
Rho modification assays. (i) In vitro assays.
Mammalian cell extracts were prepared according to the method of Chen et al. with minor modifications (12). Confluent monolayers of HEp-2 or 5637 cells in T75 flasks were washed with 1× Versene (Gibco BRL, Grand Island, N.Y.) and then incubated at 37°C in 5% CO2 in 0.05% (HEp-2 cells) or 0.25% (5637 cells) trypsin (Biowhittaker, Inc., Walkersville, Md.) in EDTA to release cells from the culture surface. The detached cells in the trypsin solution were harvested by centrifugation at 210 × g for 3 to 5 min at room temperature and then washed three times with cold PBS at pH 7.3. The washed cells were resuspended to a final concentration of 6 × 10⁶ to 8 × 10⁶ cells/ml in lysis buffer (50 mM Tris-HCl [pH 7.5], 50 mM NaCl, 5 mM MgCl2, 1 mM dithiothreitol, 1 mM PMSF) and disrupted by sonication (8 to 10 bursts of 5 s each with 30-s cooling periods between bursts). The HEp-2 or 5637 extracts were clarified by centrifugation at 10,786 × g for 10 min at 4°C and stored at −20 or −80°C until use. Mammalian cell extracts (80 μl) were mixed with bacterial cell extracts (25 μl of His-CNF1 lysate, 50 μg of total protein) plus 95 μl of lysis buffer and incubated for 3 h in a 37°C water bath. Untreated controls consisted of mammalian cell extracts (80 μl) plus 120 μl of lysis buffer treated as described above.
(ii) In vivo assays.
Nearly confluent 5637 monolayers in T75 flasks were treated with fresh medium either alone (cell control) or supplemented with various dilutions of His-CNF1-containing bacterial sonic extracts. After 24 h of incubation at 37°C in 5% CO2, monolayers were washed three times with cold PBS at pH 7.3 and harvested with a sterile rubber policeman in the presence of 2.0 ml of cold PBS. Cells were collected by centrifugation at 210 × g for 5 min at room temperature, resuspended in 0.5 to 1.0 ml of cold lysis buffer, and then disrupted by sonication as described above. Cell extracts were centrifuged at 16,000 × g at 4°C for 10 min, and the clarified supernatants were stored at −20°C.
Aliquots of cell extracts from in vivo and in vitro assays were treated with 10% TCA overnight at 4°C to precipitate proteins in the reaction mixtures. The proteins were collected by centrifugation at 16,000 × g at 4°C, washed once with cold acetone, allowed to dry briefly, and resuspended in PBS. Samples were separated on SDS–12% polyacrylamide gels and then analyzed by Western blotting with mouse monoclonal IgG1 specific for RhoA (Santa Cruz Biotechnology, Inc., Santa Cruz, Calif.) as the primary antibody (diluted 1:2,000). An HRP-conjugated goat anti-mouse IgG (Bio-Rad Laboratories) diluted 1:2,000 served as the secondary antibody.
Actin stress fiber assays.
Eight-well chamber slides were seeded with 1 × 10⁴ to 3 × 10⁴ cells per well, depending on the cell line, and incubated at 37°C in 5% CO2 overnight. Twofold serial dilutions of a freshly thawed sample of ∼1-mg/ml nickel-purified His-CNF1 were prepared in medium for each cell line (1:20 to 1:5,120) and added to wells. Control wells received fresh medium only. Chamber slides were incubated for an additional 3, 6, 17, 27, 42, 48, or 72 h. At the indicated time points, the cells were fixed in 3.7% formaldehyde in PBS at pH 7.4 for 20 min at room temperature or up to 2 weeks at 4°C. Next, the cells were washed three times with PBS, permeabilized with 0.1% Triton X-100 in PBS at room temperature for 4 min, and then washed again with PBS four times. Cellular F-actin was stained by adding 200 μl of 0.5-μg/ml FITC-phalloidin conjugate or phalloidin-tetramethylrhodamine B isothiocyanate (TRITC) conjugate (Fluka Chemical Corp., Milwaukee, Wis.) to each well and then incubating the slides for 45 to 60 min in the dark at room temperature. Chamber slides were rinsed twice with ddH2O and then treated with SlowFade reagents according to the manufacturer's directions. Actin structures were visualized microscopically, and the slides were photographed with the 40× or 100× objective on the Olympus microscope model BX60 fitted with the Olympus photomicrographic system model PM-30.
LPA assays.
Lysophosphatidic acid (LPA) assays were based on the work of Ridley and Hall (49) with minor modifications. Eight-well chamber slides were seeded half with 5 × 10³ HEp-2 cells (four wells) and half with 1 × 10⁴ 5637 cells (four wells). After an overnight incubation at 37°C in 5% CO2, the cells were slowly weaned from serum with stepwise decreases in the concentration of FBS over a period of 4 days. One pair of wells on each slide was maintained in 10% FBS medium as a control. On the day of the assay, serum-starved cells were treated with medium containing 10 μM LPA (Sigma-Aldrich), 30 μM LPA, or 10% FBS and incubated for 10 to 30 min at 37°C in 5% CO2. LPA was prepared as a 1 mM stock in PBS (pH 7.2) and stored frozen at −80°C. One pair of serum-starved wells on each slide was left untreated to serve as another control. Cells were fixed with 3% formaldehyde, washed with PBS, permeabilized with 0.1% Triton X-100, and stained with 100 μl of 5-μg/ml FITC-phalloidin per well for 45 to 60 min at room temperature in the dark. Chamber slides were rinsed and treated with SlowFade, and actin stress fibers were visualized microscopically as described above.
Apoptosis assays. (i) TUNEL reactions.
Chamber slide wells were seeded with 2 × 10⁴ cells per well of 5637 cells and incubated at 37°C in 5% CO2 overnight. Next, 10-fold serial dilutions (1:40 to 1:400,000) of a sonic extract that contained His-CNF1 were prepared in tissue culture medium and added to the wells. This sonic extract was found to produce 50% cytotoxicity at a dilution of 1:40,960. Control wells received fresh medium only. The slides then were incubated at 37°C in 5% CO2 for an additional 24, 42, 48, 72, or 96 h. At the indicated time points, apoptotic cells were detected with the In Situ cell death detection kit, fluorescein (Boehringer Mannheim division of Roche Molecular Biochemicals) according to the manufacturer's protocol for adherent cells. DNase I (Sigma-Aldrich) at a final concentration of 100 or 500 μg/ml was used as a positive control for DNA strand breaks per the manufacturer's suggestion. Negative controls consisted of unintoxicated cells treated with the labeling solution alone or the TUNEL (terminal deoxynucleotidy ltransferase [TdT]-mediated dUTP nick end labeling) reaction mixture that contained both the nucleotide labeling solution and the TdT enzyme.
(ii) Electrophoretic analysis of fragmented DNA.
T185 tissue culture flasks were seeded with 3 × 10⁶ 5637 cells and incubated at 37°C in 5% CO2 overnight. Next, the cells received fresh medium alone or medium supplemented with a His-CNF1 extract that contained 10 or 100 CD50s or with 100 nM staurosporine (Sigma-Aldrich). Then the flasks were incubated for an additional 24, 42, 48, or 72 h at 37°C in 5% CO2. Staurosporine treatment served as a positive control for DNA fragmentation, because this compound has been shown previously to induce apoptosis in 5637 cells (39). Detached cells were collected from the culture medium in each flask by centrifugation at 210 × g for 5 min at room temperature, while adherent cells were released from the culture surface by trypsinization and then collected by centrifugation as described above. The detached and released cells were washed once with 1× versene. Fragmented DNA was isolated essentially according to the method of Fernandez et al. (20) as modified by McConkey et al. (39). DNA samples (5 μl) and molecular weight markers (PCR Markers, Novagen, Inc., Madison, Wis.) were electrophoresed on 2.0% agarose gels, visualized with ethidium bromide, and photographed.
RESULTS
Purification of His-CNF1 produces a homogeneous mixture of full-length toxin and degradation derivatives.
A His-tagged CNF1 fusion protein was generated (Meysick et al., Abstr. 97th Gen. Meet. Am. Soc. Microbiol.) to facilitate rapid protein purification by metal-affinity chromatography. Isolation of His-tagged CNF1 under nondenaturing conditions yielded active toxin as assessed by HEp-2 multinucleation assays (Fig. 1A and B). However, SDS-PAGE analysis of the His-CNF1 sample showed the presence of numerous lower-molecular-mass proteins that could represent degradation products of the full-length toxin or unrelated proteins that had bound nonspecifically to the column (Fig. 2A, lane 1). Therefore, we tried a series of additional purification steps to separate full-length toxin from the putative contaminating protein species. We also varied a number of purification conditions (i.e., E. coli host strain, temperature and length of time for induction of protein expression, presence of various protease inhibitors, or method of cell lysis). Purification strategies included ion-exchange chromatography (Fig. 2A, lanes 4, 5, and 6), gel filtration chromatography (data not shown), immunoaffinity chromatography (Fig. 2B, lanes 1 and 2), electroelution of His-CNF1 from nondenaturing gels (Fig. 2C, lane 1), and isoelectric focusing (Fig. 2C, lane 2). None of the procedures significantly enhanced toxin purity. However, Western blot analyses of metal-affinity and anion-exchange chromatography samples indicated that the recurring protein profile primarily reflected a homogeneous mixture of full-length His-CNF1 and toxin degradation products. Indeed, antibodies specific to CNF1 recognized most of the proteins present (Fig. 2A, lanes 2 and 5), while antibodies directed against the histidine tag recognized a smaller proportion of the protein species (Fig. 2A, lanes 3 and 6). Because no single or multiple purification strategy was able to produce homogeneous full-length CNF1, we elected to use His-CNF1 eluted from the single-step metal-affinity column as our standard preparation for all studies with purified toxin.
FIG. 1.

His-CNF1-intoxicated HEp-2 and 5637 cells exhibit multinucleation. HEp-2 cells (4 × 10³/well) or 5637 cells (8 × 10³/well) in 96-well microtiter plates were incubated at 37°C in 5% CO2 for 72 h in the presence of medium alone or medium plus His-CNF1-containing sonic extracts (M15/pREP4/pCNF24). Cells were fixed and stained with Leukostat prior to microscopy. No more than 1% of the total protein in the sonic extracts appeared to be His-CNF1 by examination of Coomassie blue-stained SDS-PAGE gels. (A) Untreated, HEp-2 cells. (B) HEp-2 cells incubated with a His-CNF1-containing sonic extract at a dilution of 1:640. (C) Untreated 5637 cells. (D) 5637 cells incubated with a His-CNF1-containing sonic extract at a dilution of 1:20,480. Cells were photographed with the 20× objective on a Nikon Diaphot inverted microscope that was fitted with a Nikon FE camera.
FIG. 2.

Purification of the His-CNF1 fusion protein. Sonic extracts were prepared from cultures of E. coli strain M15/pREP4/pCNF24 and then subjected to metal-affinity chromatography under nondenaturing conditions as an initial purification step. Proteins obtained from the various purification methods were separated by SDS-PAGE, and immunoblots were prepared. The details are outlined in Materials and Methods. Arrows indicate the position of full-length His-CNF1. (A) SDS-PAGE and Western analysis of purification products from metal affinity and anion-exchange chromatography. Western analyses were performed with CNF1-monospecific goat polyclonal antiserum (1:10,000) or a His-specific mouse monoclonal antibody (1:5,000) as a probe. Lanes: 1, SDS-PAGE profile of proteins purified by metal affinity chromatography (stained with Coomassie blue); 2, proteins purified by metal-affinity chromatography and probed with CNF1-specific antiserum; 3, proteins purified by metal-affinity chromatography and probed with His-specific monoclonal antibody; 4, SDS-PAGE profile of proteins after subsequent anion-exchange chromatography (stained with Coomassie blue); 5, proteins purified by anion-exchange chromatrography and probed with CNF1-specific antiserum; 6, proteins purified by anion-exchange chromatography and probed with His-specific monoclonal antibody. (B) SDS-PAGE and Western analysis of immunoaffinity purification products. Lanes 1, SDS-PAGE profile of Coomassie blue-stained proteins eluted with MgCl2 from an immunoaffinity column prepared with His-CNF1-specific polyclonal goat antiserum (toxin was inactivated by glycine elution); 2, immunoaffinity-purified proteins probed with CNF1-specific antiserum (1:10,000). (C) Western analysis of His-CNF1 purified by electroelution or isoelectric focusing. Lanes: 1, proteins electroeluted under nondenaturing conditions probed with CNF1-specific antiserum (1:10,000); 2, proteins purified by isoelectric focusing probed with CNF1-specific antiserum (1:5,000). Electroelution of His-CNF1 produced quantities of active toxin detectable only by Western blot analysis.
The 5637 human bladder cell line displays an uncommon CNF1 phenotype.
The cell lines previously used to investigate the outcome of intoxication by CNF1 (e.g., membrane ruffling, actin stress fiber formation, and multinucleation) included CHO (Chinese hamster ovary epithelium), Vero (African green monkey kidney fibroblasts), HeLa (human cervical epithelium), HEp-2 (human laryngeal epithelium), and NIH 3T3 cells (mouse fibroblast) (9, 10, 21, 23, 51). To determine if epithelial cells from sites that were physiologically relevant for UPEC infections would react to CNF1 in the same manner as cells from other anatomical sites, we undertook an examination of the effects of CNF1 on cell lines derived from the human urinary tract. HEp-2 cells were used as the positive control, since they display the typical phenotype and are highly sensitive to CNF1 intoxication (14, 21), and the mouse adrenal Y-1 cell line was included because it had been previously reported to be insensitive to CNF intoxication (7). Giant, multinucleated cells were evident in each cell line within 72 h after exposure to bacterial extracts that contained the His-CNF1 fusion protein (Table 1). That the Y-1 adrenal cell line responded to CNF1 in our hands may be due to differences in assay conditions. We exposed subconfluent cell monolayers to His-CNF1 for 72 h, as opposed to the procedure used by Blanco et al. (7), who incubated confluent monolayers in the presence of toxin for 48 h.
TABLE 1.
Sensitivity of various cell lines to His-CNF1
| Cell line | Tissue origin | Phenotype after exposure to His-CNF1
|
|
|---|---|---|---|
| Multinucleation | Cell death | ||
| HEp-2 | Human larynx | + | − |
| 5637 | Human bladder | + | + |
| J82 | Human bladder | + | − |
| T24 | Human bladder | + | − |
| SV-HUC-1 | Human ureter | + | − |
| A-498 | Human kidney | + | − |
| ACHN | Human kidney | + | − |
| Y-1 | Mouse adrenal cortex | + | − |
An unusual reaction was seen in the 5637 human bladder cell line. These cells detached upon exposure to His-CNF1 (Fig. 3A, row C), a finding which suggested frank cytotoxicity. Trypan blue staining of 5637 cells that had detached from the growth surface following toxin treatment showed that these cells were no longer viable (data not shown), a result that supports the presumption that CNF1 kills the cells rather than impairs their capacity to adhere. Cytotoxicity was dose dependent, and surviving cells in wells treated with picogram quantities of total protein were multinucleated (Fig. 1C and D). The latter observation indicates a link between cytotoxicity and multinucleation. Extracts prepared from the same E. coli host strain transformed with an expression vector that produced a His-tagged mouse DHFR protein did not cause 5637 cells to detach (Fig. 3A, row A) or multinucleate (data not shown). Thus, the cytotoxic and multinucleating effects seen in the extracts that contained His-CNF1 were not due to overexpression of any unrelated protein or other unknown factors in the host strain background.
FIG. 3.

CNF1 induces 5637 cell cytotoxicity. (A) CNF1-intoxicated 5637 cells. 5637 cells (8 × 10³/well) were seeded into microtiter plates and incubated at 37°C in 5% CO2 for 72 h in the presence of medium alone or medium plus serially diluted toxin preparations. Fixed and stained monolayers were assessed for cytotoxicity with an automated microplate reader. Twofold serial dilutions of toxins are shown in each row and range from 1:20 (column 1) to 1:10,240 (column 10). Row A contains cells treated with a His-DHFR-containing sonic extract (M15/pREP4/pQE-40). Row B contains untreated, control cells. Row C contains cells treated with His-CNF1-containing sonic extracts (M15/pREP4/pCNF24). Row D contains cells treated with CNF1-containing sonic extracts (M15/pREP4/pHLK102). Row E contains cells treated with metal affinity-purified His-CNF1 fusion protein. (B) 5637 cell toxin neutralization assays. Twofold serial dilutions of preimmune or His-CNF1-specific antiserum were incubated with 40 CD50s of toxin for 2 h at 37°C and then at 4°C overnight. On the following day, these mixtures were added to microtiter plates seeded with 5637 cells and incubated for 72 h at 37°C in 5% CO2. Fixed and stained monolayers were examined for percent neutralization of cytotoxicity by using a microtiter plate reader. Twofold serial dilutions of antiserum were added sequentially to columns 1 to 6 (1:2 to 1:64). Row A contains cells treated with toxin plus preimmune serum. Rows B, C, and D are replicates and contain cells treated with toxin plus His-CNF1-specific antiserum. Row E contains cells plus preimmune serum (wells E1, E2, and E3) or postimmune serum (wells E4, E5, and E6). Panels A and B are representative of at least six independent experiments.
The CD50s and specific activities were determined for various toxin preparations. As expected, the log10 geometric means of the specific activities for bacterial lysates correlated with toxin expression levels (7.80 ± 0.61 for M15/pREP4/pCNF24 and 7.46 ± 0.45 for M15/pREP4/pHLK102; n = 6). Purification of His-CNF1 by metal affinity chromatography resulted in a substantially lower specific activity (5.46 ± 0.73; n = 6). This result was contrary to initial expectations that the specific activity should increase during purification of a protein. However, we found that His-CNF1 degraded as the concentration of pure toxin increased, and the specific activity of the preparation fell concomitantly.
The cytotoxic phenotype observed in intoxicated 5637 cells is due specifically to CNF1.
The data presented above suggested that CNF1 was responsible for the detachment of 5637 cells. Next, we determined whether polyclonal CNF1-specific antiserum could neutralize the toxin-associated cytotoxicity in tissue culture assays. When 5637 cells were treated with 4 CD50s of a toxin extract, a 1:128 dilution of CNF1-specific serum provided 50% neutralization and a 1:32 dilution neutralized 97% of toxin activity (data not shown). In assays that used 40 CD50s, a 1:16 dilution of antiserum afforded 50% neutralization (Fig. 3B, wells B4, C4, and D4), while the 1:2 dilution neutralized 82% of the toxicity (Fig. 3B, wells B1, C1, and D1). In contrast, preimmune serum provided only minimal levels of protection (9% neutralization; see Fig. 3B, well A4). Protection of 5637 cells by CNF1-specific antibodies confirmed that CNF1 was the sole factor responsible for cytotoxicity.
5637 and HEp-2 cells appear to have equivalent numbers of CNF1-specific binding sites on their surfaces.
Although CNF1 caused multinucleation in all of the cell lines that we tested, only the 5637 cell line responded by detaching from the growth surface. One possible explanation for this CNF1-mediated cytotoxic effect was that 5637 cells had more surface receptors for CNF1 than the HEp-2 cells, which only undergo multinucleation after treatment with CNF1. Since the CNF1-specific eukaryotic receptor is unknown, we compared receptor density indirectly by examining the amount of His-CNF1 bound to HEp-2 and 5637 cells. Binding assays were done at 4°C to avoid possible receptor recycling. Experiments comparing toxin binding by indirect immunofluorescence showed similar levels of His-CNF1 bound to the two cell lines in a dose-dependent fashion (data not shown). Bound toxin appeared to be scattered uniformly over the surface of both cell types, and signal intensity increased as more protein was added. Importantly, the intensities of the fluorescent signals were comparable in HEp-2 and 5637 cells for any given amount of toxin in this qualitative assay.
Another procedure was designed to enable quantitation of toxin binding. A pool of CNF1-specific monoclonal antibodies was used as the primary antibody to detect toxin that had bound to HEp-2 and 5637 cells. The secondary antibody was conjugated to horseradish peroxidase, and enzymatic activity was detected by color development upon addition of a chromogenic substrate. Preliminary cell seeding experiments were done to establish the cell density that would produce equal cell numbers at the time the toxin was administered to control for disparate doubling times between the two cell lines. The results of a representative experiment are shown in Fig. 4. The findings indicate that HEp-2 cells and 5637 cells bound comparable amounts of toxin in a dose-dependent manner. We concluded from both the qualitative and quantitative binding assays that HEp-2 cells and 5637 cells have similar numbers of CNF1 surface receptors.
FIG. 4.

Comparison of His-CNF1 binding to HEp-2 and 5637 cells. Cells were incubated with serial dilutions of purified His-CNF1 at 4°C for 1 h, and then bound toxin was detected enzymatically as described. HRP activity is expressed as the A450. The data shown here are the result of a single representative experiment with the secondary HRP-conjugated antibody at a 1:200 dilution.
RhoA is present in 5637 cells and can be modified by CNF1.
Another explanation for the heightened sensitivity of 5637 cells to CNF1 was that the target protein, RhoA, was altered in this cell line. Western analysis of cell extracts prepared from similar numbers of HEp-2 and 5637 cells showed that RhoA was present in the bladder cell line at levels comparable to those seen in HEp-2 cells (Fig. 5A, lanes 1 and 2). Next, in vitro and in vivo RhoA modification assays were performed to determine if the 5637 RhoA could be deamidated by CNF1. For in vitro assays, sonicated extracts of 5637 cells were incubated in the presence or absence of CNF1-containing bacterial lysates prior to SDS-PAGE and immunoblotting. Western analysis with anti-RhoA antibody as a probe showed that, when treated with CNF1, RhoA from 5637 cells migrated at a slightly higher molecular mass than untreated RhoA (Fig. 5B, lane 2). This shift has been shown to correlate with CNF1-induced deamidation of RhoA in Vero, Swiss 3T3, and NIH 3T3 cells (23, 47, 51). Next, we investigated whether 5637 RhoA could be modified by CNF1 in vivo. In these experiments, monolayers were treated with a dilution of toxin that would kill half of the 5637 cells but still provide enough surviving intoxicated cells to assay. The deamidated form of RhoA was observed in 5637 monolayers within 24 h of exposure to CNF1 (Fig. 5C, lane 2). Therefore, the cytotoxic effect of CNF1 on 5637 cells does not seem to be associated with the 5637 RhoA cellular target, because this protein appears to be modifiable and present in amounts similar to that of HEp-2 cells.
FIG. 5.

Western analysis of RhoA in 5637 cells. Immunoblots were prepared from SDS-PAGE gels and probed with a RhoA-specific mouse monoclonal antibody (1:2,000) and secondary antibody (1:2,000) and then detected by the ECL system. Arrows with asterisks indicate CNF1-modified RhoA. (A) Comparison of the amounts of RhoA present in HEp-2 and 5637 cell extracts. Sonic extracts were prepared from similar numbers of 5637 and HEp-2 cells and electrophoresed: lane 1, HEp-2 cell extract; lane 2, 5637 cell extract. (B) In vitro modification of 5637 RhoA by His-CNF1. Sonic extracts of 5637 cells were incubated with or without His-CNF1-containing bacterial lysate: lane 1, untreated 5637 cell extract; lane 2, 5637 cell extract incubated with His-CNF1. (C) In vivo modification of 5637 RhoA by His-CNF1. 5637 monolayers received fresh medium alone or medium supplemented with 15 CD50s of a toxin extract and then incubated for 24 h at 37°C in 5% CO2: lane 1, untreated 5637 cells; lane 2, 5637 cells incubated with His-CNF1.
CNF1-modified RhoA does not induce actin stress fiber formation in human bladder cells.
The appearance of actin stress fiber arrays is one of the hallmark manifestations of CNF1-intoxicated cells. This response has been observed within 6 to 48 h of CNF1 treatment of various cell lines, including HEp-2, Vero, and NIH 3T3 cells (21, 23, 51). We compared the induction of actin stress fiber formation in toxin-treated HEp-2 and 5637 cells and then extended the investigation to several other human bladder cell lines. A concentration of metal affinity-purified His-CNF1 sufficient to multinucleate HEp-2 cells, but unable to kill 5637 cells, was used in initial studies in which cells were incubated in the presence or absence of toxin for 6 or 17 h. Prominent actin stress fiber formation was observed only in HEp-2 cells; the 5637 cells did not display this phenotype (Fig. 6B and E). In subsequent assays, cells were exposed to higher toxin concentrations for various periods of time. At all time points assayed and at all toxin concentrations used, CNF1 elicited prominent actin stress fiber formation in HEp-2 cells (Fig. 6C, for example). In striking contrast, actin stress fibers did not form in 5637 cells treated with even the highest concentration of His-CNF1 for the longest period of exposure. Similarly, actin stress fibers were inapparent in CNF1-intoxicated J82, T24, and SV-HUC-1 human bladder cells regardless of the toxin concentration or duration of incubation (data not shown). Both HEp-2 and J82 cells had discernible actin stress fibers under normal culture conditions, but an increase in stress fiber formation occurred only in the CNF1-intoxicated HEp-2 cells.
FIG. 6.

His-CNF1 does not induce actin stress fiber formation in 5637 cells. Cells were incubated with purified His-CNF1 for 2 to 72 h at 37°C in 5% CO2 and then fixed and stained with FITC-phalloidin or rhodamine-phalloidin to visualize the F-actin. (A) Untreated HEp-2 control cells. (B) HEp-2 cells incubated with 60 ng of purified His-CNF1 per well for 17 h. (C) HEp-2 cells incubated with 7.5 μg of purified His-CNF1 for 42 h. (D) Untreated 5637 control cells. (E) 5637 cells incubated with 60 ng of purified His-CNF1 for 17 h. (F) 5637 cells incubated with 7.5 μg of purified His-CNF1 for 42 h. Note the presence of pronounced filipodia (arrows) and lamellipodia (arrowheads) in 5637 cells incubated with increased amounts of toxin. Micrographs were taken with the 40× objective.
Dramatic filipodia and lamellipodia were observed in 5637 cells (Fig. 6E and F) and SV-HUC-1 cells (data not shown) exposed to high concentrations of CNF1 for 42 h, a finding that suggests the activation of Cdc42 and Rac (30, 45, 50). Identically treated HEp-2 cells developed less pronounced filipodia and lamellipodia (Fig. 6C). T24 cells, which harbor the ras oncogene (H-ras), exhibited filipodia and extensive lamellipodia under normal culture conditions (data not shown). No increase in these protrusions was noted after CNF1 treatment (data not shown).
Since CNF1 did not elicit actin stress fibers in human bladder cells, we questioned whether other factors known to stimulate the formation of actin stress fibers could evoke these fibers in 5637 cells. Therefore, HEp-2 cells and 5637 cells were serum starved and then treated with FBS or LPA. The latter is a component in serum responsible for actin stress fiber formation in serum-starved cells (49). Serum-starved 5637 cells exhibited arrays of actin stress fibers similar to those seen in HEp-2 cells grown in the presence of serum (Fig. 7A and E). Although 5637 cells maintained in serum appeared healthier than serum-starved HEp-2 cells, levels of actin fibers appeared comparable for the two cell types under these disparate conditions (Fig. 7B and D). However, the addition of LPA (data not shown) or serum to serum-starved 5637 cells or serum-starved HEp-2 cells caused analogous cytoskeletal rearrangement (Fig. 7C and F). This result indicates that the lack of stress fiber formation in CNF1-intoxicated 5637 cells is not due to an inherent inability to form actin stress fibers, since other stimuli can induce actin arrays in this cell line.
FIG. 7.

Addition of serum to serum-starved 5637 cells causes actin cytoskeletal rearrangement. Tissue culture cells in chamber slides were slowly serum starved over a period of several days and then incubated in medium containing 10% serum for 10 to 30 min at 37°C in 5% CO2. The cells were fixed and then stained with FITC-phalloidin to visualize the F-actin. (A) HEp-2 cells maintained in standard medium. (B) Serum-starved HEp-2 cells. (C) Serum-starved HEp-2 cells plus 10% FBS. (D) 5637 cells maintained in standard medium. (E) Serum-starved 5637 cells. (F) Serum-starved 5637 cells plus 10% FBS. Micrographs were taken with the 40× objective.
Apoptosis observed in CNF1-intoxicated 5637 cells.
The mechanism whereby CNF1 destroyed 5637 cells remained to be determined. We suspected that death of His-CNF1-treated 5637 cells was due to apoptosis, because fixed and stained 5637 monolayers treated with dilutions of toxin that allowed some cell survival frequently contained cells with gross morphological changes, such as cytoplasmic blebbing and nuclear disintegration, which are characteristic of apoptotic cells (Fig. 8C). We first used the TUNEL reaction to test this hypothesis (27). DNase I-treated 5637 cells served as a positive control for the TUNEL reaction (Fig. 8B). Positive TUNEL reactions were observed in 5637 cells that had been intoxicated for 24 to 72 h, with apoptosis most noticeable 42 h postintoxication (Fig. 8D). The fields presented in Fig. 8C and D were chosen specifically to demonstrate the striking apoptotic cellular morphologies. TUNEL reactions were similar in both toxin-treated cells and DNase I-treated control cells with disintegrating or intact nuclei fluorescing at differing intensities depending on the progression of DNA strand cleavage. The majority of cells in a given monolayer harbored fluorescent nuclei if treated with high levels of DNase I (500 μg/ml) or CNF1 (1:40, 24 to 42 h). Indeed, the number of cells that showed a positive TUNEL response was proportional to the toxin concentration, an observation that supports the dose-dependent induction of apoptosis by CNF1. Endonucleolysis was not prominent in unintoxicated cell controls (Fig. 8F).
FIG. 8.

His-CNF1-induced apoptosis in 5637 cells. 5637 cells were incubated in the absence or presence of His-CNF1-containing sonic extracts for 24 to 72 h at 37°C with 5% CO2. TUNEL reactions to detect fragmented nuclear DNA then were performed. Panels A, C, and E show phase-contrast images, while panels B, D, and F show the corresponding fields with fluorescence microscopy. (A and B) 5637 cells treated for 10 min with DNase I (500 μg/ml), the positive control for the TUNEL reaction. (C and D) 5637 cells incubated for 42 h with a 1:400 toxin dilution. (E and F) One of the negative controls, untreated 5637 cells exposed to the complete TUNEL reaction mixture. Micrographs were taken with the 40× objective.
In a second assay for CNF1-induced apoptosis, we used agarose gel electrophoresis to detect the presence of cleaved chromatin in 5637 cells that had been incubated in the presence or absence of CNF1. DNA fragmentation in CNF1-intoxicated 5637 cells was compared to that seen with the broad-spectrum kinase inhibitor staurosporine (39). Laddering of fragmented DNA was apparent in 5637 cells treated with CNF1 for 24, 42, 48, or 72 h (Fig. 9, lanes 5 to 7) (data not shown). These ladderlike patterns were equivalent to those seen in apoptotic 5637 cells treated with staurosporine for 18 or 24 h (Fig. 9, lanes 3 and 4). In contrast, no DNA fragments were isolated from 5637 cells incubated with medium alone for 24 or 42 h (Fig. 9, lane 1) (data not shown). The amount of fragmented DNA in CNF1-intoxicated 5637 cells increased with time (Fig. 9, lanes 5 to 7) and with toxin concentration (data not shown). The results of this assay support the conclusion that CNF1 kills 5637 cells via the induction of apoptosis in a dose- and time-dependent fashion.
FIG. 9.
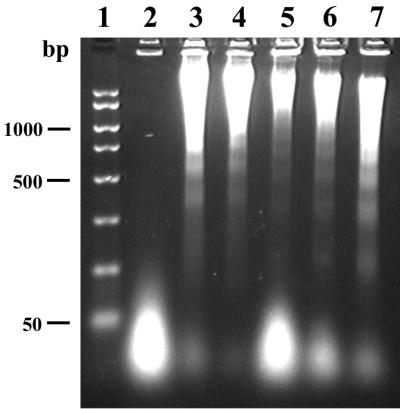
DNA laddering in His-CNF1-intoxicated, apoptotic 5637 cells. 5637 cell monolayers were incubated in the absence or presence of His-CNF1-containing sonic extracts for 24 to 72 h at 37°C with 5% CO2. DNA then was isolated from the supernatants of lysed cells and separated by electrophoresis on agarose gels. Lanes: 1, DNA molecular weight markers (2,000, 1,500, 1,000, 750, 500, 300, 150, and 50 bp); 2, untreated 5637 cells; 3, 5637 cells treated for 18 h with 100 nM staurosporine, the positive control for induction of apoptosis; 4, 5637 cells treated with 100 nM staurosporine for 24 h; 5, 5637 cells incubated for 24 h with a 1:640 toxin dilution; 6, 5637 cells incubated for 48 h with a 1:640 toxin dilution; 7, 5637 cells incubated for 72 h with a 1:640 toxin dilution.
DISCUSSION
In this investigation, we demonstrate for the first time that CNF1 of UPEC can kill human uroepithelial bladder cells and that this killing of 5637 cells occurs by an apoptotic mechanism. Moreover, we show an absence of CNF1-induced stress fiber formation in all human uroepithelial cell lines tested, a phenotype previously considered sine qua non of CNF1 intoxication. The 5637 cell line was derived from a human bladder primary carcinoma, and these malignant epithelial cells possess features that may prove useful in future studies of the role of CNF1 in vivo. For instance, the cell line secretes functionally active cytokines, and, in fact, 5637-conditioned medium has been used to supply essential growth factors in assays involving other cell lines (48). Cytokines produced by 5637 cells include a number that are involved in the inflammatory response (interleukin-1α [IL-1α], IL-1β, IL-6, and IL-8; and tumor necrosis factor alpha [TNF-α] and -β), as well as several hematopoietic factors, such as the granulocyte colony-stimulating factor (G-CSF), that play an important role in the neutrophilic response to infection (36, 43). The capacity of 5637 cells to secrete cytokines is reflective of findings associated with uroepithelial cells in the human host. For example, the urine of patients with UTIs contains elevated concentrations of certain cytokines, including IL-6 and IL-8, that are secreted by uroepithelial cells in response to bacterial colonization (1). UPEC strains also have been shown to stimulate the de novo synthesis of cytokines in other epithelial cell lines derived from the urinary tract, including the J82 bladder cell line (IL-1α, IL-6, and IL-8) and the A498 kidney cell line (IL-6 and IL-8) (2, 32). Furthermore, in a recent study of women with acute pyelonephritis infection, CNF1-producing strains of E. coli correlated with higher levels of G-CSF in serum, a finding which suggests that CNF1 activity in the urine and kidneys may stimulate the endogenous production of that cytokine in serum (35). Since 5637 cells produce cytokines found in human urine during UPEC infections, we think that these cells are a particularly relevant line with which to model the CNF1-human bladder cell interactions that occur in the host. Thus, the death of CNF1-treated 5637 cells may reflect what is typical in vivo rather than what is anomalous.
Based upon our findings with 5637 cells presented here, we propose that CNF1 may stimulate the exfoliation of uroepithelial cells in the UPEC-infected bladder. Desquamation of uroepithelial cells to which bacteria have attached and the subsequent elimination of these cells during urination is considered to be an innate host defense mechanism (26, 46). Indeed, this exfoliative response has been observed in humans with acute or chronic UTIs and in experimental UTI models with mice and rats (16, 17, 26, 40, 46). This exfoliative process may not be entirely advantageous to the host, since shedding of uroepithelial cells will expose underlying tissue to bacteria that have escaped elimination. Internalization of bacteria by epithelial cells has been demonstrated in both the normal and disrupted uroepithelium (16, 17, 26, 40). In fact, this internalization may give the pathogen access to a protected niche replete with nutrients. That CNF1 may also promote uptake of bacteria by host epithelial cells is suggested by the observation that the toxin stimulates phagocytosis of latex beads and noninvasive bacteria into HEp-2 cells (19).
The link between exfoliation, apoptosis, and UPEC invasion of the bladder was recently demonstrated in an elegant study by Mulvey et al. (42). In that study, the authors showed that exfoliation of the bladder epithelium was a consequence of apoptosis; positive TUNEL reactions were observed in epithelial cells within 2 h of bacterial inoculation, and substantial exfoliation had occurred by 6 h postinfection. Type 1-piliated E. coli cells were observed to invade the underlying uroepithelium beginning 2 h after inoculation, approximately the same time as the initiation of apoptosis (42). The authors concluded that the presence of the FimH adhesin was necessary for the UPEC strain NU14 to induce apoptotic exfoliation and subsequent invasion of the disrupted bladder surface. CNF1 and FimH may mediate the same phenomena in uropathogenesis, serving as yet another example of the redundancy among virulence factors in UPEC strains.
Although actin stress fiber formation was markedly absent from CNF1-intoxicated bladder cell lines, the toxin did deamidate the target protein RhoA in 5637 cells. Furthermore, the rearrangement of actin into lamellipodia and filipodia in 5637 and SV-HUC-1 cells suggests that CNF1 also activated Rac and Cdc42, as was shown previously in CNF1-intoxicated HeLa cells (38). The fact that GTPase activation in different cell lines may alter the cells in ways that are difficult to predict was first proposed by Hall (30). A cell-type-dependent differential consequence of RhoA activation is exemplified by the finding that CNF1 induces apoptosis in 5637 cells, but protects irradiated HEp-2 cells from apoptosis, according to the work of Fiorentini et al. (22). In another instance of ostensibly contradictory effects, CNF1 disrupts the integrity function of tight junctions of intestinal epithelial cells in polarized monolayers composed of Caco-2 cells (28), but not T84 cells (33), although both cell lines are derived from human colon carcinomas.
Cells derived from bladder tissue may respond to CNF1 differently from other epithelial cell lines because they have certain traits characteristic of normal bladder cells that are intended to protect the host from disease. For example, cells from the transitional uroepithelium are required to change shape according to the distention status of the bladder. Perhaps dense arrays of actin stress fibers would render these cells less flexible, and so stress fiber formation is restricted in this cell type. Similarly, 5637 bladder carcinoma cells may reflect the in vivo situation in which the capacity to undergo apoptosis in response to some bacterial factor is advantageous to the host.
In sum, our data indicate that the cytotoxicity of CNF1-intoxicated 5637 cells results from CNF1-induced apoptosis. On the assumption that 5637 cells can serve as a surrogate for human uroepithelial bladder cells in situ, we propose a model in which CNF1, like FimH of E. coli, promotes uroepithelial shedding of UPEC-infected cells by induction of apoptosis in those cells. Such an event could, in turn, lead to the introduction of bacteria into deeper cells of the bladder. Preliminary findings from our laboratory in support of this model include the fact that CNF1-producing strains do not appear to induce multinucleation of bladder epithelial cells in a mouse model of ascending UTI. Rather, when otherwise isogenic strains of UPEC are compared in the mouse model, the production of CNF1 seems to promote the shedding of heavily infected uroepithelial cells in the urine of infected mice.
ACKNOWLEDGMENTS
This work was supported by grant AI38281-05 from the National Institutes of Health.
We thank James Sinclair for assistance in developing a quantitative assay for toxin binding.
REFERENCES
- 1.Agace W, Connell H, Svanborg C. Host resistance to urinary tract infections. In: Mobley H L T, Warren J W, editors. Urinary tract infections: molecular pathogenesis and clinical management. Washington, D.C.: American Society for Microbiology; 1996. pp. 221–243. [Google Scholar]
- 2.Agace W, Hedges S, Andersson U, Andersson J, Ceska M, Svanborg C. Selective cytokine production by epithelial cells following exposure to Escherichia coli. Infect Immun. 1993;61:602–609. doi: 10.1128/iai.61.2.602-609.1993. [DOI] [PMC free article] [PubMed] [Google Scholar]
- 3.Aktories K. Rho proteins: targets for bacterial toxins. Trends Microbiol. 1997;5:282–288. doi: 10.1016/S0966-842X(97)01067-6. [DOI] [PubMed] [Google Scholar]
- 4.Alonso P, Blanco J, Blanco M, Gonzalez E A. Frequent production of toxins by Escherichia coli strains isolated from human urinary tract infections: relation with haemagglutination. FEMS Microbiol Lett. 1987;48:391–396. [Google Scholar]
- 5.Andreu A, Stapleton A E, Fennell C, Lockman H A, Xercavins M, Fernandez F, Stamm W E. Urovirulence determinants in Escherichia coli strains causing prostatitis. J Infect Dis. 1997;176:464–469. doi: 10.1086/514065. [DOI] [PubMed] [Google Scholar]
- 6.Blanco J, Alonso M P, Gonzalez E A, Blanco M, Garabal J I. Virulence factors of bacteraemic Escherichia coli with particular reference to production of cytotoxic necrotising factor (CNF) by P-fimbriate strains. J Med Microbiol. 1990;31:175–183. doi: 10.1099/00222615-31-3-175. [DOI] [PubMed] [Google Scholar]
- 7.Blanco J, Gonzalez E A, Garcia S, Blanco M, Regueiro B, Bernardez I. Production of toxins by Escherichia coli strains isolated from calves with diarrhoea in Galicia (North-western Spain) Vet Microbiol. 1988;18:297–311. doi: 10.1016/0378-1135(88)90095-8. [DOI] [PubMed] [Google Scholar]
- 8.Blum G, Falbo V, Caprioli A, Hacker J. Gene clusters encoding the cytotoxic necrotizing factor type 1, Prs-fimbriae and α-hemolysin form the pathogenicity island II of the uropathogenic Escherichia coli strain J96. FEMS Microbiol Lett. 1995;126:189–196. doi: 10.1111/j.1574-6968.1995.tb07415.x. [DOI] [PubMed] [Google Scholar]
- 9.Caprioli A, Donelli G, Falbo V, Possenti R, Roda L G, Roscetti G, Ruggeri F M. A cell division-active protein from E. coli. Biochem Biophys Res Commun. 1984;118:587–593. doi: 10.1016/0006-291x(84)91343-3. [DOI] [PubMed] [Google Scholar]
- 10.Caprioli A, Falbo V, Roda L G, Ruggeri F M, Zona C. Partial purification and characterization of an Escherichia coli toxic factor that induces morphological cell alterations. Infect Immun. 1983;39:1300–1306. doi: 10.1128/iai.39.3.1300-1306.1983. [DOI] [PMC free article] [PubMed] [Google Scholar]
- 11.Caprioli A, Falbo V, Ruggeri F M, Baldassarri L, Bisicchia R, Ippolito G, Romoli E, Donelli G. Cytotoxic necrotizing factor production by hemolytic strains of Escherichia coli causing extraintestinal infections. J Clin Microbiol. 1987;25:146–149. doi: 10.1128/jcm.25.1.146-149.1987. [DOI] [PMC free article] [PubMed] [Google Scholar]
- 12.Chen C-H, Kuwazuru Y, Yoshida T, Nambiar M, Wu H C. Isolation and characterization of a brefeldin A-resistant mutant of monkey kidney Vero cells. Exp Cell Res. 1992;203:321–328. doi: 10.1016/0014-4827(92)90005-s. [DOI] [PubMed] [Google Scholar]
- 13.De Rycke J, Phan-Thanh L, Bernard S. Immunochemical identification and biological characterization of cytotoxic necrotizing factor from Escherichia coli. J Clin Microbiol. 1989;27:983–988. doi: 10.1128/jcm.27.5.983-988.1989. [DOI] [PMC free article] [PubMed] [Google Scholar]
- 14.Donelli G, Fiorentini C. Cell injury and death caused by bacterial protein toxins. Toxicol Lett. 1992;64/65:695–699. doi: 10.1016/0378-4274(92)90249-j. [DOI] [PubMed] [Google Scholar]
- 15.Donnenberg M S, Welch R A. Virulence determinants of uropathogenic Escherichia coli. In: Mobley H L T, Warren J W, editors. Urinary tract infections: molecular pathogenesis and clinical management. Washington, D.C.: American Society for Microbiology; 1996. pp. 135–174. [Google Scholar]
- 16.Elliott T S J, Reed L, Slack R C B, Bishop M C. Bacteriology and ultrastructure of the bladder in patients with urinary tract infections. J Infect. 1985;11:191–199. doi: 10.1016/s0163-4453(85)92997-4. [DOI] [PubMed] [Google Scholar]
- 17.Elliott T S J, Slack R C B, Bishop M C. Scanning electron microscopy and bacteriology of the human bladder in acute and chronic urinary tract infections. In: Asscher A W, Brumfitt W, editors. Microbial diseases in nephrology. New York, N.Y: John Wiley & Sons Ltd.; 1986. pp. 31–46. [Google Scholar]
- 18.Falbo V, Pace T, Picci L, Pizzi E, Caprioli A. Isolation and nucleotide sequence of the gene encoding cytotoxic necrotizing factor 1 of Escherichia coli. Infect Immun. 1993;61:4909–4914. doi: 10.1128/iai.61.11.4909-4914.1993. [DOI] [PMC free article] [PubMed] [Google Scholar]
- 19.Falzano L, Fiorentini C, Donelli G, Michel E, Kocks C, Cossart P, Cabanié L, Oswald E, Boquet P. Induction of phagocytic behaviour in human epithelial cells by Escherichia coli cytotoxic necrotizing factor type 1. Mol Microbiol. 1993;9:1247–1254. doi: 10.1111/j.1365-2958.1993.tb01254.x. [DOI] [PubMed] [Google Scholar]
- 20.Fernandez A, Marin M C, McDonnell T, Ananthaswamy H N. Differential sensitivity of normal and Ha-ras-transformed C3H mouse embryo fibroblasts to tumor necrosis factor: induction of bcl-2, c-myc, and manganese superoxide dismutase in resistant cells. Oncogene. 1994;9:2009–2017. [PubMed] [Google Scholar]
- 21.Fiorentini C, Arancia G, Caprioli A, Falbo V, Ruggeri F M, Donelli G. Cytoskeletal changes induced in HEp-2 cells by the cytotoxic necrotizing factor of Escherichia coli. Toxicon. 1988;26:1047–1056. doi: 10.1016/0041-0101(88)90203-6. [DOI] [PubMed] [Google Scholar]
- 22.Fiorentini C, Fabbri A, Matarrese P, Falzano L, Boquet P, Malorni W. Hinderance of apoptosis and phagocytic behaviour induced by Escherichia coli cytotoxic necrotizing factor 1: two related activities in epithelial cells. Biochem Biophys Res Commun. 1997;241:341–346. doi: 10.1006/bbrc.1997.7723. [DOI] [PubMed] [Google Scholar]
- 23.Flatau G, Lemichez E, Gauthier M, Chardin P, Paris S, Fiorentini C, Boquet P. Toxin-induced activation of the G protein p21 Rho by deamidation of glutamine. Nature. 1997;387:729–733. doi: 10.1038/42743. [DOI] [PubMed] [Google Scholar]
- 24.Fournout S, Dozois C M, Odin M, Desautels C, Pérès S, Hérault F, Daigle F, Segafredo C, Laffitte J, Oswald E, Fairbrother J M, Oswald I P. Lack of a role of cytotoxic necrotizing factor 1 toxin from Escherichia coli in bacterial pathogenicity and host cytokine response in infected germfree piglets. Infect Immun. 2000;68:839–847. doi: 10.1128/iai.68.2.839-847.2000. [DOI] [PMC free article] [PubMed] [Google Scholar]
- 25.Frankel G, Candy D C A, Everest P, Dougan G. Characterization of the C-terminal domains of intimin-like proteins of enteropathogenic and enterohemorrhagic Escherichia coli, Citrobacter freundii, and Hafnia alvei. Infect Immun. 1994;62:1835–1842. doi: 10.1128/iai.62.5.1835-1842.1994. [DOI] [PMC free article] [PubMed] [Google Scholar]
- 26.Fukushi Y, Orikasa S, Kagayama M. An electron microscopic study of the interaction between vesical epithelium and E. coli. Investig Urol. 1979;17:61–68. [PubMed] [Google Scholar]
- 27.Gavrieli Y, Sherman Y, Ben-Sasson S A. Identification of programmed cell death in situ via specific labeling of nuclear DNA fragmentation. J Cell Biol. 1992;119:493–501. doi: 10.1083/jcb.119.3.493. [DOI] [PMC free article] [PubMed] [Google Scholar]
- 28.Gerhard R, Schmidt G, Hofmann F, Aktories K. Activation of Rho GTPases by Escherichia coli cytotoxic necrotizing factor 1 increases intestinal permeability in Caco-2 cells. Infect Immun. 1998;66:5125–5131. doi: 10.1128/iai.66.11.5125-5131.1998. [DOI] [PMC free article] [PubMed] [Google Scholar]
- 29.Hall A. Ras-related GTPases and the cytoskeleton. Mol Biol Cell. 1992;3:475–479. doi: 10.1091/mbc.3.5.475. [DOI] [PMC free article] [PubMed] [Google Scholar]
- 30.Hall A. Rho GTPases and the actin cytoskeleton. Science. 1998;279:509–514. doi: 10.1126/science.279.5350.509. [DOI] [PubMed] [Google Scholar]
- 31.Harlow E, Lane D. Antibodies, a laboratory manual. Cold Spring Harbor, N.Y: Cold Spring Harbor Laboratory; 1988. [Google Scholar]
- 32.Hedges S, Svensson M, Svanborg C. Interleukin-6 response of epithelial cell lines to bacterial stimulation in vitro. Infect Immun. 1992;60:1295–1301. doi: 10.1128/iai.60.4.1295-1301.1992. [DOI] [PMC free article] [PubMed] [Google Scholar]
- 33.Hofman P, Flatau G, Selva E, Gauthier M, Le Negrate G, Fiorentini C, Rossi B, Boquet P. Escherichia coli cytotoxic necrotizing factor 1 effaces microvilli and decreases transmigration of polymorphonuclear leukocytes in intestinal T84 epithelial cell monolayers. Infect Immun. 1998;66:2494–2500. doi: 10.1128/iai.66.6.2494-2500.1998. [DOI] [PMC free article] [PubMed] [Google Scholar]
- 34.Island M D, Cui X, Warren J W. Effect of Escherichia coli cytotoxic necrotizing factor 1 on repair of human bladder cell monolayers in vitro. Infect Immun. 1999;67:3657–3661. doi: 10.1128/iai.67.7.3657-3661.1999. [DOI] [PMC free article] [PubMed] [Google Scholar]
- 35.Jacobson S H, Lu Y, Brauner A. Soluble interleukin-6 receptor, interleukin-10 and granulocyte colony-stimulating factor in acute pyelonephritis: relationship to markers of bacterial virulence and renal function. Nephron. 1998;80:401–407. doi: 10.1159/000045211. [DOI] [PubMed] [Google Scholar]
- 36.Kaashoek J G J, Mout R, Falkenburg J H F, Willemze R, Fibbe W E, Landegent J E. Cytokine production by the bladder carcinoma cell line 5637: rapid analysis of mRNA expression levels using a cDNA-PCR procedure. Lymphokine Cytokine Res. 1991;10:231–235. [PubMed] [Google Scholar]
- 37.Lerm M, Schmidt G, Goehring U-M, Schirmer J, Aktories K. Identification of the region of Rho involved in substrate recognition by Escherichia coli cytotoxic necrotizing factor 1 (CNF1) J Biol Chem. 1999;274:28999–29004. doi: 10.1074/jbc.274.41.28999. [DOI] [PubMed] [Google Scholar]
- 38.Lerm M, Selzer J, Hoffmeyer A, Rapp U R, Aktories K, Schmidt G. Deamidation of Cdc42 and Rac by Escherichia coli cytotoxic necrotizing factor 1: activation of c-Jun N-terminal kinase in HeLa cells. Infect Immun. 1999;67:496–503. doi: 10.1128/iai.67.2.496-503.1999. [DOI] [PMC free article] [PubMed] [Google Scholar]
- 39.McConkey D J, Goodrich D, Bucana C, Klostergaard J. The human retinoblastoma gene product suppresses ceramide-induced apoptosis in human bladder tumor cells. Oncogene. 1996;13:1693–1700. [PubMed] [Google Scholar]
- 40.McTaggart L A, Rigby R C, Elliott T S J. The pathogenesis of urinary tract infections associated with Escherichia coli, Staphylococcus saprophyticus and S. epidermidis. J Med Microbiol. 1990;32:135–141. doi: 10.1099/00222615-32-2-135. [DOI] [PubMed] [Google Scholar]
- 41.Mitsumori K, Terai A, Yamamoto S, Ishitoya S, Yoshida O. Virulence characteristics of Escherichia coli in acute bacterial prostatitis. J Infect Dis. 1999;180:1378–1381. doi: 10.1086/314976. [DOI] [PubMed] [Google Scholar]
- 42.Mulvey M A, Lopez-Boado Y S, Wilson C L, Roth R, Parks W C, Heuser J, Hultgren S J. Induction and evasion of host defenses by type 1-piliated uropathogenic Escherichia coli. Science. 1998;282:1494–1497. doi: 10.1126/science.282.5393.1494. [DOI] [PubMed] [Google Scholar]
- 43.Nagata S. Granulocyte colony stimulating factor and its receptor. In: Thomson A W, editor. The cytokine handbook. San Diego, Calif: Academic Press, Inc.; 1994. pp. 371–385. [Google Scholar]
- 44.Neuhoff V, Arold N, Taube D, Ehrhardt W. Improved staining of proteins in polyacrylamide gels including isoelectric focusing gels with clear background at nanogram sensitivity using Coomassie Brilliant Blue G-250 and R-250. Electrophoresis. 1988;9:255–262. doi: 10.1002/elps.1150090603. [DOI] [PubMed] [Google Scholar]
- 45.Nobes C D, Hall A. Rho, Rac, and Cdc42 GTPases regulate the assembly of multimolecular focal complexes associated with actin stress fibers, lamellipodia, and filopodia. Cell. 1995;81:53–62. doi: 10.1016/0092-8674(95)90370-4. [DOI] [PubMed] [Google Scholar]
- 46.Orikasa S, Hinman F., Jr Reaction of the vesical wall to bacterial penetration: resistance to attachment, desquamation, and leukocytic activity. Investig Urol. 1977;15:185–193. [PubMed] [Google Scholar]
- 47.Oswald E, Sugai M, Labigne A, Wu H C, Fiorentini C, Boquet P, O'Brien A D. Cytotoxic necrotizing factor type 2 produced by virulent Escherichia coli modifies the small GTP-binding proteins Rho involved in assembly of actin stress fibers. Proc Natl Acad Sci USA. 1994;91:3814–3818. doi: 10.1073/pnas.91.9.3814. [DOI] [PMC free article] [PubMed] [Google Scholar]
- 48.Quentmeier H, Zaborski M, Drexler H G. The human bladder carcinoma cell line 5637 constitutively secretes functional cytokines. Leuk Res. 1997;21:343–350. doi: 10.1016/s0145-2126(96)00132-4. [DOI] [PubMed] [Google Scholar]
- 49.Ridley A J, Hall A. The small GTP-binding protein rho regulates the assembly of focal adhesions and actin stress fibers in response to growth factors. Cell. 1992;70:389–399. doi: 10.1016/0092-8674(92)90163-7. [DOI] [PubMed] [Google Scholar]
- 50.Ridley A J, Paterson H F, Johnston C L, Diekmann D, Hall A. The small GTP-binding protein rac regulates growth factor-induced membrane ruffling. Cell. 1992;70:401–410. doi: 10.1016/0092-8674(92)90164-8. [DOI] [PubMed] [Google Scholar]
- 51.Schmidt G, Sehr P, Wilm M, Selzer J, Mann M, Aktories K. Gln63 of Rho is deamidated by Escherichia coli cytotoxic necrotizing factor-1. Nature. 1997;387:725–729. doi: 10.1038/42735. [DOI] [PubMed] [Google Scholar]
- 52.Swenson D L, Bukanov N O, Berg D E, Welch R A. Two pathogenicity islands in uropathogenic Escherichia coli J96: cosmid cloning and sample sequencing. Infect Immun. 1996;64:3736–3743. doi: 10.1128/iai.64.9.3736-3743.1996. [DOI] [PMC free article] [PubMed] [Google Scholar]
- 53.Winston S E, Fuller S A, Hurrell J G R. Analysis of proteins. In: Ausubel F M, Brent R, Kingston R E, Moore D D, Seidman J G, Smith J A, Struhl K, editors. Short protocols in molecular biology. New York, N.Y: Greene Publishing Associates and John Wiley & Sons; 1992. pp. 10.1–10.69. [Google Scholar]