

Abstract
The regulatory specificity of enhancers and their interaction with gene promoters is thought to be controlled by their sequence and the binding of transcription factors. By studying Pitx1, a regulator of hindlimb development, we show that dynamic changes in chromatin conformation can restrict the activity of enhancers. Inconsistent with its hindlimb-restricted expression, Pitx1 is controlled by an enhancer (Pen) that shows activity in both fore- and hindlimb. By capture HiC and 3D-modeling of the locus, we demonstrate that fore- and hindlimbs have fundamentally different chromatin configurations, whereby Pen and Pitx1 interact in hindlimbs and are physically separated in forelimbs. Structural variants are able to convert the inactive into the active conformation, thereby inducing Pitx1 misexpression in the forelimb, causing partial arm-to-leg transformation in mice and humans. Thus, tissue-specific 3D chromatin conformation can contribute to enhancer activity and specificity in vivo and its disturbance can result in gene misexpression and disease.
INTRODUCTION
Embryonic development requires highly accurate and robust regulation of gene expression. Much of this information is encoded in cis-regulatory elements called enhancers, which are short stretches of DNA sequences that are able to drive gene expression over long distances, independent of their location or orientation, by physically contacting their target gene promoter 1. Characteristically, enhancers are active in different tissues and/or at distinct time points, with their individual activities collectively adding up to the complex developmental expression pattern of their shared target genes. These features allow enhancers to regulate genes in a modular manner resulting in a vast combinatorial flexibility. Most current models suggest that the regulatory activity of enhancers is encoded within their sequence and translated into regulation via the binding of tissue specific transcription factors.
Since enhancers can act over long distances, it is critical that their genomic activity is tightly restricted. The required regional specificity is at least in part achieved by the formation of chromatin domains called Topologically Associating Domains (TADs) that insulate regions of high interaction from each other thereby restricting the promoters an enhancer can potentially interact with. Structural variants (SVs) such as deletions, duplications or inversions can disrupt TADs and their insulating borders allowing enhancers to act on neighbouring domains causing ectopic enhancer-promoter interactions, gene misexpression and consecutive disease 2. This mutational mechanism, termed enhancer adoption or enhancer hijacking, has shown to be common in both cancer and congenital disease 3,4. While the overall configuration of TADs is rather stable between tissues and cells, interactions at the sub-TAD level are more dynamic reflecting the instructive, cell-type specific interactions between cognate enhancers and promoters 5–7. However, it remains unclear whether the assembly and disassembly of these interactions is causally involved in modulating gene transcription in vivo and if genetic alterations perturbing these interactions can cause gene misregulation and disease.
In the present study, we dissect the basic mechanisms of enhancer-promoter interaction and its role in gene regulation at the Pitx1 locus, a gene that is critically required for establishing the identity and differentiation of hindlimbs 8. During limb development, the Pitx1 gene is only expressed in hindlimbs, and Pitx1 loss-of-function causes a selective reduction of hindlimbs, but not forelimbs, as well as a partial loss of hindlimb characteristics 9–11. The instructive character of Pitx1 for hindlimb identity is further shown by ectopic expression of Pitx1 in developing forelimbs, which is sufficient to cause partial forelimb-to-hindlimb conversion in mice and humans 8,12,13.
Here, we demonstrate that Pitx1 is regulated by an enhancer (Pen) that displays activity in both fore- and hindlimbs. The restriction of this activity to the hindlimb is associated with tissue specific differences in 3D chromatin structure enabling the Pen enhancer to control Pitx1 transcription in hindlimbs only. The forelimb-specific 3D chromatin conformation that normally prevents Pen from physically contacting Pitx1 can be reverted to the active hindlimb state by SVs resulting in Pitx1 misexpression in forelimbs. These alterations of the locus, whether engineered in mice or associated with disease in humans, result in the appearance of anatomical hindlimb features in the forelimb. Our results demonstrate that tissue-specific 3D-chromatin architecture can refine enhancer activity into a precise enhancer-promoter interaction required for normal morphogenesis and that disruption of this process can result in gene misexpression and disease in both mice and humans.
RESULTS
The regulatory landscape of Pitx1 involves forelimb and hindlimb enhancer activity
Pitx1 is expressed in the developing hindlimb buds, the first branchial arch, the pituitary gland, and parts of the gut (Figure 1A) 14. The gene resides at the centromeric edge of a 240 kb gene desert flanked by the housekeeping gene H2afy on the telomeric side (Figure 1A). To determine the position of regulatory elements controlling Pitx1 in hindlimb buds, we examined capture-C (cC) interaction profiles and ChIP-seq for the enhancer mark H3K27ac in hindlimb buds at embryonic stage E10.5 (Figure 1A) 15. The chromatin interaction profile shows that the Pitx1 regulatory landscape extends over 400 kb and forms several chromatin loops corresponding to H3K27ac peaks, termed regulatory anchors 1 to 5 (RA1 to RA5, with the Pitx1 promoter representing RA2, Figure 1A). We next examined the ability of several of these elements to drive a LacZ reporter by single copy insertion in transgenic mice (Figures 1A, S1A) 16. RA3 displayed activity in the pituitary gland (Pit enhancer), recapitulating endogenous Pitx1 expression in this tissue. Unexpectedly, RA5 and, to a lower extent, RA4, showed enhancer activity in both fore- and hindlimb buds, which contrast to the hindlimb-restricted expression of Pitx1. Due to its strong activity in fore- and hindlimb, we refer to RA5 as pan-limb enhancer (Pen) 12,17 (Figure 1A).
Figure 1. Pitx1 regulatory landscape includes a pan-limb region.
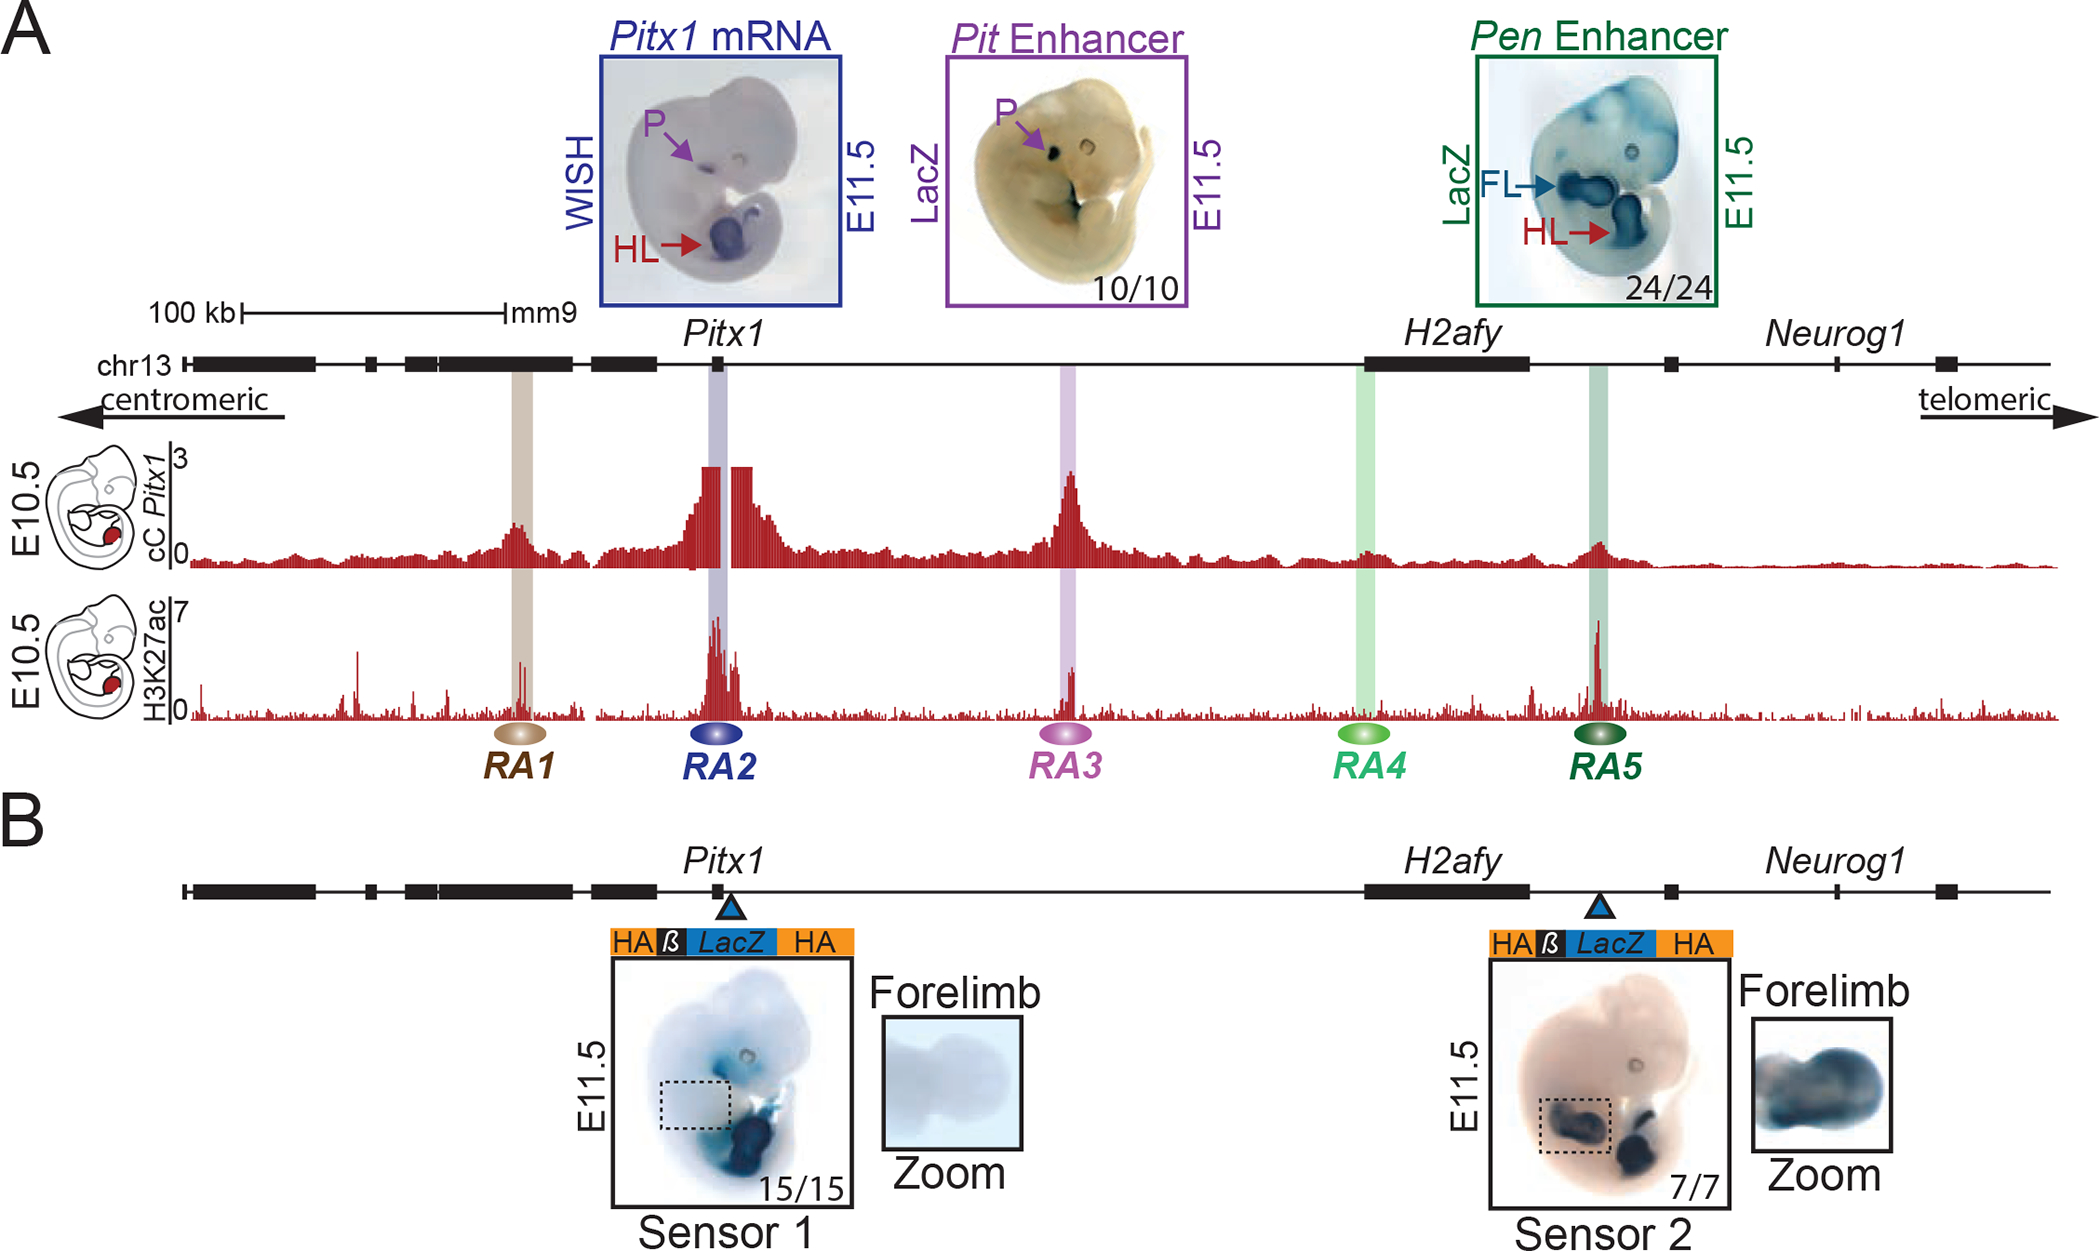
A. Pitx1 regulatory landscape in hindlimbs. Top left: WISH of Pitx1 at E11.5, showing hindlimb (HL) and pituitary (P) specific expression. Top middle and right: LacZ reporter activity at E11.5 of RA3 (Pit enhancer) showing activity in pituitary in 10 out of 10 embryos and of RA5 (Pen enhancer) showing activity in fore- and hindlimbs in 24 out of 24 embryos (see FL and HL). Upper red track: Capture-C (cC) in E10.5 hindlimbs using Pitx1 promoter as viewpoint demonstrating chromatin interactions with regulatory anchors (RA1 to RA5). Lower red track: H3K27ac ChIP-seq enrichment profile in E10.5 hindlimbs. B. LacZ sensors 1 and 2 reflect endogenous regulatory activity at E11.5. Blue arrowheads indicate the positions of the integrations. Sensor-1 recapitulates Pitx1 expression pattern in 15 out of 15 embryos (compare with Pitx1 WISH in A). Note the absence of forelimb staining. Sensor-2 shows a strong fore- and hindlimb activity in 7 out of 7 embryos, similar to the Pen enhancer (compare with Pen LacZ activity in A).
Considering that these initial transgenic assays involved integration of the LacZ reporter constructs outside of their genomic context at the Col1A1 locus, we also examined the endogenous regulatory activities within the native genomic locus by integrating two LacZ reporter cassettes, termed sensor-1 and -2, at the Pitx1 promoter and next to Pen, respectively (Figure 1B and Figure S1B). Sensor-1 recapitulated the entire Pitx1 expression pattern and showed no activity in the forelimb. In contrast, sensor-2 showed strong staining in forelimbs (Figure 1B), further corroborating the presence of pan-limb regulatory elements within the Pitx1 regulatory landscape.
The pan-limb enhancer Pen is a bona fide component of the Pitx1 regulatory landscape
To functionally dissect the Pitx1 regulatory landscape we generated a series of mouse deletion mutants (Figure 2A) using an adapted CRISPR/Cas9 protocol 18. A homozygous 330 kb deletion (Pitx1del1), removing the entire telomeric gene desert including RA3, RA4, and the Pen enhancer (RA5), resulted in a 20-fold decrease of Pitx1 expression in the hindlimb (Figure 2A, S2A). Pitx1del1/del1 animals exhibited a size reduction of the femur and fibula, a loss of the tibia, and an absent patella, which is a hindlimb-specific structure, thereby phenocopying the Pitx1 loss-of-function phenotype (Figure 2B) 9,10,19. Thus, the critical region ensuring robust Pitx1 hindlimb expression is embedded within these 330 kb.
Figure 2. Genetic dissection of Pitx1 regulation reveals the contribution of a pan-limb enhancer (Pen).
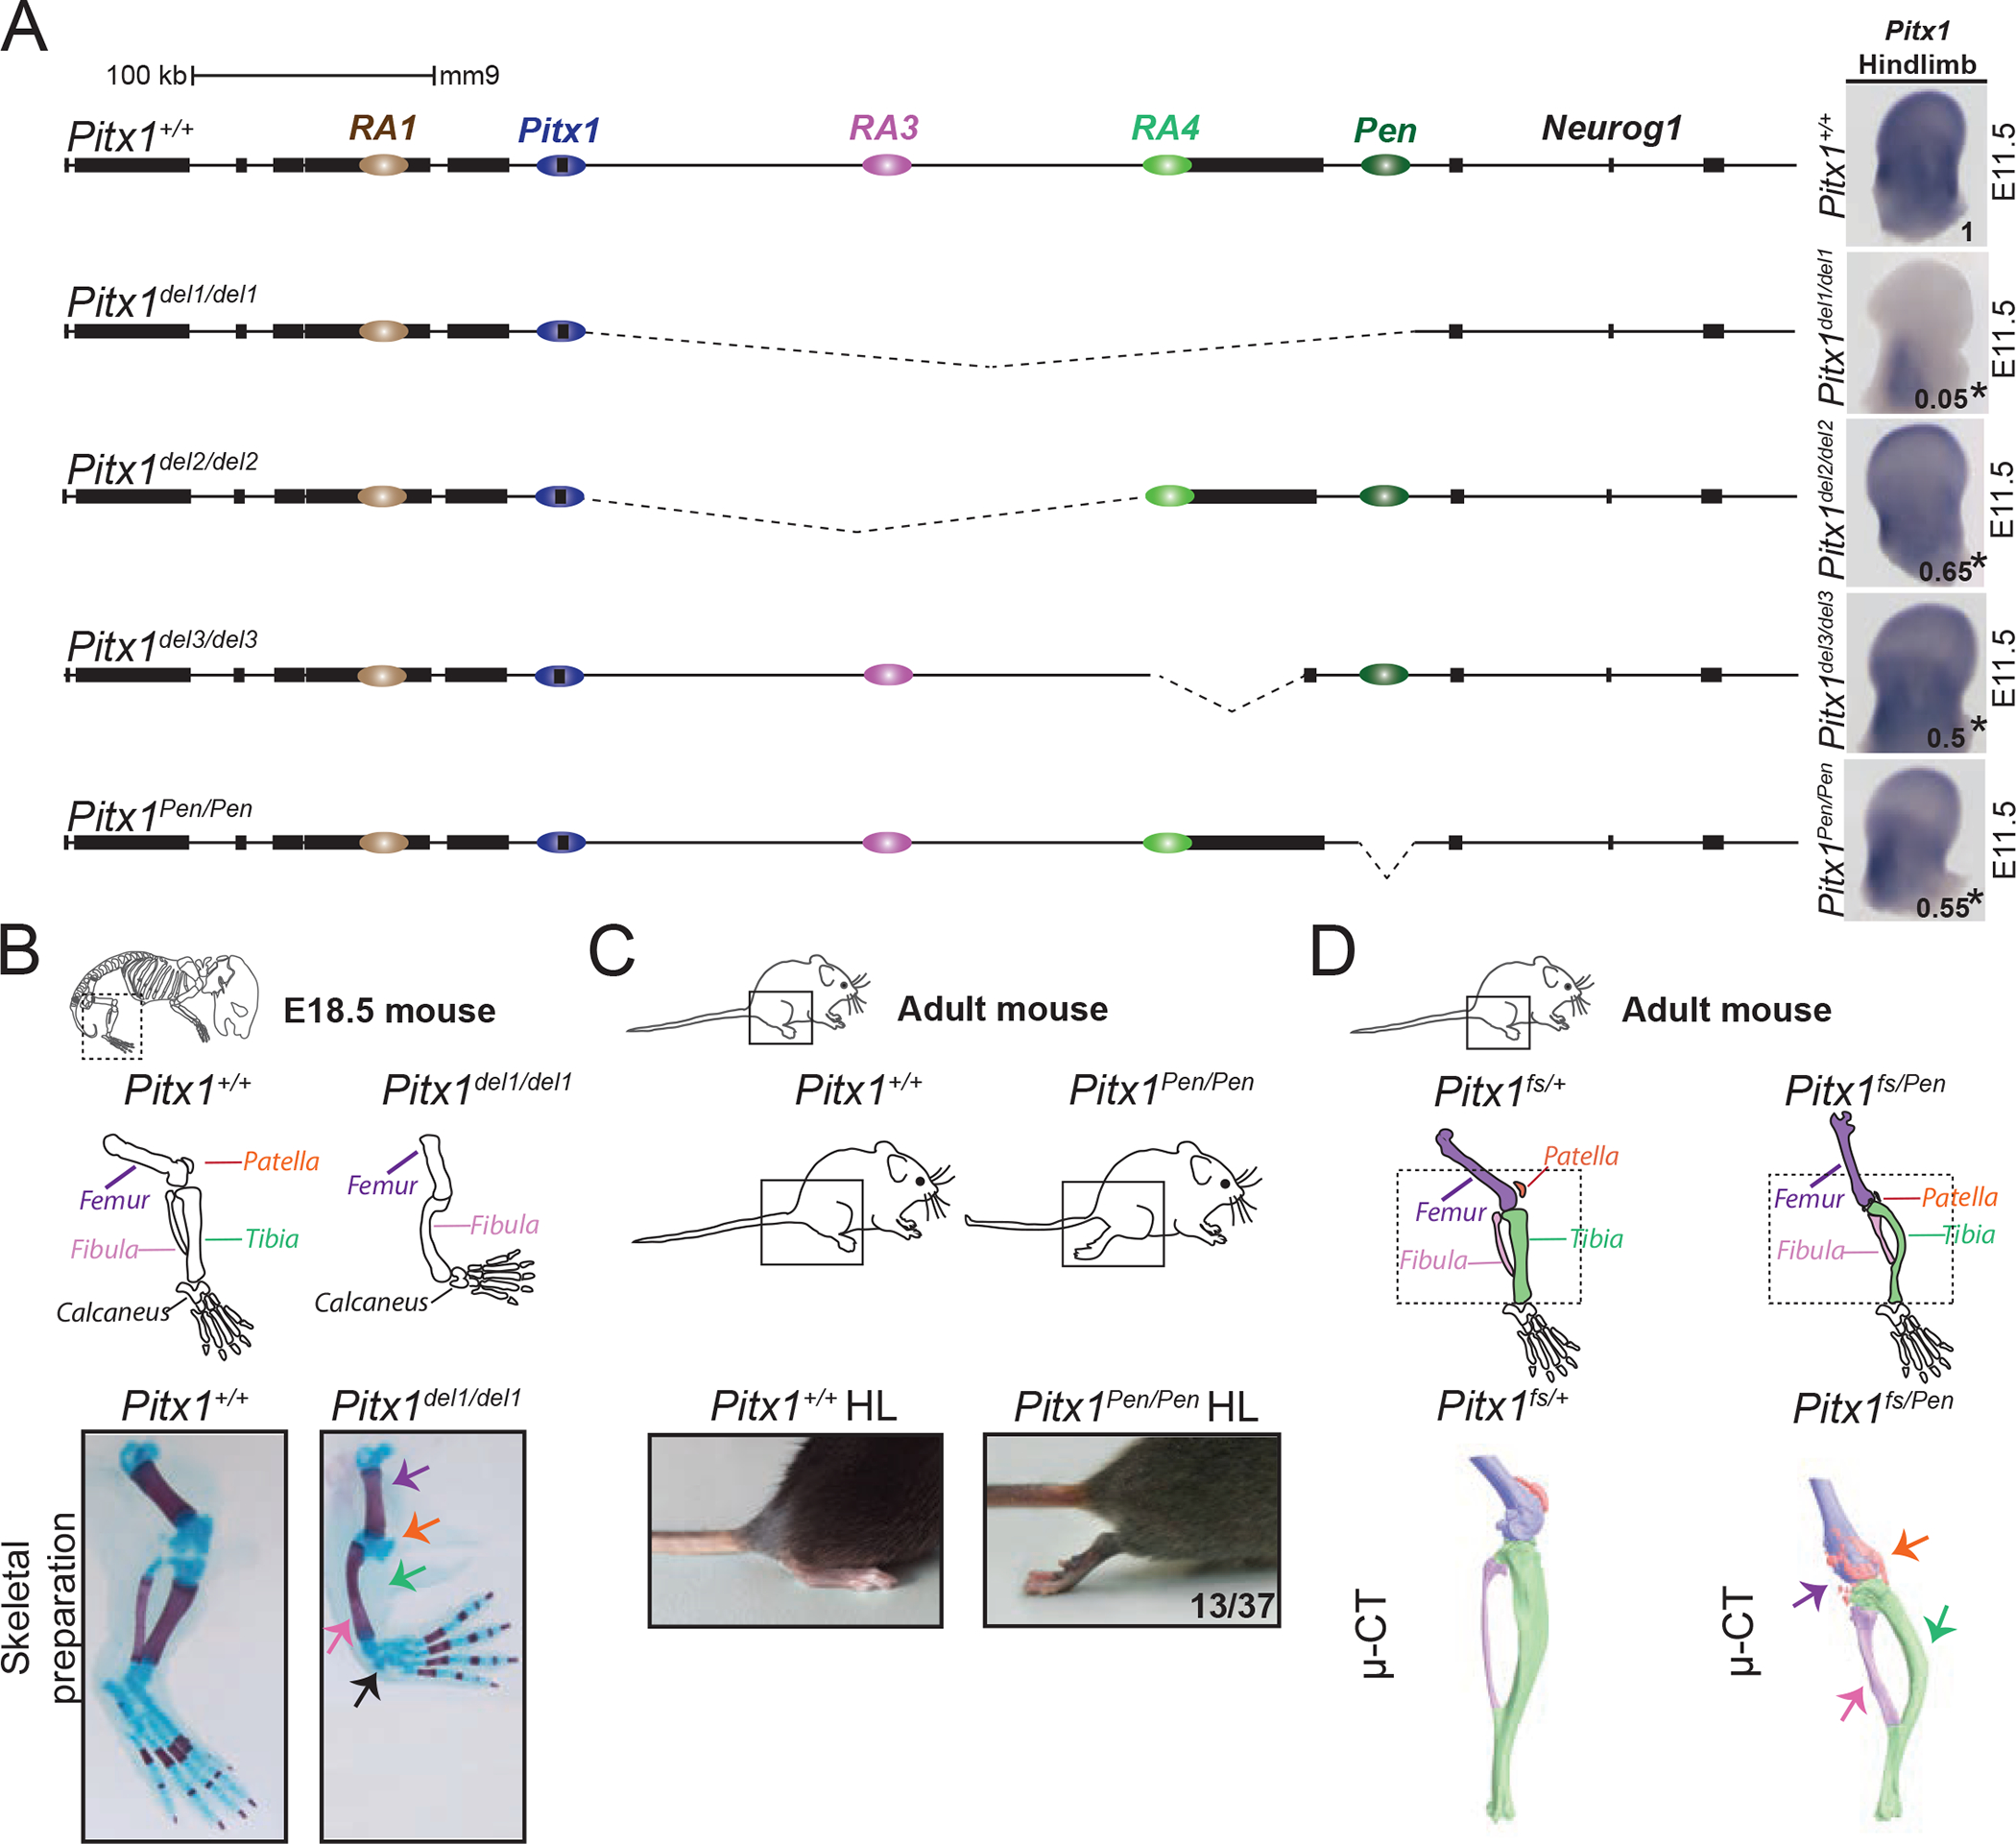
A. CRISPR-Cas9 genetic dissection of the Pitx1 regulatory landscape with mRNA quantification and visualisation of E11.5 hindlimbs using qRT-PCR and WISH. Numbers indicating the average of qRT-PCR fold change compared to wildtype are displayed on the pictures (see figure S2 for quantification). We used a one-sided t-test to evaluate the significance of Pitx1 reduction and an asterisk next to the value indicating a p-value < 0.05. Strong reduction of Pitx1 expression in Pitx1del1/del1 (picture) indicates that its hindlimb regulation is confined to the 330 kb region upstream of the gene (p-value=0.0002, n=4). Pitx1del2/del2 mutants with a 234 kb deletion of the gene desert upstream of Pitx1 show 35% loss of Pitx1 expression (p-value=0.025, n=4). Pitx1del3/del3 mutants carry a 58 kb deletion comprising the H2afy gene and show 50% loss of Pitx1 expression (p-value=0.019, n=3). Pitx1Pen/Pen mice carry a 1.2 kb deletion of the Pen enhancer region and show a 45% loss of Pitx1 expression (p-value=0.012, n=4). B. Pitx1del1/del1 alcian blue and alizarin red skeletal staining at E18.5 demonstrate a Pitx1 loss-of-function phenotype with reduction of the femur, loss of patella and tibia, and small calcaneus (5 skeletal staining out of 5). C. Pitx1Pen/Pen adult mice show a partially penetrant (13 animals out of 37) hindlimb club foot phenotype. D. Pitx1fs/Pen mice display fully penetrant hindlimb malformation (20 animals). μCT of a Pitx1fs/Pen (right) compared to Pitx1fs/+ (middle) adult mice showed a reduced femur (purple), deformed tibia (green) and fibula (pink), as well as a fragmented patella (orange).
To further dissect the locus we created three additional deletion alleles, one removing the intergenic space between Pitx1 and H2afy (Pitx1del2), a second one removing the H2afy gene body as well as RA4 (Pitx1del3), and one removing the Pen enhancer itself (Pitx1Pen). In all three cases, homozygous deletion mice exhibited a 35–50% reduction in hindlimb expression of Pitx1 at E11.5 (Figures 2A, S2B, S2C, S2D), establishing that all three subregions are required for normal Pitx1 expression during hindlimb development. Notably, the deletion of Pen was sufficient to induce a partially penetrant clubfoot (13/37), reminiscent of the phenotype observed in mice and humans with Pitx1 haploinsuffiency (Figure 2C) 20. To confirm the genetic link between Pen and Pitx1, we created a Pitx1 loss-of-function allele (Pitx1fs) by introducing a frame shift mutation in exon 1, upstream of the region encoding the DNA binding domain. Compound heterozygous Pitx1fs/Pen mice exhibited a fully penetrant clubfoot phenotype, as well as a size reduction of the femur, a deformation of the tibia and fibula, and a partially fragmented patella (Figure 2D).
Taken together, this allelic series establishes that normal hindlimb-specific expression of Pitx1 requires Pen, an enhancer with strong activity both in fore- and hindlimbs. Thus, our observations challenge the assumption that the ultimate in vivo activity pattern of an enhancer is solely specified by the presence of binding sites for tissue-specific transcription factors and suggest that Pen activity is further modulated by additional effects.
Active and repressed regions show distinct tissue-specific interactions
In search of a mechanism modulating the endogenous activity pattern of the Pen enhancer, we examined the local chromatin architecture of the Pitx1 locus in developing fore- and hindlimbs. First, we compared capture-C (cC) interaction tracks from the Pitx1 promoter in both tissues at E10.5 (Figure 3A). In forelimbs, we observed minimal interactions of Pitx1 across the RA3-RA5 region but, instead, found that the Neurog1 gene was the strongest distal site of interaction with Pitx1. In contrast, in hindlimbs Pitx1 interacts strongly with RA1, RA3 and Pen, but not with Neurog1. These results provide a first indication that the Pitx1 promoter is embedded into fundamentally different chromatin architectures in fore- and hindlimbs.
Figure 3. Chromatin architecture in fore- and hindlimb demonstrates tissue-specific interaction with active and repressed regions.
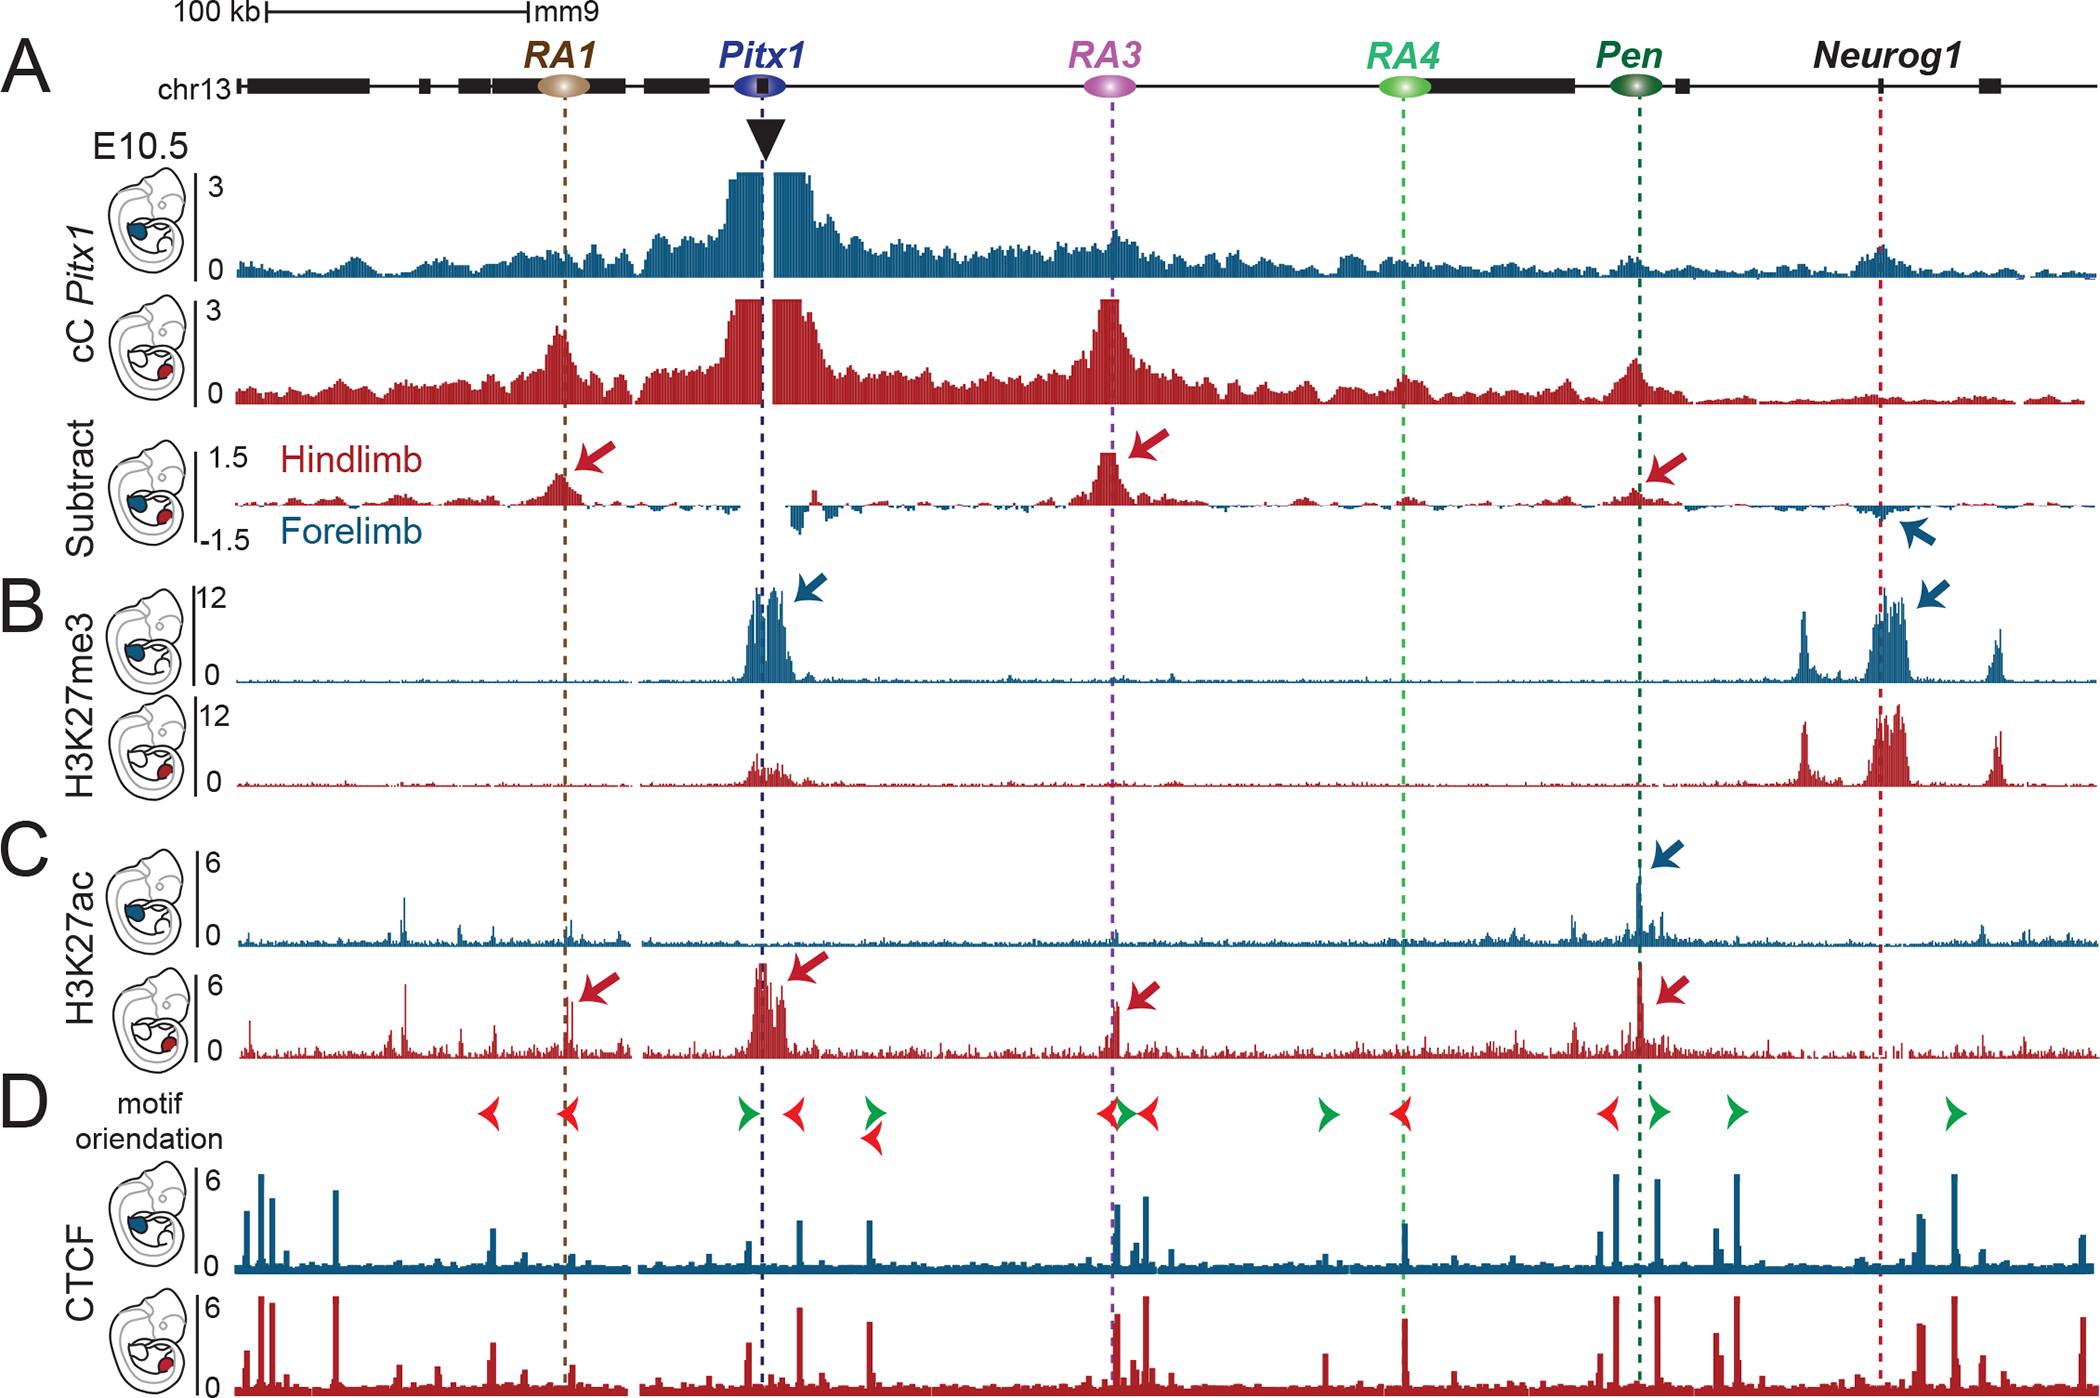
A. Capture-C of Pitx1 promoter in E10.5 forelimb (blue) or hindlimb (red) tissues. The subtraction of the two tracks shows the differences in chromatin interactions, whereby hindlimb-specific interactions are indicated by red arrows, and a forelimb-specific interaction with a blue arrow. B. ChIP-seq tracks of H3K27me3 in E10.5 forelimb (blue) or hindlimb (red) tissues show the forelimb specific repressive interaction between Pitx1 and Neurog1 region. C. ChIP-seq tracks of H3K27ac in E10.5 forelimb (blue) or hindlimb (red) tissues show the deposition of hindlimb specific acetylation at RA1, Pitx1 and RA3, while the Pen region shows acetylation in both fore-and hindlimb tissues. D. ChIP-seq tracks of CTCF in E10.5 forelimb (blue) or hindlimb (red) tissues show little changes in binding. Orientation of CTCF motif is indicated with green and red arrowheads on top.
To further determine the underlying chromatin features associated with these two configurations, we assessed the coverage of H3K27me3 and H3K27ac histone modifications, as well as the binding profile of the architectural transcription factor CTCF in both limb tissues (Figure 3B, C, and D) 15. The overall distribution of both chromatin modifications is nearly identical between both tissues, with the exception of the Pitx1 region. In forelimb tissue, Pitx1 shows strong repressive H3K27me3 signal, whereas in the hindlimb the Pitx1 gene body is depleted for H3K27me3 and enriched for the activating H3K27ac mark. Intriguingly, this differential pattern shows a correlation between the dominant histone marks at Pitx1 and those of the main interaction sites identified by capture-C (Fig. 3A). In forelimb, Pitx1 strongly interacts with Neurog1, which is marked by H3K27me3, whereas in the hindlimb Pitx1 strongly interacts with RA3 and Pen, which are marked by H3K27ac. No major differences in CTCF binding at any of the regulatory anchors were evident, suggesting that the tissue-specific changes observed at the locus are not due to differential binding of CTCF (Figure 3D). These results indicate that two divergent states of chromatin architecture maintain Pitx1 either in an inactive state, by establishing an interaction with the H3K27me3-repressed Neurog1 region, or in an active state, through interactions with active H3K27ac-enriched regions.
Capture-HiC reveals a switch in 3D chromatin architecture in forelimbs vs hindlimbs
In contrast to other loci, public HiC data did not show the presence of tissue- or species-invariant TADs or contact domains encompassing the entire Pitx1 regulatory landscape 21,22. To characterize with higher definition the 3D chromatin folding at this locus in developing tissues, we produced capture-HiC (cHiC) interaction maps encompassing a 3 Mbp region around Pitx1 from mouse fore- and hindlimbs at E11.5 (for a map of the entire region see Figure S3A). We found that the locus is divided into subdomains separated by the previously characterized RAs and that multiple interactions occur between the various RAs as well as with Neurog1 (Figure 4A, 4B). Within the whole assessed region only the Pitx1 regulatory landscape displayed extensive differences between fore- and hindlimb tissues, as shown by the subtraction of fore- and hindlimb cHiC maps (Figure 4C and Figure S3A). Moreover, we could recapitulate the forelimb-specific interaction between Pitx1 and the functionally unrelated Neurog1 gene, as well as the hindlimb-specific interactions between Pitx1 and RA1, RA3 and Pen (Figure 4C and 3A). We also observed that in hindlimbs, interaction frequency increased within subdomains and decreased between them. This insulation effect was further confirmed by computing the insulation score in fore- and hindlimb tissues, which showed a pronounced insulation between subdomains in hindlimbs compared to forelimbs (Figure 4C) 23. As a control, we produced cHiC maps from E10.5 midbrain tissues, where Pitx1 is transcriptionally repressed. We did not observe any 3D changes at the Pitx1 locus in comparison to forelimb tissue, indicating that the forelimb configuration represents the inactive state of chromatin architecture at the locus (Figure S3B).
Figure 4. Tissue-specific 3D chromatin architecture constraints Pen and Pitx1 interaction.
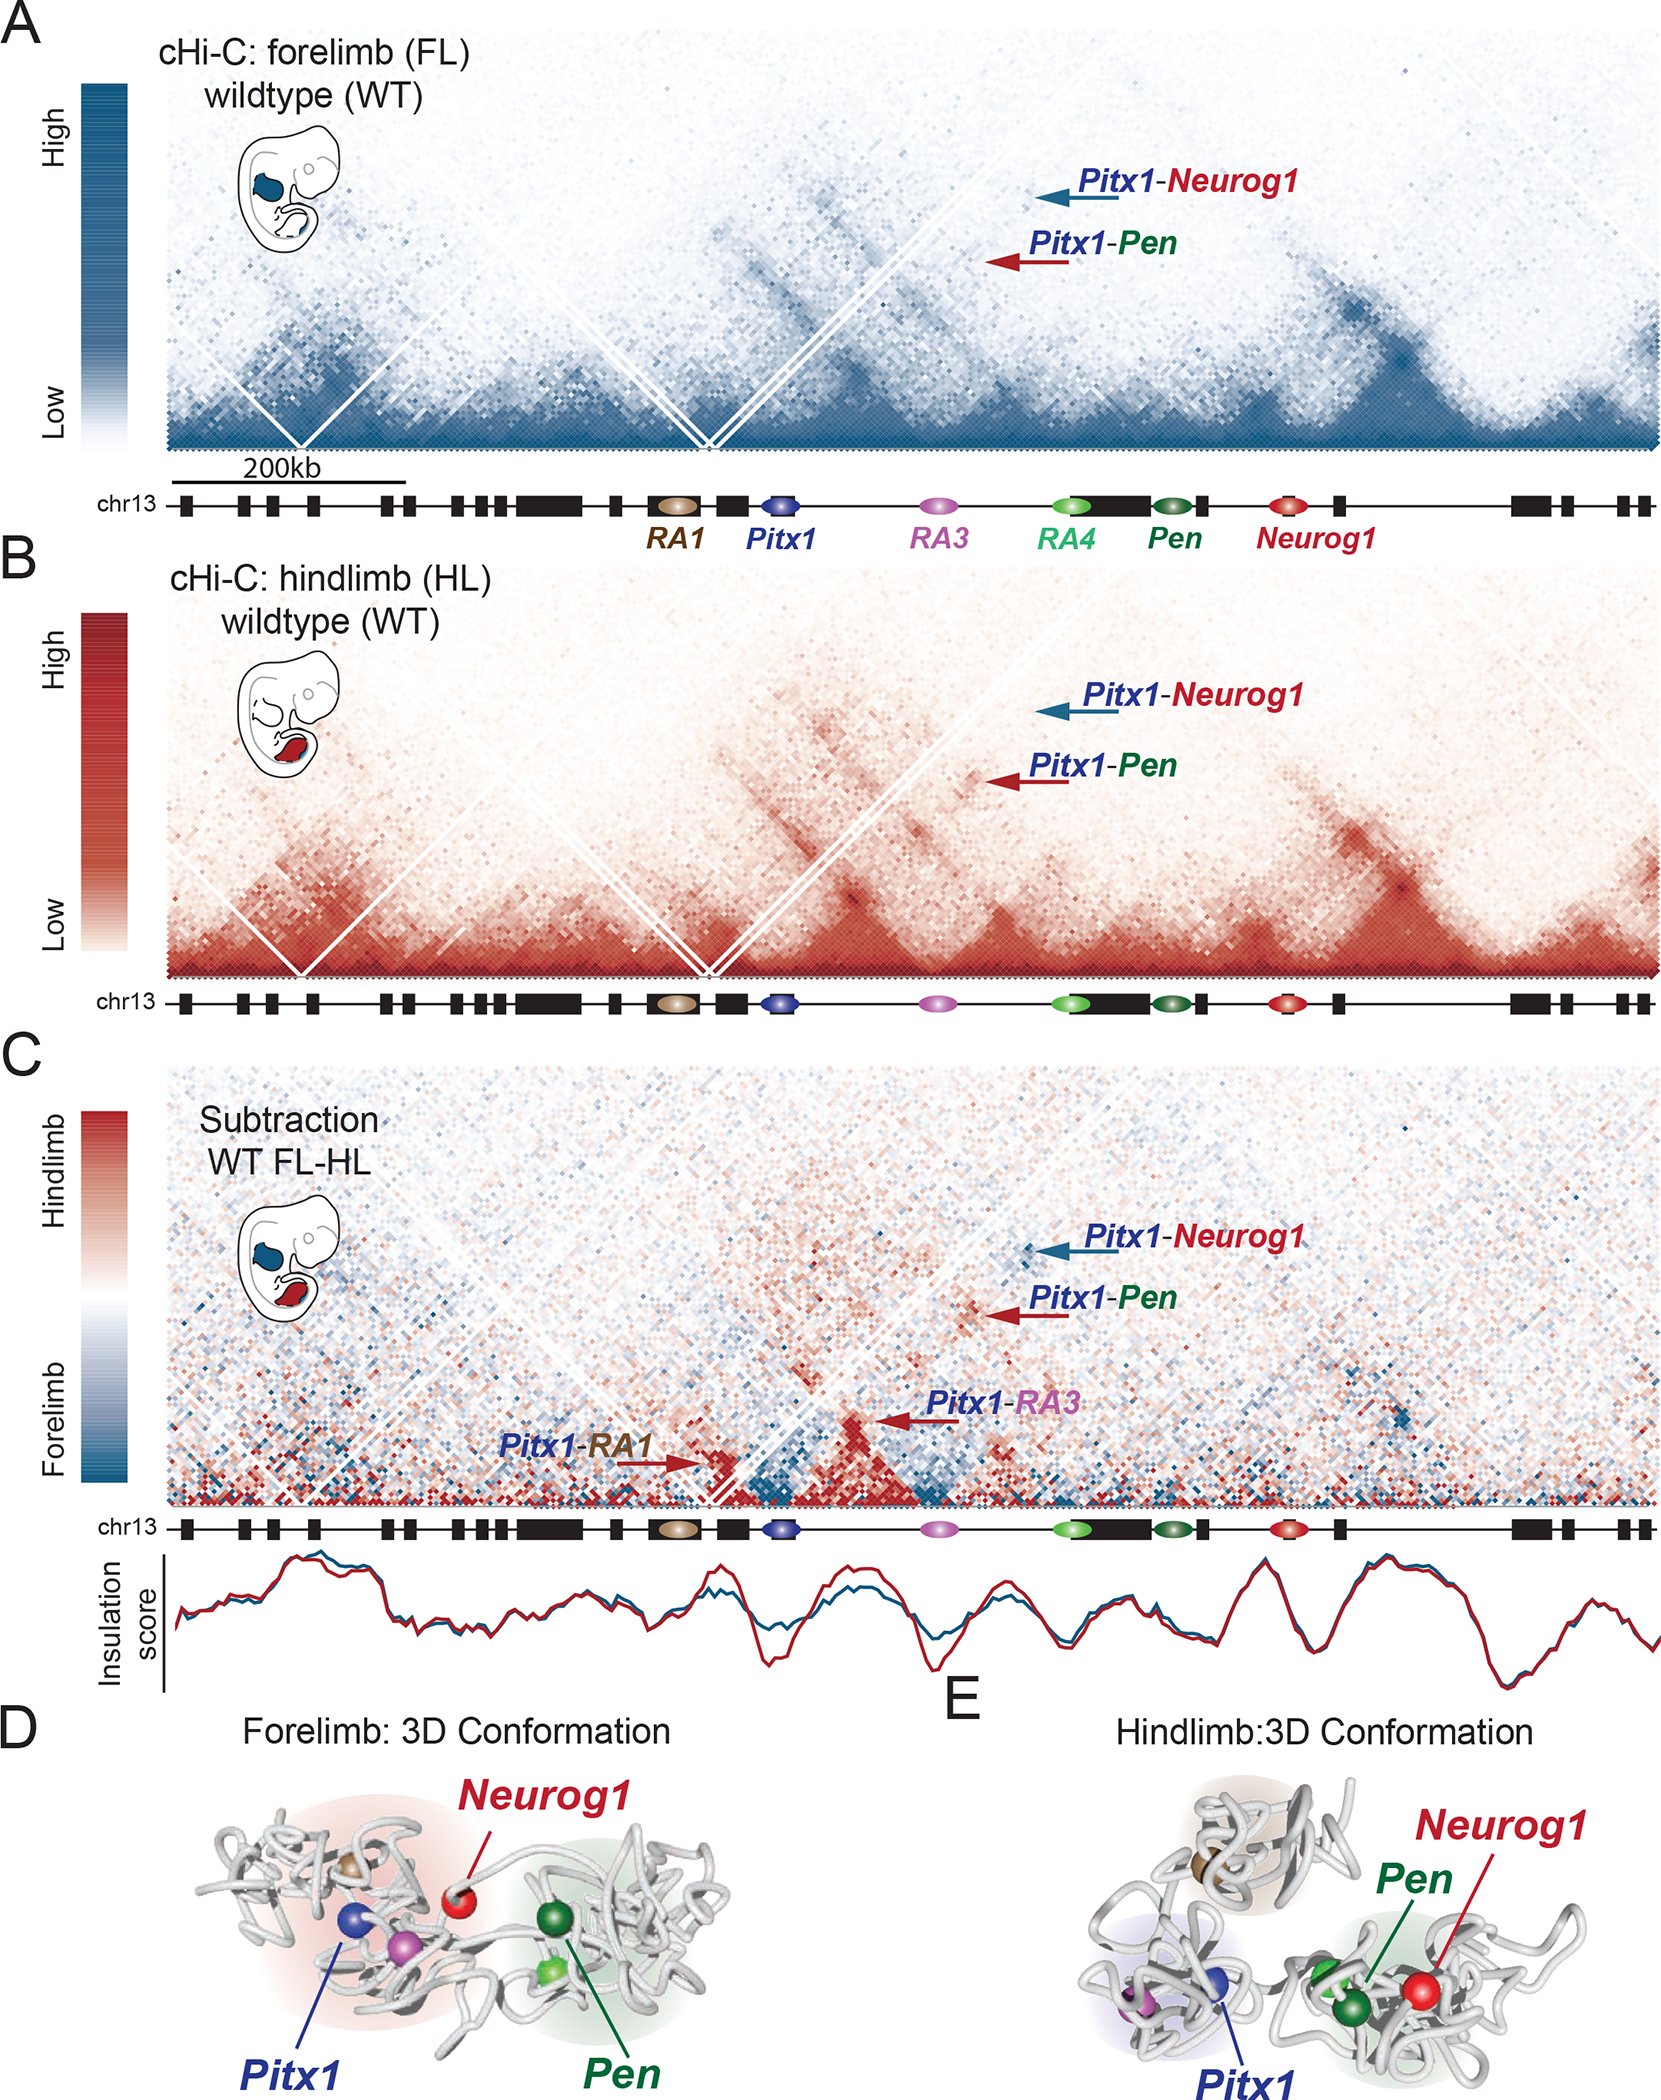
A. cHiC map of forelimb at E11.5 shows the presence of chromatin subdomains separated by the regulatory anchors. Pitx1 show moderate contacts with RA3, RA4, weak contacts with Pen (see red arrow) and a distal interaction with the Neurog1 region (see blue arrow). B. cHiC map of hindlimb at E11.5 display more condensed subdomains separated by the regulatory anchors. Pitx1 interacts strongly with RA3, RA4, and Pen (red arrow), and shows little interaction with the Neurog1 region (blue arrow). C. Top: cHiC subtraction between forelimb and hindlimb tissue at E11.5. Chromatin interactions more prevalent in forelimb or hindlimb tissues are shown in blue or red, respectively. The interaction between Pitx1-Neurog1 that is more prevalent in forelimbs is indicated with a blue arrow. Chromatin interactions between Pitx1-RA1, Pitx1-RA3, Pitx1-Pen that are more prevalent in hindlimb are indicated with red arrows. Below: Insulation score measuring insulation in hindlimb (red) and forelimb (blue). Note the increased insulation at RA1 and RA3 in hindlimbs. D. 3D-model of forelimb cHiC data showing segregation of the Pitx1 locus into two chromatin hubs containing 1) RA1, Pitx1, RA3, and Neurog1, and 2) RA4 and Pen. Note that Pen and Pitx1 are separated from each other. E. 3D-model of hindlimb cHiC data show a hindlimb-specific configuration of the Pitx1 locus into three chromatin hubs containing 1) RA1, 2) Pitx1 and RA3, and 3) RA4, Pen and Neurog1 (See also Video S1 and S2). Note the proximity between Pen and Pitx1.
To facilitate the interpretation of the cHiC data beyond two-dimensional interaction maps, we computed 3D-models of the Pitx1 locus conformation in fore- and hindlimb from cHiC data using a polymer physics-based conformation prediction approach (Figure S4) 24. High correlation between the modelled and experimental data as well as a subtraction map between forelimb and hindlimb model, showed that the model capture the essential of the chromatin structure (Figure S4 and S5). In forelimbs, the derived thermodynamic ensemble of 3D structures of the locus shows a separation into two major chromatin hubs, one containing Pitx1, RA3 and Neurog1, and another containing Pen and RA4 (Figure 4D, Video S1). Pitx1 and Pen are positioned on distal faces of their respective hubs, leaving Pitx1 in closer proximity to the repressed Neurog1 gene. In contrast, the hindlimb 3D model consists of three chromatin hubs containing 1) RA1, 2) Pitx1 with RA3, and 3) RA4 together with Pen and Neurog1 (Figure 4E). Distinct from the forelimb configuration, Pitx1 and Pen are physically closer and face each other on the surface of their respective chromatin hubs, whereas the repressed Neurog1 gene is comparatively farther from Pitx1 and Pen through its positioning on the hub’s opposing face (Figure 4E, Figure S5, S6, Video S2).
Taken together, these results show fundamentally different positioning of Pitx1 relative to the pan-limb enhancer Pen and Neurog1 in fore- and hindlimb. In the forelimb, Pitx1 is physically disconnected from the enhancer and associated with the repressed Neurog1 gene, consistent with lack of Pitx1 expression in forelimb. In the hindlimb, Pitx1 is in close vicinity of Pen, but segregated from the repressed Neurog1 gene. Thus, our findings reveal distinct tissue-specific 3D arrangements of the Pitx1 landscape effectively silencing Pen during forelimb development.
Hoxc genes control Pitx1 chromatin folding and transcription
We next aimed at identifying trans-acting factors that might contribute to the hindlimb-specific and thus active 3D chromatin configuration of the Pitx1 locus. Pitx1 itself displays an extremely restricted expression in early hindlimb buds and could participate in maintaining its own expression by establishing and sustaining the active 3D chromatin configuration through a positive feedback mechanism. However, homozygous Pitx1 frameshift loss-of-function mutation mice (Pitx1fs/fs) showed only a slight change in the interaction between Pitx1 and RA3 in mutant hindlimbs (Figure S7A). The marginal contribution of Pitx1 to the folding of its own locus in trans suggested the contribution of other putative upstream transcription factors. Posterior Hoxc genes (Hoxc9 to Hoxc11) are candidate regulators of Pitx1 transcription, as they are specifically expressed in the posterior lateral plate mesoderm at E9.5, from where hindlimb buds take their origin, and subsequently in hindlimb buds (Figure 5A, B). Moreover, ChIP-seq data of HOXC10 binding displays enrichment at Pitx1 itself as well as at the RA1, RA3 and Pen regions (Figure 5C) 25. We thus hypothesized that HOXC transcription factors might participate in the regulation/folding of the Pitx1 locus. To investigate this possibility, we engineered a deletion encompassing the entire HoxC cluster (HoxCdel/del). Consistent with previous reports, these mice had normal limbs 26, but showed a 36% reduction in Pitx1 expression in hindlimbs at E11.5 (Figure 5E and Figure S7B). Interaction maps of mutant versus wild-type hindlimbs exhibited a significant loss of interaction between Pitx1 and RA3 as well as between Pitx1 and Pen (Figure 5E and Figure S7B). These results suggest a multifactorial control of Pitx1 regulation and chromatin architecture involving HOXC proteins and likely other factors.
Figure 5. HoxC genes participate in Pitx1 hindlimb regulation.
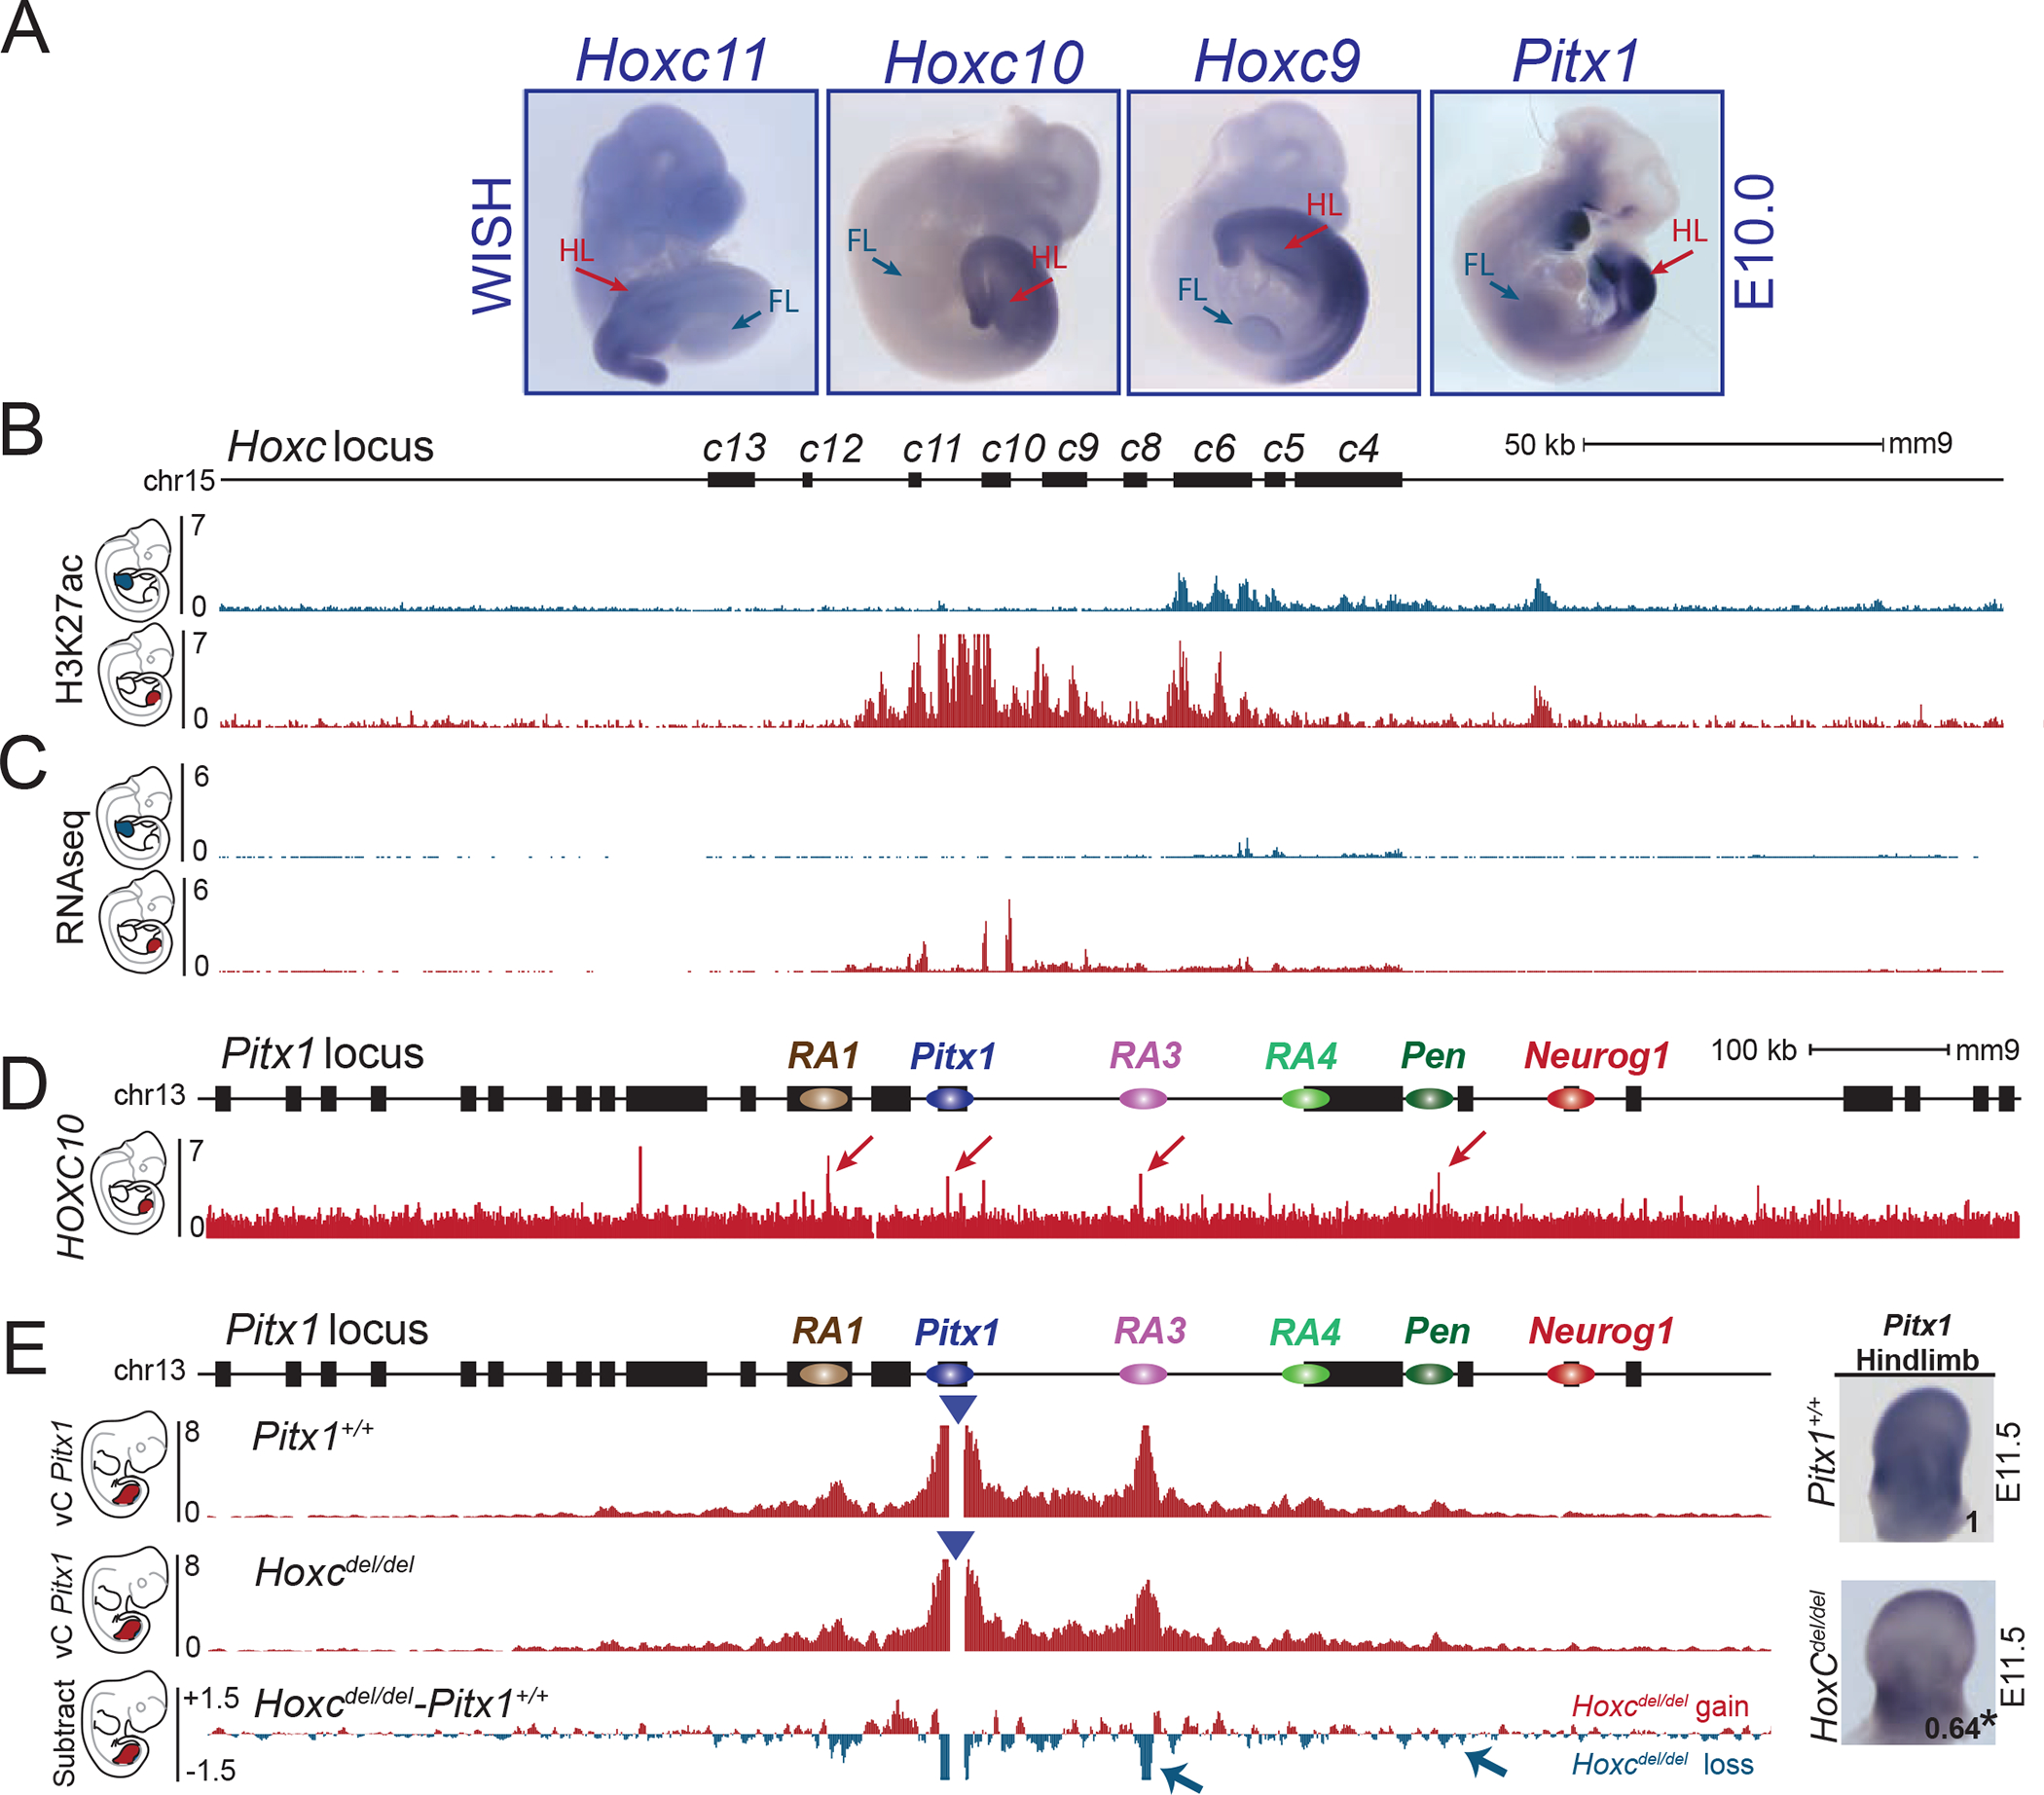
A. WISH of Hoxc11, Hoxc10, Hoxc9 and Pitx1 in E10.5 embryos (WISH were done at least two times per probe). Note the overlapping patterns of expression in lateral plate mesoderm and hindlimbs (HL) and absence of transcript in forelimbs (FL). B. ChIP-seq track for H3K27ac in E10.5 forelimbs (blue) and hindlimbs (red) shows the active state of posterior HoxC genes in hindlimbs and anterior HoxC genes in forelimbs. C. RNA-seq profile (RPKM) of E10.5 forelimb (blue) and hindlimb buds (red) showing expression of posterior HoxC genes in hindlimbs and anterior HoxC genes in forelimbs. D. ChIP-seq track of HOXC10 showing binding at RA1, Pitx1, RA3 and Pen (See red arrows) 25. E. cHiC in Hoxcdel/del hindlimb tissue at E11.5. Derived vC profiles using the Pitx1 viewpoint (blue triangle) shows a significant loss of chromatin interactions between Pitx1 and RA3 as well as Pitx1 and Pen (blue arrow, FDR=0.05). Right: WISH and qRT-PCR of Pitx1 in hindlimb bud shows reduced expression and significant 36% loss of mRNA expression (asterisk: we used a one-sided t-test to evaluate the significance of Pitx1 reduction and found a p-value= 0.02, n= 4 biologically independent wildtype and mutant hindlimb pairs). The number on the picture indicates the average of qRT-PCR fold change compare to wildtype (See figure S7B).
Altered chromatin folding induces Pitx1 endo-activation and limb malformations
To investigate if the inactive forelimb configuration can be converted to the active hindlimb state and induce Pitx1 transcription, we perturbed the 3D chromatin conformation of the locus. One of the major differences between fore- and hindlimb is the interaction of Pitx1 with the repressed gene Neurog1. To investigate the role of this interaction we first deleted the entire (45 kb) H3K27me3-enriched region surrounding Neurog1 (Neurog1del/del). This did not result in new chromatin interactions along the chromosome, nor did it result in an upregulation of Pitx1 in the forelimb (Figure S8A, B). Next, we deleted the other fragment involved in this repressive interaction: a 16kb region comprising the Pitx1 Polycomb repressive domain itself (Pitx1del/del). In order to detect any regulatory changes due to this deletion, we integrated a lacZ regulatory sensor in the RA3 region. In wildtype and mutant animals, the lacZ reporter activity did not show activity in forelimb, but only in hindlimb (Figure S8C). Therefore, the loss of Pitx1 itself is not sufficient to confer a forelimb activity of the regulatory landscape. Altogether, these results suggest that the repressive interaction between Pitx1 and Neurog1 in forelimb is not necessary to maintain the hindlimb restriction of Pen activity.
Next, we hypothesized that Pitx1 might be activated by inducing a hindlimb-like 3D configuration. This was achieved by inverting a 113 kb fragment containing Pen and RA4 (Pitx1inv1). In contrast to wild-type tissues, the 3D chromatin organization of the Pitx1 locus was nearly identical in fore- and hindlimb Pitx1inv1/inv1 embryos (Figure 6A, 6B and 6C). Subtraction between wildtype and Pitx1inv1/inv1 virtual capture-C (vC) from the Pitx1 viewpoint in forelimbs revealed several hallmarks of wildtype hindlimb architecture in Pitx1inv1/inv1 forelimbs: a gain of interaction between Pitx1, RA3, and Pen, as well as a diminished interaction with Neurog1 (Figure 6D). Furthermore, modelling of the Pitx1inv1 locus from forelimb cHiC data revealed a 3D conformation strikingly similar to the conformation of wildtype hindlimbs (Figure 6E, Figure S9, Video S3).
Figure 6. Ectopic Pitx1-Pen interaction, transcriptional endo-activation and limb malformation induced by chromatin mis-folding.
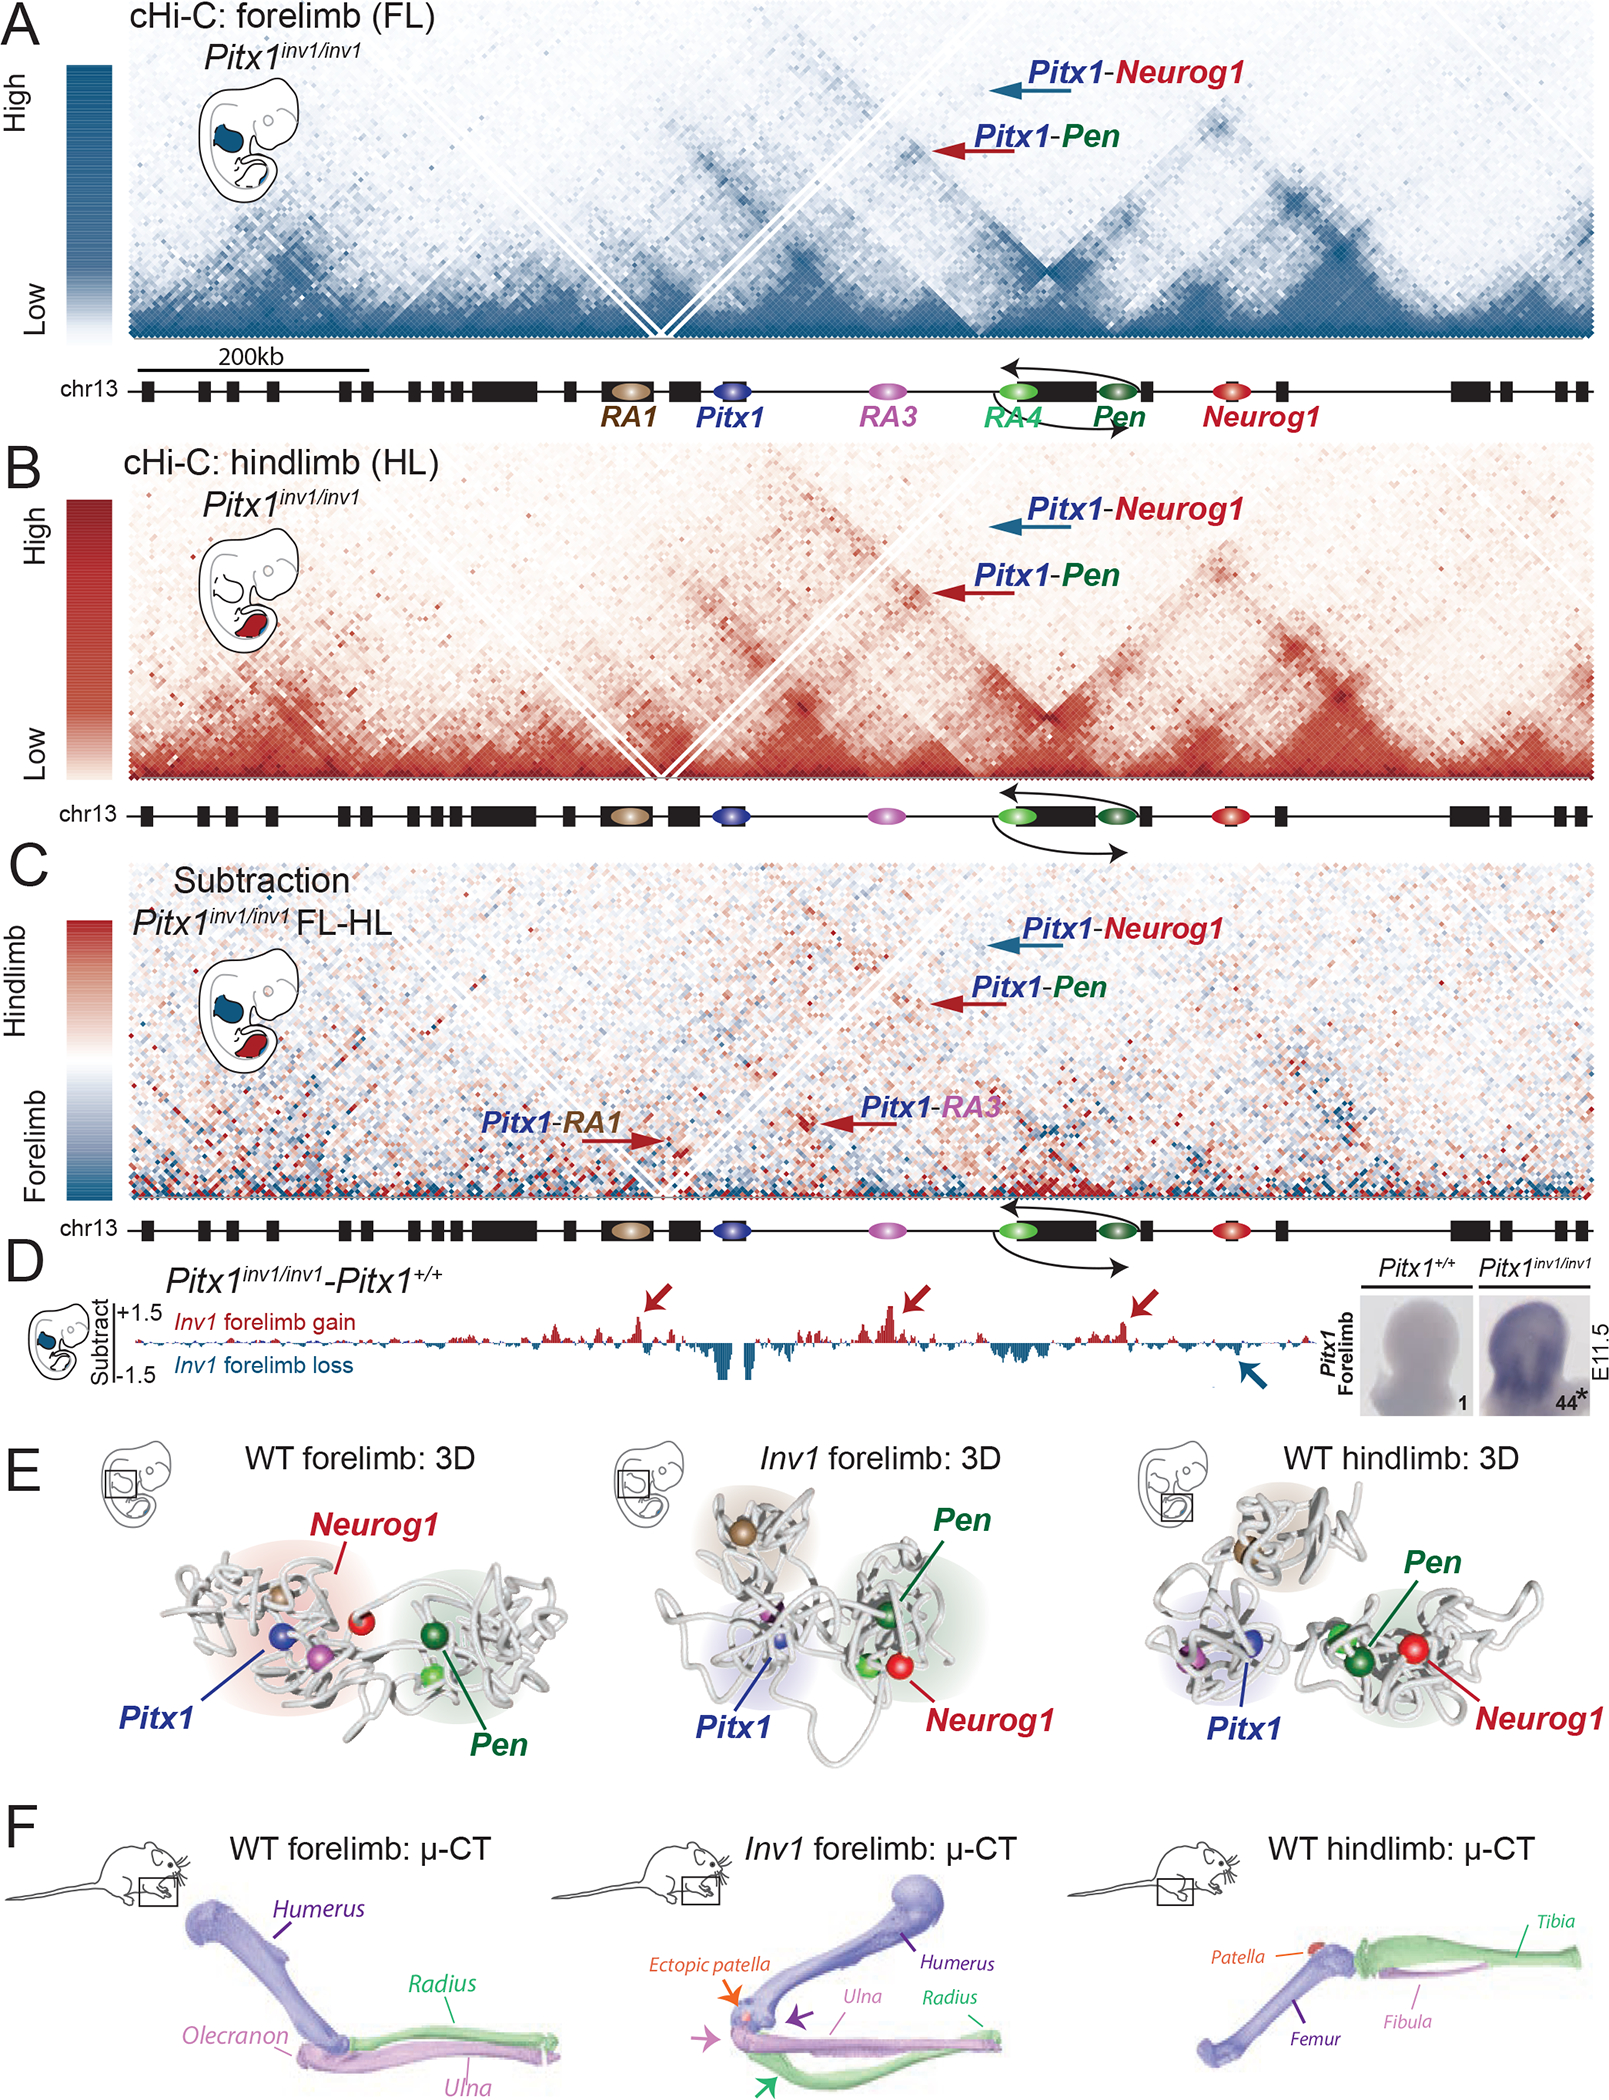
A. cHiC profiles of the Pitx1 locus in Pitx1inv1/inv1 forelimb mapped on wildtype genome. Note the absence of Pitx1-Neurog1 interaction (blue arrow) and the presence of a Pitx1-Pen interaction (red arrow). B. cHiC profiles of the Pitx1 locus in Pitx1inv1/inv1 hindlimbs C. Subtraction maps of Pitx1inv1/inv1 forelimbs and hindlimbs. Note the high similarity of 3D chromatin structure between both tissues in comparison to wild type animals (see Figure 4C). D. Left: subtraction of forelimb wildtpye and inv1/inv1 chromatin interactions show gain of interaction between Pitx1 with RA1, RA3, RA4 and Pen (red arrows) and loss of interaction with Neurog1 (blue arrow) in mutants. Right: WISH and qRT-PCR Pitx1 quantification forelimb tissue demonstrates a strong ectopic expression and 44-fold increase of mRNA expression (asterisk: we used a one-sided t-test to evaluate the significance of Pitx1 increase and found a p-value=1.8×10⁻⁷, n=4 biologically independent wildtype and mutant forelimb pairs; see figure S10A). E. 3D model of the Pitx1 locus conformation in wildtype forelimb, Pitx1inv1/inv1 forelimb and wildtype hindlimb. Note that Pitx1inv1/inv1 conformation is hindlimb-like. F. 20 Pitx1inv1/inv1 adult mice display malformed forelimbs and μCT revealed a distorted rotation of the elbow joint (purple arrow), a reduced olecranon (pink arrow), deformed ulna (green arrow), deformed radius as well as an ectopic patella (orange arrow).
In contrast to wildtype forelimbs, 3D models of the Pitx1inv1/inv1 locus architecture in forelimb showed the formation of three chromatin hubs and a closer proximity between Pen and RA4 to Pitx1, similarly to the hindlimb conformation. The chromatin structure of the Pitx1 locus in mutant limb tissues thus appeared to have adopted a constitutive hindlimb-like configuration. Pitx1inv1/inv1 forelimb buds displayed a 44-fold increase in Pitx1 expression at E11.5 (Figure 6D, Figure S10A). A similar forelimb expression change was also observed in Pitx1del2/del2 animals, in which the RA4 element is present, but not in Pitx1del3/del3 animals, in which it is deleted, thereby making a potential insulator function of the RA4 element unlikely (Figure S10B, C).
Pitx1inv1/inv1 adult mice displayed a partial homeotic arm-to-leg transformation, characterized by a reduction of the olecranon, loss of the deltoid crest, bowing of the radius and the presence of an ectopic patella in adult mice (Figure 6F). As a control, we inverted a slightly smaller genomic region (99 kb), which leaves Pen at its original location (Pitx1inv2, Figure S10D). Adult Pitx1inv2/inv2 mice had a normal skeleton (not shown) and did not show ectopic expression of Pitx1 in forelimbs at E11.5 (Figure S10D). This finding confirms the direct effect of the Pen element and its position on the mis-expression of Pitx1 in Pitx1inv1/inv1 embryos. Together, these results suggest that tissue-specific changes of the Pitx1 locus conformation modify the activity of the Pen enhancer, thus providing an additional layer of regulatory control.
Ectopic forelimb interaction between Pen and Pitx1 induce Liebenberg syndrome
Interestingly, the skeletal alterations observed in Pitx1inv1/inv1 mice resemble those in humans affected by Liebenberg syndrome (Figure 7A, B) 12,13. To further assess the possibility that the Liebenberg syndrome-associated structural mutations cause disruptions of the normal 3D architecture of the PITX1 locus, we re-engineered a human Liebenberg deletion in mice (Pitx1delL). This 99kb deletion spans the entire H2afy gene body, placing Pen at the relative position of RA4 similar to the situation in the inversion in Pitx1inv1 mice. Pitx1delL/+ forelimb buds show a 14-fold upregulation of Pitx1 at E11.5 (Figure 7C). Moreover, cHiC data of Pitx1delL/delL forelimbs demonstrate a mis-folding of the Pitx1 regulatory landscape, characterized by the gain of interaction between Pitx1 and Pen.
Figure 7. Liebenberg syndrome is caused by ectopic Pen-Pitx1 interactions.
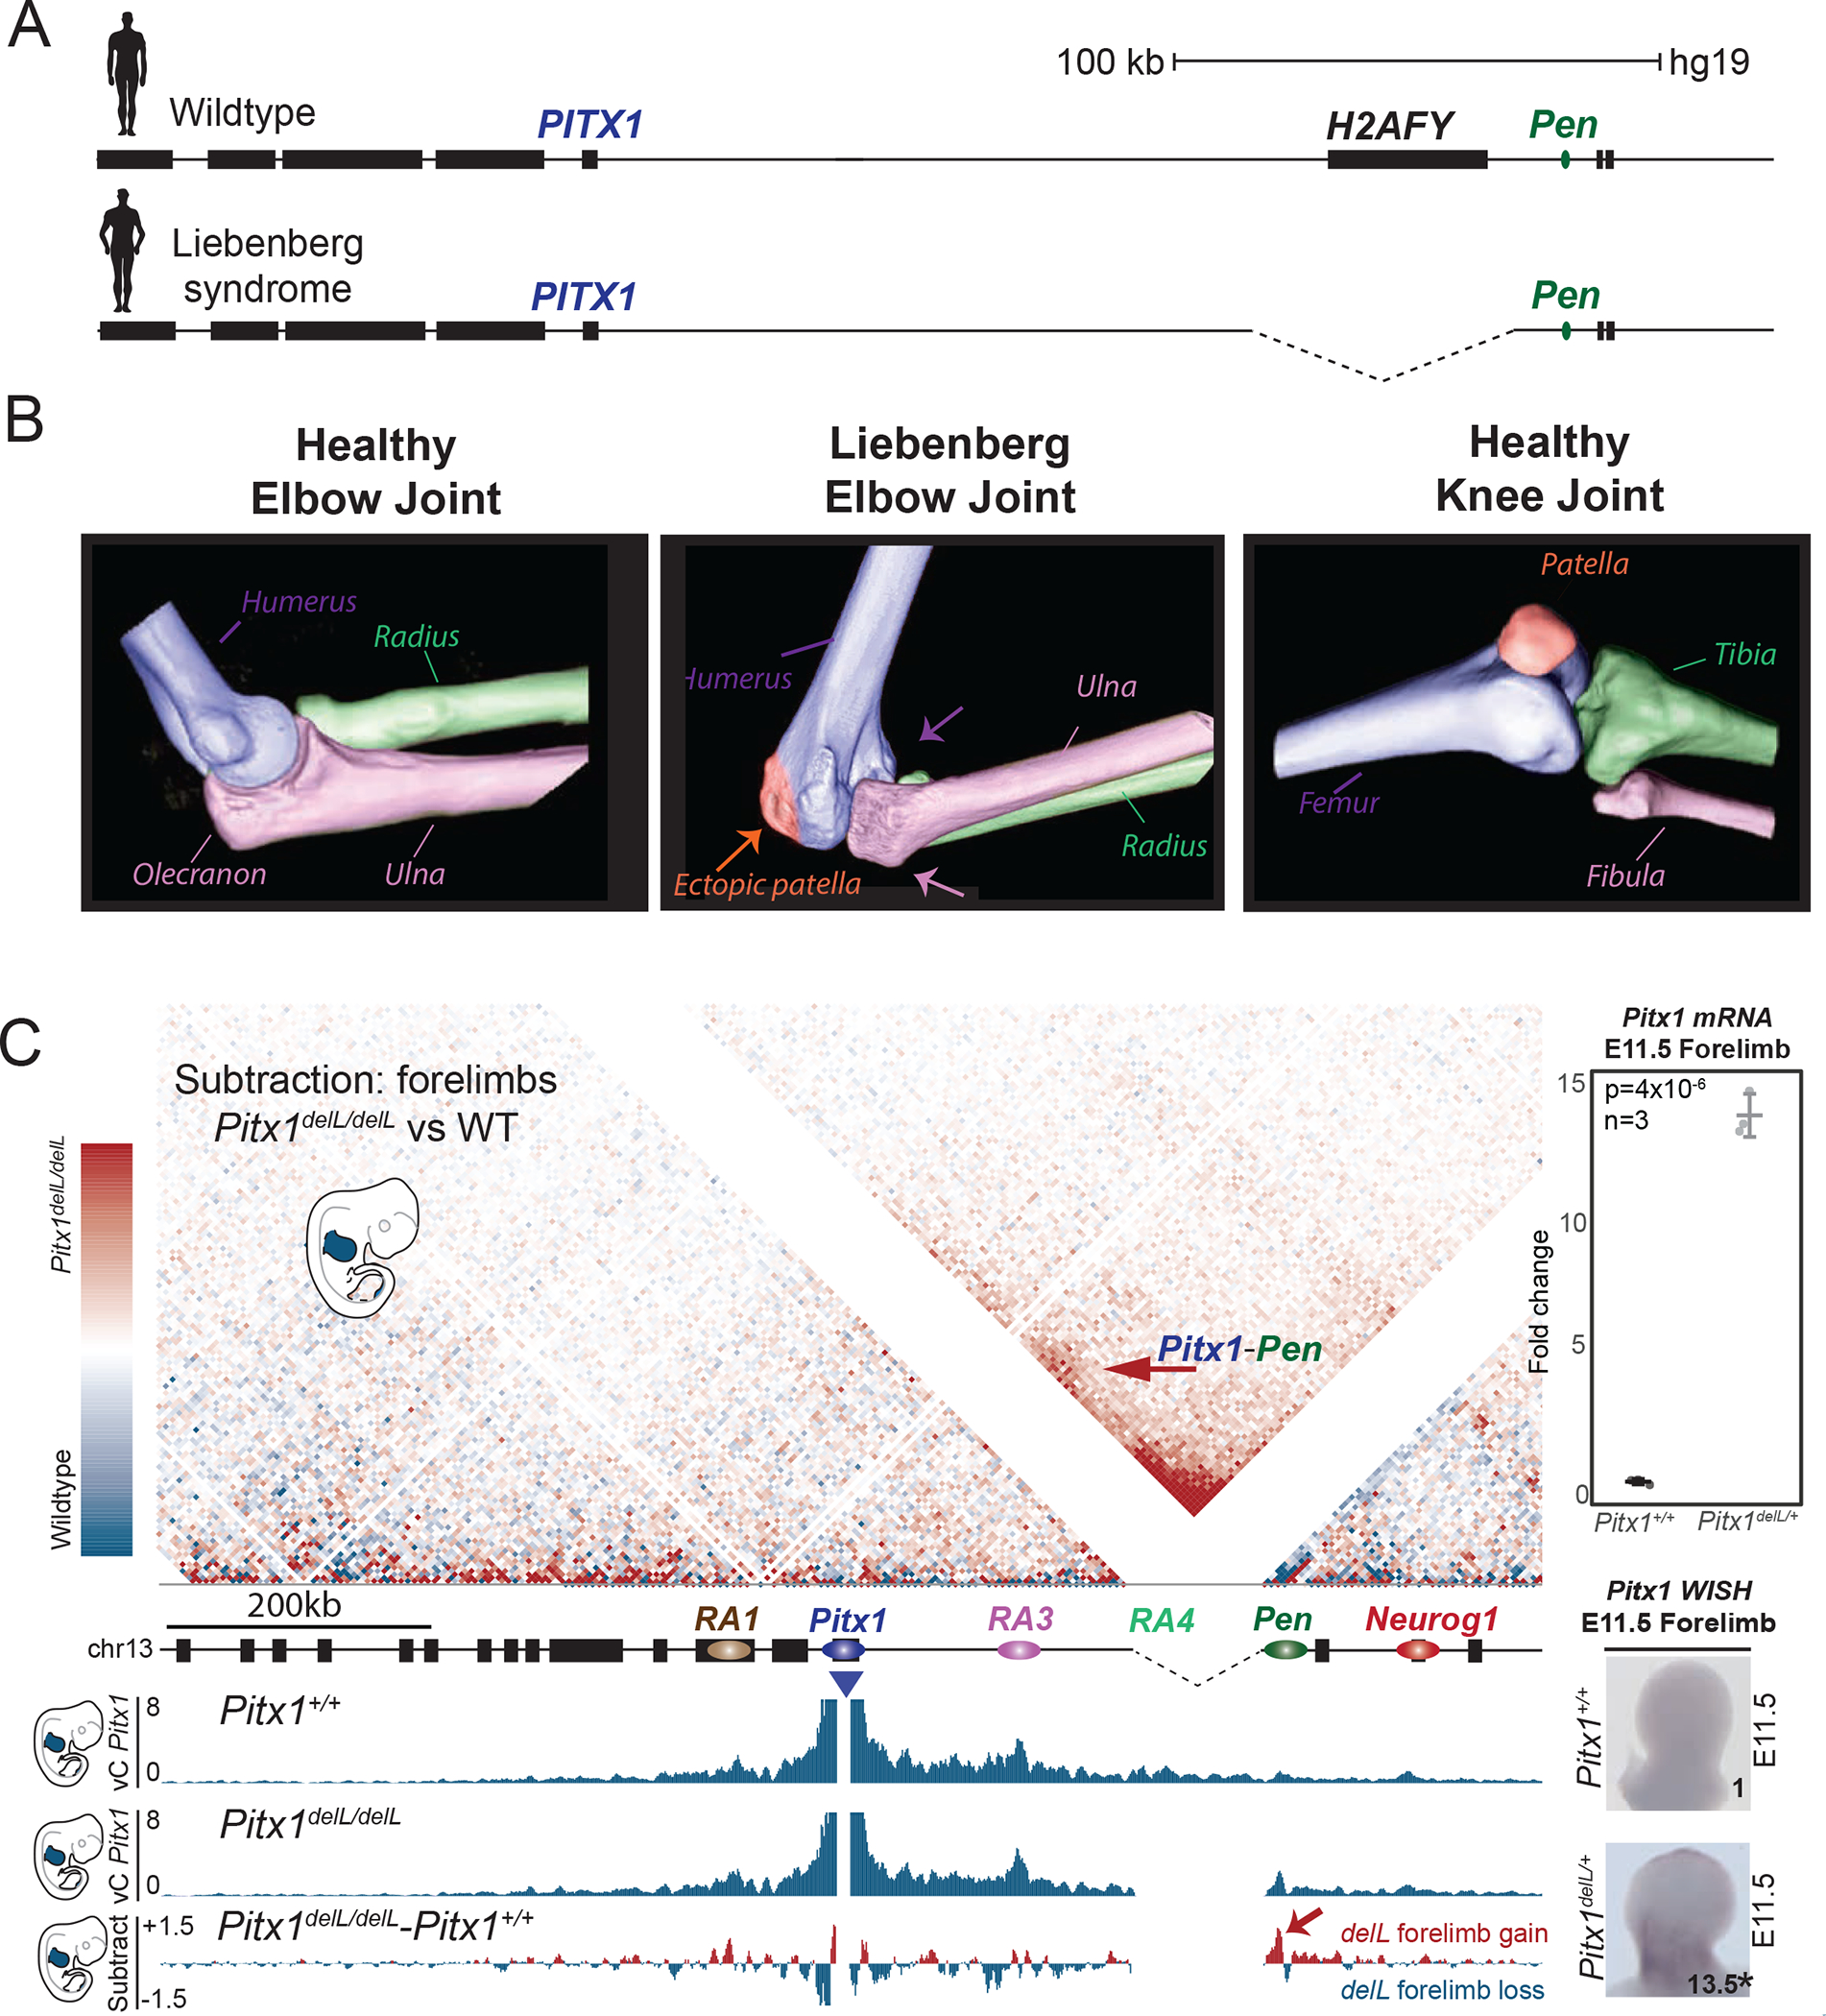
A. Liebenberg syndrome is caused by deletions at the PITX1 locus in human patients. B. 3D CT-scan of healthy human elbow joint, human Liebenberg syndrome elbow joint, and healthy human knee joint. Note that the Liebenberg elbow joint adopts morphologies of the knee-joint. C. The subtraction of wildtype and Pitx1delL/delL cHiC from forelimbs shows gain of interaction between Pitx1 with Pen (red arrow). vC profiles using Pitx1 as a viewpoint derived from cHiC in E11.5 wildtype and Pitx1delL/delL forelimb tissues and the subtraction of both tracks further show the gain of chromatin interaction with Pen (red arrow). Left: Pitx1 WISH and qRT-PCR of Pitx1delL/+ forelimb tissue showing a 13.5-fold ectopic expression (asterisk: we used a one-sided t-test to evaluate the significance of Pitx1 increase and found a p-value=4×10⁻⁶; the standard deviation is represented by error bars; the measure of centre is the average of the datapoints; n=3 biologically independent wildtype and mutant forelimb pairs).
These results offer a mechanistic explanation for the phenotype observed in Liebenberg syndrome. The partial arm-to-leg transformation observed in this human malformation is caused by pathogenic mis-expression of PITX1 in the forelimb/arm due to an altered 3D conformation of the locus that permits ectopic interactions between PITX1 and its endogenous Pen enhancer. We propose the term “regulatory endo-activation” for this phenomenon in which the lack of modulation of an endogenous enhancer by appropriate chromatin conformation causes the ectopic activation of a gene. Our results highlight the potential importance of enhancer activity modulation by chromatin structure for human disease.
DISCUSSION
In the present study, we show that the hindlimb-restricted gene Pitx1 is partially controlled by a regulatory element (Pen) that is active in fore- and hindlimbs. The required tissue specificity of the enhancer is facilitated by modifying its position in the 3D chromatin space. This change in chromatin configuration restricts the activity of Pen to hindlimbs by separating the enhancer from its cognate promoter in forelimbs (Figure 8). The effect of 3D chromatin conformation on the locus becomes evident in our cHiC maps and is clearly visible in our 3D simulations that demonstrate fundamentally different configurations in fore- vs. hindlimbs. The biological significance of this chromatin conformation is further exemplified by our finding that structural variations can convert the inactive 3D conformation of the forelimb into the active hindlimb-like conformation, and that it is sufficient to trigger Pitx1 expression and change the basic morphogenetic program of fore- vs. hindlimbs. However, it is important to note that in wildtype hindlimbs, the Pen enhancer only partially contributes to Pitx1 expression. It is thus unclear if its interaction with the Pitx1 promoter in hindlimbs occurs prior to Pitx1 transcriptional onset, hence acting as the sole determinant of Pitx1 activation, or if it is rather supporting a pre-existing, weaker activation of Pitx1 by uncharacterized enhancers.
Figure 8. Model.
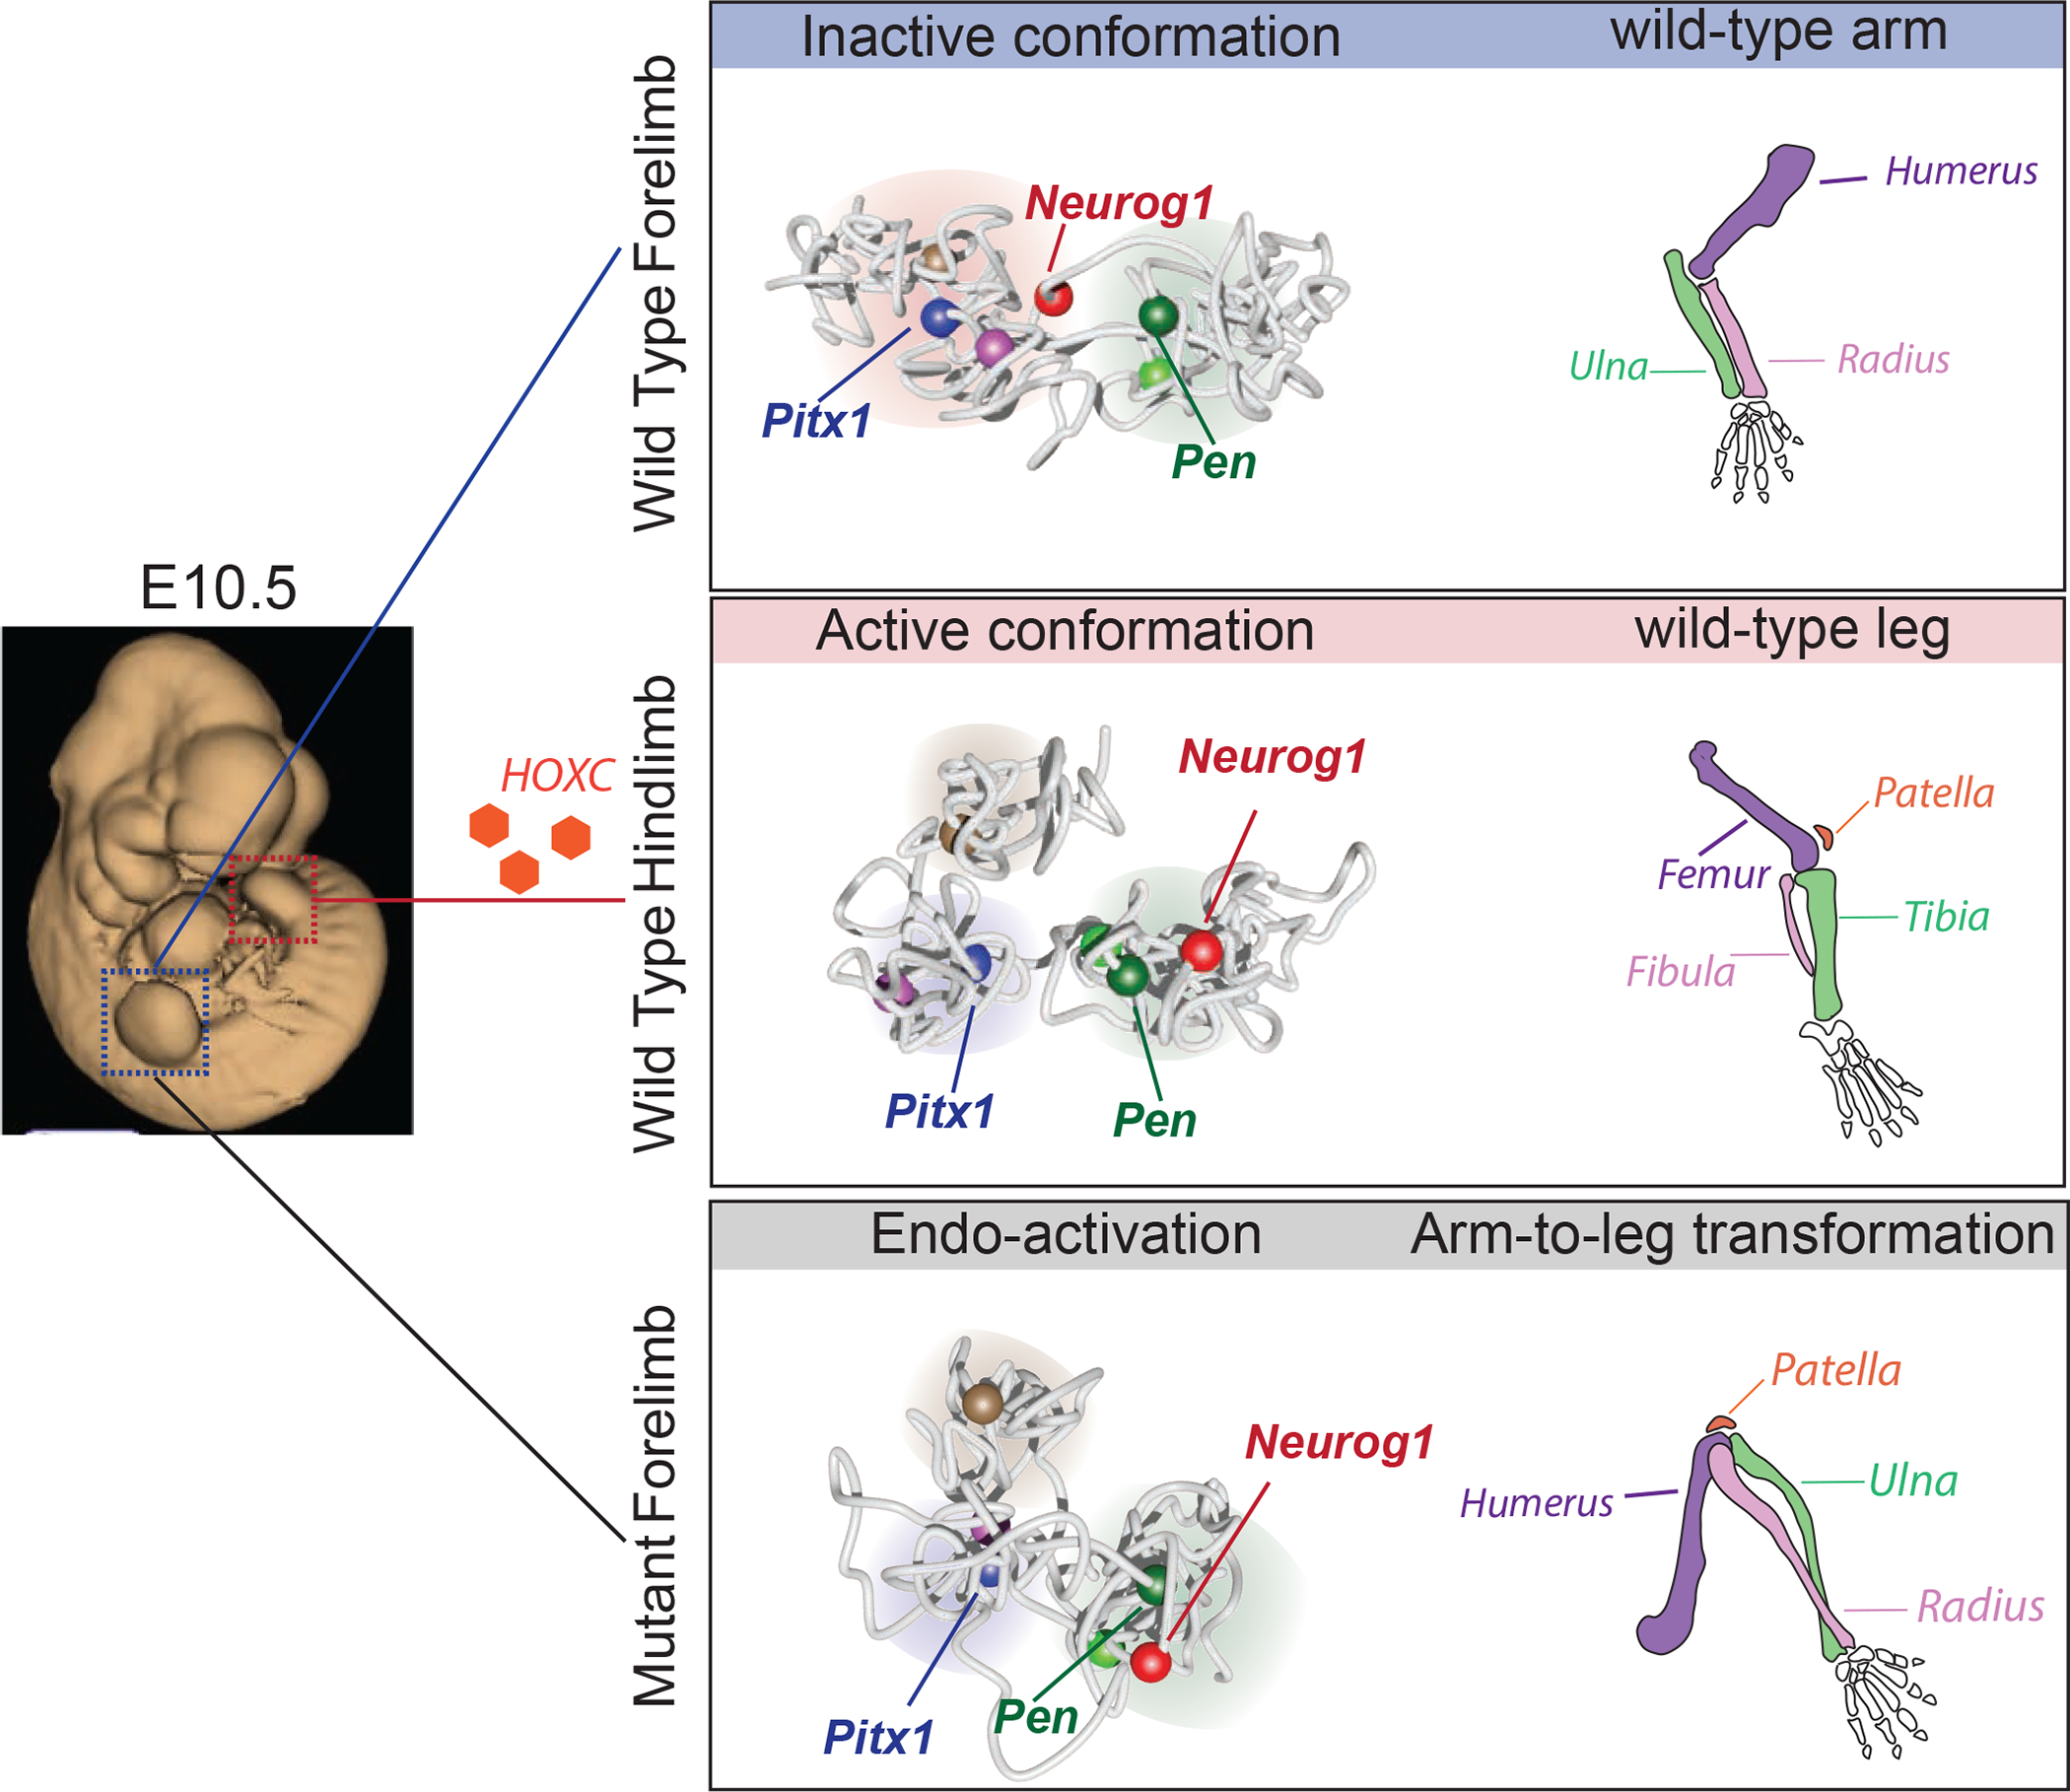
The Pitx1 locus can adopt several functional conformations. In E10.5 embryos (left), the forelimb and hindlimb buds appear morphologically similar. In forelimb tissues (upper panel), the Pitx1 locus adopts an inactive conformation, whereby Pitx1 interacts with the repressed Neurog1 gene and is disconnected from its active enhancer regions, including the pan-limb enhancer Pen. The absence of Pitx1 expression allows for the normal arm morphogenesis. In hindlimb tissues (middle panel), the Pitx1 locus adopts an active conformation, whereby Pitx1 is disconnected from the repressed Neurog1 gene, and is in close proximity with its active enhancer Pen. In hindlimb, upstream transcription factors such as HOXC (orange hexagons) are partially controlling the activity of the gene as well as the locus conformation. The expression of Pitx1 in hindlimb buds allows for normal leg morphogenesis. Finally, as a result of structural variants (lower panel), misfolding of the locus structure lead to Pitx1 endo-activation, specifically disconnecting Pitx1 from Neurog1 and taking on an active conformation allowing ectopic interactions with its active enhancer Pen. This regulatory endo-activation of Pitx1 in forelimbs results in a partial transformed morphogenesis in which the arms are partially transformed into legs.
It is well established that the spatiotemporal specificity and robustness of gene expression is achieved through the interaction of a gene’s promoter with several enhancers driving complementary or overlapping regulatory patterns 5,27,28. In this paradigm, multiple enhancer activities add up to produce the complex expression pattern of the target gene. However, the comparison of individual enhancer activities outside of their normal genetic context with their endogenous gene expression in vivo has revealed that subsets of enhancer activities are suppressed endogenously through uncharacterized regulatory processes 29,30. Furthermore, large-scale transgenic studies have shown that enhancer elements do not always match the expression patterns of their surrounding genes 17. In all of these cases, conformation-driven modulation of enhancer activity offers a potential explanation for the observed transcriptional patterns. Another intriguing possibility raised by our findings is that genes requiring strong transcriptional dynamics might take advantage of similar unspecific but potent enhancers to ensure robust and rapid transcriptional onset. In this theory, chromatin dynamics allows for the formation of poised transcriptional pockets containing all cis- and trans-components needed for robust transcriptional initiation, which could be activated near-instantaneously through a change in chromatin conformation. Our results indicate that dynamic 3D chromatin architecture can play a determinant role in modulating enhancer activities thereby ensuring transcriptional robustness.
To investigate possible mechanisms that control the active vs inactive chromatin state in the developing limb, we aimed at perturbing the interaction of Pitx1 in the forelimb with its Polycomb-repressed neighbour gene, Neurog1. This type of interaction has previously been shown to be mediated by Polycomb group proteins (PcG) 31,32. Our results, however, demonstrate that the disruption of the interaction itself is insufficient to trigger gene activation. In contrast, a rearrangement of the locus, placing Pen at the position of RA4 (Pitx1Inv1), resulted in Pitx1 transcriptional activation in forelimb tissue and loss of interaction with Neurog1, suggesting that this Polycomb-mediated interaction is a consequence of the Pitx1 transcriptional status.
Our results indicate that the 3D conformation directly impacts the specific regulation of gene expression, raising the question how this status is initiated and maintained. Searching for upstream factors we found that genes from the HoxC cluster partially control the hindlimb-specific 3D chromatin architecture of the Pitx1 locus as well as its transcription. Similarly, HOXA13 and HOXD13 transcription factors have been involved in setting tissue-specific chromatin interactions at the HoxD locus during distal limb development 33. HOX thereby arise as modulators of tissue-specific 3D chromatin architecture at downstream target loci. However, it remains unclear whether HOX proteins directly contribute to the 3D chromatin architecture or if they primarily control enhancer activities that in turn promote tissue-specific 3D chromatin folding.
In contrast to previous studies, in which structural variants (SVs) cause disease by altering chromatin architecture and insulation between neighbouring TADs 3,34, we describe a novel pathomechanism where SVs trigger the formation of an active chromatin structure leading to ectopic transcription and disease. Compared to established cases in which enhancers activate genes that are not their physiological targets 3,35,36, we show that in the Liebenberg-associated PITX1 alleles examined here, chromatin mis-folding permits the erroneous interaction between a gene and its endogenous, normally spatially sequestrated enhancer. To distinguish this process from previously described enhancer adoption scenarios, we propose the term “regulatory endo-activation” for this peculiar type of pathogenic dysregulation.
Several studies have implicated Pitx1 as a key factor in the morphological evolution of limbs in vertebrates. In all species investigated, the relationship between Pitx1 and H2afy is maintained. However, the linkage between Pitx1 and Neurog1 is lost in teleost fish, supporting the idea that this region was changed and/or gained function during the evolution of tetrapods (see Figure S11). The Pen enhancer is not found in fish but is present in all tetrapods (Figure S12). Interestingly, deletions encompassing this enhancer alter Pitx1 expression in certain pigeon breeds, which display a partial leg-to-wing homeotic transformation, evident from the appearance of leg feathers 37. In stickleback, the loss of pelvic structures has been attributed to regulatory mutations deleting a pelvic-specific enhancer (pel) of Pitx1 38,39. This enhancer, however, is distinct from Pen and is not present in other species (Figure S11). The stickleback pel enhancer is thus unlikely to be related to Pitx1 expression in tetrapods, predicting that the regulation of Pitx1 expression in hindlimbs arose via a different regulatory mechanism than that of pelvic fins. The presence of a pan-limb enhancer in tetrapods that is silenced via a specific type of three-dimensional genome architecture may suggest that the ancestral type of Pitx1 expression was not hindlimb-specific, but rather of the pan-limb type and that the development of morphologically distinct fore- and hindlimbs was a subsequent evolutionary event.
ONLINE METHODS
General experimental design and technical details can be found in the Life Sciences Reporting Summary online.
CELL CULTURE AND MICE
CRISPR-Cas9 Engineered Allelic Series
The Pitx1fs/+ mouse line was generated from ESCs with a heterozygote 31bp frameshift deletion in exon induced by the transfection a single sgRNA cloned in the pX459 vector 40. Mouse mutants with larger deletions or inversions were created using the adapted CRISPR-Cas9 method CRISVar 18. In brief, sgRNA targeting regions were designed using Benchling and the Zhang-lab online tool, and were selected in order to bear a minimal off target score (Supplemental Table 1). The sgRNA was cloned into the px459 vector (Addgene). The cell culture was done according to standard procedure 40: Day 1) MEF CD1 feeder cells seeded onto a 6-well plate. Day 2) 400,000 G4 ES cells were seeded for each transfection. Day 3) Two hours before transfection, the ESC medium without pen/strep was added. For transfection, a DNA mix consisting of 8 μg of each pX459-sgRNA vector was combined with 125 μl Optimem, and a transfection mix consisting of 25 μl FuGene HD (Promega) and 100 μl OptiMEM (Gibco), were combined and incubated at RT for 15 minutes before being added drop-wise onto the cells. Day 4) Three 6 cm dishes of DR4-puromycin resistant feeders were seeded for each transfection. Day 5) Targeted G4 cells were split onto three DR4 6 cm dishes and a 48-hour selection was initiated by adding puromycin to the ESC medium (final concentration 2μg/ml). Day 7) Selection was stopped and recovery initiated by using standard ESC medium. The recovery period was of ca. 4 days. Day 11) Individual clones (ca. 300 per construct) where picked from the plate and transferred into 96-well plates with CD1 feeders. After 3 days of culture, plates were split in triplicates, two for freezing and one for growth and DNA harvesting. Genotyping was performed by PCR and qPCR analyses.
ES and feeder cells were tested for mycoplasma contamination using Mycoalert detection kit (Lonza) and Mycoalert assay control set (Lonza).
CRISPR-Cas9 Knock-In of LacZ-Sensors
Transgenic mice carrying the LacZ-sensor were created as described above with the following changes. The LacZ-sensor targeting constructs were synthesised by VectorBuilder, whereby the vector contained the LacZ reporter gene together with 50bp of the β-globin promoter flanked by asymmetric homology arms of 750bp and 2 kb in size, respectively 41. The sgRNA was designed to hybridise to the genomic region corresponding to the 50 first base pairs of the homology arm (Supplemental Table 1). The corresponding region in the targeting vector was mutated to avoid undesired double strand breaks. For transfection, 4 μg of LacZ-sensor targeting construct was cotransfected with 8 μg of px459 encoding the sgRNA.
LacZ Enhancer Testing
For enhancer testing, candidate regions were selected on the basis of public tracks for conservation, H3K27ac chip-seq, DNase HS, and p300 ChIP-seq from 11.5 limbs 15,42. The FRT-flippase system was used as targeting strategy of the ES cell line C2 which has a PGK neomycin selection cassette flanked by frt sites and an ATG-less, promoterless hygromycin cassette targeted downstream of the Col1A1 locus 16. First, enhancer candidate regions of interest were amplified by PCR from mouse genomic DNA with NotI overhangs and subcloned into the pBluescript-LacZ vector linearised with NotI. Next the enhancer sequence with the LacZ cassette was cloned into a pGK targeting vector containing frt sites carrying the ATG needed for the puromycin resistance of the C2 cells. The transfection procedure was as follows: Day 1) CD1 feeders were seeded onto a 6 well plate. Day 2) 800,000 C2 cells were seeded onto the 6 well plate. Day 3) Cells were washed twice with PBS and 1.75 ml ES medium with LIF and without Pen/Step was added. The DNA mix consisting of 9 μg of targeting construct, 3 μg flippase-encoding vector, 1 μl LIPO-LTX Plus (ThermoFisher) tipped with OptiMEM (Gibco) up to 125 μl, and the transfection mix consisting of 20 μl Lipofectamine and 125 μl OptiMEM, were incubated separately at RT for 5 minutes, combined and further incubated at RT for 30 minutes. The transfection-DNA mix was added drop-wise onto the C2 cells. DR4 puromycin resistant feeder cells were seeded onto 6 cm dishes, three for each targeting construct. Day 4) Each transfected C2 well was split onto three DR4 feeder dishes. Day 5) Selection was started by using ESC medium containing hygromycin B (final concentration 150 μg/ml), and selection was continued until clones were picked and transferred into 96-well plates with CD-1 feeders. After 3 more days of culture, plates were split in triplicates, two for freezing and one for growth and DNA harvesting. Positive clones were thawed and grown on CD-1 feeders until they reach an average of four million cells. Three vials were frozen, and DNA was harvested from the rest of the cells for genotyping. An overview of tested enhancer candidate regions is listed in Figure S1A.
Aggregation of mESC
Embryos and live animals were generated from ESCs by diploid or tetraploid complementation, after thawing a frozen ESC vial seeded on CD1 feeders and grown for 2 days 43. Female mice of CD-1 strain were used as foster mothers. Several mouse lines were maintained by crossing them with C57BL6/J mice.
Animal Procedures
All animal procedures were in accordance with institutional, state, and government regulations (Berlin:LAGeSo G0247/13).
LacZ Reporter Staining
For whole mount LacZ reporter staining (44 with some adjustments), E11.5 mouse embryos were dissected in cold PBS, fixed in 4% paraformaldehyde (PFA) in PBS on ice for 30 min, followed by 3x washing with the LacZ buffer (2 mM MgCl2, 0.01% sodium deoxycholate, 0.02% Nonidet-40 in PBS). The embryos were then incubated in staining solution (0.5 mg/ml X-gal, 5 mM potassium ferrocyanide, 5 mM potassium ferricyanide in LacZ buffer) at 37°C for a few hours to overnight until the desired staining was obtained. After staining, embryos were washed in LacZ buffer and imaged using Zeiss Discovery V.12 microscope and Leica DFC420 digital camera. Embryos were stored at 4°C in 4% PFA in PBS.
RNA isolation and qRT-PCR
To quantify mRNA levels in wildtype and mutant mice, E11.5 forelimb or hindlimb buds were microdissected in cold PBS and immediately snap frozen and stored at −80°C. To isolate RNA, 500 μl TRIzol was added to the tissue and homogenised using a pestle. 100 μl chloroform was then added, the samples were pulse vortexed for 15 seconds and centrifuged at 4°C at 10000 RPM for 15 minutes. The supernatant was transferred to a new tube and mixed with 1 volume of 70% EtOH, and loaded onto a RNeasy Mini Kit (QIAGEN) column. The rest of the RNA isolation was done according to manufacturer instruction. cDNA was generated using the Superscript III™ First-Strand Synthesis System (Thermo Fisher Scientific) whereby 300 ng of RNA was reverse transcribed using random hexamer primers. To quantify the relative abundance of transcripts qRT-PCR analyses of 3–8 pairs of fore- or hindlimb bud pairs in technical triplicates was done using the GoTaq® qPCR Master Mix (Promega).
Whole-mount in situ hybridization
The Pitx1 mRNA expression in E11.5 mouse embryos was assessed by whole mount in situ hybridisation (WISH) using a digoxigenin-labeled Pitx1 antisense riboprobe transcribed from a cloned Pitx1 probe (PCR DIG Probe Synthesis Kit, Roche). Whole embryos were fixed overnight in 4% PFA/PBS. The embryos were washed in PBST (0.1% Tween), and dehydrated stepwise in 25%, 50% and 75% methanol/PBST and finally stored at −20°C in 100% methanol. The WISH protocol was as follows: Day 1) Embryos were rehydrated on ice in reverse methanol/PBST steps, washed in PBST, bleached in 6% H2O2/PBST for 1 hour and washed in PBST. Embryos were then treated in 10 μg/ml Proteinase K/PBST for 3 minutes, incubated in glycine/PBST, washed in PBST and finally re-fixed for 20 minutes with 4% PFA/PBS, 0.2% glutaraldehyde and 0.1% Tween 20. After further washing steps with PBST, embryos were incubated at 68°C in L1 buffer (50% deionised formamide, 5x SSC, 1% SDS, 0.1% Tween 20 in DEPC; pH 4.5) for 10 minutes. Next, embryos were incubated for 2 hours at 68°C in hybridisation buffer 1 (L1 with 0.1% tRNA and 0.05% heparin). Afterwards, embryos were incubated o.n. at 68°C in hybridisation buffer 2 (hybridisation buffer 1 with 0.1% tRNA and 0.05% heparin and 1:500 DIG-Pitx1 probe). Day 2) Removal of unbound probe was done through a series of washing steps 3×30 minutes each at 68°C: L1, L2 (50% deionised formamide, 2x SSC pH 4.5, 0.1% Tween 20 in DEPC; pH 4.5) and L3 (2x SSC pH 4.5, 0.1% Tween 20 in DEPC; pH 4.5). Subsequently, embryos were treated for 1 hour with RNase solution (0.1 M NaCl, 0.01 M Tris pH 7.5, 0.2% Tween 20, 100 μg/ml RNase A in H2O), followed by washing in TBST 1 (140mM NaCl, 2.7mM KCl, 25mM Tris-HCl, 1% Tween 20; pH 7.5). Next, embryos were blocked for 2 hours at RT in blocking solution (TBST 1 with 2% calf-serum and 0.2% BSA), followed by incubation at 4°C o.n. in blocking solution containing 1:5000 Anti-Digoxigenin-AP. Day 3) Removal of unbound antibody was done through a series of washing steps 8× 30 min at RT with TBST 2 (TBST with 0.1% Tween 20, and 0.05% levamisole/tetramisole) and left o.n. at 4°C. Day 4) Staining of the embryos was initiated by washing at RT with alkaline phosphatate buffer (0.02 M NaCl, 0.05 M MgCl2, 0.1% Tween 20, 0.1 M Tris-HCl, and 0.05% levamisole/tetramisole in H2O) 3× 20 minutes, followed by staining with BM Purple AP Substrate (Roche). Limb buds from at least three embryos were analysed from each mutant genotype. The stained limb buds were imaged using Zeiss Discovery V.12 microscope and Leica DFC420 digital camera.
Skeletal Preparation
E18.5 foetuses were processed and stained for bone and cartilage as described previously 45. Foetuses were kept in H2O for 1–2 hours at RT and heat shocked at 65°C for 1 minute. The skin was taken off and the abdominal and thoracic viscera were removed using forceps. The foetuses were then fixed in 100% ethanol overnight. The next day, the cartilage was stained overnight using alcian blue staining solution (150 mg/l alcian blue 8 GX in 80% ethanol and 20% acetic acid). On the third day, foetuses were rinsed and post-fixed in 100% ethanol overnight. On the fourth day, initial clearing was done by incubating the foetuses for 20 minutes in 1% KOH in H2O, followed by alizarin red (50mg/l alizarin red S in 0.2% KOH) staining of bones overnight. On the fifth day and onwards rinsing and clearing is done using low concentrations of KOH. The stained embryos were dissected in 80% glycerol and limbs were imaged using Zeiss Discovery V.12 microscope and Leica DFC420 digital camera.
Micro-computer Tomography
Limbs of control and mutant mice were wrapped in plastic film and scanned ex vivo using a Skyscan 1172 X-ray microtomography system (Brucker microCT, Belgium). The scanning was done with a 0.5mm Aluminium filter at 80kV and 120 μA at 10 μm resolution. 3D model reconstruction was done with the Skyscan image analysis software CT-Analyser and CT-volume (Brucker microCT, Belgium).
CAPTURE HI-C
SureSelect design
The cHiC SureSelect library was designed over the genomic interval (mm9, chr13: 54000001–57300000) using the SureDesign tool from Agilent.
Preparation of 3C-Library
3C-libraries were prepared from homozygous E11.5 forelimb and hindlimb buds as described previously 46. cHi-C experiments were performed as quadruplets (WT) or duplicates (mutants). Per biological replicate, 5–6 pairs of limb buds (ca. 3 ×10⁶ cells) were micro dissected in PBS at room temperature (RT). A single cell suspension was obtained by incubating the tissue in 500 μl Trypsin-EDTA 0.05 % (Gibco) at 37°C for 10 minutes shaking at 900 RPM. The cells were resuspended and homogenised using a 0.40 μm cell strainer (Falcon) and diluted in 10% FCS/PBS. Cells were fixed by adding 650 μl 37% formaldehyde (Sigma-Aldrich) with a final concentration of 2% and mixed for 10 minutes at room temperature. Fixation was quenched using 1.425 M glycine (Merck) on ice and immediately centrifuged at 260 g for 8 minutes. Supernatant was removed, the pellet resuspended in lysis buffer (final concentration of 10 mM Tris pH 7.5, 10 mM NaCl, 5 mM MgCl2, 0.1 M EGTA, and 1x Complete protease inhibitors (Roche)) and incubated on ice for 10 minutes. Removal of lysis buffer was done by centrifugation at 400 g for 5 minutes at 4°C, followed by removal of supernatant, snap-freezing and storage at −80°C. On the next day, the pellet was resuspended in 520 μl 1x DpnII buffer (Thermo Fisher Scientific), and incubated with 7.4 μl 20% SDS shaking at 900 RPM at 37°C for 1 hour. Next, 75 μl 20% x-100 Triton was added and left shaking at 900 RPM at 37°C for 1 hour. A 15 μl aliquot was taken as a control for undigested chromatin (stored at −20°C). The chromatin was digested using 40 μl 10 U/μl DpnII (Thermo Fisher Scientific) shaking at 900 RPM at 37°C for 6 hours. 40 μl of DpnII was added and samples were incubated overnight shaking at 900 RPM at 37°C. On the third day, 20 μl DpnII was added to the samples shaking 5 more hours at 900 RPM at 37°C. DpnII restriction enzyme was inactivated at 65°C for 25 minutes. A 50 μl aliquot was taken to test digestion efficiency (stored at −20°C). Next, the digested chromatin was diluted and re-ligated in 5.1 ml H2O, 700 μl 10x ligation buffer (Fermentas), 5 μl 30 U/μl T4-ligase (Fermentas), incubated at 16°C for 4 hours and shake manually 3 times. The ligated samples were incubated further 30 minutes at RT. The chimeric chromatin products and test aliquots were de-crosslinked o.n. by adding 30 μl and 5 μl Proteinase K, respectively, and incubated at 65°C overnight. On the fourth day, 30 μl or 5 μl of 10 mg/ml RNase was added to the samples and aliquots, respectively, and incubated for 45 minutes at 37°C. Next, chromatin was precipitated by adding 1 volume phenol-chloroform to the samples and aliquots, vigorously shaking them, followed by centrifugation at 4000 RPM at RT for 15 minutes. The upper phase containing the chromatin was transferred to a new tube. To the aliquots, 100% ethanol was added and the samples were frozen for 30 minutes, centrifuged at 5000 RPM for 45 minutes at 4°C, washed with 70% ethanol and resuspended in 20 μl 10 mM Tris-HCl pH 7.5. To the samples, 7 ml H2O, 1 ml 3M NaAc pH 5.6 and 35 ml 100% ethanol was added. The samples were frozen at −20°C for 3 hours. The precipitated chromatin was isolated by centrifugation at 5000 RPM for 45 minutes at 4°C. The chromatin pellet was washed with 70% ethanol, and further centrifuged at 5000 RPM for 15 minutes at 4°C. Finally, the 3C-library chromatin pellet was dried at RT and resuspended in 10 mM Tris-HCl pH 7.5. To check the 3C-library, 600ng was loaded on a 1% gel together with the undigested and digested aliquots. The 3C-library was then sheared using a Covaris sonicator (duty cycle: 10%, intensity: 5, cycles per burst: 200, time: 6 cycles of 60 s each, set mode: frequency sweeping, temperature: 4 to 7 °C). Adaptors were added to the sheared DNA and amplified according to Agilent instructions for Illumina sequencing. The library was hybridized to the custom-designed sure-select beads and indexed for sequencing (50 to 100 bp paired-end) following Agilent instructions.
QUANTIFICATION AND STATISTICAL ANALYSIS
qRT-PCR Analysis
The double delta Ct method 47 was used to calculate fold change between wildtype and mutant samples. In forelimb we tested, using one-tailed student’s t-test, the ability of mutations (Pitx1del2/del2, Pitx1del3/del3, Pitx1inv1/inv2, Pitx1delL/delL, Neurog1del/del) to result in an increased gene expression. In contrast, in hindlimb we tested the ability of mutations (Pitx1del1/del1, Pitx1del2/del2, Pitx1del3/del3, Pitx1Pen/Pen, HoxCdel/del) to result in a decreased Pitx1 gene expression. The variance in mutants and wildtype samples was assumed to be equal. Individual qRT-PCR datapoints are shown in Supplemental Table S2.
Hi-C Analysis
Preprocessing and mapping of paired-end sequencing data, as well as filtering of mapped di-tags was performed with the HiCUP pipeline v.0.5.8 48 (Nofill: 1, no size selection, Format: Sanger). The pipeline used Bowtie2 v.2.2.6 49 for mapping short reads to reference genome (NCBI37/mm9). Replicates were combined after mapping and filtering. Filtered di-tags were further processed with Juicer tools to bin di-tags (5 and 10 kb bins) and to normalize the map by Knight-Ruiz (KR) matrix balancing 50–52. For this, only reads with a MAPQ ≥30 were considered. The DNA-capturing step enriches genomic region chr13:54,000,001–57,300,000 on mm9 leading to three different regimes in the cHi-C map: (i) enriched versus enriched, (ii) enriched versus non-enriched, and (iii) non-enriched versus non-enriched. For binning and normalization only di-tags in regime (i) were considered. Therefore di-tags were filtered for the enriched region and mm9 coordinates were shifted by 54,000,000 bp. For Juicer tools, a custom chromosome sizes file containing only the enriched region on chr13 (length 3,300,000 bp) was used. After binning and normalization, coordinates were shifted back to their original values. All maps were processed on the wildtype reference genome to work with the same genomic coordinates across all samples. To account for differences between maps in their distance dependent signal decay, maps were scaled pairwise by the sum of their sub-diagonals. Therefore, each sub-diagonal vector in one matrix is divided by its sum and multiplied by the average of the sums of both matrices. To normalize for sequencing depth, each map was additionally converted to reads per million (RPM). To avoid copy number biases, a region spanning all tested deletions (chr13:55,730,001–56,500,000) was not considered for the computation of scaling factors, for the diagonal normalization as well as for the RPM normalization. cHi-C maps of count values and subtraction maps were visualized as heat maps truncating all values above the 99-th percentile for visualization purposes. The percentile was determined from absolute values within the same region used for normalization.
Differential interactions
Differential interactions were determined from the pairwise subtraction of normalized maps. For diagonal and RPM normalization, as well as for the computation of p-values, individual regions spanning the corresponding deletions were excluded, i.e. chr13:56,140,001–56,260,000 for Pitx1delL and chr13:56,320,001–56,370,000 for Neurog1del. To avoid artefacts from KR normalization due to low coverage, maps were analysed on 10 kb resolution and a single row with very low coverage (chr1:54,450,001–54,460,000) was excluded. To account for the distance dependence of the magnitude of differences, each difference value was subtracted by the mean and divided by the standard deviation of the corresponding sub-diagonal. For the computation of mean and standard deviation per sub-diagonal, values above the 99.5-th percentile were not included. P-values for the z-transformed difference values were computed using a standard normal distribution and further corrected for multiple testing with false discovery rate 53. In histograms the distributions of z-scores do not fit the normal distribution perfectly, but show as well a bell-like shape.
Virtual Capture-C profiles
To obtain more fine-grained interaction profiles, we generated virtual Capture-C-like profiles based on the same filtered BAM files also used for the cHi-C maps and defined several virtual viewpoints of 10 kb size. A read pair was considered in the profile, when one mate mapped to the defined viewpoint region and the other one outside of it. Reads were counted per restriction fragment and binned further to a regular 1kb grid. In case a fragment spanned more than one bin, the count value was distributed proportionally to the overlaps. Afterwards, the profiles were smoothed by averaging over a sliding window of 5 bins. For coverage normalization the profiles were divided by sum of counts in the enriched region on chr13 and multiplied with 103. The region ± 5kb around the viewpoint as well as the regions chr13:56,140,001–56,260,000 for Pitx1delL and chr13:56,320,001–56,370,000 for Neurog1del were mutually excluded from the computation of the scaling factor in pairwise comparisons. The profiles were generated with custom Java code using htsjdk v1.139 (https://samtools.github.io/htsjdk/).
In the case of the del(Neur1) vC to wild type comparison, we created a chromosome-wide interaction profile instead of a profile for the enriched region only. Here we used a larger viewpoint region of 15kb (chr13: 55,925,001–55,940,000), spanning the entire H3K27me3-enriched region, to improve the coverage. Binning and scaling was performed as described above.
3D POLYMER MODELLING
The SBS polymer model -
To investigate the 3D structure of the Pitx1 locus, we employed the String & Binders Switch (SBS) model 54, a polymer physics model previously shown to well recapitulate FISH, Hi-C and GAM data 24,55–57. In the SBS a chromatin filament is represented as a self-avoiding chain of beads that include binding sites for diffusing molecular binders; the polymer folds spontaneously, under the laws of physics, as the binders can bridge and loop their cognate binding sites (see details in 24).
In each of the studied cases, forelimb (FL) and hindlimb (HL) tissues, and forelimb inv1 inversion, the specific SBS models for the Pitx1 locus were established by a Simulated Annealing (SA) optimization procedure 24 that finds the minimal number of different types of binding sites (different colours, in our notation) and their arrangement along the chain (Figure S4A, S4B, S9A) returning the best agreement between the corresponding cHi-C data (Figure S4C, S4D, S9B top panel) and the equilibrium pairwise contact map derived by the polymer model (Figure S4C, S4D, S9B bottom panel). Molecular Dynamics (MD) computer simulations are used to derive an ensemble of the model equilibrium 3D conformations.
Simulations details -
We modelled a broad genomic sequence encompassing the mouse Pitx1 regulatory region to avoid boundary effects and focused on chr13:55,600,000–56,650,000 (mm9). Based on cHiC interaction data (10kb resolution), we used a polymer chain of N=1785 beads. We run MD simulations via the LAMMPS software 58. The model interaction potentials derive from classical studies of polymer physics 59; in particular, the molar concentration of binders is c=135nmol/l, and the scale of the bead-binder interaction energy is Eint=1.0kBT and Eint=8.1kBT, corresponding respectively to the coil and globule conformational state of the polymer 24. The size σ of each bead of the polymer chain is approximately 17nm 24. All model and MD details are illustrated in 24.
In our MD simulations, the polymer initial states are self-avoiding walk (SAW) configurations, with the binders randomly distributed in the simulation volume, as in standard MD approaches 24,59. To minimize finite size effects, the simulation box is at least two times larger than the gyration radius of the SAW polymer and periodic boundary conditions are used. The initial configurations evolve up to 5×10⁸ time-steps to approach stationarity, as measured by the plateauing of the gyration radius and of the mechanical energy, and confirmed by the polymer scaling exponents 24. An ensemble of at least 102 different equilibrium configurations are derived by MD for each of the considered cases.
Contact matrices -
To test our models against experiments, we compared cHiC data against the average contact matrix computed from the ensemble of 3D polymer model conformations derived by MD. To compute the contact probability for all pairs of beads i and j, in each 3D conformation we count if i and j are in contact, i.e., if their physical distance rij is less than a threshold distance (see details in 24. To take into account cell population heterogeneity effects, i.e., the possibility that the locus could be in different states (coil/globule) in different cells, we consider the contact matrix of the coil/globule mixture that maximizes the Pearson correlation, r, with cHiC data 24. An 80%–20% mixture well describes all cases.
Correlation coefficients -
To account for genomic proximity effects, beyond the Pearson correlation coefficient, r, between model predicted and cHiC contact matrices, we also computed the distance corrected Pearson correlation coefficient, r’: that is the correlation between the two matrices where the average contact frequency, at each genomic distance, has been previously subtracted. The MD model v.s. cHiC Pearson correlation coefficient, r, is 0.98 in FL WT, 0.98 in HL WT, and 0.97 in the inv1 forelimb case (Figure S4C, S4D, S9B); whereas the distance-corrected correlation, r’, is 0.84 in FL WT, 0.82 in HL WT, and 0.74 in the inv1 FL case (here strong outliers above 90th percentile are excluded).
3D Modelling Results -
Our modelling results of the Pitx1 locus in HL, FL and in the Pitx1inv1/inv1 (inv1) FL case are summarized in Figure S4 and S9. Our polymer model of the locus involves 14 different types of binding sites, whose position and abundance along the genome in the three distinct considered cases is represented by the histograms shown in Figures S4A, S4B, S9A, where a different colour is associated to each type of binding site (similar colours in different cell types are used just to simplify the presentation). cHiC and model derived contacts maps are shown in Figures S4C, S4D, S9B. As illustrated by the comparatively high values of the Pearson, r, and distance corrected Pearson, r’, correlation coefficients (see above), chromatin contacts in the different samples are well captured by our 3D modelling. To further evaluate the accuracy of the 3D models, subtractions between the cHi-C and the SBS model derived contact matrices are shown in Figures S4E, S4F, S9C. Significant differences between experimental data and model are found in just a minor fraction of cases (below 5%) and are sparsely located within the contact matrices. Significance is established with respect to the 95th and 5th percentile of a conservative standard random control model made of contact matrices having bootstrapped diagonals. Our polymer model can also capture the major architectural changes between forelimb and hindlimb, as displayed in Figure S5, where the subtraction between fore- and hindlimb wild type SBS models is shown. Finally, figures S4G, S4H, S9D display, in each studied case, a representative 3D structure of the locus, selected from the ensemble of ‘single-cell’ model derived conformations.
Polymer 3D representation -
In Figures 4D–E and 6E, a single representative configuration of the Pitx1 locus in the globule state is shown for each different cell type; to better visualize the relative positions of Pitx1 and its RA’s, a coarse grained version of the simulated polymer is pictured. In Figure S4G, S4H, S9D instead, we show the entire polymer model. In all cases, the coordinates of each bead are interpolated with a smooth third-order polynomial splice curve. Figures are produced with POV-RAY (Persistence of Vision Pty. Ltd. 2004).
Relative physical distances -
Our polymer model allows to measure the physical distances between the regions of interest. The relative distance changes shown in Figure S6 are the ratio (dFL−dHL)/dFL of the distances in FL and HL (resp. dFL, dHL) among Pitx1 and its key regulatory regions (RAs) averaged over the discussed state mixture.
SEQUENCE ALIGNEMENT
The sequences and annotations of the extended Pitx1 locus from human, chicken, frog, stickleback, spotted gar and elephant shark were obtained from Ensembl and aligned using the mVista LAGAN program60. We used the following parameters: calc window: 100 bps; Min Cons Width: 100 bps; Cons Identity: 70%.
Supplementary Material
Acknowledgements
This study was supported by grants from the Deutsche Forschungsgemeinschaft (SP1532/2-1) to MS and SM as well as the Max Planck Foundation to SM. We thank Judith Fiedler, Niclas Engemann and Karol Macura from the transgenic facility, Norbert Brieske for the WISH, and Myriam Hochradel from the sequencing core facility of the MPIMG. GA was supported by an early and advanced postdoc mobility grant from the Swiss National Science Foundation (P300PA_160964, P2ELP3_151960). MN acknowledges grants from the NIH ID 1U54DK107977-01, CINECA ISCRA ID HP10CRTY8P, the Einstein BIH Fellowship Award, and computer resources from INFN, CINECA, and Scope at the University of Naples. A.V. was supported by National Institutes of Health grants R01HG003988, U54HG006997, R24HL123879 and UM1HL098166. Work at E.O. Lawrence Berkeley National Laboratory was performed under Department of Energy Contract DE-AC02-05CH11231, University of California.
Footnotes
Competing Interests
The authors declare no competing interests
URLs
Gene Expression Omnibus: https://www.ncbi.nlm.nih.gov/geo/, Zhang-lab design tool: http://crispr.mit.edu:8079/, Benchling: https://benchling.com/
Data Accessibility
Capture-HiC datasets generated for this study are available in the Gene Expression Omnibus (GEO) repository under the accession number GSE103676.
REFERENCES
- 1.Spitz F & Furlong EE Transcription factors: from enhancer binding to developmental control. Nat Rev Genet 13, 613–26 (2012). [DOI] [PubMed] [Google Scholar]
- 2.Spielmann M, Lupianez DG & Mundlos S Structural variation in the 3D genome. Nat Rev Genet (2018). [DOI] [PubMed] [Google Scholar]
- 3.Weischenfeldt J et al. Pan-cancer analysis of somatic copy-number alterations implicates IRS4 and IGF2 in enhancer hijacking. Nat Genet 49, 65–74 (2017). [DOI] [PMC free article] [PubMed] [Google Scholar]
- 4.Redin C et al. The genomic landscape of balanced cytogenetic abnormalities associated with human congenital anomalies. Nat Genet 49, 36–45 (2017). [DOI] [PMC free article] [PubMed] [Google Scholar]
- 5.de Laat W & Duboule D Topology of mammalian developmental enhancers and their regulatory landscapes. Nature 502, 499–506 (2013). [DOI] [PubMed] [Google Scholar]
- 6.Freire-Pritchett P et al. Global reorganisation of cis-regulatory units upon lineage commitment of human embryonic stem cells. Elife 6(2017). [DOI] [PMC free article] [PubMed] [Google Scholar]
- 7.Bonev B et al. Multiscale 3D Genome Rewiring during Mouse Neural Development. Cell 171, 557–572 e24 (2017). [DOI] [PMC free article] [PubMed] [Google Scholar]
- 8.DeLaurier A, Schweitzer R & Logan M Pitx1 determines the morphology of muscle, tendon, and bones of the hindlimb. Dev Biol 299, 22–34 (2006). [DOI] [PubMed] [Google Scholar]
- 9.Marcil A, Dumontier E, Chamberland M, Camper SA & Drouin J Pitx1 and Pitx2 are required for development of hindlimb buds. Development 130, 45–55 (2003). [DOI] [PubMed] [Google Scholar]
- 10.Lanctot C, Moreau A, Chamberland M, Tremblay ML & Drouin J Hindlimb patterning and mandible development require the Ptx1 gene. Development 126, 1805–10 (1999). [DOI] [PubMed] [Google Scholar]
- 11.Nemec S et al. Pitx1 directly modulates the core limb development program to implement hindlimb identity. Development (2017). [DOI] [PubMed] [Google Scholar]
- 12.Spielmann M et al. Homeotic arm-to-leg transformation associated with genomic rearrangements at the PITX1 locus. Am J Hum Genet 91, 629–35 (2012). [DOI] [PMC free article] [PubMed] [Google Scholar]
- 13.Al-Qattan MM, Al-Thunayan A, Alabdulkareem I & Al Balwi M Liebenberg syndrome is caused by a deletion upstream to the PITX1 gene resulting in transformation of the upper limbs to reflect lower limb characteristics. Gene 524, 65–71 (2013). [DOI] [PubMed] [Google Scholar]
- 14.Szeto DP, Ryan AK, O’Connell SM & Rosenfeld MG P-OTX: a PIT-1-interacting homeodomain factor expressed during anterior pituitary gland development. Proc Natl Acad Sci U S A 93, 7706–10 (1996). [DOI] [PMC free article] [PubMed] [Google Scholar]
- 15.Andrey G et al. Characterization of hundreds of regulatory landscapes in developing limbs reveals two regimes of chromatin folding. Genome Res 27, 223–233 (2017). [DOI] [PMC free article] [PubMed] [Google Scholar]
- 16.Beard C, Hochedlinger K, Plath K, Wutz A & Jaenisch R Efficient method to generate single-copy transgenic mice by site-specific integration in embryonic stem cells. Genesis 44, 23–8 (2006). [DOI] [PubMed] [Google Scholar]
- 17.Visel A, Minovitsky S, Dubchak I & Pennacchio LA VISTA Enhancer Browser--a database of tissue-specific human enhancers. Nucleic Acids Res 35, D88–92 (2007). [DOI] [PMC free article] [PubMed] [Google Scholar]
- 18.Kraft K et al. Deletions, Inversions, Duplications: Engineering of Structural Variants using CRISPR/Cas in Mice. Cell Rep (2015). [DOI] [PubMed] [Google Scholar]
- 19.Szeto DP et al. Role of the Bicoid-related homeodomain factor Pitx1 in specifying hindlimb morphogenesis and pituitary development. Genes Dev 13, 484–94 (1999). [DOI] [PMC free article] [PubMed] [Google Scholar]
- 20.Alvarado DM et al. Pitx1 haploinsufficiency causes clubfoot in humans and a clubfoot-like phenotype in mice. Hum Mol Genet 20, 3943–52 (2011). [DOI] [PMC free article] [PubMed] [Google Scholar]
- 21.Dixon JR et al. Topological domains in mammalian genomes identified by analysis of chromatin interactions. Nature 485, 376–80 (2012). [DOI] [PMC free article] [PubMed] [Google Scholar]
- 22.Rao SS et al. A 3D map of the human genome at kilobase resolution reveals principles of chromatin looping. Cell 159, 1665–80 (2014). [DOI] [PMC free article] [PubMed] [Google Scholar]
- 23.Crane E et al. Condensin-driven remodelling of X chromosome topology during dosage compensation. Nature 523, 240–4 (2015). [DOI] [PMC free article] [PubMed] [Google Scholar]
- 24.Bianco S et al. Polymer physics predicts the effects of structural variants on chromatin architecture. Nat Genet 50, 662–667 (2018). [DOI] [PubMed] [Google Scholar]
- 25.Jain D et al. Regulatory integration of Hox factor activity with T-box factors in limb development. Development 145(2018). [DOI] [PubMed] [Google Scholar]
- 26.Suemori H & Noguchi S Hox C cluster genes are dispensable for overall body plan of mouse embryonic development. Dev Biol 220, 333–42 (2000). [DOI] [PubMed] [Google Scholar]
- 27.Will AJ et al. Composition and dosage of a multipartite enhancer cluster control developmental expression of Ihh (Indian hedgehog). Nat Genet (2017). [DOI] [PMC free article] [PubMed] [Google Scholar]
- 28.Long HK, Prescott SL & Wysocka J Ever-Changing Landscapes: Transcriptional Enhancers in Development and Evolution. Cell 167, 1170–1187 (2016). [DOI] [PMC free article] [PubMed] [Google Scholar]
- 29.Symmons O & Spitz F From remote enhancers to gene regulation: charting the genome’s regulatory landscapes. Philos Trans R Soc Lond B Biol Sci 368, 20120358 (2013). [DOI] [PMC free article] [PubMed] [Google Scholar]
- 30.Ruf S et al. Large-scale analysis of the regulatory architecture of the mouse genome with a transposon-associated sensor. Nat Genet 43, 379–86 (2011). [DOI] [PubMed] [Google Scholar]
- 31.Schoenfelder S et al. Polycomb repressive complex PRC1 spatially constrains the mouse embryonic stem cell genome. Nat Genet 47, 1179–86 (2015). [DOI] [PMC free article] [PubMed] [Google Scholar]
- 32.Joshi O et al. Dynamic Reorganization of Extremely Long-Range Promoter-Promoter Interactions between Two States of Pluripotency. Cell Stem Cell 17, 748–57 (2015). [DOI] [PubMed] [Google Scholar]
- 33.Beccari L et al. A role for HOX13 proteins in the regulatory switch between TADs at the HoxD locus. Genes Dev 30, 1172–86 (2016). [DOI] [PMC free article] [PubMed] [Google Scholar]
- 34.Lupianez DG, Spielmann M & Mundlos S Breaking TADs: How Alterations of Chromatin Domains Result in Disease. Trends Genet 32, 225–37 (2016). [DOI] [PubMed] [Google Scholar]
- 35.Franke M et al. Formation of new chromatin domains determines pathogenicity of genomic duplications. Nature 538, 265–269 (2016). [DOI] [PubMed] [Google Scholar]
- 36.Lupianez DG et al. Disruptions of topological chromatin domains cause pathogenic rewiring of gene-enhancer interactions. Cell 161, 1012–25 (2015). [DOI] [PMC free article] [PubMed] [Google Scholar]
- 37.Domyan ET et al. Molecular shifts in limb identity underlie development of feathered feet in two domestic avian species. Elife 5, e12115 (2016). [DOI] [PMC free article] [PubMed] [Google Scholar]
- 38.Shapiro MD et al. Genetic and developmental basis of evolutionary pelvic reduction in threespine sticklebacks. Nature 428, 717–23 (2004). [DOI] [PubMed] [Google Scholar]
- 39.Chan YF et al. Adaptive evolution of pelvic reduction in sticklebacks by recurrent deletion of a Pitx1 enhancer. Science 327, 302–5 (2010). [DOI] [PMC free article] [PubMed] [Google Scholar]
METHODS-ONLY REFERENCES
- 40.Andrey G & Spielmann M CRISPR/Cas9 Genome Editing in Embryonic Stem Cells. Methods Mol Biol 1468, 221–34 (2017). [DOI] [PubMed] [Google Scholar]
- 41.Byrne SM, Ortiz L, Mali P, Aach J & Church GM Multi-kilobase homozygous targeted gene replacement in human induced pluripotent stem cells. Nucleic Acids Res 43, e21 (2015). [DOI] [PMC free article] [PubMed] [Google Scholar]
- 42.Visel A et al. ChIP-seq accurately predicts tissue-specific activity of enhancers. Nature 457, 854–8 (2009). [DOI] [PMC free article] [PubMed] [Google Scholar]
- 43.Artus J & Hadjantonakis AK Generation of chimeras by aggregation of embryonic stem cells with diploid or tetraploid mouse embryos. Methods Mol Biol 693, 37–56 (2011). [DOI] [PubMed] [Google Scholar]
- 44.Lobe CG et al. Z/AP, a double reporter for cre-mediated recombination. Dev Biol 208, 281–92 (1999). [DOI] [PubMed] [Google Scholar]
- 45.Mundlos S Skeletal morphogenesis. Methods Mol Biol 136, 61–70 (2000). [DOI] [PubMed] [Google Scholar]
- 46.Hagege H et al. Quantitative analysis of chromosome conformation capture assays (3C-qPCR). Nat Protoc 2, 1722–33 (2007). [DOI] [PubMed] [Google Scholar]
- 47.Livak KJ & Schmittgen TD Analysis of relative gene expression data using real-time quantitative PCR and the 2(T)(-Delta Delta C) method. Methods 25, 402–408 (2001). [DOI] [PubMed] [Google Scholar]
- 48.Wingett S et al. HiCUP: pipeline for mapping and processing Hi-C data. F1000Res 4, 1310 (2015). [DOI] [PMC free article] [PubMed] [Google Scholar]
- 49.Langmead B & Salzberg SL Fast gapped-read alignment with Bowtie 2. Nat Methods 9, 357–9 (2012). [DOI] [PMC free article] [PubMed] [Google Scholar]
- 50.Lieberman-Aiden E et al. Comprehensive mapping of long-range interactions reveals folding principles of the human genome. Science 326, 289–93 (2009). [DOI] [PMC free article] [PubMed] [Google Scholar]
- 51.Knight PA & Ruiz D A fast algorithm for matrix balancing. Ima Journal of Numerical Analysis 33, 1029–1047 (2013). [Google Scholar]
- 52.Durand NC et al. Juicer Provides a One-Click System for Analyzing Loop-Resolution Hi-C Experiments. Cell Syst 3, 95–8 (2016). [DOI] [PMC free article] [PubMed] [Google Scholar]
- 53.Benjamini Y & Hochberg Y Controlling the False Discovery Rate - a Practical and Powerful Approach to Multiple Testing. Journal of the Royal Statistical Society Series B-Methodological 57, 289–300 (1995). [Google Scholar]
- 54.Nicodemi M & Prisco A Thermodynamic pathways to genome spatial organization in the cell nucleus. Biophys J 96, 2168–77 (2009). [DOI] [PMC free article] [PubMed] [Google Scholar]
- 55.Beagrie RA et al. Complex multi-enhancer contacts captured by genome architecture mapping. Nature 543, 519–524 (2017). [DOI] [PMC free article] [PubMed] [Google Scholar]
- 56.Barbieri M et al. Complexity of chromatin folding is captured by the strings and binders switch model. Proc Natl Acad Sci U S A 109, 16173–8 (2012). [DOI] [PMC free article] [PubMed] [Google Scholar]
- 57.Barbieri M et al. Active and poised promoter states drive folding of the extended HoxB locus in mouse embryonic stem cells. Nat Struct Mol Biol 24, 515–524 (2017). [DOI] [PubMed] [Google Scholar]
- 58.Plimpton S Fast Parallel Algorithms for Short-Range Molecular-Dynamics. Journal of Computational Physics 117, 1–19 (1995). [Google Scholar]
- 59.Kremer K & Grest GS Dynamics of Entangled Linear Polymer Melts - a Molecular-Dynamics Simulation. Journal of Chemical Physics 92, 5057–5086 (1990). [Google Scholar]
- 60.Brudno M et al. LAGAN and Multi-LAGAN: efficient tools for large-scale multiple alignment of genomic DNA. Genome Res 13, 721–31 (2003). [DOI] [PMC free article] [PubMed] [Google Scholar]
Associated Data
This section collects any data citations, data availability statements, or supplementary materials included in this article.
Supplementary Materials
Data Availability Statement
Capture-HiC datasets generated for this study are available in the Gene Expression Omnibus (GEO) repository under the accession number GSE103676.