Abstract
67Zn solid-state NMR suffers from low sensitivity, limiting its ability to probe Zn2+ surrounding in MOFs. We report a breakthrough in overcoming challenges in 67Zn NMR. Combing new cryogenic MAS probe technology and performing NMR experiments at a high magnetic field results in remarkable signal enhancement, yielding enhanced information for MOF characterization.
Graphical Abstract
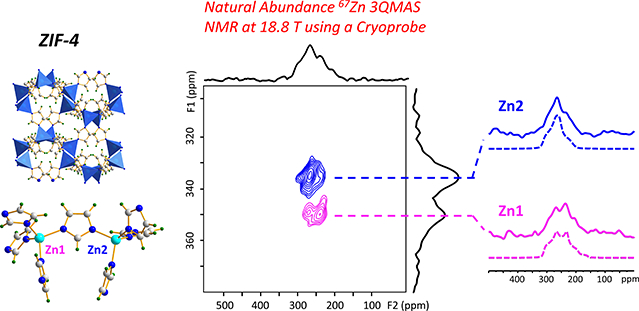
Combining cryogenic MAS probe and high magnetic field results in remarkable signal enhancement, permitting MOF characterization by 67Zn 3QMAS NMR at natural abundance.
Metal–organic frameworks (MOFs) are a new generation of porous materials with important applications. Characterization is crucial to improving performance of MOFs’ current use and designing new MOFs for targeted applications. Solid-state nuclear magnetic resonance (NMR) has been used for MOF characterization.1 Metal centers play key roles in MOF chemistry. The nature of and the local geometry around the metal ions influence framework topology, chemical/thermal stability and therefore MOF applications.2 Metal surroundings can be probed by solid-state NMR of metal ions to obtain the information specific to the metal of interest.3 However, for many metal ions in MOFs, their NMR-accessible nuclides are quadrupolar, presenting significant challenges as they suffer from the quadrupolar interaction, reducing sensitivity.4 Furthermore, for metal centers in many MOFs, their NMR active isotopes (67Zn, 25Mg, 91Zr, 47/49Ti, 43Ca etc.) are not only quadrupolar, but also unreceptive due to their low natural abundances and small gyromagnetic ratios (i.e. low γ). Their inherently unfavorable NMR properties often result in very low sensitivity, precluding useful NMR spectra for characterization from being acquired. One typical example is 67Zn. Zn2+ exists in numerous MOFs with diverse structures. From the hard and soft acid and base point of view, Zn2+ is a borderline acid.5 The intermediate nature allows Zn2+ to bind to a variety of donor atoms in various linkers. For example, Zn2+ can form Zn-O and Zn-N bonds, yielding numerous MOF-based materials such as isoreticular MOFs6a and metal azolate frameworks6b including zeolitic imidazolate frameworks (ZIFs)6c.
67Zn (nuclear spin I = 5/2), the only NMR-active isotope of zinc, is unreceptive and quadrupolar. It has a low γ, low natural abundance (4.1%), and a moderately sized nuclear quadrupole moment (122 mb7), resulting in very low sensitivity. Consequently, 67Zn NMR of solids is challenging.8 The sensitivity problems are further compounded by that MOFs have very low density, further diluting 67Zn concentration. Although possible9, the cost of isotopic labeling is often prohibitively high. Fortunately, significant progress has been made recently to address the sensitivity issue, an intrinsic problem of NMR.10 Among others, the availability of NMR instruments with ever higher magnetic field strengths has allowed the surroundings of zinc in MOFs to be characterized via natural abundance 67Zn 1D MAS and static NMR. 9,11
Many Zn-containing MOFs feature multiple chemically and crystallographically inequivalent Zn sites. The ability of resolving inequivalent sites by 67Zn solid-state NMR is important to verifying crystal structures of existing MOFs and solve the structures of new MOFs. Unfortunately, even at 35.2 T (the highest magnetic field available for chemists today12), simple 67Zn 1D MAS spectra often do not offer enough resolution to distinguish these sites. MQMAS13 has been the go-to technique for enhancing the spectral resolution of quadrupolar nuclei and is capable of resolving the signals overlapping in 1D MAS spectra. However, MQMAS demands high sensitivity and radio-frequency (rf) field, γB1 as the sensitivity and efficiency of this technique are inherently poor due to the filtration through multiple-quantum coherences.14 Therefore, MQMAS of unreceptive and low-γ quadrupolar nuclei including 67Zn has been difficult. To perform 67Zn 3QMAS experiments at natural abundance, new signal enhancement approaches/strategies are required. It has been shown that reducing the temperature of rf coil and preamplifier to cryogenic temperatures can reduce thermal noise and increase the signal-to-noise ratio (SNR) significantly.15 In addition, higher quality factor (Q) increases rf field, making cryogenic MAS probe more advantageous to MQMAS experiments.16 Recently, such a probe (CPMAS cryoprobe) has become commercially available, providing significant boost to the SNR by a factor of >3.15c, 17
In this work, we demonstrate that by using a CPMAS cryoprobe and performing NMR experiments at a high field of 18.8 T, natural abundance 67Zn 3QMAS spectra of two representative MOFs (ZIF-418 and microporous α- Zn3(HCOO)619) with multiple Zn sites in their unit cells were successfully obtained. For these materials, the inequivalent sites cannot be resolved in their respective 1D MAS spectra. But the signal enhancement achieved makes it possible to perform 67Zn 3QMAS experiments at natural abundance. The high SNR gained by reducing the probe electronic noise and sensitivity enhanced at high field along with the use of signal enhancement scheme such as double-frequency sweeps20 (DFS) allows very high resolution to be achieved via 3QMAS, permitting inequivalent Zn sites to be resolved. Note the 67Zn 1D MAS spectra of two MOFs at 21.1 T reported previously11c,11d are also included for discussion.
ZIF-4 is one of the most studied ZIFs with many applications. It crystallizes in the space group Pbca and has two crystallographically inequivalent tetrahedral Zn sites18 (Fig. 1a) with surroundings so similar that they cannot be resolved in 67Zn 1D MAS spectra even at 35.2 T (Fig. 2). Fig. 2 shows 67Zn 1D MAS spectra obtained (with sample at room temperature) at three high magnetic fields, 18.8, 21.1 and 35.2 T, respectively. The spectra at 35.2 and 21.1 T were acquired with conventional probes, whereas the spectrum at 18.8 T was obtained with a CPMAS cryoprobe. The overall linewidth decreases with increasing magnetic field strength because the second-order quadrupolar broadening decreases with increasing field. Since these 1D MAS spectra were measured at different facilities over a long period of time, their acquisition parameters are different (Table S1), which makes discussion about SNR only semi-quantitative. To negate differences in the spectral widths for comparison, we processed the spectra by truncating their FIDs to the same acquisition time (2.56 ms, the actual value at 18.8 T) before Fourier transformation. The SNR thus obtained for the spectra at 35.2, 21.1, and 18.8 T are 148, 20, and 41, respectively. Since the number of transients accumulated for the three spectra are different, the SNR was then scaled by the square root of the number of scans, yielding SNR/ of 0.54, 0.11 and 0.23 for the spectra acquired at 35.2, 21.1, and 18.8 T, respectively. There remain several factors which may affect the SNR, but cannot be mitigated post hoc via spectral processing or scaling (see the SI for discussion). Even with these complications, from the SNR/values above, it is clear that CPMAS cryoprobe and ultrahigh magnet technologies both provide significant signal enhancement for 67Zn.
Fig. 1.
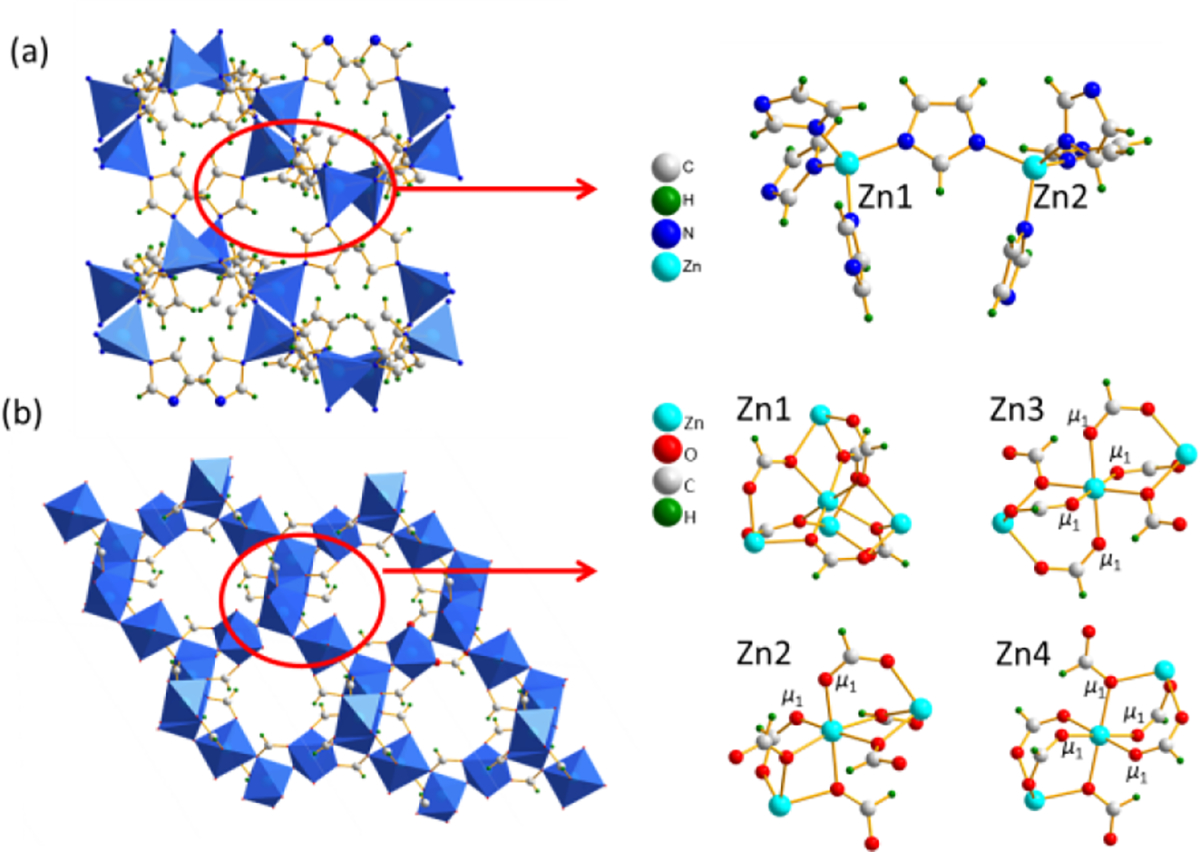
Illustration of the frameworks and Zn coordination environments of (a) ZIF-4 and (b) microporous α-Zn3(HCOO)6.
Fig. 2.
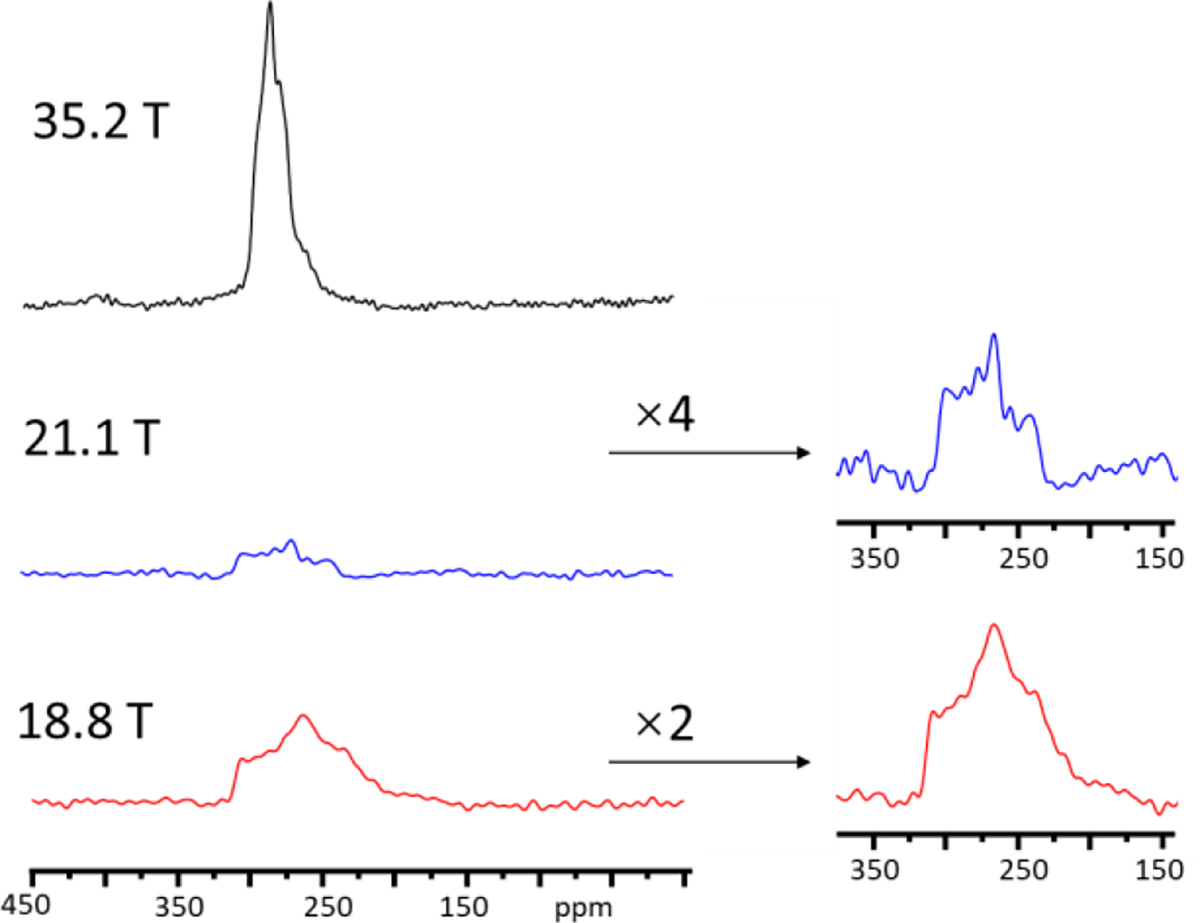
67Zn MAS spectra of ZIF-4 at three magnetic fields (see the text for spectral comparison).
From 1D MAS spectra, the number of Zn sites in this MOF is not immediately apparent. The previous work showed that the 67Zn 1D spectrum at 21.1 T could be simulated by two signals knowing there are two Zn sites.18 However, three 1D spectra could also be simulated with a single site (Fig. S3) although the fitting is not perfect. This is particularly obvious for the spectrum acquired at 35.2 T even though the increase in the field from 18.8 to 35.2 T leads to linewidth narrowing by a factor of 3.5 (in ppm). It appears that although the quadrupolar line broadening is drastically reduced at 35.2 T, the two sites have very similar isotropic shifts, resulting in overlapping signals inseparable in 1D spectra. Thus, for ZIF-4, resolving different Zn sites via simulation of 67Zn 1D MAS spectra without prior knowledge of the crystal structure is very difficult.
Acquiring a 67Zn 3QMAS spectrum at 21.1 T using a conventional probe was unsuccessful due to poor sensitivity and the low rf field of 7-mm coil used. Performing 3QMAS experiments at 35.2 T were also attempted. It was realized that even at this ultrahigh field, an extended period of time would still be needed for 3QMAS experiments due to low sensitivity. The field of this series-connected resistive/superconducting hybrid magnet needs to be brought up and down in the same day and magnet time is very limited. Therefore, 67Zn 3QMAS experiment at 35.2 T was not proceeded further.
Fortunately, a combination of using a CPMAS cryoprobe and performing 3QMAS experiments at 18.8 T yields high rf efficiency and signal sensitivity, allowing acquisition of a 67Zn 3QMAS spectrum of ZIF-4 at natural abundance (Fig. 3), where the two crystallographically inequivalent Zn sites are completely resolved, demonstrating that the significant gain in SNR and enhanced sensitivity makes enhanced spectral resolution possible via 3QMAS. The line-shapes of the two signals taken along the F2 cross-sections are well defined. Therefore, their CQ, ηQ, and δiso values were extracted by directly fitting the F2 cross sections. These values were then used as initial inputs for fitting the 1D MAS spectra for further refinement (see Table S3 for final NMR parameters). To assign the two resonances, plan-wave DFT calculations were performed on the extended periodic structure of ZIF-4. Based on the calculated CQ, the resonance with larger CQ (due to higher degree of distortion of the ZnN4 tetrahedron) is assigned to Zn1 (see the SI for detail).
Fig. 3.
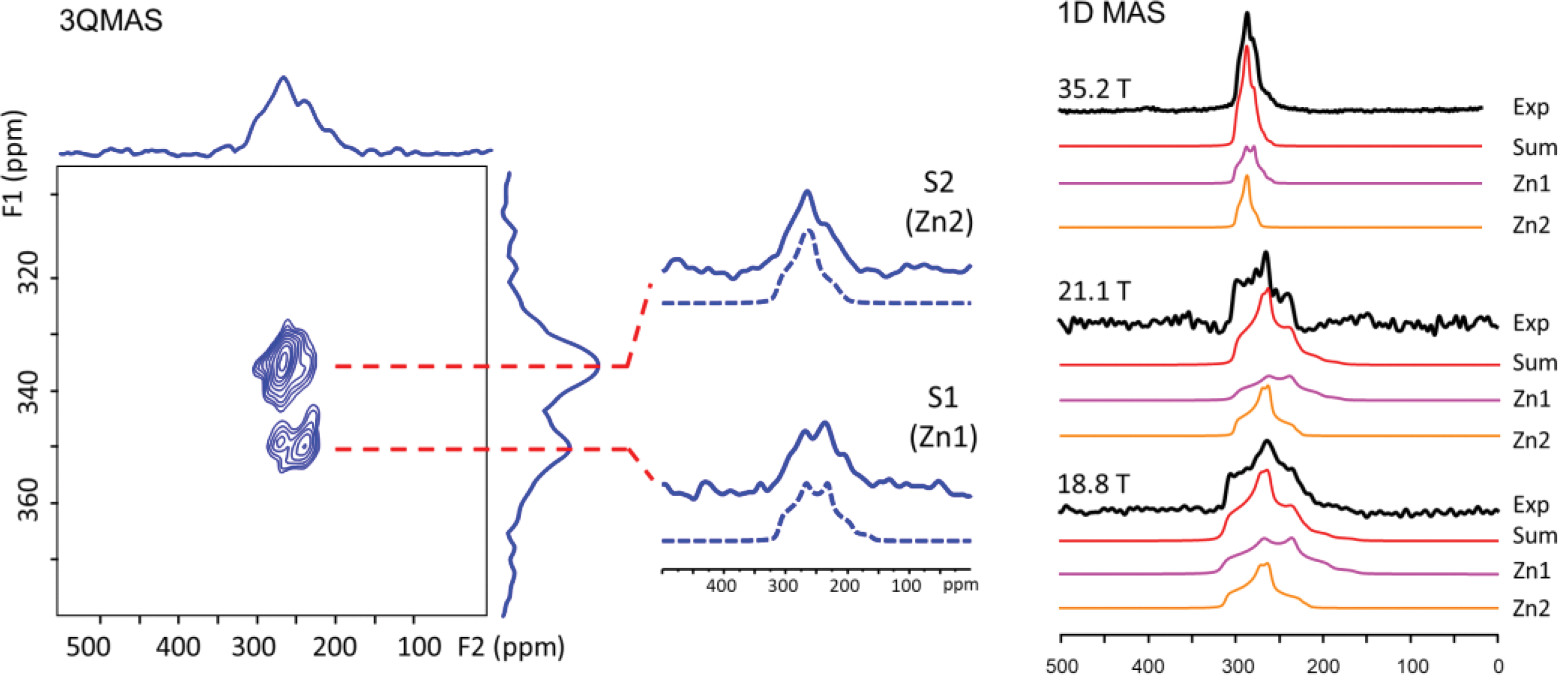
(Left) 67Zn DFS-enhanced 3QMAS NMR spectrum of ZIF-4; (Right) experimental and simulated 67Zn 1D MAS spectra with two Zn sites at 18.8, 21.1 and 35.2 T. The total experimental time for 3QMAS experiment is 3 days and 4.5 hours. The acquisition times of the 1D 67Zn MAS spectra at 18.8, 21.1 and 35.2 T are 2.38, 10 and 1.25 hours, respectively.
Microporous α-Zn3(HCOO)6 is a representative carboxylate MOF with potential for gas capture/storage11c. Its structure has four inequivalent Zn sites.19 Thus, sensitivity requirement for natural abundance 67Zn 3QMAS experiments presents a challenge at another level. 67Zn 1D MAS spectra at 18.8 and 21.1 T (Fig. 4) each have an asymmetric narrow signal which cannot be simulated by a single site. The lack of resolution in 1D spectra necessities 3QMAS experiment. Indeed, four signals are resolved in the corresponding 67Zn 3QMAS spectrum acquired at 18.8 T using a CPMAS cryoprobe. Although four peaks are separated, the SNR of each signal along F2 cross section is low, making it difficult to directly obtain NMR parameters for each site via simulation. Instead, the isotropic chemical shift, δiso (in ppm) and the quadrupolar product, PQ = CQ(1 + ηQ2/3)1/2 (in MHz) for each site were derived from δ1 along the F1 dimension and the spectral center of gravity, δ2 along the F2 dimension (Table S5). The CQ value for each site was derived initially from experimentally obtained PQ and theoretically calculated ηQ (Table S7). The experimental CQ, ηQ, and δiso values were then refined by fitting the 67Zn 1D spectra (Table S6). For this MOF, the use of DFS scheme for 3QMAS is absoutluy necessary as it provides additional gain (~2.4) in sensitivity.
Fig. 4.
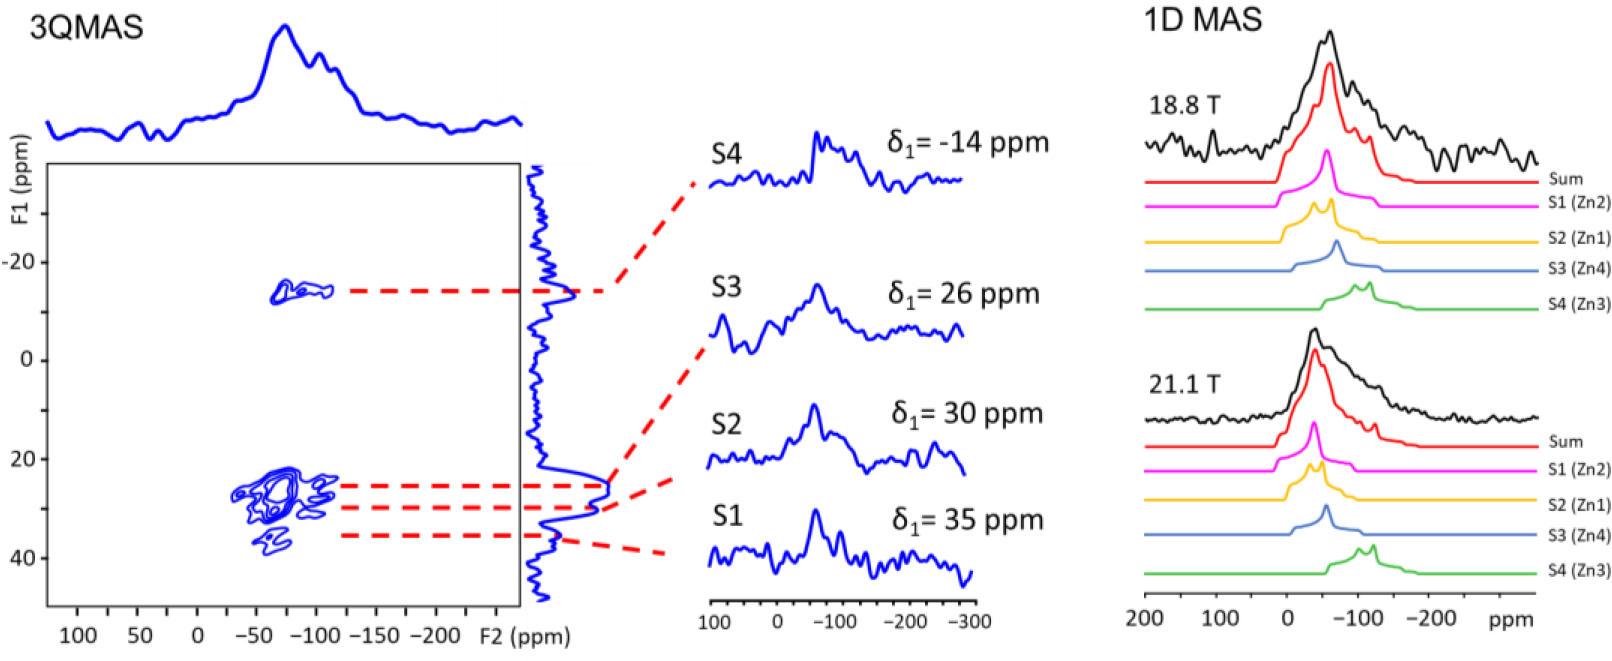
(Left) 67Zn DFS-enhanced 3QMAS NMR spectrum of microporous α-Zn3(HCOO)6. The total experimental time is 3 days and 19 hours, (Right) experimental and simulated 67Zn 1D MAS spectra with four Zn sites at 18.8 and 21.1 T. The acquisition times of 1D MAS spectra at 18.8 and 21.1 T is 0.58 and 42 hour, respectively. Also, see the SI for discussion on the SNR of 1D spectra.
The crystal structure indicates that the four octahedral Zn sites can be classified into three groups of chemically inequivalent Zn sites: (1) Zn1; (2) Zn2; (3) Zn3 and Zn4 where Zn3 and Zn4 are crystallographically inequivalent (see the SI for description). To assign the four resonances to individual Zn sites, plane-wave DFT calculations were performed to calculate 67Zn EFG and the magnetic shielding tensors (see the SI and Table S7 for details). Since experimentally obtained CQ values of the four Zn sites are all very similar (Table S6), the order of calculated isotropic chemical shifts, δiso (Zn2) > δiso (Zn1) > δiso (Zn4) > δiso (Zn3), was then utilized for assignment. Specifically, the signal with the lowest experimental δiso of −46 ppm (δ1 = −14 ppm, S4) is assigned to Zn3; the resonance with the highest δiso of 10 ppm (δ1 = 35 ppm) to Zn2; the peak with the second highest δiso of 5 ppm (δ1 = 30 ppm) to Zn1. Furthermore, through theoretical calculations, Zn local structures can be refined using the EFG parameters extracted from 3QMAS. For instance, NMR data and DFT modeling reveal that the Zn1-O5 and Zn2-O12 bond lengths both are slightly shorter than those reported in the X-ray structure (see the SI for modeling details).
In summary, this work demonstrates the power of a state-of-the-art low-gamma CPMAS cryogenic probe for 67Zn signal enhancement. With increased SNR (via reducing the electronic noise of the probe), enhanced sensitivity (by going to higher magnetic field and using DFS scheme) and high rf field, we obtained natural abundance 67Zn 3QMAS spectra of two representative Zn-based MOFs, both of which are very challenging as far as MOF characterization using 67Zn solid-state NMR is concerned. The high-resolution achieved allowed us to better characterize Zn local environment. Paring NMR parameters obtained from 3QMAS experiments with the DFT calculations allows refinement of local geometry around Zn sites. The signal enhancement approach described here enables multiple inequivalent metal sites with very similar environments to be resolved, allowing better characterization of the existing MOFs whose structures are poorly described, and discovery of the structures of new MOFs.
Supplementary Material
Acknowledgments
YH thanks the Natural Science and Engineering Research Council (NSERC) of Canada for a Discovery Grant. A portion of this work was performed at the NHMFL, supported by NSF DMR-1644779 and the State of Florida. Development of the SCH magnet and NMR instrumentation was supported by the NSF (DMR-1039938 and DMR-0603042) and NIH (BTRR 1P41GM122698). NMR calculations were performed by using HPC resources from GENCI-IDRIS (Grant 097535).
Footnotes
Conflicts of interest
There are no conflicts to declare.
Electronic Supplementary Information (ESI) available: [details of any supplementary information available should be included here]. See DOI: 10.1039/x0xx00000x
Notes and References
- 1.(a) Witherspoon VJ, Xu J and Reimer JA, Chem. Rev, 2018, 118, 10033; [DOI] [PubMed] [Google Scholar]; (b) Fu Y, Guan H, Yin J and Kong X, Coord. Chem. Rev, 2021, 427, 213563; [Google Scholar]; (c) Brunner E and Rauche M, Chem. Sci, 2020, 11, 4297; [DOI] [PMC free article] [PubMed] [Google Scholar]; (d) He C, Li S, Xiao Y, Xu J and Deng F, Solid State Nucl. Magn. Reson, 2022, 101772; [DOI] [PubMed] [Google Scholar]; (e) Sutrisno A and Huang Y, Solid State Nucl. Magn. Reson, 2013, 49, 1; [DOI] [PubMed] [Google Scholar]; (f) Lucier BEG, Chen S and Huang Y, Acc. Chem. Res, 2018, 51, 319; [DOI] [PubMed] [Google Scholar]; (g) Rossini AJ, Zagdoun A, Lelli M, Canivet J, Aguado S, Ouari O, Tordo P, Rosay M, Maas WE, Copéret C, Farrusseng D, Emsley L, and Lesage A, Angew. Chem. Int. Ed, 2012, 51, 123. [DOI] [PubMed] [Google Scholar]
- 2.Kang Y-S, Lu Y, Chen K, Zhao Y, Wang P and Sun W-Y, Coord. Chem. Rev, 2019, 378, 262. [Google Scholar]
- 3.Lucier BEG, Zhang W, Sutrisno A and Huang Y, Comprehensive Inorganic Chemistry III, Elsevier, 2023, 330. [Google Scholar]
- 4.(a) Leroy C and Bryce DL, Prog. Nucl. Magn. Reason. Spectrosc, 2018, 109, 160; [DOI] [PubMed] [Google Scholar]; (b) Ashbrook SE and Sneddon S, J. Am. Chem. Soc, 2014, 136, 15440; [DOI] [PubMed] [Google Scholar]; (c) Smith ME, Magn. Reson. Chem, 2021, 59, 864. [DOI] [PubMed] [Google Scholar]
- 5.Vahrenkamp H, Acc. Chem. Res, 1999, 32, 589. [Google Scholar]
- 6.(a) Eddaoudi M, Kim J, Rosi N, Vodak D, Wachter J, O’Keeffe M and Yaghi OM, Science, 2002, 295, 469. [DOI] [PubMed] [Google Scholar]; (b) Zhang J-P, Zhang Y-B, Lin J-B and Chen X-M, Chem. Rev, 2012, 112, 1001. [DOI] [PubMed] [Google Scholar]; (c) Wang H, Pei X, Kalmutzki MJ, Yang J and Yaghi OM, Acc. Chem. Res, 2022, 55, 707. [DOI] [PubMed] [Google Scholar]
- 7.Pyykkö P, Mol Phys, 2018, 116, 1328. [Google Scholar]
- 8.Huang Y and Sutrisno A, Annu. Rep. NMR Spectrosc. 2014, 81, 1. [Google Scholar]
- 9.Brozek CK, Michaelis VK, Ong T-C, Bellarosa L, López N, Griffin RG and Dincă M, ACS Cent. Sci, 2015, 1, 252. [DOI] [PMC free article] [PubMed] [Google Scholar]
- 10.Ardenkjaer-Larsen J, Boebinger GS, Comment A, Duckett S, Edison AS, Engelke F, Griesinger C, Griffin RG, Hilty C, Maeda H, Parigi G, Prisner T, Ravera E, Bentum JV, Vega S, Webb A, Luchinat C, Schwalbe H, and Frydman L, Angew. Chem., Int. Ed, 2015, 54, 9162. [DOI] [PMC free article] [PubMed] [Google Scholar]
- 11.(a) He P, Lucier BEG, Terskikh VV, Shi Q, Dong J, Chu Y, Zheng A, Sutrisno A and Huang Y, J. Phys. Chem. C, 2014, 118, 23728; [Google Scholar]; (b) Madsen RSK, Qiao A, Sen J, Hung I, Chen K, Gan Z, Sen S and Yue Y, Science, 2020, 367, 1473. [DOI] [PMC free article] [PubMed] [Google Scholar]; (c) Wu B, Wong YTA, Lucier BEG, Boyle PD and Huang Y, ACS Omega, 2019, 4, 4000; [DOI] [PMC free article] [PubMed] [Google Scholar]; (d) Sutrisno A, Terskikh VV, Shi Q, Song Z, Dong J, Ding SY, Wang W, Provost BR, Daff TD and Woo TK and Huang Y, Chem. Eur. J, 2012, 18, 12251; [DOI] [PubMed] [Google Scholar]; (e) Berdichevsky EK, Downing VA, Hooper RW, Butt NW, McGrath DT, Donnelly LJ, Michaelis VK, and Katz MJ, Inorg. Chem, 2022, 61, 7970; [DOI] [PubMed] [Google Scholar]; (f) Qiao A, Sørensen SS, Stepniewska M, Biscio CAN, Fajstrup L, Wang Z, Zhang X, Calvez L, Hung I, Gan Z, Smedskjaer MM and Yue Y, Chem. Mater, 2022, 34, 5030; [Google Scholar]; (g) Freude D, Dvoyashkina N, Arzumanov SS, Kolokolov DI, Stepanov AG, Chmelik C, Jin H, Li Y, Kärger J and Haase J, J. Phys. Chem. C, 2018, 123, 1904–1912. [Google Scholar]
- 12.Gan Z, Hung I, Wang X, Paulino J, Wu G, Litvak IM, Gor’kov PL, Brey WW, Lendi P, Schiano JL, Bird MD, Dixon IR, Toth J, Boebinger GS and Cross TA, J. Magn. Reson, 2017, 284, 125. [DOI] [PMC free article] [PubMed] [Google Scholar]
- 13.Medek A, Harwood JS and Frydman L, J. Am. Chem. Soc, 1995, 117, 12779. [Google Scholar]
- 14.(a) Colaux H, Dawson DM and Ashbrook SE, J. Phys. Chem. A, 2014, 118, 6018; [DOI] [PMC free article] [PubMed] [Google Scholar]; (b) Gan Z and Kwak H-T, J. Magn. Reson, 2004, 168, 346; [DOI] [PubMed] [Google Scholar]; (c) Brinkmann A and Kentgens APM, J. Phys. Chem. B, 2006, 110, 16089; [DOI] [PubMed] [Google Scholar]; (d) Amoureux J-P and Fernandez C, Solid State Nucl. Magn. Reson, 1998, 10, 211. [DOI] [PubMed] [Google Scholar]
- 15.(a) Lipton AS, Sears JA and Ellis PD, J. Magn. Reson, 2001, 151, 48; [DOI] [PubMed] [Google Scholar]; (b) Mizuno T, Hioka K, Fujioka K and Takegoshi K, Rev. Sci. Instrum, 2008, 79, 44706; [DOI] [PubMed] [Google Scholar]; (c) Hassan A, Quinn CM, Struppe J, Sergeyev I, Zhang C, Guo C, Runge B, Theint T, Dao HH and Jaroniec CP, Berbon M, Lends A, Habenstein B, Loquet A, Kuemmerle R, Perrone B, Gronenborn AM and Polenova T, J. Magn. Reson, 2020, 311, 106680. [DOI] [PMC free article] [PubMed] [Google Scholar]
- 16.Nakai T, Toda M, Ashida J, Hobo F, Endo Y, Utsumi H, Nemoto T and Mizuno T, Chem. Phys. Lett, 2017, 678, 265. [Google Scholar]
- 17.(a) Ha M, Nader S, Pawsey S, Struppe J, Monette M, Mansy SS, Boekhoven J and Michaelis VK, J. Phys. Chem. B, 2021, 125, 11916; [DOI] [PubMed] [Google Scholar]; (b) Shen J, Terskikh V, Struppe J, Hassan A, Monette M, Hung I, Gan Z, Brinkmann A and Wu G, Chem. Sci, 2022, 13, 2591. [DOI] [PMC free article] [PubMed] [Google Scholar]
- 18.Park KS, Ni Z, Côté AP, Choi JY, Huang R, Uribe-Romo FJ, Chae HK, O’Keeffe M and Yaghi OM, Proc. Natl. Acad. Sci. U.S.A, 2006, 103, 10186. [DOI] [PMC free article] [PubMed] [Google Scholar]
- 19.Viertelhaus M, Adler P, Clérac R, Anson CE and Powell AK, Eur. J. Inorg. Chem, 2005, 2005, 692. [Google Scholar]
- 20.(a) Iuga D, Schäfer H, Verhagen R and Kentgens AP, J. Magn. Reson,2000, 147, 192. [DOI] [PubMed] [Google Scholar]; (b) Kanellopoulos J, Freude D and Kentgens A, Solid State Nucl. Magn. Reson, 2007, 32, 99. [DOI] [PubMed] [Google Scholar]
Associated Data
This section collects any data citations, data availability statements, or supplementary materials included in this article.


