

Abstract
Purpose
A high daily census may hinder the ability of physicians to deliver quality care in the intensive care unit (ICU). We sought to determine the relationship between intensivist-to-patient ratios and mortality among ICU patients.
Methods
We performed a retrospective cohort study of intensivist-to-patient ratios in 29 ICUs in 10 hospitals in the United States from 2018 to 2020. We used meta-data from progress notes in the electronic health record to determine an intensivist-specific caseload for each ICU day. We then fit a multivariable proportional hazards model with time-varying covariates to estimate the relationship between the daily intensivist-to-patient ratio and ICU mortality at 28 days.
Results
The final analysis included 51,656 patients, 210,698 patient days, and 248 intensivist physicians. The average caseload per day was 11.8 (standard deviation: 5.7). There was no association between the intensivist-to-patient ratio and mortality (hazard ratio for each additional patient: 0.987, 95% confidence interval: 0.968–1.007, p = 0.2). This relationship persisted when we defined the ratio as caseload over the sample-wide average (hazard ratio: 0.907, 95% confidence interval: 0.763–1.077, p = 0.26) and cumulative days with a caseload over the sample-wide average (hazard ratio: 0.991, 95% confidence interval: 0.966–1.018, p = 0.52). The relationship was not modified by the presence of physicians-in-training, nurse practitioners, and physician assistants (p value for interaction term: 0.14).
Conclusions
Mortality for ICU patients appears resistant to high intensivist caseloads. These results may not generalize to ICUs organized differently than those in this sample, such as ICUs outside the United States.
Supplementary Information
The online version contains supplementary material available at 10.1007/s00134-023-07066-z.
Keywords: Intensive care units, Critical care, Physicians, Workforce, Workload
Take-home message
| Higher intensivist-to-patient ratios in the intensive care unit (ICU) are associated with increased mortality in some studies but not others. In a multi-center cohort study, we found no association between intensivist-to-patient ratio and mortality. These results indicate that efforts to limit the number of patients cared for by intensivists on a daily basis are unlikely to improve patient mortality. |
Introduction
The presence of a trained intensivist physician is associated with increased use of evidence-based practice and lower mortality in the intensive care unit (ICU) [1, 2]. Based on this literature, current guidelines recommend that all critically ill patients receive care from an intensivist and intensivist-led care models are increasingly common [3, 4]. This trend is likely a contributing factor in observed reductions in mortality for critically ill patients over time [5, 6]. Yet it also comes with an inherent tension: although intensivists may improve outcomes as a group, as individuals they are subject to time constraints and the limits of human attention. Requiring intensivists to care for an increasing number of patients could stress them in ways that ultimately hinder their ability to provide high-quality care. This tension was laid bare in the early stages of the coronavirus disease 2019 (COVID-19) pandemic, which caused a surge in demand for critical care and higher-than-expected mortality for some critically ill patients [7–10].
At the core of this issue is the intensivist-to-patient ratio, or the number of patients cared for by an intensivist over the course of each workday. In theory, high numbers of patients per intensivist should be avoided so that intensivists can devote sufficient time to each patient [11]. Caps on intensivist-to-patient ratios would be similar to existing caps on nurse-to-patient ratios, which are supported by robust literature demonstrating that high nurse-to-patient ratios are associated with high ICU mortality [12, 13]. Yet the empirical data demonstrating a relationship between intensivist-to-patient ratios and clinical outcomes are scant. Five published studies show mixed results, with two of them suggesting that higher ratios are associated with higher mortality [14, 15] and three showing no relationship [16–18]. Importantly, these studies all have methodological limitations. Most notably, they generally evaluated intensivist-to-patient ratios averaged over the length of the entire ICU stay, neglecting the fact that ICU census changes daily and average values likely mask important day-to-day variations that could influence outcomes [19]. In addition, they generally inferred intensivist-to-patient ratios from ICU census data, neglecting the fact that intensivists may provide care in multiple ICUs within a single day.
The objective of this study was to evaluate the relationship between the intensivist-to-patient ratio and mortality among critically ill patients. Using the electronic health record (EHR) of a large multi-hospital health system in the United States, we first linked individual patients to the intensivists that oversaw their care and then used a time-varying proportional hazards regression model to estimate the daily relationship between intensivist-to-patient ratio and ICU mortality, thereby addressing the key limitations of past research.
Methods
Study design, setting, and data
We performed a retrospective cohort study of ICU patients in the University of Pittsburgh Medical Center (UPMC) health system from January 1, 2018 to August 31, 2020. UPMC is a large multi-hospital system in the mid-Atlantic region of the United States with a mix of academic, community, urban, and rural hospitals. Data were obtained from an ongoing EHR-based registry of ICU patients that includes admission and discharge dates, diagnostic information, vital signs, laboratory values, clinical notes, and outcomes for all admissions to UPMC ICUs. This study was reviewed and approved by the University of Pittsburgh institutional review board.
Patients and intensivists
All ICU patients were linked to an intensivist for each day of their ICU stay by applying a validated algorithm using meta-data from progress notes written in the EHR [20]. This approach enabled us to directly observe the intensivist-to-patient ratios on each day, rather than inferring it from census and survey data [15, 17]. This approach also allowed us to account for situations in which an intensivist worked in two or more ICUs in a single day. The details of this algorithm are reported elsewhere [20]. Briefly, date-and-time stamps from daily progress notes were used to assign each patient an attending physician for each ICU day. Based on this linkage we calculated how many patients each intensivist cared for on each ICU day. We performed this calculation before we applied any exclusion criteria, such that the ratio reflects the true physician-specific caseload on each day.
For the analysis, all hospitalizations during the study period were initially eligible. We excluded admissions to ICUs in which care was not routinely provided by an intensivist (i.e., “open” ICUs). To avoid interdependence of observations, we included only the first ICU admission for each patient. We also excluded admissions for which the entire ICU stay occurred within a single night (i.e. the patient was admitted after 19:00 at night and was discharged or died prior to 07:00 the next day) since those admissions would not have been seen by the intensivist and admissions in which life support was withdrawn or withheld during the first 12 h of admission. Finally, we excluded patients who were never seen by an intensivist during their ICU stay, since these patients likely represent ICU boarders.
Variables
The primary exposure variable was the daily intensivist caseload expressed as a count. This variable was created at the level of the patient day and reflected the total number of patients seen by that intensivist (including the index patient) on that day, prior to all patient exclusions. We also examined several alternative parameterizations for exposure. First, we defined a binary variable indicating whether that day’s caseload was over the sample-wide average, and a binary variable indicating whether that day’s caseload was over the recommended threshold of 14 [21]. These parameterizations account for the possibility that the relationship between caseload and outcomes was non-linear. Second, we defined a continuous variable equal to the rolling sum of days in which the caseload was over the sample-wide average, and a continuous variable equal to the rolling sum of days in which the caseload was over 14. These parameterizations account for the possibility that harm due to a high caseload might accumulate over the course of a patient’s ICU stay.
The primary outcome variable was 28-day mortality in the ICU. We selected ICU mortality over in-hospital mortality because our modelling strategy (described below) required that each patient be exposed to a measurable intensivist-to-patient ratio on each day, and no such ratio exists for the time after ICU discharge.
To control for potential confounding, we defined several additional variables at the level of either the patient or the patient day. Variables defined at the patient level included age, gender, ICU admission source (emergency department, operating room, procedure unit, intermediate care unit, ward, or other), and comorbidities derived from the International Classification of Diseases—version 10 (ICD-10) diagnosis codes in the manner of Elixhauser [22]. Variables defined at the level of the patient-day included severity of illness (using the highest sequential organ failure assessment (SOFA) score on that day), an indicator for whether or not the patient received mechanical ventilation on that day, a count of new admissions on that day, and an indicator for whether a physician-in-training, a physician assistant, or a nurse practitioner was involved in the patient’s care on that day, determined from meta-data in the clinical notes. We used these last two variables to account for the possibility that admissions are more time consuming than other patients [23] and that physicians-in-training, physician assistants, or nurse practitioners might mitigate the possible effects of a high caseload [24].
Statistical analysis
Summary statistics are presented as means ± standard deviation, medians [interquartile range], or frequencies (percent), as appropriate. To test the association between the intensivist-to-patient ratio and outcome, we fit a series of patient-level proportional hazards models with time-varying covariates [25]. This approach enabled us to model daily changes in the intensivist-to-patient ratio. We fit separate models for each exposure variable, as defined above. Time-varying covariates included the exposure variables, SOFA score, mechanical ventilation, the count of new admissions, and the presence of a physician-in-training, physician assistant, or nurse practitioner. Time invariant covariates included age, gender, ICU admission source, and comorbidities. We censored follow-up time at 28 days. We used Huber-White robust standard errors to account for clustering within ICU. We examined the proportionality assumption using Schoenfeld residual plots.
We also performed several sensitivity analyses to determine the robustness of our findings to study assumptions. First, to examine whether the effect of high caseload varied depending on whether a physician-in-training, physician assistant, or nurse practitioner was involved in the patient’s care, we fit a model with an interaction term between the intensivist-to-patient ratio and the physician-in-training, physician assistant, or nurse practitioner variable. Second, we repeated the analyses using an alternate approach to addressing clustering at the ICU level in which we fit a Cox model with shared frailty, which is analogous to a hierarchical random-effects model that accounts for unmeasured ICU-level factors that may relate to patient mortality [26]. Third, we repeated the analyses including ICU-level fixed effects, which explicitly controls for variation in outcome at the level of the ICU. Fourth, to examine the potential influence of post-ICU discharge mortality, we fit a model in which patients that died after ICU discharge but within the hospitalization were assumed to have died at ICU discharge. Fifth, to examine the possibility that the effects of high caseload might be most influential for mechanically ventilated patients, we fit a model limited to patients mechanically ventilated at the start of their ICU stay. Sixth, to understand if higher daily caseloads might lead to a longer duration of mechanical ventilation among survivors, we performed an analysis in which the outcome variable was extubation, limiting the cohort to survivors that were mechanically ventilated at the start of their ICU stay. Seventh, to more fully consider the possibility that the relationship between caseload and outcome might be non-linear, we categorized caseload by quintile and then fit a model in which each category entered the model as an indicator covariate, with the lowest caseload group serving as the referent category.
Finally, to address the possibility that high caseloads during the peri-admission period might disproportionally influence patient outcomes, we performed a simplified logistic regression analysis where we limited the cohort to patients with at least two days in the ICU, summarized the time-varying measures over those two days, and used in-hospital mortality as the outcome. This model also allowed us to understand the effects of caseload on in-hospital rather than in-ICU mortality. Because this analysis used a time-invariant exposure variable it also enabled us to graphically represent the relationship between the intensivist-to-patient ratio and mortality.
All analyses were performed with Stata 17.0 (StataCorp, College Station, Texas). A p value of < 0.05 was considered significant.
Role of the funding source
The funder had no role in study design; in the collection, analysis, and interpretation of data; in the writing of the report; or in the decision to submit the paper for publication.
Results
The final analysis included 51,656 patients admitted to 29 ICUs in 10 hospitals (see flow diagram in Fig. 1). ICU characteristics are shown in Table 1. Study ICUs were diverse in size, case mix, staffing patterns, and overall mortality rates, supporting the generalizability of our findings. Patient characteristics are shown in Table 2. The mean age of the cohort was 63.4 ± 17; the most common admission sources were the emergency department (48.5%) and the operating room (10.3%); 33% of patients were mechanically ventilated on admission; and the mean SOFA score on admission was 4.0 ± 2.8. These patients accounted for 210,698 patient days. At the patient-day level, the mean SOFA score was 4.4 ± 3.3; 38.8% of patient-days involved mechanical ventilation; new admissions averaged 1.3 ± 1.3 per patient day, and 56.6% of patient-days involved a physician-in-training, physician assistant, or nurse practitioner. There were 248 unique intensivists in the analysis. Across all intensivist days, the mean daily caseload was 11.8 ± 5.7 and the median daily caseload was 11 [7–15] (Fig. 2, Panel A). ICU-specific daily caseloads varied substantially (Fig. 2, Panel B), ranging from 5 [3–6] to 24 [20–27].
Fig. 1.

Flow diagram. ICU intensive care unit, CMO comfort measures only
Table 1.
Intensive care unit characteristics (n = 29)
| Characteristic | Value |
|---|---|
| Unit type | |
| Mixed medical and surgical | 8 (28%) |
| Surgical or surgical/trauma | 8 (28%) |
| Medical | 5 (17%) |
| Cardiac/cardio-thoracic surgery | 5 (17%) |
| Neurological | 3 (10%) |
| Physician staffing model | |
| Closed | 20 (69%) |
| Mandatory consult | 9 (31%) |
| Presence of physicians-in-training | |
| High (> 25% of days) | 14 (48%) |
| Low (> 0 to 25% of days) | 13 (45%) |
| None | 2 (7%) |
| Presence of nurse practitioners and physician assistants | |
| High (> 25% of days) | 7 (24%) |
| Low (> 0 to 25% of days) | 19 (66%) |
| None | 3 (10%) |
| Predominant nurse-to-patient ratio | |
| 1:2 | 29 (100%) |
| Patient shifts with 1:3 nurse to patient ratio or greater (%) | |
| Total range | 1.8–19.1 |
| Median [interquartile range] | 7.8 [5.5–9.2] |
| Number of beds | |
| Total range | 7–32 |
| Median [interquartile range] | 14 [8–20] |
| 28-day mortality (%) | |
| Total range | 3.8–17 |
| Median [interquartile range] | 6.6 [5.9–10.1] |
Table 2.
Patient characteristics (n = 51,656)
| Characteristic | Value |
|---|---|
| Age, mean ± standard deviation | 63.4 ± 17 |
| Female | 23,658 (45.8%) |
| ICU admission source | |
| Emergency department | 25,029 (48.5%) |
| Operating theatre | 5314 (10.3%) |
| Procedure unit | 4720 (9.1%) |
| Intermediate care unit | 3635 (7%) |
| Ward | 6387 (12.4%) |
| Other | 5613 (10.9%) |
| Missing | 958 (1.9%) |
| Mechanical ventilation on ICU admission | 17,184 (33.3%) |
| SOFA on ICU admission | |
| Mean ± standard deviation | 4.0 ± 2.8 |
| Median [interquartile range] | 4 [2–6] |
| Mortality | |
| Within ICUa | 4078 (7.9%) |
| Within-hospital | 6077 (11.8%) |
Data are frequency (percent) unless otherwise noted
ICU intensive care unit, SOFA sequential organ failure score
aMortality truncated at 28 days
Fig. 2.
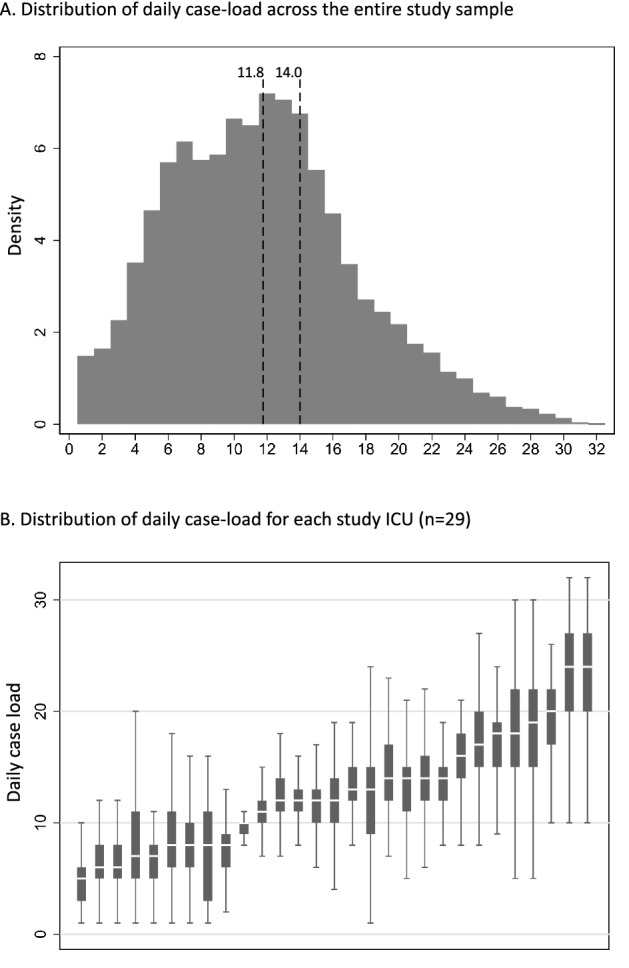
Distribution of intensivist-to-patient ratio across the entire sample (Panel A) and across individual intensive care units (Panel B). In Panel A, the histogram shows the distribution of daily intensivist-to-patient ratios across the entire sample. The dotted lines are provided at 11.8 and 14.0 representing the sample-wide average and currently recommended caseload cap, respectively. In Panel B, the box plots show medians, interquartile ranges, and total ranges at the level of the intensive care unit day, with outliers excluded for legibility. Intensive care units are ordered on the x-axis from lowest median ratio to highest median ratio
In our primary analyses, we found no relationship between daily caseload and ICU mortality, either when modelling the ratio as a continuous variable, a binary variable representing above-average caseload or caseload above 14, or a continuous variable representing the rolling sum of days above average or days above 14 (Table 3). There was no significant interaction between the intensivist-to-patient ratio and staffing by physicians-in-training, physician assistants, or nurse practitioners, indicating that the effect of the staffing ratio on outcomes was similar whether or not these individuals were assisting with patient care (p value for interaction = 0.14). Results were similar in the shared frailty model (Table S1), in the model adjusting for ICU-level fixed effects (Table S2), when death after ICU discharge was assumed to occur at ICU discharge (Table S3), when we limited the cohort to patients mechanically ventilated at the start of their ICU stay (Table S4), and when we examined the duration of mechanical ventilation among survivors (Table S5).
Table 3.
Association between daily intensivist-to-patient ratios and mortality
| Exposure | HR | 95% CI | p value |
|---|---|---|---|
| Caseload as a continuous variablea | 0.987 | 0.968–1.007 | 0.20 |
| Secondary analyses | |||
| Caseload over averageb | 0.907 | 0.763–1.077 | 0.26 |
| Caseload over 14c | 0.955 | 0.795–1.148 | 0.62 |
| Rolling sum of caseload over averaged | 0.991 | 0.966–1.018 | 0.52 |
| Rolling sum of caseload over 14e | 0.996 | 0.969–1.024 | 0.79 |
All models control for age, gender, intensive care unit admission source, patient comorbidities, daily sequential organ failure score, mechanical ventilation, count of new admissions, and the presence of a physician-in-training, physician assistant, or nurse practitioner
HR hazard ratio; CI confidence interval
aIn this analysis the hazard ratio is interpreted as the change in the daily risk of death associated with each additional patient per intensivist
bIn this analysis the hazard ratio is interpreted as the change in the daily risk of death associated with each day in which the caseload is over the sample-wide average
cIn this analysis the hazard ratio is interpreted as the change in the daily risk of death associated with each day in which the caseload is over 14
dIn this analysis the hazard ratio is interpreted as the change in the daily risk of death associated with each cumulative day in which the caseload is over the sample-wide average
eIn this analysis the hazard ratio is interpreted as the change in the daily risk of death associated with each cumulative day in which the caseload is over 14
The results were also similar when we divided the caseload into categories based on quartile, allowing for a more flexible, non-linear relationship between daily caseload and outcome. Specifically, compared to Quartile 1 (days in which caseload was one to seven), there was no significant difference in mortality on days in which the caseload was in Quartile 2 (8–11, hazard ratio: 1.00, 95% confidence interval: 0.76–1.33, p = 0.97); Quartile 3 (12–15, hazard ratio: 0.90, 95% confidence interval: 0.68–1.19); or Quartile 4 (caseload 16 and higher, hazard ratio: 0.89, 95% CI 0.65–1.23, p = 0.48).
Finally, the results were similar in a simplified logistic regression model looking at just the first two days of each patient’s stay (adjusted odds ratio for in-hospital mortality: 1.006, 95% confidence interval: 0.988–1.025, p = 0.53; and Fig. 3).
Fig. 3.
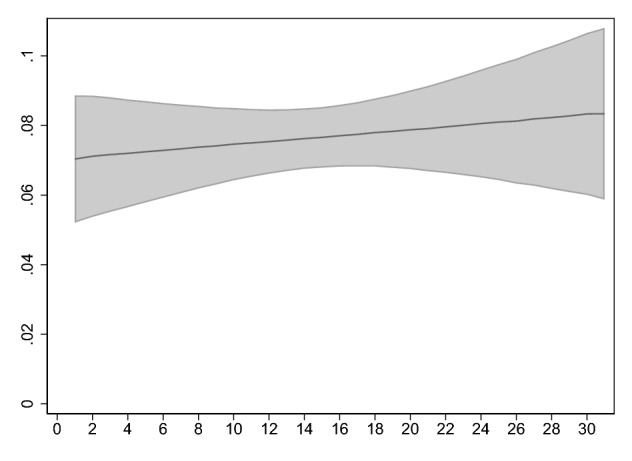
Relationship between average intensivist-to-patient ratio over the first two days of intensive care unit admission and in-hospital mortality. The figure shows point estimates and 95% confidence intervals for adjusted mortality derived from a logistic regression model in which the dependent variable was in-hospital mortality and the independent variable was the daily caseload averaged over the first two days, adjusting for age, gender, intensive care unit admission source, comorbidities, mechanical ventilation (maximum over the first two days), the presence of a physician-in-training, physician assistant, or nurse practitioner (maximum over the first two days), SOFA score (maximum over the first two days) and the count of new admissions (averaged over the first two days), using direct standardization (N = 44,235). Point estimates were calculated at the mean of all covariates
Discussion
In a multi-center retrospective cohort study of ICU admissions in the United States we found no significant association between the intensivist-to-patient ratio and mortality. This finding was robust to different strategies for modelling the intensivist-to-patient ratio and different statistical approaches. The effect was also similar in an interaction model that allowed the effect of the intensivist-to-patient ratio to vary depending on the presence of a physician-in-training, physician assistant, or nurse practitioner to assist with care.
Our study makes important methodological advances over past studies in this area by (a) directly measuring intensivist-to-patient ratios rather than inferring them from surveys; and (b) modelling the ratio in a way that allows it to change from day to day rather than modelling as an average value over the course of an ICU stay, which better reflects actual practice. Nonetheless, our findings are largely consistent with past studies, which in general do not show that higher daily caseloads are associated with worse patient outcomes [16–18]. Taken together, these results suggest that guidelines recommending specific ratios are premature and policies capping intensivist-to-patient ratios at specific numbers are unlikely to improve ICU mortality [21].
Although we did not find an association between intensivist-to-patient ratios and mortality, it is possible that high ratios might impact other important aspects of ICU quality, including patient-centered outcomes such as functional status among survivors, quality of death and dying, and family satisfaction [27]; and provider-centered outcomes such as staff satisfaction, quality of teaching for individuals in training, and burnout [28]. In particular, capping intensivist-to-patient ratios may be a valuable strategy for mitigating the epidemic of burnout among ICU providers [29]. However, such efforts might have unintended consequences if intensivist physicians have to work more shifts to accommodate lower ratios, which might paradoxically increase burnout. Indeed, in one major study of ICU physician burnout, less time off between shifts was associated with increased rates of burnout, while intensivist-to-patient ratio was not [30].
More broadly, our findings indicate that under most circumstances ICUs function as high-reliability organizations, in that they are able to maintain consistent effectiveness during times of stress on the system [31–33]. This is not to say that stress in the form of an increased caseload does not have the potential to harm patients. Rather, it is likely that ICU teams employ specific strategies during times of stress that help mitigate its effects. At the ICU level, these strategies might include clinical protocols, care pathways, and checklists, all of which can empower non-physician providers and reduce errors of omission [34]. At the physician level, intensivists might have the ability to implicitly triage their time during periods of stress, focusing efforts on the marginal patients most likely to benefit from intensive care and spending less time caring for patients that are very likely to survive or very likely to die [35].
These results should not be interpreted to mean that high intensivist-to-patient ratios are always safe. Rather, we demonstrate that high caseloads do not appear to influence mortality on average. It is possible that a small number of patients were harmed by high ratios in ways that we could not observe, or that strain can affect ICU performance independent of specific intensivist-to-patient ratios. It is also possible that the effects of strain are more influential when patients are extremely complex or when intensivists have competing duties outside the ICU. These results should also not be used to inform pandemic planning. We intentionally limited our study’s time period to exclude the dramatic surges in demand for critical care seen during the COVID-19 pandemic, since including this time period would reduce generalizability [36]. During the COVID-19 pandemic, hospitals used a wide variety of strategies to accommodate increased demand [37]. The effects of these strategies and how they interact with intensivist-to-patient ratios remain important areas for future research [38].
Although our results were consistent across most subgroup analyses, we did find that higher ratios were associated with lower mortality among the subgroup of patients receiving mechanical ventilation. Given that this effect size was small, not robust to different modelling approaches, and limited to this single subgroup, we suspect that it is unlikely to represent a true association [39]. Nonetheless, this finding is consistent with another study suggesting that mortality decreases at high average caseloads [15], potentially warranting further investigation.
Our study has several limitations. First, we evaluated only short-term mortality. It is possible that high ratios could affect post-discharge outcomes and non-mortal outcomes important to patients such as neurocognitive and emotional deficits. Second, we assigned intensivists to patients using EHR meta-data via a retrospective algorithm, rather than directly observing ratios prospectively. This approach enabled us to perform our study at scale, i.e. in many hospitals over a long time period, but it may also have led to exposure misclassification that could bias our results toward the null. Third, as in all observational research it is possible that our results could be affected by unmeasured confounding. Fourth, as with all studies of ICU organization, our results are dependent on local contexts. The exact role of intensivists varies from ICU to ICU, and it’s conceivable that the daily caseload plays a larger role in specific situations depending on what specific duties the intensivist has in the ICU. More specifically, our results do not apply to open ICUs, which we excluded, or to small rural ICUs, which were absent from our study. Our results also might not generalize to ICUs that are organized differently than those in our sample, such as ICUs in other health systems or other countries outside the United States. Specifically, it is worth noting that the majority of our ICUs provided support for intensivists in the form of physicians-in-training, nurse practitioners, or physician assistants, and that nurse-to-patient ratios were generally low. Findings may differ in ICUs without this level of staffing support.
Conclusions
In a sample of United States ICUs, intensivist-to-patient ratios did not influence patient mortality in the ICU. Future work should examine this issue in other health systems, particularly those outside the United States. Future work should also identify the strategies ICUs employ to enable physicians to provide high-quality care during times of stress, the relative effectiveness and efficiency of these strategies, and how to best use these strategies during times of extreme stress.
Supplementary Information
Below is the link to the electronic supplementary material.
Funding
The work of JMK was supported by the United States National Institutes of Health, NHLBI Division of Intramural Research, under Grant No. R35HL144804.
Data availability
De-identified data for the purposes of replicating the described analyses are available upon request after execution of a data use agreement with the authors’ institution (University of Pittsburgh).
Declarations
Conflicts of interest
The authors have no financial conflicts of interest to disclose.
Footnotes
Publisher's Note
Springer Nature remains neutral with regard to jurisdictional claims in published maps and institutional affiliations.
References
- 1.Kahn JM, Brake H, Steinberg KP. Intensivist physician staffing and the process of care in academic medical centres. Qual Saf Health Care. 2007;16:329–333. doi: 10.1136/qshc.2007.022376. [DOI] [PMC free article] [PubMed] [Google Scholar]
- 2.Wilcox ME, Chong CAKY, Niven DJ, et al. Do intensivist staffing patterns influence hospital mortality following ICU admission? A systematic review and meta-analyses. Crit Care Med. 2013;41:2253–2274. doi: 10.1097/CCM.0b013e318292313a. [DOI] [PubMed] [Google Scholar]
- 3.Weled BJ, Adzhigirey LA, Hodgman TM, et al. Critical care delivery: the importance of process of care and ICU structure to improved outcomes. Crit Care Med. 2015;43:1520–1525. doi: 10.1097/CCM.0000000000000978. [DOI] [PubMed] [Google Scholar]
- 4.Kohn R, Madden V, Kahn JM, et al. Diffusion of evidence-based intensive care unit organizational practices. A state-wide analysis. Ann Am Thorac Soc. 2017;14:254–261. doi: 10.1513/AnnalsATS.201607-579OC. [DOI] [PMC free article] [PubMed] [Google Scholar]
- 5.Erickson SE, Martin GS, Davis JL, et al. Recent trends in acute lung injury mortality: 1996–2005. Crit Care Med. 2009;37:1574. doi: 10.1097/CCM.0b013e31819fefdf. [DOI] [PMC free article] [PubMed] [Google Scholar]
- 6.Stevenson EK, Rubenstein AR, Radin GT, et al. Two decades of mortality trends among patients with severe sepsis: a comparative meta-analysis*. Crit Care Med. 2014;42:625–631. doi: 10.1097/CCM.0000000000000026. [DOI] [PMC free article] [PubMed] [Google Scholar]
- 7.Bhatraju PK, Ghassemieh BJ, Nichols M, et al. COVID-19 in critically Ill patients in the Seattle region - case series. N Engl J Med. 2020;382:2012–2022. doi: 10.1056/NEJMoa2004500. [DOI] [PMC free article] [PubMed] [Google Scholar]
- 8.Grasselli G, Zangrillo A, Zanella A, et al. Baseline characteristics and outcomes of 1591 patients infected with SARS-CoV-2 admitted to ICUs of the Lombardy Region, Italy. JAMA. 2020;323:1574–1581. doi: 10.1001/jama.2020.5394. [DOI] [PMC free article] [PubMed] [Google Scholar]
- 9.Richardson S, Hirsch JS, Narasimhan M, et al. Presenting characteristics, comorbidities, and outcomes among 5700 patients hospitalized with COVID-19 in the New York City Area. JAMA. 2020;323:2052–2059. doi: 10.1001/jama.2020.6775. [DOI] [PMC free article] [PubMed] [Google Scholar]
- 10.Bravata DM, Perkins AJ, Myers LJ, et al. Association of intensive care unit patient load and demand with mortality rates in us department of veterans affairs hospitals during the COVID-19 pandemic. JAMA Netw Open. 2021;4:e2034266. doi: 10.1001/jamanetworkopen.2020.34266. [DOI] [PMC free article] [PubMed] [Google Scholar]
- 11.Opgenorth D, Stelfox HT, Gilfoyle E, et al. Perspectives on strained intensive care unit capacity: a survey of critical care professionals. PLoS ONE. 2018;13:e0201524. doi: 10.1371/journal.pone.0201524. [DOI] [PMC free article] [PubMed] [Google Scholar]
- 12.Needleman J, Buerhaus P, Pankratz VS, et al. Nurse staffing and inpatient hospital mortality. N Engl J Med. 2011;364:1037–1045. doi: 10.1056/NEJMsa1001025. [DOI] [PubMed] [Google Scholar]
- 13.West E, Barron DN, Harrison D, et al. Nurse staffing, medical staffing and mortality in intensive care: an observational study. Int J Nurs Stud. 2014;51:781–794. doi: 10.1016/j.ijnurstu.2014.02.007. [DOI] [PubMed] [Google Scholar]
- 14.Neuraz A, Guérin C, Payet C, et al. Patient mortality is associated with staff resources and workload in the ICU: a multicenter observational study. Crit Care Med. 2015;43:1587–1594. doi: 10.1097/CCM.0000000000001015. [DOI] [PubMed] [Google Scholar]
- 15.Gershengorn HB, Harrison DA, Garland A, et al. Association of intensive care unit patient-to-intensivist ratios with hospital mortality. JAMA Intern Med. 2017;177:388–396. doi: 10.1001/jamainternmed.2016.8457. [DOI] [PubMed] [Google Scholar]
- 16.Dara SI, Afessa B. Intensivist-to-bed ratio: association with outcomes in the medical ICU. Chest. 2005;128:567–572. doi: 10.1378/chest.128.2.567. [DOI] [PubMed] [Google Scholar]
- 17.Gershengorn HB, Pilcher DV, Litton E, et al. Association of patient-to-intensivist ratio with hospital mortality in Australia and New Zealand. Intensive Care Med. 2022;48:179–189. doi: 10.1007/s00134-021-06575-z. [DOI] [PMC free article] [PubMed] [Google Scholar]
- 18.Agarwal A, Chen J-T, Coopersmith CM, et al. SWEAT ICU-An observational study of physician workload and the association of physician outcomes in academic ICUs. Crit Care Explor. 2022;4:e0774. doi: 10.1097/CCE.0000000000000774. [DOI] [PMC free article] [PubMed] [Google Scholar]
- 19.Kerlin MP, Caruso P. Towards evidence-based staffing: the promise and pitfalls of patient-to-intensivist ratios. Intensive Care Med. 2022;48:225–226. doi: 10.1007/s00134-021-06614-9. [DOI] [PMC free article] [PubMed] [Google Scholar]
- 20.Kahn JM, Minturn JS, Riman KA, et al. Characterizing intensive care unit rounding teams using meta-data from the electronic health record. J Crit Care. 2022;72:154143. doi: 10.1016/j.jcrc.2022.154143. [DOI] [PMC free article] [PubMed] [Google Scholar]
- 21.Ward NS, Afessa B, Kleinpell R, et al. Intensivist/patient ratios in closed ICUs: a statement from the society of critical care medicine taskforce on ICU Staffing. Crit Care Med. 2013;41:638–645. doi: 10.1097/CCM.0b013e3182741478. [DOI] [PubMed] [Google Scholar]
- 22.Quan H, Sundararajan V, Halfon P, et al. Coding algorithms for defining comorbidities in ICD-9-CM and ICD-10 administrative data. Med Care. 2005;43:1130–1139. doi: 10.1097/01.mlr.0000182534.19832.83. [DOI] [PubMed] [Google Scholar]
- 23.Kerlin MP, Harhay MO, Vranas KC, et al. Objective factors associated with physicians’ and nurses’ perceptions of intensive care unit capacity strain. Ann Am Thorac Soc. 2014;11:167–172. doi: 10.1513/AnnalsATS.201306-141OC. [DOI] [PMC free article] [PubMed] [Google Scholar]
- 24.Kleinpell RM, Ely EW, Grabenkort R. Nurse practitioners and physician assistants in the intensive care unit: an evidence-based review. Crit Care Med. 2008;36:2888–2897. doi: 10.1097/CCM.0b013e318186ba8c. [DOI] [PubMed] [Google Scholar]
- 25.Fisher LD, Lin DY. Time-dependent covariates in the Cox proportional-hazards regression model. Annu Rev Public Health. 1999;20:145–157. doi: 10.1146/annurev.publhealth.20.1.145. [DOI] [PubMed] [Google Scholar]
- 26.Balan TA, Putter H. A tutorial on frailty models. Stat Methods Med Res. 2020;29:3424–3454. doi: 10.1177/0962280220921889. [DOI] [PMC free article] [PubMed] [Google Scholar]
- 27.Curtis JR. The “patient-centered” outcomes of critical care: what are they and how should they be used? New Horiz. 1998;6:26–32. [PubMed] [Google Scholar]
- 28.Santhosh L, Jain S, Brady A, et al. Intensive care unit educators: a multicenter evaluation of behaviors residents value in attending physicians. Ann Am Thorac Soc. 2017;14:513–516. doi: 10.1513/AnnalsATS.201612-996BC. [DOI] [PubMed] [Google Scholar]
- 29.Pastores SM, Kvetan V, Coopersmith CM, et al. Workforce, workload, and burnout among intensivists and advanced practice providers: a narrative review. Crit Care Med. 2019;47:550–557. doi: 10.1097/CCM.0000000000003637. [DOI] [PubMed] [Google Scholar]
- 30.Embriaco N, Azoulay E, Barrau K, et al. High level of burnout in intensivists: prevalence and associated factors. Am J Respir Crit Care Med. 2007;175:686–692. doi: 10.1164/rccm.200608-1184OC. [DOI] [PubMed] [Google Scholar]
- 31.Carroll JS, Rudolph JW. Design of high reliability organizations in health care. Qual Saf Health Care. 2006;15(Suppl 1):i4–9. doi: 10.1136/qshc.2005.015867. [DOI] [PMC free article] [PubMed] [Google Scholar]
- 32.Iwashyna TJ, Kramer AA, Kahn JM. Intensive care unit occupancy and patient outcomes. Crit Care Med. 2009;37:1545–1557. doi: 10.1097/CCM.0b013e31819fe8f8. [DOI] [PMC free article] [PubMed] [Google Scholar]
- 33.Gabler NB, Ratcliffe SJ, Wagner J, et al. Mortality among patients admitted to strained intensive care units. Am J Respir Crit Care Med. 2013;188:800–806. doi: 10.1164/rccm.201304-0622OC. [DOI] [PMC free article] [PubMed] [Google Scholar]
- 34.Curtis JR, Cook DJ, Wall RJ, et al. Intensive care unit quality improvement: a “how-to” guide for the interdisciplinary team. Crit Care Med. 2006;34:211–218. doi: 10.1097/01.CCM.0000190617.76104.AC. [DOI] [PubMed] [Google Scholar]
- 35.Brown SES, Rey MM, Pardo D, et al. The allocation of intensivists’ rounding time under conditions of intensive care unit capacity strain. Am J Respir Crit Care Med. 2014;190:831–834. doi: 10.1164/rccm.201406-1127LE. [DOI] [PMC free article] [PubMed] [Google Scholar]
- 36.Wilcox ME, Rowan KM, Harrison DA, Doidge JC. Does unprecedented ICU capacity strain, as experienced during the COVID-19 pandemic, impact patient outcome? Crit Care Med. 2022;50:e548–e556. doi: 10.1097/CCM.0000000000005464. [DOI] [PMC free article] [PubMed] [Google Scholar]
- 37.Kerlin MP, Costa DK, Davis BS, et al. Actions taken by US hospitals to prepare for increased demand for intensive care during the first wave of COVID-19: a national survey. Chest. 2021;160:519–528. doi: 10.1016/j.chest.2021.03.005. [DOI] [PMC free article] [PubMed] [Google Scholar]
- 38.Anesi GL, Lynch Y, Evans L. A conceptual and adaptable approach to hospital preparedness for acute surge events due to emerging infectious diseases. Crit Care Explor. 2020;2:e0110. doi: 10.1097/CCE.0000000000000110. [DOI] [PMC free article] [PubMed] [Google Scholar]
- 39.Sun X, Ioannidis JPA, Agoritsas T, et al. How to use a subgroup analysis: users’ guide to the medical literature. JAMA. 2014;311:405–411. doi: 10.1001/jama.2013.285063. [DOI] [PubMed] [Google Scholar]
Associated Data
This section collects any data citations, data availability statements, or supplementary materials included in this article.
Supplementary Materials
Data Availability Statement
De-identified data for the purposes of replicating the described analyses are available upon request after execution of a data use agreement with the authors’ institution (University of Pittsburgh).