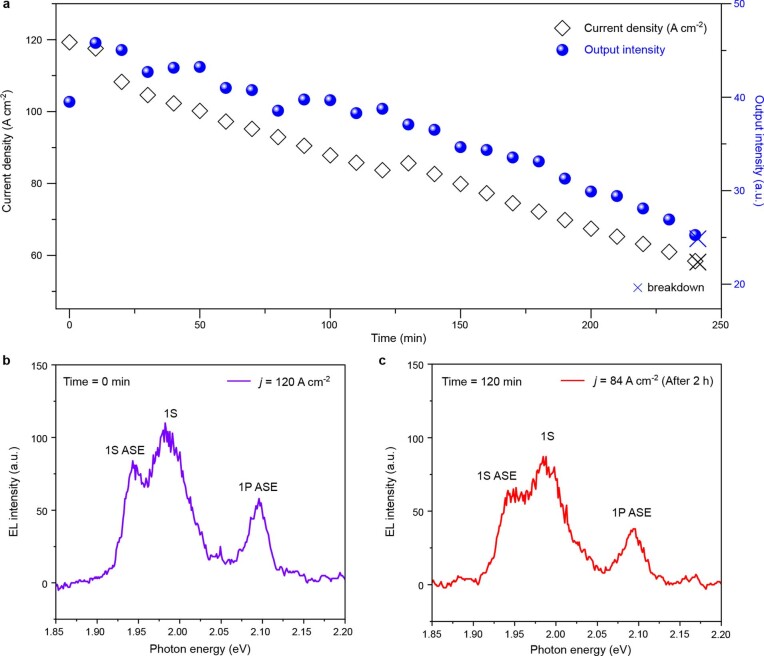
Extended Data Fig. 9. Studies of operational stability of a BRW device.
a, The dependence of the current density (left axis, open diamonds) and the output power (right axis, blue circles) of an unencapsulated BRW device on time of operation under excitation with 10-V, 1-µs pulses at 1 kHz. The data were recorded at intervals of 1 min. The data points shown in the plot (separated by 10-min intervals) are averages over ten measurements. During the first 2 h, the output intensity decreased by only 9%. A slow decrease in the output power and the current density continued for the next 2 h, at which point device failure finally occurred. On the basis of these measurements, the characteristic T75 time was 2.7 h (T75 denotes the time at which the device output decreases to 75% of its original value). b, The EL spectra at the beginning of the test show distinct 1S and 1P ASE features. c, These features are preserved following 2 h of continuous device operation. a.u., arbitrary units.

