Abstract
Lysine lactylation (Kla) is a recently discovered histone mark derived from metabolic lactate. The NAD+‐dependent deacetylase SIRT3, which can also catalyze removal of the lactyl moiety from lysine, is expressed at low levels in hepatocellular carcinoma (HCC) and has been suggested to be an HCC tumor suppressor. Here we report that SIRT3 can delactylate non‐histone proteins and suppress HCC development. Using SILAC‐based quantitative proteomics, we identify cyclin E2 (CCNE2) as one of the lactylated substrates of SIRT3 in HCC cells. Furthermore, our crystallographic study elucidates the mechanism of CCNE2 K348la delactylation by SIRT3. Our results further suggest that lactylated CCNE2 promotes HCC cell growth, while SIRT3 activation by Honokiol induces HCC cell apoptosis and prevents HCC outgrowth in vivo by regulating Kla levels of CCNE2. Together, our results establish a physiological function of SIRT3 as a delactylase that is important for suppressing HCC, and our structural data could be useful for the future design of activators.
Keywords: CCNE2, hepatocellular carcinoma, Honokiol, lactylation, SIRT3
Subject Categories: Cancer, Post-translational Modifications & Proteolysis, Structural Biology
Delactylation of cyclin E2 (CCNE2) by SIRT3 suppresses hepatocellular carcinoma (HCC) development.

Introduction
SIRT3 belongs to the Sirtuins family of nicotinamide adenine dinucleotide (NAD+)‐dependent protein lysine deacylases (Onyango et al, 2002; Hirschey et al, 2010). It plays a pivotal role in regulating metabolic homeostasis mainly as a deacetylase (Ahn et al, 2008; Finley & Haigis, 2012). SIRT3 has been connected to various cancers. While the effect of SIRT3 is cancer‐type dependent (Li et al, 2019), in many cancer loss of SIRT3 triggers metabolic reprogramming (known as the Warburg effect) to promote tumorigenesis (Haigis et al, 2012). A variety of human tumors have low SIRT3 expression (Alhazzazi et al, 2011; Ansari et al, 2017). Hepatocellular carcinoma (HCC), one of the leading causes of cancer death worldwide (Forner et al, 2018; Siegel et al, 2019), has reduced SIRT3 expression accompanied with unfavorable prognosis (Zhang & Zhou, 2012; Zhang et al, 2012), suggesting SIRT3 as a tumor suppressor in HCC (Kim et al, 2010; Newman et al, 2012; Chen et al, 2014). SIRT3 has been reported to halt tumor progression by repressing the Warburg effect through hypoxia‐inducible factor‐1α (HIF‐1α) destabilization (Finley et al, 2011). Given that HIF‐1α is the primary driver of lactate production (Semenza, 2003; Weidemann & Johnson, 2008), overexpression of SIRT3 indeed alleviates the effect induced by lactate production in many cancer cells (Bell et al, 2011; Schumacker, 2011). Importantly, lactate‐derived lysine lactylation (Kla; Zhang et al, 2019), a novel post‐translational modification (PTM), was detected on histones (Izzo & Wellen, 2019; Liberti & Locasale, 2020; Chen et al, 2021; Dai et al, 2021), and SIRT3 is able to have delactylation activity (Moreno‐Yruela et al, 2022). This inspired us to explore the physiological function of SIRT3 as delactylase in HCC.
In this study, we found a high level of Kla in HCC tissues and cells, which showed a negative correlation with SIRT3 expression. Using SILAC‐MS/MS method (Ong et al, 2002; Ong & Mann, 2006), we identified a series of lactylated proteins regulated by SIRT3 in HCC cells, which are mainly involved in the regulation of the cell cycle. One of them is Cyclin E2 (CCNE2), a key cell cycle protein reported to be essential for liver cancer progression (Li et al, 2003; Geng et al, 2018; Sonntag et al, 2018). In addition, we demonstrated that SIRT3 catalyzes the removal of delactylation on CCNE2 to suppress the proliferation, migration, and invasion of HCC cells. A crystal structure of SIRT3 in complex with CCNE2K348la peptide revealed the catalytic mechanism and the conformation required to accommodate the Kla group. Furthermore, we found that Honokiol (HKL), an activator of SIRT3 (Rajendran et al, 2012; Pillai et al, 2015; Liu et al, 2018), led to decreased Kla level and increase of apoptosis and inhibited HCC outgrowth in vivo in a mouse HCC model. Taken together, our studies characterized the delactylation activity of SIRT3 is essential to suppress HCC development.
Results
Low SIRT3 expression correlates with a high level of Kla in HCC tissues and cells
We first analyzed the expression of SIRT1‐3 in the 159 HBV‐derived HCC patients cohort from Gao et al (2019). The analysis revealed that, among SIRT1‐3, SIRT3 expression is much lower in tumor tissues than that in adjacent normal tissues (****P < 0.0001; Fig 1A). Furthermore, SIRT3 expression is downregulated in the advanced‐stage patients compared with that in the early‐stage patients (*P = 0.0134; Fig 1B), indicating that SIRT3 expression is negatively correlated with the development of HCC. A recent report detected SIRT3's enzymatic delactylation activity on histones (Moreno‐Yruela et al, 2022). We therefore were interested to explore the physiological function of SIRT3 as delactylase during HCC development.
Figure 1. Low SIRT3 expression correlates with high Kla level in HCC tissues and cells.
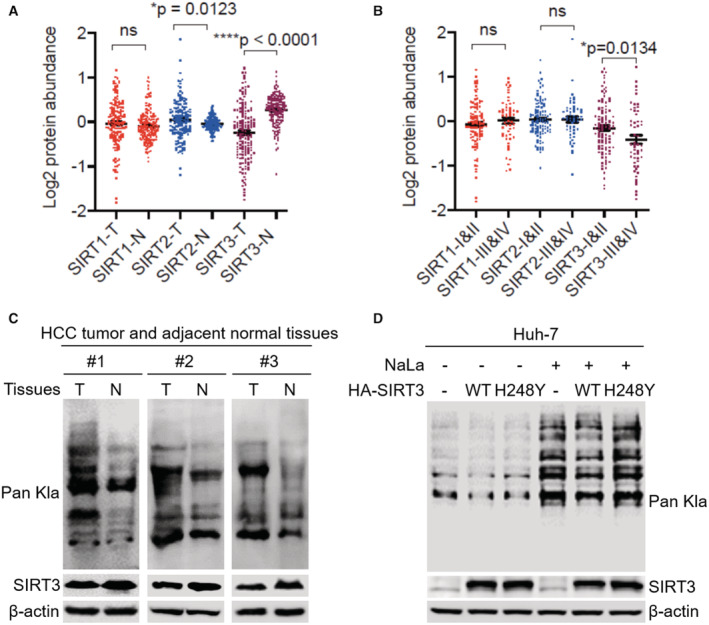
- Comparisons of the protein abundance of SIRT1‐3 between tumor (T) and adjacent normal tissue (N) samples (paired t‐test) in the HCC patients' cohort (n = 159). The line represent mean with SEM and upper and lower quartiles, respectively. P‐values were described in the figure.
- Comparisons of the protein abundance of SIRT1‐3 between I & II stage and III & IV stage of tumor tissue samples (unpaired t‐test) in the HCC patients' cohort (n = 159). The line represent mean with SEM and upper and lower quartiles, respectively. P‐values were described in the figure.
- The immunoblot of the total Kla and SIRT3 in the lysates isolated from three HCC patients' tumor (T) and adjacent normal tissue (N) samples. β‐actin was used as the loading control.
- The immunoblot of Kla and SIRT3 in the total cell lysates. The lysates were isolated from Huh7 cells without or with SIRT3 overexpression upon NaLa treatment (25 mM for 24 h) or not. β‐actin was used as the loading control. The shown image is representative of three biological replicates.
Afterward, we proceeded to examine three paired tissue samples from HCC patients (Table EV1). Lower expression of SIRT3 was detected in the HCC tumor as compared to that in adjacent normal tissues. Strikingly, HCC tumors showed a significant increase of Kla level, compared to that in the adjacent normal tissues (Fig 1C). To further probe the dynamics of the Kla level in cells, Huh7, one of the HCC cells with naturally lower expression of SIRT3, was treated without or with sodium lactate (NaLa). In the absence or presence of NaLa, the overexpression of WT SIRT3 downregulated the level of Kla in both conditions, compared to the cells with the overexpression of the functional mutant H248Y (Fig 1D). The negative correlation between SIRT3 expression and the Kla level suggested that SIRT3 might be a Kla regulator in HCC.
Identification of the lactylated targets regulated by SIRT3 in HCC cells
To identify the potential lactylated targets regulated by SIRT3, we used stable isotope labeling with amino acids in cell culture (SILAC) quantitative mass spectrometry in Huh7 cells. Huh7 cells without or with SIRT3 overexpression were treated with NaLa (Fig EV1). Pan‐anti Kla antibody conjugated protein A/G agarose was used to enrich lactylated proteins for identification by mass spectrometry (MS; Fig 2A). MS analysis revealed 52 lactylated proteins that are potentially regulated by SIRT3, among which there were 41 proteins with one lactylation site and 11 proteins with two lactylation sites (Fig 2B). More than 94% of lactylated sites showed increased abundance compared to that in SIRT3 OE cells (Dataset EV1). To gain insight into how lysine lactylation affects the biological process, we performed the pathway enrichment analysis of the lactylated proteins. The result indicated that SIRT3 delactylation targets significantly converged on pathways including cell cycle, nuclear envelope reassembly, and mitotic anaphase (Fig 2C and Dataset EV1). One of the SIRT3 delactylations target proteins, CCNE2, a key cell cycle protein, is lactylated on two adjacent lysine residues (K347 and K348). CCNE2 is known to control G1/S transition, thus promoting cell proliferation, migration, and invasion in tumor‐derived cells (Gudas et al, 1999). Importantly, elevated CCNE2 was highly associated with the poor prognosis of HCC patients (Geng et al, 2018; Sonntag et al, 2018). We thus proposed that the tumor‐suppressing function of SIRT3 in HCC could be through regulating the Kla level on CCNE2.
Figure EV1. Validation of the cell samples prepared for the SILAC‐MS/MS experiment.
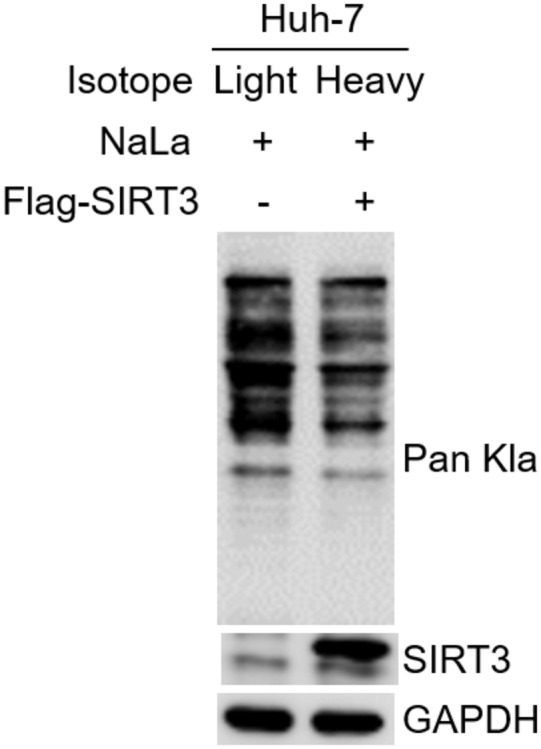
Huh7 cells, without or with Flag‐tagged SIRT3 overexpression, were cultured in medium with light or heavy isotope, respectively. Immunoblot of Kla and SIRT3 in the total cell lysates that were isolated from the above Huh7 cells upon NaLa treatment (25 mM for 24 h). GAPDH was used as the loading control.
Figure 2. Identification of SIRT3 delactylation targets in Huh7 cells.
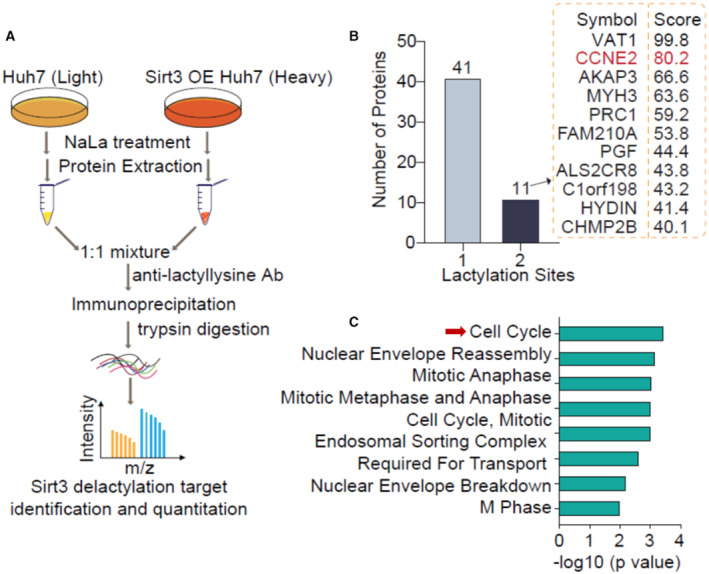
- The schematic overview of the SILAC combined with HPLC‐MS/MS strategy to identify SIRT3 delactylation targets. Huh7 cells (without or with SIRT3 overexpression) were cultured in a medium with light or heavy isotopes, respectively. After the total cell lysates extraction, the isotopically labeled lysates were mixed and immunoprecipitated with anti‐lactyllysine antibody‐conjugated beads, and then were proceed to HPLC‐MS/MS analysis.
- The distribution of the number of lysine lactylation sites per protein.
- The pathway functional enrichment analysis of lysine lactylated proteins.
CCNE2 is a delactylation substrate of SIRT3
To validate whether CCNE2 is a direct lactyl substrate of SIRT3, we investigated the capacity of SIRT3 to remove Kla from CCNE2 in vitro. Purified recombinant human SIRT3 WT or SIRT3 H248Y functional mutant proteins were added into Flag‐tagged CCNE2, which was immunoprecipitated from Huh7 cells treated with NaLa. In the presence of NAD+, SIRT3 WT treatment led to a dramatic reduction of the Kla level on CCNE2, whereas SIRT3 H248Y mutant did not affect the Kla level on CCNE2 (Fig 3A), supporting that SIRT3 has the capacity to directly remove the Kla from CCNE2. To further investigate whether SIRT3 regulates lysine acetylation (Kac) level on CCNE2, we overexpressed or knockdowned SIRT3, respectively, in Huh7 cells to examine the level of Kla and Kac on the overexpressed Flag‐tagged CCNE2. The result showed that compared to the mutant H248Y overexpression, SIRT3 WT overexpression indeed downregulated the Kla level on CCNE2 (Fig 3B), while the knockdown of SIRT3 dramatically upregulated the Kla level (Fig 3C). However, there was no obvious effect on the Kac level. These data further revealed that CCNE2 is a delactylation substrate of SIRT3.
Figure 3. Validation of CCNE2 as the delactylation target of SIRT3.
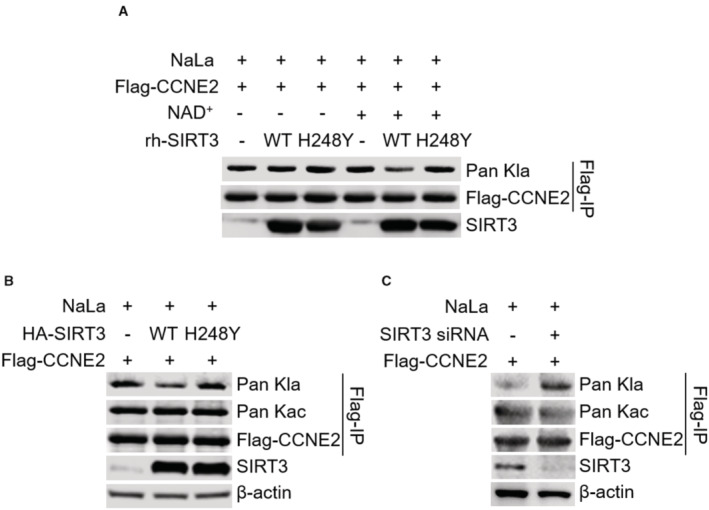
- The immunoblot of Kla in the anti‐Flag immunoprecipitates. The immunoprecipitates were incubated with BSA, rh‐SIRT3 WT or H248Y mutant proteins in vitro, respectively, in the absence or presence of NAD+. Flag‐tagged CCNE2 was used as the loading control. The Flag‐IP was performed in the Huh7 cells with Flag‐tagged CCNE2 overexpression upon NaLa treatment (25 mM for 24 h). The shown image is representative of three biological replicates.
- The immunoblot of Kla and Kac in the anti‐Flag immunoprecipitates. The immunoprecipitates were isolated from the Huh7 cells overexpressing Flag‐tagged CCNE2 without or with SIRT3 overexpression upon NaLa treatment (25 mM for 24 h). Flag‐tagged CCNE2 was used as the loading control. The shown image is representative of three biological replicates.
- The immunoblot of Kla and Kac in the anti‐Flag immunoprecipitates. The immunoprecipitates were isolated from Huh7 cells overexpressing Flag‐tagged CCNE2 without or with SIRT3 siRNA transfection upon NaLa treatment (25 mM for 24 h). Flag‐tagged CCNE2 was used as the loading control. The shown image is representative of three biological replicates.
Crystallographic study of SIRT3 catalyzing the lactylated CCNE2 peptide
To investigate the mechanism of SIRT3 catalyzing the removal of lactylation from CCNE2, the crystallographic study was then performed. The recombinant SIRT3 was cocrystallized with CCNE2 peptide having lactylation on K347 or K348 (CCNE2 K347la or K348la). Cubic crystals were obtained, and the complex structure of SIRT3/CCNE2K348la was solved. Statistics of crystallographic data collection and refinement are summarized in Table EV2. An additional enzymatic assay for SIRT3 catalyzing CCNE2 Kla347/348 peptide was also performed and shows a relatively mediate delactylation activity of SIRT3 at the peptide level (Table EV3).
The overall structure contains two SIRT3 molecules anchoring one CCNE2 K348la peptide (Fig 4A). The lactyl lysine (CCNE2 K348) and the nearby F8 (CCNE2 F346) are accommodated together into the catalytic pocket consisting of several hydrophobic residues containing F157, F180, I231, F294, and V324 (Fig 4B). The binding pattern of lactyl lysine is similar to that of acetyl lysine binding to SIRT3 (Fig 4C). A significant conformational change happened from a loop region consisting of D156, F157, and R158 residues facilitating the Kla group binding into the pocket, which generates a particular conformation compared to that when SIRT3 binding with Kac (Fig 4C). Besides, the F157 participates in the formation of a special niche to accommodate two extra imidazole molecules (IMDs), which come from the crystallographic additive‐condition (Fig 4B and D). The 2fo‐fc electron density map at 1.0 σ shows the density of the two IMDs (Fig EV2). In particular, the two IMDs form π‐stacking with each other, which are accommodated together in the niche mentioned also formed by V324, F294, as well as F8 from CCNE2 peptide (Fig 4B). The hydrogen bond might be formed between the hydroxyl moiety from Kla and IMDs. Moreover, compared to the SIRT3/Kac complex, the conformational change of V324 might facilitate the accommodation of these two imidazoles to bridge the interaction of SIRT3 with the substrate (Fig 4D). In short, SIRT3 is able to act as a delactylase to catalyze the removal of lactyl lysine from CCNE2.
Figure 4. Crystallographic studies of SIRT3 in complex with CCNE2K348la.
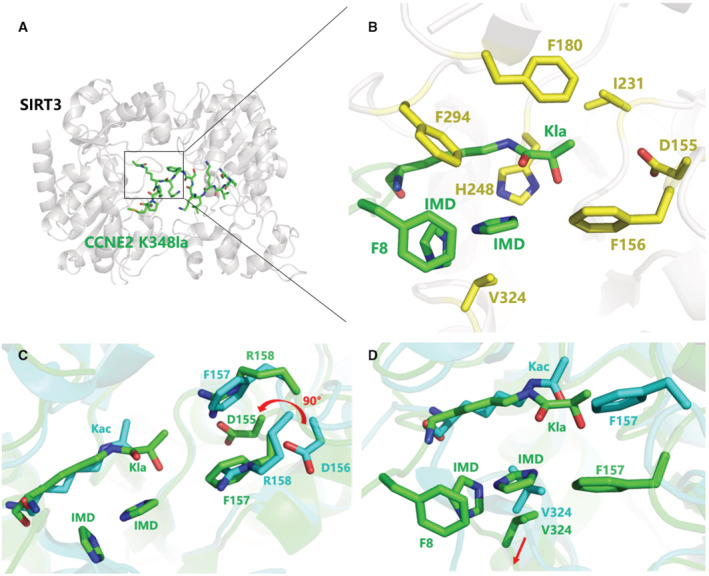
- The overall complex structure of SIRT3 (gray) interaction with CCNE2K348la peptide (green).
- The catalytic pocket of SIRT3 catalyzing the Kla group. Several residues (yellow) consist of the pocket to accommodate the Kla group, nearby Phe8 and two imidazole molecules (green).
- The structural superimposition of SIRT3/CCNE2Kla (green) with SIRT3/AceCS2Kac (PDB 3GLR, Cyan). The reconfiguration of the residues (D156, F157, R158) in the catalytic pocket facilitates the Kla group binding compared to those conformations when SIRT3 binds with Kac.
- A conformational change of the residue V324 facilitates the formation of a pocket together with F8 from CCNE2 peptide and re‐organizes F157 to accommodate two imidazoles bridging the interaction of SIRT3 with the peptide substrate.
Figure EV2. 2Fo‐Fc electron density map of peptide together with two imidazole molecules.
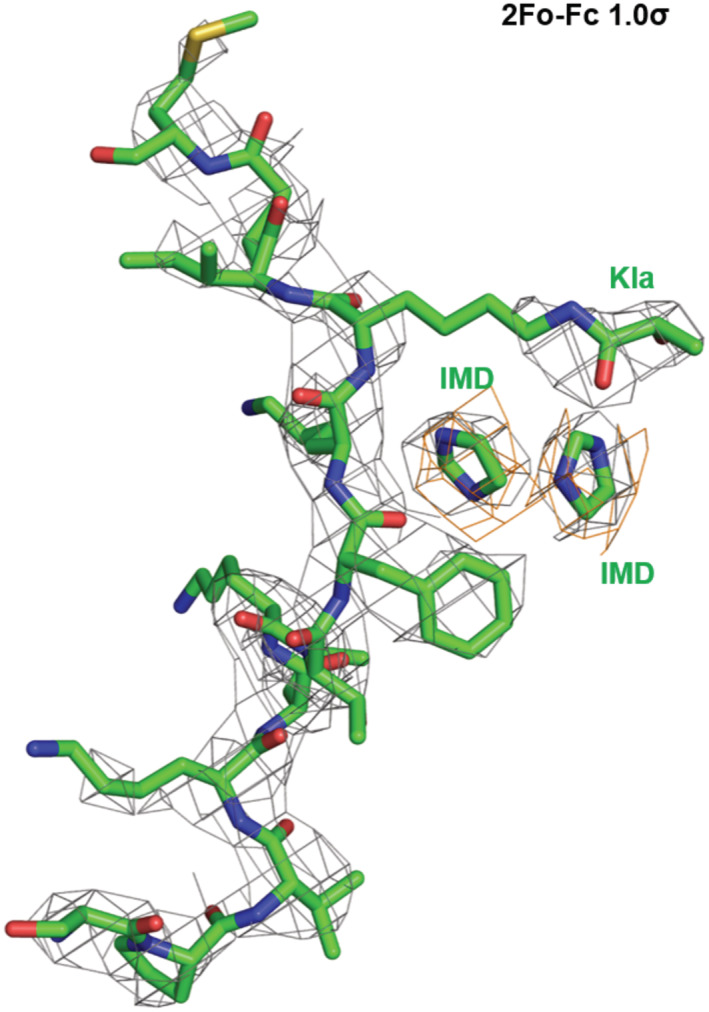
The 2fo‐fc map of overall (green) is created at 1.0 σ while the fo‐fc map (orange) for the two imidazole molecules is at 2σ.
Lysine lactylation of CCNE2 promotes proliferation, migration, and invasion of HCC cells
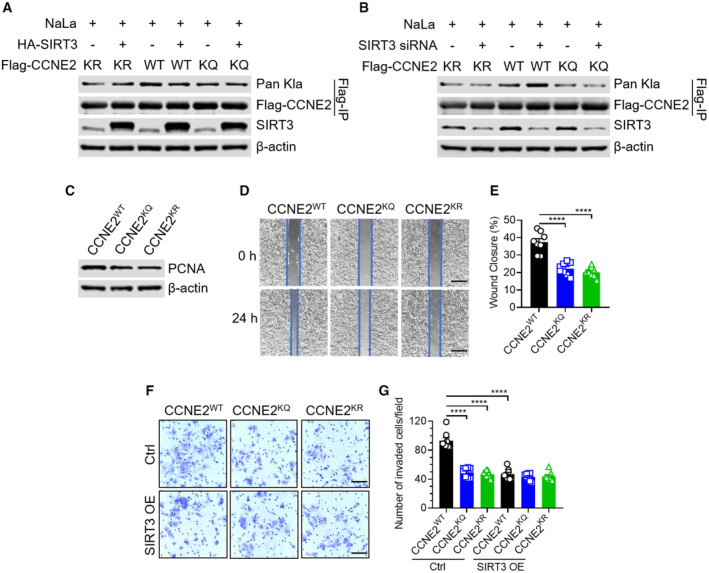
To further confirm whether SIRT3 could regulate K347la and K348la on CCNE2, we constructed two mutants K347/348Q (labeled as KQ) to mimic protein with acetyl lysine, or K347/348R (labeled as KR) to mimic protein with free lysine. Next, we overexpressed Flag‐tagged CCNE2 WT, KR, or KQ in Huh7 cells without or with SIRT3 overexpression or knockdown. The results showed WT CCNE2 has the highest level of Kla, compared to KR or KQ CCNE2. Notably, the Kla level on WT CCNE2 could be affected by the SIRT3 overexpression or knockdown, while that on KR or KQ CCNE2 is unresponsive (Fig 5A and B). These data confirmed that K347 and K348 on the CCNE2 could be lactylated and regulated by SIRT3 in cells. To further investigate the effect of Kla on the function of CCNE2, the Flag‐tagged CCNE2 WT, KQ, or KR were transfected into the CCNE2 knockdown (KD) Huh7 cells (Fig EV3). Immunoblotting results showed that compared to the cells overexpressing CCNE2 WT, the cells with KQ or KR mutant overexpression have reduced cell proliferation that is proved by the downregulated expression of PCNA (proliferating cell nuclear antigen; Gramantieri et al, 2003; Fig 5C). Furthermore, the wound healing and transwell invasion assays demonstrated that, compared to the cells with CCNE2 WT overexpression, those overexpressing the KQ or KR mutant have impaired cell migration and invasion ability (Fig 5D–G). These results indicated that the Kla on CCNE2 is essential for its role in promoting HCC cell growth. Moreover, the functional difference was compared among the CCNE2 WT, KQ, or KR in the cells without or with SIRT3 overexpression. The overexpression of SIRT3 indeed inhibited cell invasion in the cells overexpressing CCNE2 WT, but had no effect on those overexpressing the KQ or KR mutant (Fig 5F and G). These results indicated that SIRT3 could suppress HCC cell growth by regulating the Kla level on CCNE2.
Figure 5. Lysine lactylation of CCNE2 promotes proliferation, migration and invasion of Huh7 cells.
-
AThe immunoblot of Kla in the anti‐Flag immunoprecipitates. The immunoprecipitates were isolated from Huh7 cells overexpressing Flag‐tagged CCNE2 KR/WT/KQ without or with HA‐tagged SIRT3 overexpression upon NaLa treatment (25 mM for 24 h). Flag‐tagged CCNE2 was used as the loading control. The immunoblot of SIRT3 in the total cell lysates isolated from the above cells. β‐actin was used as the loading control. The shown image is representative of three biological replicates.
-
BThe immunoblot of Kla in the anti‐Flag immunoprecipitates. The immunoprecipitates were isolated from Huh7 cells overexpressing Flag‐tagged CCNE2 KR/WT/KQ without or with SIRT3 siRNA transfection upon NaLa treatment (25 mM for 24 h). Flag‐tagged CCNE2 was used as the loading control. The immunoblot of SIRT3 in the total cell lysates isolated from the above cells. β‐actin was used as the loading control. The shown image is representative of three biological replicates.
-
CThe immunoblot of PCNA in the anti‐Flag immunoprecipitates. The immunoprecipitates were isolated from CCNE2 KD Huh7 cells that were transfected with Flag‐tagged CCNE2 WT, KQ or KR plasmids, respectively. β‐actin was used as the loading control. The shown image is representative of three biological replicates.
-
D, EThe CCNE2 KD Huh7 cells, transfected with Flag‐tagged CCNE2 WT, KQ or KR, were subjected to wound‐healing assay. The images (D) and quantification (E) of the percentages of wound closure were shown in mean ± SEM (n = 8); ****P < 0.0001; Unpaired t‐test. Scar bars, 560 μm. Data are representative of three biological replicates.
-
F, GThe CCNE2 KD Huh7 cells, transfected with Flag‐tagged CCNE2 WT, KQ or KR, were subjected to transwell invasion assay in the presence of SIRT3 OE or not. The images (F) and quantification (G) of the numbers of invaded cells were shown in mean ± SEM (n = 8); ****P < 0.0001; Unpaired t‐test. Scar bars, 110 μm. Data are representative of three biological replicates.
Figure EV3. The confirmation of CCNE2 knockdown (KD) in cells.
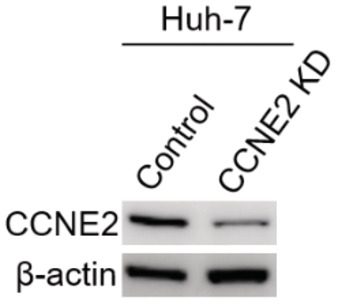
The immunoblot of CCNE2 in the total cell lysates isolated from Huh7 cells without or with CCNE2 knockdown. β‐actin was used as the loading control.
The activation of SIRT3 by Honokiol induces HCC cell apoptosis by regulating the Kla level on CCNE2
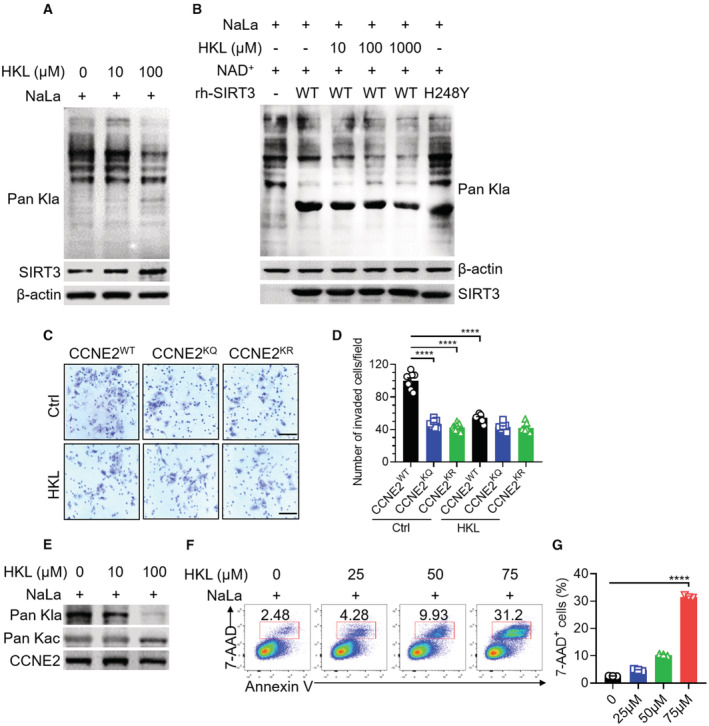
To further examine whether the delactylation activity of SIRT3 contributes to the inhibition of HCC cell growth, we used Honokiol (HKL), a novel natural agent, that has been reported to be the activator of SIRT3 (Pillai et al, 2015), to treat Huh7 cells in the presence of NaLa. Indeed, HKL treatment enhanced SIRT3 expression in a dose‐dependent manner, leading to downregulated Kla levels (Fig 6A). While in SIRT3 KD Huh7 cells, the decrease of the overall tendency of Kla level was not happened upon HKL treatment (Fig EV4), indicating that HKL may work through SIRT3. To validate whether HKL could directly activate SIRT3 in vitro, we added the recombinant human SIRT3 WT into the total cell lysates isolated from Huh7 cells with NaLa treatment in the presence of varied doses of HKL. The result demonstrated the reduction of Kla level with gradually increasing HKL (Fig 6B), indicating that HKL could directly activate SIRT3 to remove Kla. To further confirm that HKL could activate SIRT3 to regulate the Kla level on CCNE2, the functional difference was also compared among the CCNE2 WT, KQ, or KR in the cells upon the HKL treatment or not. HKL treatment substantially inhibited cell invasion in the cells overexpressing the CCNE2 WT, rather than the KQ or KR mutant (Fig 6C and D), indicating that the activation of SIRT3 by HKL could suppress HCC cell growth by regulating the Kla level on CCNE2. Moreover, the activation of SIRT3 by HKL significantly reduced the level of Kla rather than the Kac on CCNE2 (Fig 6E), resulting in the increased apoptosis of Huh7 cells (Fig 6F and G). These results indicated that the activation of SIRT3 by HKL induces the apoptosis of HCC cells by removing the Kla from CCNE2, suggesting that the activation of SIRT3 by HKL may inhibit HCC outgrowth in vivo.
Figure 6. HKL treatment activates SIRT3 to induce apoptosis through regulating the Kla level on CCNE2 in Huh7 cells.
-
AThe immunoblot of Kla and SIRT3 in the total cell lysates. The lysates were isolated from Huh7 cells upon NaLa treatment (25 mM) together with HKL treatment (0, 10 and 100 μM) for 24 h. β‐actin was used as the loading control. The shown image is representative of three biological replicates.
-
BThe immunoblot of Kla in the total cell lysates, isolated from the Huh7 cells upon NaLa treatment, were incubated with BSA, rh‐SIRT3 WT (in the absence or presence of the indicated doses of HKL) or H248Y mutant proteins in vitro, respectively. β‐actin was used as the loading control. The shown image is representative of three biological replicates.
-
C, DThe CCNE2 KD Huh7 cells, transfected with Flag‐tagged CCNE2 WT, KQ or KR, were subjected to transwell invasion assay in the absence or presence of HKL treatment (10 μM for 24 h). The images (C) and quantification (D) of the numbers of invaded cells were shown in mean ± SEM (n = 8); ****P < 0.0001; Unpaired t‐test. Scar bars, 110 μm. Data are representative of three biological replicates.
-
EThe immunoblot of Kla and Kac on the endogenous CCNE2 in Huh7 cells upon NaLa treatment (25 mM) together with HKL treatment (0, 10 and 100 μM) for 24 h. β‐actin was used as the loading control. The shown image is representative of three biological replicates.
-
FThe percentages of 7‐AAD+ cells were determined by flow cytometry. The flow cytometry detection was performed in Huh7 cells upon NaLa treatment (25 mM) together with HKL treatment (0, 25, 50 and 75 μM) for 24 h. The shown image is representative of three biological replicates.
-
GThe quantification of the percentages of 7‐AAD+ cells that were determined in (F). The results are expressed as mean ± SEM (n = 3); ****P < 0.0001; Unpaired t‐test. Data are representative of three biological replicates.
Figure EV4. The effect of HKL treatment in SIRT3 KD Huh7 cells.
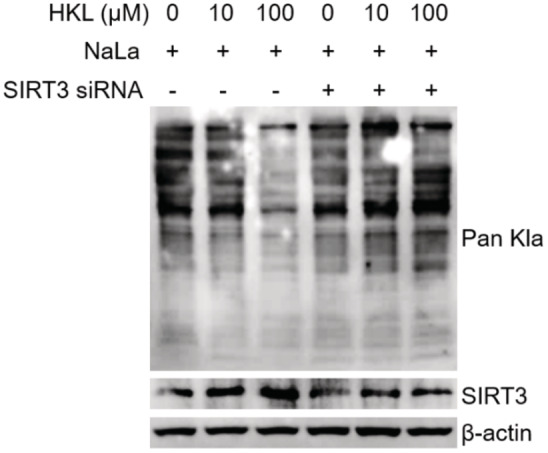
The immunoblot of Kla and SIRT3 in Huh7 cells. The cells, without or with SIRT3 knockdown, were treated by NaLa (25 mM) together with HKL (0, 10 and 100 μM) for 24 h. β‐actin was used as the loading control. The shown image is representative of three biological replicates.
The activation of SIRT3 by Honokiol prevents HCC outgrowth in vivo
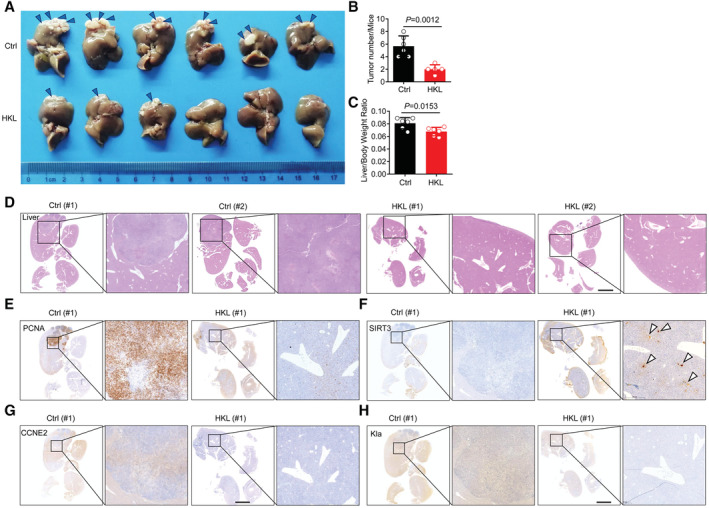
To further investigate whether the activation of SIRT3 by HKL could decrease Kla level and then inhibit HCC outgrowth in vivo, we established an HCC model in mice that were orthotopically injected with Hepa1‐6 cells (Kimura et al, 2018), a murine HCC cell line. The HCC mice were subjected to HKL treatment (10 mg/kg) three times a week. Notably, HKL treatment significantly reduced liver tumor burden (Fig 7A–C), without changing the body weight of mice (Fig EV5A and B), or causing pathological damage in the kidney and spleen (Fig EV5C). Furthermore, HKL treatment dramatically reduced pathological damage in the liver (Fig 7D) and suppressed tumor proliferation (Fig 7E). As expected, consistent with the results in HCC cells, immunohistochemistry (IHC) staining results showed that HKL treatment enhanced SIRT3 expression in the liver (Fig 7F), leading to the decreased Kla level on CCNE2 in vivo (Fig 7G and H). These results demonstrated the activation of SIRT3 by HKL could effectively inhibit HCC outgrowth through the regulation of the Kla level in vivo, indicating SIRT3 may be a potential therapeutic target for curing HCC.
Figure 7. HKL treatment activates SIRT3 to prevent HCC outgrowth in vivo .
-
ARepresentative pictures of HCC on day 21 from control mice (above) and mice treated with HKL (below). n = 6 for each group. The arrowheads show the area where the tumor is growing. Data are representative of three independent experiments.
-
B, CQuantification of liver tumor number (B) as well as liver/ body weight ratio (C) in mice from the control group and HKL group at autopsy on day 20. The results are expressed as mean ± SD (n = 6); Unpaired t‐test. P‐value was described in the figure.
-
DRepresentative hematoxylin and eosin (H&E) staining of harvested liver tissues from the control group and HKL group. Scale bars, 5 mm. Data are representative of three independent experiments.
-
E–HRepresentative images of immunohistochemistry (IHC) staining of PCNA (E), SIRT3 (F), CCNE2 (G) and Kla (H) in liver tissue sections of mice from the control group and HKL group. Scale bars, 5 mm. Data are representative of three independent experiments.
Figure EV5. HKL treatment did not cause pathological damage in the kidney or spleen in vivo .
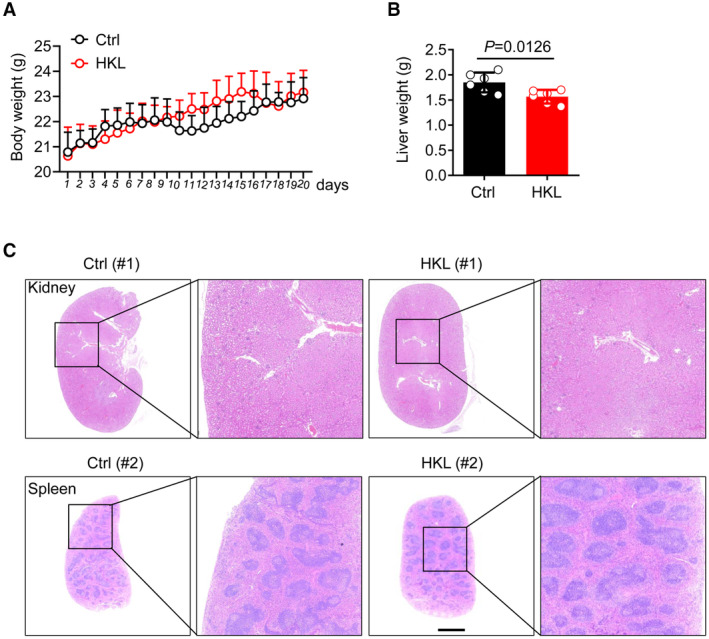
- Body weight of individual mice from the control group and HKL group from day 1 to day 20. The results are expressed as mean ± SD (n = 6). Data are representative of three biological replicates.
- Quantification of liver weight in mice from the control group and HKL group at autopsy on day 20. The results are expressed as mean ± SD (n = 6); Unpaired t‐test. P‐value was described in the figure.
- Representative hematoxylin and eosin (H&E) staining of harvested kidney tissues (above), and spleen tissues (below) from the control group and HKL group. Scale bars, 5 mm. Data are representative of three independent experiments.
Discussion
In summary, our integrative studies illustrate a specific mechanism of SIRT3 catalyzing the removal of lactylation from the nonhistone proteins to suppress HCC development. SIRT3 regulates the Kla level on CCNE2 which modulates the cell cycle, leading to impeded HCC progression. In addition, HKL, a small molecule activator of SIRT3, could enhance the delactylation activity of SIRT3, thus inducing HCC cell apoptosis and preventing HCC outgrowth in vivo.
The significance of our finding is several folds. First, it expands the biological significance of protein lysine lactylation. Kla, as a novel PTM, was first reported in 2019 (Zhang et al, 2019). Since then, in mammalian cells, only histones were known to have this modification to mediate gene expression (Irizarry‐Caro et al, 2020; Hagihara et al, 2021; Jiang et al, 2021; Yu et al, 2021; Pan et al, 2022; Xiong et al, 2022). While, whether Kla has important biological functions on non‐histone proteins were not well known (Yang et al, 2021). This finding of Kla contributes to tumorigenesis by regulating the cell cycle in HCC progression, reveals the oncogenic role of non‐histones Kla, and broadens the understanding of Kla during tumorigenesis. Second, it reveals that delactylation is a physiological activity for SIRT3. This finding that SIRT3 inhibits HCC progression by removing Kla from the cell cycle‐related proteins supports the tumor‐suppressive role of SIRT3 in HCC. Of note, this finding further expands previous reports regarding SIRT3 as deacetylase in cancer. The tumor microenvironment (TME) is enriched with metabolites, such as lactate and acetyl‐CoA, which are also the precursors of Kla and Kac. Therefore, both the Kla and Kac can have important roles during tumor progression. In addition, it is reported that Kla exhibits different dynamics from Kac (Zhang et al, 2019), indicating these two PTMs may have distinct functions in vivo. Thus, it is conceivable that the substrates as well as the mechanism of SIRT3 as delactylase are different from those of SIRT3 as deacetylase. Third, it provides that activation of SIRT3 might be a therapeutic method for HCC. Besides, based on the complex structure of SIRT3 and CCNE2 K348la, a special niche sparing for two imidazole molecules also might provide a clue for the contingent activators design to treat HCC by targeting SIRT3.
Materials and Methods
Expression and purification of SIRT3 and mutant
The gene coding the wide‐type human SIRT3 (118–399) and the mutant H248Y were cloned to a pET28‐derived vector containing an N‐terminal 6xHis tag with a TEV protease cleavage motif. The plasmid was transformed into Escherichia coli BL21‐AI™ competent cells and was overexpressed in LB medium at 16°C for 20 h following induction with 0.2% arabinose and 0.2 mM isopropyl β‐D‐1‐thiogalactopyranoside (IPTG) at OD 600 0.5. Cells were harvested and resuspended in lysis buffer of 20 mM Tris, pH 8.0, 0.5 M NaCl, 1 mM phenylmethanesulfonyl fluoride (PMSF) and then lysed by sonication for centrifugation. The supernatant went through a HisTrap HP nickel column (GE Healthcare) preequilibrated with lysis buffer and then eluted in with a linear gradient imidazole. Fractions were pooled and treated with TEV protease at 4°C overnight for His‐tag cleavage. After cleaving the His‐tag, SIRT3 was isolated through a HiTrap Q HP column (GE Healthcare) at a low salt concentration (50 mM NaCl) and washed with a linear gradient sodium chloride. Pure fractions were concentrated and then stored at −80°C for further usage. The production of mutant H248Y was the same as wide‐type SIRT3.
Cell lines and cell culture
Huh7 cells and Hepa1‐6 cells, verified by STR profiling test, were obtained from Cell Bank/Stem cell Bank, Chinese Academy of Sciences (Shanghai, China). The cells were cultured in Dulbecco's Modified Eagle Medium (DMEM; HyClone) supplemented with 10% heat‐inactivated fetal bovine serum (FBS; Gibco) and 1% penicillin/streptomycin (Gibco). The cells were maintained in a humidified incubator at 37°C, 5% CO2.
Generation of SIRT3 knock‐down (KD) Huh7 cell
Human SIRT3 siRNA (Horizon Discovery) was transfected into Huh7 cells with Lipofectamine RNAiMAX transfection reagent (Thermo Fisher Scientific, 13778075) according to the manufacturer's instructions. Corresponding control siRNA (Horizon Discovery) was used as the negative control. Following transfection, the cells were maintained in a humidified 37°C incubator with 5% CO2 for 72 h.
Generation of CCNE2 knock‐down (KD) Huh7 cells
CCNE2 shRNA plasmid (h) (Santa Cruz, sc‐37594‐SH) was transfected into Huh7 cells according to the manufacturer's instructions. Corresponding control shRNA plasmid (Santa Cruz, sc‐108060) was used as the negative control. Following transfection, the cells were selected using 2 μg/ml puromycin (Santa Cruz, sc‐108071).
Generation of CCNE2 KD Huh7 cells with Flag‐tagged WT, KQ, or KR CCNE2 knock‐in (KI)
The pCMV vectors containing 3 × Flag‐tagged WT, KQ, or KR were transfected into CCNE2 KD Huh7 cells with Lipofectamine 3000 transfection reagent (Thermo Fisher Scientific, L3000015) according to the manufacturer's instructions. Following transfection, the cells were maintained in a humidified 37°C incubator with 5% CO2 for 48 h.
Total cell lysates extraction
Cells were collected, washed twice with ice‐cold PBS, and pelleted at 500 g for 5 min at 4°C. The cell pellets were then lysed in lysis buffer (25 mM Tris, pH 7.4, 150 mM NaCl, 10% glycerol, 1% Nonidet P‐40) with a protease inhibitor cocktail (Roche). The supernatant was collected after centrifugation at 14,000 g for 20 min at 4°C and then used for immunoprecipitation or western blot.
Immunoprecipitation of Flag‐tagged CCNE2 using anti‐Flag affinity gel
Two hundred and fifty micrograms total cell lysates (from the Huh7 cells overexpressing Flag‐tagged CCNE2 WT/KQ/KR) were incubated with anti‐Flag M2 affinity gel (Sigma, A2220) for 4 h at 4°C. After centrifugation at 1000 g for 5 min at 4°C, the affinity gel was washed three times with washing buffer (25 mM Tris, pH 7.4, 150 mM NaCl, 0.2% Nonidet P‐40) and then used for in‐solution delactylation experiment.
In‐solution delactylation experiment
Anti‐Flag immunoprecipitates were incubated with 10 μM identical concentration of BSA, SIRT3, or H248Y mutant in 20 μL of reaction buffer (50 mM Tris–HCl, 100 mM NaCl, pH 7.4) containing 2 mM NAD+ at 37°C for 30 min.
Western blot
Protein samples were separated by 15% SDS‐PAGE and transferred onto a PVDF membrane that was then blocked with 5% non‐fat milk in TBST (25 mM Tris, 150 mM NaCl, 0.1% Tween‐20, pH 7.4) for 1 h at room temperature. The membrane was incubated with primary antibodies diluted in (5% BSA) TBST overnight at 4°C, washed with TBST three times, incubated with HRP‐conjugated secondary antibodies in (5% BSA) TBST for 1 h at room temperature, and then washed with TBST for three times and visualized with western blotting detection reagents (Bio‐Rad, #1705061) on Azure 300 imager (Azure Biosystems, Dublin, CA, USA). The images were analyzed by ImageJ software. Primary antibodies: Pan‐anti‐Kla Rabbit mAb (PTM Bio Inc, PTM‐1401RM); Pan‐anti‐Kac Mouse mAb (PTM Bio Inc, PTM‐101); anti‐Flag M2 antibody (Sigma, F1804); Anti‐cyclin E2 antibody (Santa Cruz, sc‐28351); SIRT3 (C73E3) Rabbit mAb (#2627); PCNA (PC10) Mouse mAb (#2586); β‐actin (8H10D10) Mouse mAb (#3700); and GAPDH (D4C6R) Mouse mAb were purchased from Cell Signaling Technology (CST). Secondary antibodies: anti‐rabbit IgG, HRP‐linked antibody (#7074); anti‐mouse IgG, HRP‐linked antibody (#7076) were from Cell Signaling Technology (CST).
Cell migration and invasion assay
The wound‐healing assay was used to measure cell migration ability. A straight scratch was created on cells, seeded in 60‐mm cell culture dishes, using a 10 μL pipette tip. After wounding, the cells were cultured in a serum‐free medium. Twenty‐four hours later, wound healing was imaged by Echo Revolve microscope (Echo Laboratories, San Diego, CA, USA) and analyzed by ImageJ software. The transwell system with matrigel invasion chambers (Corning, #354480) was used to measure cell invasion assay. Cells were serum starved for 6 h before being seeded into the upper Matrigel‐coated chambers filled with serum‐free medium. The lower chambers were filled with medium containing 10% FBS as a chemoattractant. Twenty‐four hours later, the cells that invaded the lower surface were fixed and then stained with 0.1% crystal violet (Beyotime Biotech, C0121). The stained cells were imaged by Echo Revolve microscope (Echo Laboratories, San Diego, CA, USA) and analyzed by ImageJ software.
Flow cytometry
Cells were labeled with 7‐AAD (BD Biosciences, #559925) and Annexin V (BD Biosciences, #556419) according to the manufacturer's instructions. Stained cells were then detected on an LSR II flow cytometer (BD Biosciences) and analyzed with FlowJo software (Tree Star).
Statistical analysis
Statistical analysis was performed with GraphPad Prism 8.0 software to assess differences between experimental groups. Statistical significance was analyzed by two‐tailed Student's t‐test and expressed as a P‐value. The difference between the groups was considered to be statistically significant when P < 0.05. *, **, *** and **** indicate P < 0.05, P < 0.01, P < 0.001, and P < 0.0001, respectively. ns indicates no significance.
Stable isotope labeling of amino acids in cell culture (SILAC)
Huh7 cells were cultured in DMEM with L‐Lysine and L‐Arginine for six generations. Huh7 cells with SIRT3 overexpression (OE) were cultured in DMEM with 13C6 15N2‐L‐Lysine and 13C6 15N4‐L‐Arginine for six generations. Then, the cells were treated with 25 mM sodium L‐lactate (Sigma, #71718) for 24 h before cell harvesting. The harvested cell pellets were proceeded to total cell lysates using the methods described above. After quantifying the concentration of the total cell lysates by BCA assay, lysates of each pair of samples (light labeled and heavy labeled) were mixed at a ratio of 1:1 and immunoprecipitated by pan‐anti‐Kla Rabbit mAb (PTM Bio Inc, PTM‐1401RM), followed by incubation with protein A/G plus‐agarose (Santa Cruz, sc‐2003) pull‐down. Finally, the immunoprecipitates were used for HPLC‐MS/MS analysis.
HPLC‐MS/MS analysis
Samples were analyzed on a Q Exactive HF‐X mass spectrometer (Thermo Fisher Scientific) coupled with a high‐performance liquid chromatograph (EASY‐nLC 1200 System, Thermo Fisher Scientific). Dried peptide samples were dissolved in solvent A (0.1% formic acid in water) and loaded onto a trap column (100 μm × 2 cm, home‐made; particle size, 3 μm; pore size, 120 Å; SunChrom) with a maximum pressure of 280 bar using solvent A, then separated on a home‐made 150 μm × 12 cm silica microcolumn (particle size, 1.9 μm; pore size, 120 Å; SunChrom) with a gradient of 5–35% mobile phase B (acetonitrile and 0.1% formic acid) at a flow rate of 600 nl/min for 75 min. MS analysis was conducted with one full scan (300–1,400 m/z, R = 120,000 at 200 m/z) at an automatic gain control target of 3e6 ions, followed by up to 20 data‐dependent MS/MS scans with higher energy collision dissociation (target 5e4 ions, max injection time 20 ms, isolation window 1.6 m/z, normalized collision energy of 27%). Detection was done using Orbitrap (R = 7,500 at 200 m/z). Data were acquired using the Xcalibur software (Thermo Fischer Scientific).
SILAC‐based quantification
Quantification was analyzed by Maxquant. Ratio H/L derived from Maxquant was then normalized by protein abundance.
Kinetic assay
Peptide with the sequence of CCNE2 K347la WWLKTFK (La) KIPMED and CCNE2 K348la WWLKTFKK (La) IPMED were used for kinetic assay of SIRT3 as delactylase. Sirt3‐WT (5 μM) was incubated in a 120 μl reaction mixture (50 mM Tris pH 8.0, 1 mM NAD+, 50 μM peptide) at 37°C for 2 h. Afterward, the reactions were quenched with 100 mM HCl and 160 mM AcOH, then centrifuged at 12,000 g for 10 min. Finally, the supernatant was collected and analyzed by HPLC with a reversed‐phase C18 column (InertSustain AQ‐C18 5 μm 4.6 × 250 mm Column). The solvents used for HPLC were water with 0.1% trifluoroacetic acid and acetonitrile. Product quantification was based on the area of absorbance monitored at 280 nm. All experiments were duplicated.
Crystallization and structure determination
SIRT3 (8 mg/ml) was incubated with 1 mM CCNE2 peptides with K347la (SPVKLKTFK*KIPMEDRHNW) or K348la (SPVKLKTFKK*IPMEDRHNW) at 4°C for 2 h before crystallization. Crystallization was performed by hanging drop vapor‐diffusion method at 291 K with commercial screens from Hampton Research. The additive screening was performed to optimize crystals for diffraction improvement. Cubic crystals appeared after 2 days in 0.8 M succinic acid, pH 7.0, 0.01 M imidazoles for both peptides. Crystals were introduced into a cryogenic liquor of the reservoir condition added with 30% glycerol for cryoprotection. The X‐ray diffraction data were collected at Shanghai Synchrotron Radiation Facility beamline BL19U1 (λ = 0.9999 Å) at 100 K, and the following indexing and integration were performed by using HKL3000 (Otwinowski & Minor, 1997). SIRT3 with the K2 peptide, as well as the imidazoles from additive, could give better diffraction, and the complex structure was solved by molecular replacement using Phaser (McCoy et al, 2007) in CCP4 (Bailey et al, 1994) with the apo SIRT3 (PDB: 3GLS) as a search model. The structural refinement was via REFMAC5 (Bailey et al, 1994). Table EV2 demonstrated the summary of the X‐ray diffraction data collection and the refinement statistics. The coordinates, as well as the structural factors, have been deposited in the Protein Data Bank under the accession code (8HN9).
Human samples
All human tissues used in the present study were obtained under the approval of the Ethics Committee of the University of Science and Technology of China (USTCEC201600004; Hefei, China). Written informed consent was obtained from all patients.
Mice
Male C57BL/6 wide‐type mice (WT; 6 weeks old) were purchased from the Shanghai Experimental Animal Center of the Chinese Academy of Science (Shanghai, China). All of the experimental procedures involving animals were performed following the National Guidelines for Animal Usage in Research (China). The experimentalist was blinded to all samples during data collection and analysis. The permission for these animal studies was obtained from the Ethics Committee at the University of Science & Technology of China (USTCACUC1701038; Hefei, China). All mice were kept under specific pathogen‐free (SPF) conditions.
Establishment of the HCC model and Honokiol treatment
The HCC model was constructed by administering a single intrahepatic injection of Hepa1‐6 cells (1 × 10⁶/20 μl) into male C57BL/6 mice, followed by intraperitoneal injection of Honokiol (10 mg/kg) or phosphate‐buffered saline (PBS; controls) three times/week. Finally, all of the mice were sacrificed at the specified time points.
Histology and immunohistochemistry analysis
All liver tissues were first fixed in 4% neutral buffered formalin for standard histological processing (Wang et al, 2019). Next, 6‐μm‐thick sections were carefully cut and stained with hematoxylin and eosin (HE). For immunohistochemistry (IHC) analysis, liver tissues were deparaffinized and heat‐induced antigen unmasking was conducted. Immunohistochemical stainings were performed with antibodies as follows: Pan‐anti‐Kla Rabbit mAb (PTM Bio Inc, PTM‐1401RM); PCNA (PC10) Mouse mAb (CST, #2586); SIRT3 (C73E3) Rabbit mAb (CST, #2627); Anti‐Cyclin E2 antibody (Abcam, ab40890). Images were taken with an OLYMPUS microscope and analyzed by ImageJ software.
Author contributions
Jing Jin: Conceptualization; supervision; validation; investigation; writing – original draft; writing – review and editing. Lin Bai: Validation; investigation. Dongyao Wang: Validation; investigation. Wei Ding: Software; methodology. Zhuoxian Cao: Investigation; methodology. Peidong Yan: Validation; investigation. Yunjia Li: Investigation. Lulu Xi: Methodology. Yuxin Wang: Investigation. Xiaohu Zheng: Resources. Haiming Wei: Resources. Chen Ding: Conceptualization; supervision; investigation; writing – original draft; project administration; writing – review and editing. Yi Wang: Conceptualization; supervision; writing – original draft; project administration; writing – review and editing.
Disclosure and competing interests statement
The authors declare that they have no conflict of interest.
Supporting information
Expanded View Figures PDF
Table EV1
Table EV2
Table EV3
Dataset EV1
PDF+
Acknowledgements
We thank Dr. Hening Lin for reading the manuscript and providing helpful comments. This project was supported by the National Natural Science Foundation of China (21977121) (YW) and by the Important Direction Project Cultivation Fund, Institute of Immunology and the CAS Key Laboratory of Innate Immunity and Chronic Disease (WK3520000015) & University of Science and Technology of China (2021) (KY9100000040). The Fundamental Research Funds for the Central Universities (WK9100000009) (JJ). National Key R&D Program of China (2017YFA0505102) and National Natural Science Foundation of China (31770886, 31972933) (CD). The National Natural Science Foundation of China (No. 82100230) (DW). The Fundamental Research Funds for the Central Universities (WK9110000168) (DW). The crystallographic data were collected on BL19U of the Shanghai Synchrotron Radiation Facility (SSRF). We thank staff members at SSRF for their assistance in data collection.
EMBO reports (2023) 24: e56052
Contributor Information
Jing Jin, Email: jinjing19@ustc.edu.cn.
Chen Ding, Email: chend@fudan.edu.cn.
Yi Wang, Email: wy83@ustc.edu.cn.
Data availability
Proteome raw data have been deposited to the iProX partner repository (https://www.iprox.cn/) under Project ID: IPX0005700000. Supplementary data are also provided in this paper. The link access to the raw data is https://www.iprox.cn/page/PSV023.html;?url=1672646034745yv1b. Atomic coordinates and structure factors have been deposited in the Protein Data Bank under accession code 8HN9 (SIRT3 in complex with CCNE2K348la peptide).
References
- Ahn BH, Kim HS, Song S, Lee IH, Liu J, Vassilopoulos A, Deng CX, Finkel T (2008) A role for the mitochondrial deacetylase Sirt3 in regulating energy homeostasis. Proc Natl Acad Sci USA 105: 14447–14452 [DOI] [PMC free article] [PubMed] [Google Scholar]
- Alhazzazi TY, Kamarajan P, Verdin E, Kapila YL (2011) SIRT3 and cancer: tumor promoter or suppressor? Biochim Biophys Acta 1816: 80–88 [DOI] [PMC free article] [PubMed] [Google Scholar]
- Ansari A, Rahman MS, Saha SK, Saikot FK, Deep A, Kim KH (2017) Function of the SIRT3 mitochondrial deacetylase in cellular physiology, cancer, and neurodegenerative disease. Aging Cell 16: 4–16 [DOI] [PMC free article] [PubMed] [Google Scholar]
- Bailey S, Fairlamb AH, Hunter WN (1994) Structure of trypanothione reductase from Crithidia fasciculata at 2.6 a resolution; enzyme‐NADP interactions at 2.8 a resolution. Acta Crystallogr D Biol Crystallogr 50: 139–154 [DOI] [PubMed] [Google Scholar]
- Bell EL, Emerling BM, Ricoult SJ, Guarente L (2011) SirT3 suppresses hypoxia inducible factor 1alpha and tumor growth by inhibiting mitochondrial ROS production. Oncogene 30: 2986–2996 [DOI] [PMC free article] [PubMed] [Google Scholar]
- Chen Y, Fu LL, Wen X, Wang XY, Liu J, Cheng Y, Huang J (2014) Sirtuin‐3 (SIRT3), a therapeutic target with oncogenic and tumor‐suppressive function in cancer. Cell Death Dis 5: e1047 [DOI] [PMC free article] [PubMed] [Google Scholar]
- Chen AN, Luo Y, Yang YH, Fu JT, Geng XM, Shi JP, Yang J (2021) Lactylation, a novel metabolic reprogramming code: current status and prospects. Front Immunol 12: 688910 [DOI] [PMC free article] [PubMed] [Google Scholar]
- Dai X, Lv X, Thompson EW, Ostrikov KK (2021) Histone lactylation: epigenetic mark of glycolytic switch. Trends Genet 38: 124–127 [DOI] [PubMed] [Google Scholar]
- Finley LW, Haigis MC (2012) Metabolic regulation by SIRT3: implications for tumorigenesis. Trends Mol Med 18: 516–523 [DOI] [PMC free article] [PubMed] [Google Scholar]
- Finley LW, Carracedo A, Lee J, Souza A, Egia A, Zhang J, Teruya‐Feldstein J, Moreira PI, Cardoso SM, Clish CB et al (2011) SIRT3 opposes reprogramming of cancer cell metabolism through HIF1alpha destabilization. Cancer Cell 19: 416–428 [DOI] [PMC free article] [PubMed] [Google Scholar]
- Forner A, Reig M, Bruix J (2018) Hepatocellular carcinoma. Lancet 391: 1301–1314 [DOI] [PubMed] [Google Scholar]
- Gao Q, Zhu H, Dong L, Shi W, Chen R, Song Z, Huang C, Li J, Dong X, Zhou Y et al (2019) Integrated proteogenomic characterization of HBV‐related hepatocellular carcinoma. Cell 179: 1240 [DOI] [PubMed] [Google Scholar]
- Geng Y, Michowski W, Chick JM, Wang YE, Jecrois ME, Sweeney KE, Liu L, Han RC, Ke N, Zagozdzon A et al (2018) Kinase‐independent function of E‐type cyclins in liver cancer. Proc Natl Acad Sci USA 115: 1015–1020 [DOI] [PMC free article] [PubMed] [Google Scholar]
- Gramantieri L, Trere D, Chieco P, Lacchini M, Giovannini C, Piscaglia F, Cavallari A, Bolondi L (2003) In human hepatocellular carcinoma in cirrhosis proliferating cell nuclear antigen (PCNA) is involved in cell proliferation and cooperates with P21 in DNA repair. J Hepatol 39: 997–1003 [DOI] [PubMed] [Google Scholar]
- Gudas JM, Payton M, Thukral S, Chen E, Bass M, Robinson MO, Coats S (1999) Cyclin E2, a novel G1 cyclin that binds Cdk2 and is aberrantly expressed in human cancers. Mol Cell Biol 19: 612–622 [DOI] [PMC free article] [PubMed] [Google Scholar]
- Hagihara H, Shoji H, Otabi H, Toyoda A, Katoh K, Namihira M, Miyakawa T (2021) Protein lactylation induced by neural excitation. Cell Rep 37: 109820 [DOI] [PubMed] [Google Scholar]
- Haigis MC, Deng CX, Finley LW, Kim HS, Gius D (2012) SIRT3 is a mitochondrial tumor suppressor: a scientific tale that connects aberrant cellular ROS, the Warburg effect, and carcinogenesis. Cancer Res 72: 2468–2472 [DOI] [PMC free article] [PubMed] [Google Scholar]
- Hirschey MD, Shimazu T, Goetzman E, Jing E, Schwer B, Lombard DB, Grueter CA, Harris C, Biddinger S, Ilkayeva OR et al (2010) SIRT3 regulates mitochondrial fatty‐acid oxidation by reversible enzyme deacetylation. Nature 464: 121–125 [DOI] [PMC free article] [PubMed] [Google Scholar]
- Irizarry‐Caro RA, McDaniel MM, Overcast GR, Jain VG, Troutman TD, Pasare C (2020) TLR signaling adapter BCAP regulates inflammatory to reparatory macrophage transition by promoting histone lactylation. Proc Natl Acad Sci USA 117: 30628–30638 [DOI] [PMC free article] [PubMed] [Google Scholar]
- Izzo LT, Wellen KE (2019) Histone lactylation links metabolism and gene regulation. Nature 574: 492–493 [DOI] [PubMed] [Google Scholar]
- Jiang J, Huang D, Jiang Y, Hou J, Tian M, Li J, Sun L, Zhang Y, Zhang T, Li Z et al (2021) Lactate modulates cellular metabolism through histone Lactylation‐mediated gene expression in non‐small cell lung cancer. Front Oncol 11: 647559 [DOI] [PMC free article] [PubMed] [Google Scholar]
- Kim HS, Patel K, Muldoon‐Jacobs K, Bisht KS, Aykin‐Burns N, Pennington JD, van der Meer R, Nguyen P, Savage J, Owens KM et al (2010) SIRT3 is a mitochondria‐localized tumor suppressor required for maintenance of mitochondrial integrity and metabolism during stress. Cancer Cell 17: 41–52 [DOI] [PMC free article] [PubMed] [Google Scholar]
- Kimura T, Kato Y, Ozawa Y, Kodama K, Ito J, Ichikawa K, Yamada K, Hori Y, Tabata K, Takase K et al (2018) Immunomodulatory activity of lenvatinib contributes to antitumor activity in the Hepa1‐6 hepatocellular carcinoma model. Cancer Sci 109: 3993–4002 [DOI] [PMC free article] [PubMed] [Google Scholar]
- Li K, Lin SY, Brunicardi FC, Seu P (2003) Use of RNA interference to target cyclin E‐overexpressing hepatocellular carcinoma. Cancer Res 63: 3593–3597 [PubMed] [Google Scholar]
- Li M, Chiang YL, Lyssiotis CA, Teater MR, Hong JY, Shen H, Wang L, Hu J, Jing H, Chen Z et al (2019) Non‐oncogene addiction to SIRT3 plays a critical role in lymphomagenesis. Cancer Cell 35: 916–931 [DOI] [PMC free article] [PubMed] [Google Scholar]
- Liberti MV, Locasale JW (2020) Histone Lactylation: a new role for glucose metabolism. Trends Biochem Sci 45: 179–182 [DOI] [PubMed] [Google Scholar]
- Liu JX, Shen SN, Tong Q, Wang YT, Lin LG (2018) Honokiol protects hepatocytes from oxidative injury through mitochondrial deacetylase SIRT3. Eur J Pharmacol 834: 176–187 [DOI] [PubMed] [Google Scholar]
- McCoy AJ, Grosse‐Kunstleve RW, Adams PD, Winn MD, Storoni LC, Read RJ (2007) Phaser crystallographic software. J Appl Cryst 40: 658–674 [DOI] [PMC free article] [PubMed] [Google Scholar]
- Moreno‐Yruela C, Zhang D, Wei W, Bæk M, Gao J, Nielsen AL, Bolding JE, Yang L, Jameson ST, Wong J et al (2022) Class I histone deacetylases (HDAC1–3) are histone lysine delactylases. Sci Adv 8: eabi6696 [DOI] [PMC free article] [PubMed] [Google Scholar]
- Newman JC, He W, Verdin E (2012) Mitochondrial protein acylation and intermediary metabolism: regulation by sirtuins and implications for metabolic disease. J Biol Chem 287: 42436–42443 [DOI] [PMC free article] [PubMed] [Google Scholar]
- Ong SE, Mann M (2006) A practical recipe for stable isotope labeling by amino acids in cell culture (SILAC). Nat Protoc 1: 2650–2660 [DOI] [PubMed] [Google Scholar]
- Ong SE, Blagoev B, Kratchmarova I, Kristensen DB, Steen H, Pandey A, Mann M (2002) Stable isotope labeling by amino acids in cell culture, SILAC, as a simple and accurate approach to expression proteomics. Mol Cell Proteomics 1: 376–386 [DOI] [PubMed] [Google Scholar]
- Onyango P, Celic I, McCaffery JM, Boeke JD, Feinberg AP (2002) SIRT3, a human SIR2 homologue, is an NAD‐dependent deacetylase localized to mitochondria. Proc Natl Acad Sci USA 99: 13653–13658 [DOI] [PMC free article] [PubMed] [Google Scholar]
- Otwinowski Z, Minor W (1997) Processing of X‐ray diffraction data collected in oscillation mode. Methods Enzymol 276: 307–326 [DOI] [PubMed] [Google Scholar]
- Pan RY, He L, Zhang J, Liu X, Liao Y, Gao J, Liao Y, Yan Y, Li Q, Zhou X et al (2022) Positive feedback regulation of microglial glucose metabolism by histone H4 lysine 12 lactylation in Alzheimer's disease. Cell Metab 34: 634–648 [DOI] [PubMed] [Google Scholar]
- Pillai VB, Samant S, Sundaresan NR, Raghuraman H, Kim G, Bonner MY, Arbiser JL, Walker DI, Jones DP, Gius D et al (2015) Honokiol blocks and reverses cardiac hypertrophy in mice by activating mitochondrial Sirt3. Nat Commun 6: 6656 [DOI] [PMC free article] [PubMed] [Google Scholar]
- Rajendran P, Li F, Shanmugam MK, Vali S, Abbasi T, Kapoor S, Ahn KS, Kumar AP, Sethi G (2012) Honokiol inhibits signal transducer and activator of transcription‐3 signaling, proliferation, and survival of hepatocellular carcinoma cells via the protein tyrosine phosphatase SHP‐1. J Cell Physiol 227: 2184–2195 [DOI] [PubMed] [Google Scholar]
- Schumacker PT (2011) SIRT3 controls cancer metabolic reprogramming by regulating ROS and HIF. Cancer Cell 19: 299–300 [DOI] [PMC free article] [PubMed] [Google Scholar]
- Semenza GL (2003) Targeting HIF‐1 for cancer therapy. Nat Rev Cancer 3: 721–732 [DOI] [PubMed] [Google Scholar]
- Siegel RL, Miller KD, Jemal A (2019) Cancer statistics, 2019. CA Cancer J Clin 69: 7–34 [DOI] [PubMed] [Google Scholar]
- Sonntag R, Giebeler N, Nevzorova YA, Bangen JM, Fahrenkamp D, Lambertz D, Haas U, Hu W, Gassler N, Cubero FJ et al (2018) Cyclin E1 and cyclin‐dependent kinase 2 are critical for initiation, but not for progression of hepatocellular carcinoma. Proc Natl Acad Sci USA 115: 9282–9287 [DOI] [PMC free article] [PubMed] [Google Scholar]
- Wang D, Zheng X, Fu B, Nian Z, Qian Y, Sun R, Tian Z, Wei H (2019) Hepatectomy promotes recurrence of liver cancer by enhancing IL‐11‐STAT3 signaling. EBioMedicine 46: 119–132 [DOI] [PMC free article] [PubMed] [Google Scholar]
- Weidemann A, Johnson RS (2008) Biology of HIF‐1alpha. Cell Death Differ 15: 621–627 [DOI] [PubMed] [Google Scholar]
- Xiong J, He J, Zhu J, Pan J, Liao W, Ye H, Wang H, Song Y, Du Y, Cui B et al (2022) Lactylation‐driven METTL3‐mediated RNA m(6)a modification promotes immunosuppression of tumor‐infiltrating myeloid cells. Mol Cell 82: 1660–1677 [DOI] [PubMed] [Google Scholar]
- Yang K, Fan M, Wang X, Xu J, Wang Y, Tu F, Gill PS, Ha T, Liu L, Williams DL et al (2021) Lactate promotes macrophage HMGB1 lactylation, acetylation, and exosomal release in polymicrobial sepsis. Cell Death Differ 29: 133–146 [DOI] [PMC free article] [PubMed] [Google Scholar]
- Yu J, Chai P, Xie M, Ge S, Ruan J, Fan X, Jia R (2021) Histone lactylation drives oncogenesis by facilitating m(6)a reader protein YTHDF2 expression in ocular melanoma. Genome Biol 22: 85 [DOI] [PMC free article] [PubMed] [Google Scholar]
- Zhang YY, Zhou LM (2012) Sirt3 inhibits hepatocellular carcinoma cell growth through reducing Mdm2‐mediated p53 degradation. Biochem Biophys Res Commun 423: 26–31 [DOI] [PubMed] [Google Scholar]
- Zhang CZ, Liu L, Cai M, Pan Y, Fu J, Cao Y, Yun J (2012) Low SIRT3 expression correlates with poor differentiation and unfavorable prognosis in primary hepatocellular carcinoma. PLoS ONE 7: e51703 [DOI] [PMC free article] [PubMed] [Google Scholar]
- Zhang D, Tang Z, Huang H, Zhou G, Cui C, Weng Y, Liu W, Kim S, Lee S, Perez‐Neut M et al (2019) Metabolic regulation of gene expression by histone lactylation. Nature 574: 575–580 [DOI] [PMC free article] [PubMed] [Google Scholar]


