

Abstract
The tumor immune microenvironment dynamically evolves to support tumor growth and progression. Immunosuppressive regulatory T cells (Tregs) promote tumor growth and metastatic seeding in patients with breast cancer. Deregulation of plasticity between Treg and Th17 cells creates an immune regulatory framework that enables tumor progression. Here, we discovered a functional role for Hedgehog (Hh) signaling in promoting Treg differentiation and immunosuppressive activity, and when Hh activity was inhibited, Tregs adopted a Th17-like phenotype complemented by an enhanced inflammatory profile. Mechanistically, Hh signaling promoted O-GlcNAc modifications of critical Treg and Th17 transcription factors, Foxp3 and STAT3, respectively, that orchestrated this transition. Blocking Hh reprogramed Tregs metabolically, dampened their immunosuppressive activity, and supported their trans-differentiation into inflammatory Th17 cells that enhanced the recruitment of cytotoxic CD8+ T cells into tumors. Our results demonstrate a previously unknown role for Hh signaling in the regulation of Treg differentiation and activity and the switch between Tregs and Th17 cells in the tumor microenvironment.
Keywords: Hedgehog signaling, Tregs, Th17, breast cancer, metabolism
Introduction
Breast cancer (BC) is the most frequently diagnosed cancer among women, and the lifetime risk of developing BC has increased from 9.09% in 1975 to 12.9% in 2022 (1). The prognosis for patients diagnosed with triple-negative breast cancer (TNBC) remains poor, with a median overall survival of 13.3 months in patients with metastasis (2). Chemotherapy, radiation therapy, and surgery are the most common therapeutic interventions for TNBC. Thus far, immunotherapy has shown promise for patients with metastatic TNBC who present with high PD-L1 expression (3) and now has been approved as a neoadjuvant treatment in combination with cytotoxic chemotherapy for early-stage TNBC patients (4). Cancers such as melanoma, non-small cell lung cancer, kidney and bladder cancer are more responsive to immunotherapy due to their high T cell infiltration and are termed immunologically ‘hot’ tumors. On the contrary, breast tumors, especially of triple-negative classification, have a low infiltration of immune-reactive T cells and are considered immunologically ‘cold’ tumors. Furthermore, TNBC tumors have a remarkably high influx of immunosuppressive cells, such as regulatory T cells (Tregs), which correlates with enhanced tumor growth and reduced disease-free survival (5).
Tregs are an immunosuppressive subpopulation of CD4+ T cells that maintain self-tolerance and prevent autoimmunity. The differentiation and regulatory functions of Tregs are governed by the Treg master transcription factor, forkhead box P3 (FOXP3). Tregs are pliant in nature based on the stimulus in their environment. Numerous studies highlight the plasticity between Tregs and T helper 17 cells (Th17 cells) (6–8). Th17 cell fate is governed by the transcription factor, RAR-related orphan receptor gamma (Rorγt), through the IL6-STAT3 signaling cascade, and these cells are further characterized by high expression of interleukin 17 (IL17) (9,10). Although the role of Th17 cells in protecting against bacterial infections and promoting inflammation and autoimmune disorders has been extensively demonstrated, their impact on tumor immunity remains controversial. The role of Th17 cells in cancer is highly dependent on several variables, including tumor type and stage, inflammation, and the properties of the tumor microenvironment (TME). For example, correlative studies have shown that a high abundance of Th17 cells within colon and pancreatic cancer correlates with a worse patient prognosis (11,12). However, similar studies in ovarian cancer and melanoma show a correlation between Th17 cells, prolonged survival, and better response to immune checkpoint blockade (13,14). Previous studies underscore the role of IL17a expression in promoting breast cancer pathogenesis (15–18). Although high IL17a expression correlates with breast cancer progression (19), IL17a is also secreted by natural killer (NK) cells, neutrophils, mast cells, gamma-delta T cells (γδT), and CD8+ T cells. In the presence of lymphocytes, IL17a plays a tumor-eradicating role, whereas in the absence of lymphocytes, IL17a promotes tumor growth (20). In the context of breast cancer, there is compelling evidence that demonstrates the importance of Th17 cells: (i) a Th17 metagene signature correlates with a favorable prognosis in TNBC (21), (ii) metastatic breast cancer patients have an inverse relationship of Tregs and Th17 cells, with a high presence of Tregs (22), (iii) the expression of a Th17 gene signature is decreased during breast cancer progression (23), and (iv) taken alone, Th17 cells are highly pro-inflammatory, especially when co-expressed with cytokines such as IL1β, IFNγ, or GM-CSF (24). Overall, these pieces of evidence underscore the inflammatory, anti-tumor role of Th17 cells in breast cancer.
Hedgehog (Hh) signaling is a developmental pathway that plays a crucial role in governing cell fate, patterning, and differentiation during vertebrate embryonic development (25). This pathway is aberrantly reactivated in multiple cancers, including breast cancer, and plays a chief role in tumorigenesis and metastasis. (26). This pathway is triggered by binding of one of three Hh ligands, Sonic Hedgehog (SHH), Indian Hedgehog (IHH), or Desert Hedgehog (DHH), to the cell surface receptor, Patched (PTCH) (27). This interaction relieves the inhibitory effect of PTCH on the signaling transducer, smoothened (SMO), a G-coupled protein receptor. SMO then translocates to the primary cilium, alleviating the inhibition of the transcription factor, the glioma-associated oncogene (GLI) (28). This allows GLI to translocate to the nucleus and initiate transcription of downstream genes.
Active Hh signaling within tumor cells promotes a feed-forward loop, leading to accumulation of Hh ligands within the surrounding microenvironment. Although previous studies highlight the role of Hh signaling in regulating innate immunity by promoting the immunosuppressive phenotype of macrophages, there have been fewer studies on the role of Hh signaling in adaptive immunity, especially in the context of cancer (29–31). Emerging evidence supports a role for Hh signaling in promoting suppressive subsets of T helper cells (32,33). Here, we demonstrate a novel role for Hh signaling in governing the balance between Tregs and pathogenic Th17 cells within the tumor microenvironment by altering Treg metabolism.
Materials and Methods
Supplementary Table S1 includes a complete list of reagents, cell lines, and animals used in this study.
Cell Culture
The luciferase-expressing E0771 cell line was cultured in RPMI-1640 medium (Life Technologies, Billings, MT) supplemented with 5% fetal bovine serum (FBS) (Life Technologies). The luciferase-expressing 4T1 murine mammary carcinoma cell line was cultured in DMEM-F12 (Life Technologies, Carlsbad, CA) supplemented with 5% FBS and 100μg/mL G418 (Gibco Life Technologies). The luciferase-expressing EMT6 mammary carcinoma cell line was cultured in Dulbecco’s modified minimum essential medium (DMEM) supplemented with 5% FBS. The murine lymphoblast cell line EL4 was cultured in DMEM (Life Technologies, Carlsbad, CA) supplemented with 10% heat-inactivated horse serum (Life Technologies). Cell lines are authenticated annually in conjunction with ATCC and were last authenticated in 2021. To authenticate cell lines, mouse short tandem repeat (STR) loci were analyzed. Two additional markers (Human D8 and D4) to screen for the presence of human or African green monkey species were also utilized. Each sample was processed using the ABI Prism® 3500xl Genetic Analyzer. Data were analyzed using GeneMapper® ID-X v1.2 software (Applied Biosystems). Appropriate positive and negative controls were run and confirmed for each assay set. Cells were frozen at early passages and replaced from frozen stocks after twelve passages. Cell lines are routinely tested (once annually) for mycoplasma contamination using PCR assays.
CD4+ T cell Isolation, Differentiation Conditions, and Cell Treatments
Spleens harvested from 6-week-old C57BL/6 mice were dissociated over a 70-micron strainer (Thermo Scientific, Waltham, MA). Red blood cells were lysed using ACK lysis buffer (Life Technologies). Naïve CD4+ T cells were enriched using Naïve CD4+ T cell Isolation mouse magnetic kit with a purity >90% and viability >85% (Miltenyi Biotec, San Diego, CA). All experiments which required the isolation of naïve CD4+ T cells and differentiation to iTregs followed this process. For inducible regulatory T cell (iTreg) differentiation, cells were seeded in plates coated with 5μg/mL anti-CD3 and anti-CD28 (Biolegend, San Diego, CA) in TEXMACs media (Miltenyi Biotec) supplemented with 10% FBS (Life Technologies), 6ng/mL recombinant human (rh)TGFβ (R&D Systems, Minneapolis, MN), 20ng/mL recombinant mouse (rm)IL2 (R&D Systems), 10μg/mL anti-IL4 (#504135) and anti-IFNγ (505710) (Biolegend) for 72 hours. iTregs were treated with DMSO or GANT61 (10μM) (R&D Systems) either during the differentiation process or following differentiation for 24 hours. Alternatively, iTregs were differentiated for 72 hours following the details above, followed by treatment with the STAT3 inhibitor LLL-12 (0.5μM) (Biovision, Waltham, MA) for 24 hours. Th0 cells were treated with SHH (100 nM) (R&D Systems) for 24 hours to assess the role of Hh activation on Treg differentiation. nTregs were magnetically enriched from the thymus using the EasySep Mouse CD4+CD25+ Regulatory T cell Isolation Kit II (StemCell Technologies, Cambridge, MA) from naïve, non-tumor bearing mice. nTregs were seeded in plates coated with 5μg/mL anti-CD3 and anti-CD28 (Biolegend, San Diego, CA) in TEXMACs media (Miltenyi Biotec) supplemented with 10% FBS, for 24 hours in the presence of DMSO or GANT61 (10μM).
Treg suppression assay
The EasySep Mouse CD4+CD25+ Regulatory T cell Isolation Kit II (StemCell Technologies) was used to enrich CD4+CD25+ (Treg) and CD4+CD25− (effector T cell, Teff) populations from mouse tumors or spleens (tissue dissociation described below). Tregs were co-cultured with Teff cells from tumor-bearing mice treated with vehicle (Veh) or Smo-inhibition (Smo-i; treatments described below). Alternatively, Tregs from tumor bearing mice treated with Veh or Smo-i were co-cultured with Teff cells from treatment-naive mice to control for the possible indirect effect of Smo-i on Teffs. Teff cells were labeled with 5μM CFSE (Biolegend) following manufacturers protocol and co-cultured with Tregs at ratios from 0:1 up to 8:1 for 96 hours and assessed by flow cytometry as described below.
Tumor-conditioned medium experiments
Th0 cells or iTregs were cultured in 1:1 4T1 conditioned medium (CM) and T cell medium for 24 hours. CM was incubated overnight with 5E1 antibody or isotype control (2.5ug/mL) to neutralize Hh ligands. Downstream analyses included flow cytometry and qRT-PCR.
In vivo experiments
Luciferase-expressing 4T1 cells (5 × 10⁵), EMT6 cells (2 × 10⁵), or E0771 cells (1 × 10⁵), were suspended in HBSS (Thermo Fisher) and injected into the fourth inguinal mammary fat pad of seven-week-old female BALB/c (4T1 or EMT6) or C57BL/6 (E0771) mice. Tumor growth was monitored with caliper readings three times a week and imaged once a week using bioluminescence imaging (BLI) and the IVIS Imaging System (Xenogen Corp., Alameda, CA). Once tumors were palpable, mice were randomized and administered 100 μL (2 mg/mouse) of Vismodegib (Smo-i) (Selleck Chemicals, Houston, TX) or DMSO (Veh) (Thermo Fisher) as a vehicle control three times per week via oral gavage for three weeks. Following this regimen on day 40, animals were humanely euthanized and tumor and spleen tissue was harvested for downstream analysis. Blood was harvested by cardiac puncture for serum collection. All animal studies were conducted in accordance with, and with the approval of, the Institutional Animal Care and Use Committee (IACUC) of UAB. Experimental endpoints included the following: flow cytometric analysis from the tumors and spleens, Treg suppression assays from the tumors and spleens, cytokine arrays from the serum and tumors, qRT-PCR on tumors, mammary fat pads, and intestines, and scRNA-seq analysis from the tumors.
Adoptive Transfer
Luciferase-expressing 4T1 cells (5 × 10⁵), were suspended in HBSS and injected into the fourth inguinal mammary fat pad of seven-week-old female BALB/c CD45.1+ mice. Once tumors were palpable, mice were randomized and received 100 μL (2 mg/mouse) of Vismodegib (Selleck Chemicals, Houston, TX) or DMSO as a vehicle control three times per week via oral gavage for three weeks. CD8+ T cells were enriched from the spleens of non-tumor bearing, treatment-naïve CD45.2+ BALB/c mice and injected into the tail veins of tumor-bearing mice (5 × 10⁶ cells per mouse), that were previously treated with DMSO or Smo-i for three weeks. CD8a+ T cells were magnetically enriched from the spleens of mice using the negative selection CD8a+ T Cell Isolation Kit, LS columns, MACS BSA Stock solution, and QuadroMACS separators following manufacturers protocol (all from Miltenyi Biotec) to a purity of >93%. Following enrichment, CD8+ T cells were washed twice in 1X PBS (Thermo Fisher) and resuspended in HBSS for tail vein injection. The experiment was terminated 24 hours after tail vein injection, and tumors and spleens were assessed for CD8+ T cell populations by flow cytometry as indicated below.
Tissue processing
Mammary tumors from 4T1, E0771, or EMT6 tumor bearing mice were harvested, and immediately placed in C-Tubes (Miltenyi Biotec) containing fresh DMEM (Life Technologiess) medium with tumor dissociation enzymes from the mouse tumor dissociation kit (Miltenyi Biotec). Tumors were dissociated using the Miltenyi gentleMACS Octo Dissociator with heaters following manufacturers protocol and using the program 37C_m_TDK_2. Following tissue dissociation, cells were washed with 1X PBS with 2% FBS, centrifuged, and red blood cells were lysed in ACK lysis buffer for 30 seconds, followed by two washes in 1X PBS with 2% FBS. All spleens and thymus were harvested and manually dissociated in 1X PBS with 2% FBS using a plunger over a 70 micron strainer (Fisher). Cells were washed and red blood cells were lysed following the protocol outlined above. Additionally, mammary fat pads were excised, flash frozen, manually crushed, and homogenized in RNA lysis buffer (Qiagen) containing 10% BME (Thermo Fisher) for downstream qRT-PCR analysis. Intestines were harvested from mice, and flushed 5 times with 1X PBS to remove waste. Following this, they were flash frozen, manually crushed, and homogenized in RNA lysis buffer (Qiagen) containing 10% BME (Thermo Fisher) for downstream qRT-PCR analysis.
Western Blotting
Naïve CD4+ T cells were isolated from spleens of non-tumor-bearing treatment naïve mice and differentiated into Th0 and/or iTregs, followed by treatment with DMSO or GANT61 (Hhi) (R&D Systems, 20μM) for 24 hours. Viability was assessed for all groups and was determined to be greater than 85%. To collect whole cell protein lysates, cells were collected in 200uL RIPA lysis buffer (Millipore Sigma) with 10X HALT protease and phosphatase inhibitor (Thermo Fisher) and sonicated for 7 seconds. Protein lysate was immunoblotted for OGA (O-GlcNAcase), OGT(O-GlnNAc transferase), STAT3, phospho (p)-STAT3 (Tyr705), Foxp3, TGFB, and RL2 (details for antibodies in Supplementary Table S1) and imaged using a Amersham Imager 600 (GE Health Care) chemiluminescence imaging system. 10ug protein was loaded to assess the O-GlcNAcylation profile of proteins (RL2 antibody), 20ug protein was loaded to assess all other proteins of interest. All primary antibodies were diluted 1:1000 and secondary antibodies were diluted 1:5000. GE Amersham ECL prime western blotting detection reagent (Thermo Fisher) was used for development following manufacturers protocol. β-actin was used as a control.
Immunoprecipitation
Naïve CD4+ T cells were isolated from spleens of naïve mice and differentiated into iTregs and treated +/− 20μM GANT61 or Veh for 24 hours. Viability was assessed for all groups and determined to be greater than 85%. 1 mg of protein lysate was pre-cleared using Protein A/G Plus Agarose bead slurry (Santa Cruz) for 1 hour at 4°C. Pre-cleared lysates were incubated with 2μg RL2 antibody for 3 hours at 4°C. Agarose bead slurry was added and mixed at 4°C overnight. After overnight incubation, beads were spun at 3000 RPM 5 minutes and supernatant was discarded. Beads were washed twice in RIPA buffer then washed 3 times in PBS 5 minutes each at 4°C. Beads were resuspended in 25ul 2X Laemmli Buffer (Bio-Rad) and heated at 95°C; supernatant was collected and resolved on SDS PAGE gel. Blots were probed for Foxp3 or total STAT3. GE Amersham ECL prime western blotting detection reagent (Fisher Scientific) was used for development following manufacturers protocol, and imaged using a Amersham Imager 600 chemiluminescence imaging system.
Quantitative Real-Time Polymerase Chain Reaction (qRT-PCR)
The following experiments were designed for qRT-PCR analysis: naïve CD4+ T cells enriched from spleens of naïve mice were differentiated into iTregs with Hhi (20 μM), or Veh incorporated into the differentiation cocktail, or added for 24 hours following differentiation, naïve CD4+ T cells enriched from spleens of naïve mice were differentiated into iTregs followed by a 24 hour treatment with LLL12 (0.5 μM), naïve CD4+ T cells enriched from spleens of naïve mice were differentiated into iTregs followed by treatment with 4T1 CM for 24 hours, naïve CD4+ T cells enriched from spleens of naïve mice were treated with SHH (100nM), Hhi (20 μM), or Veh, and nTregs enriched from the thymus of naïve mice treated with Hhi (20 μM), for 24 hours, Th0 cells or EL4 cells that were treated with Hhi (20 μM), LLL12 (0.5 μM), RNA was extracted using the Qiagen RNeasy Mini Kit (Valencia, CA) according to the manufacturer’s protocol. RNA was quantified using the RNA NanoDrop (Thermo Fisher). cDNA was synthesized using High-Capacity cDNA Reverse Transcription Kit (Life Technologies) according to the following protocol: 25°C for 10 minutes, 37°C for 120 minutes, 85°C for 5 minutes. qRT-PCR was performed using TaqMan Fast Advanced Master Mix (Applied Biosystems) and Taqman gene expression assay probes for Gli1, Gli2, Ptch1, Actb, Il17a, Rorc, Ifng, Tgfb1, Ebi3, Il12a, Ogt, Mgea5, and Il2ra (Life Technologies) (details for primers and kits in Supplementary Table S1). Experiments were performed in triplicate using the StepOne Plus Realtime PCR System (Applied Biosystems), and Actb served as an endogenous control gene. 2^−ΔΔCT was used to determine gene expression.
Luciferase Assay
EL4 cells were seeded in triplicate in Treg differentiation medium (20ng/mL IL2, 6ng/mL TGFB, 5μg/mL anti-CD3, and 5μg/mL anti-CD28) for 48 hours. To inhibit Hh activity, 10μM GANT61 (Hh-i) was added for 24 hours after Treg differentiation. Viability was evaluated for all groups and was determined to be greater than 90%. Next, cells were transfected in serum free DMEM medium (Life Technologies) with 200ng pGL3prom 8X Foxp3 plasmid (UAB) and lipofectamine 2000 (Life Technologies) for 12 hours. After transfection, medium was replaced with DMSO or Hh-i (10μM)-containing medium for 4 hours. The cells were then washed in 1X PBS and lysed in 1X reporter lysis buffer (Promega) and placed at −80°C overnight. 20μL of cell lysate was mixed with 100μL Luciferase Assay Reagent (Promega), and luminescence was quantified using a Glomax 20/20 luminometer (Promega) and normalized to total protein concentration determined by using precision red advanced protein assay (Cytoskeleton, Denver, CO). The details for recombinant proteins, antibodies, and reagents are in Supplementary Table S1).
Flow Cytometry
Tumors were dissociated using the Miltenyi gentleMACS Octo Dissociator and the Miltenyi tumor dissociation kit as described above. Following lysis of the RBC using ACK buffer (Gibco), cells were stimulated for six hours with the Cell Activation Cocktail (with Brefeldin A) (Biolegend) according to the manufacturers protocol when intracellular cytokine production was assessed. These cells were then counted and stained with the viability dye eFluor 450 (Thermo Fisher) in 1X PBS for 20 minutes on ice in the dark. Next, cells were incubated in primary conjugated antibody cocktail (Biolegend) for extracellular markers and stained for 30 minutes on ice in the dark. After extracellular staining, cells were fixed for 45 minutes at room temperature in the dark using the intracellular fixation buffer (Biolegend) and then permeabilized using the true nuclear transcription factor buffer set according to the manufacturer’s protocol (Biolegend). Cells were stained with a primary antibody cocktail (Biolegend) in permeabilization buffer for intracellular or nuclear markers for 30 minutes on ice in the dark. The cells were washed twice between each step. Cells were resuspended in FACS buffer comprised of 5% BSA (Thermo Fisher) and 1% sodium azide (Thermo Scientific) diluted in 1X PBS. and analyzed using a BD LSRII analyzer. FMO and unstained controls were utilized. Data analysis was performed using FlowJo version 10.8. Antibodies used are listed in Supplementary Table S1.
Gating strategies (see Supplementary Data file):
*Regulatory T cells: Live > CD4+ > Foxp3+
*Naïve CD4 T cells: Live > CD4+ > CD62L+ CD44−
*Th17 cells: Live > CD4+ > Rorγt+ IL17a+
*Inflammatory Th17 cells: Live > CD4+ > Rorγt+ IL17a+ > IFNγ+ (or GM-CSF+)
*Tr17s: Live > CD4+ > Foxp3+ > Rorγt+ IL17a+
*Inflammatory Tr17s: Live > CD4+ > Foxp3+ > Rorγt+ IL17a+ > IFNγ+ (or GM-CSF+)
*Cytotoxic T cells: Live > CD8+ > granzyme B (GZMB)+
*Inflammatory CD8+ T cells: Live > CD8+ > IFNγ+
*Ki-67 was applied to these gating strategies to assess the proliferation of specific T cell subsets.
Cytokine Array
Mammary tumors were harvested from mice (4T1 tumor bearing and EMT6 tumor bearing) treated with Smo-i or Veh at the termination of the experiment, and homogenized in 1X PBS with HALT protease inhibitors and 1% Triton X-100 (Sigma). 200μg of protein was assayed using the Proteome Profiler Mouse XL Cytokine Array (R&D Systems). For serum samples, blood was harvested from mice by cardiac puncture at the end of the 3-week treatment period and 50μL serum was isolated and immediately used with the Mouse XL Proteome Profiler Cytokine Array. Blots were imaged using a Amersham Imager 600 chemiluminescence imaging system, and densitometry was quantified using ImageJ software.
Single-cell RNA-Sequencing
Single-cell RNA-sequencing (scRNA-seq) was performed with 4T1 tumors from mice treated with Smo-i or DMSO as outlined in Figure 1A. In brief, tumors were excised, dissociated as described above, and stained for sorting via flow cytometry following the conditions in the Flow Cytometry section. Cells were stained with viability dye-e450 (eBiosciences), anti-EPCAM-Pe/Cy7 (Miltenyi Biotec), anti-CD45-FITC (Biolegend), and anti-CD4-APC (Biolegend). Cells were then sorted into the following populations using an BD FACSARIA cell sorter: live, CD45−, EPCAM+ (tumor cells); live, CD45+, EPCAM−, (CD4− immune cells); and live, CD45+ CD4+ (CD4+ T cells). After sorting, cells were combined in a 3:1:1 ratio (CD4+ T cells: tumor cells: CD45+ CD4− immune cells).
Figure 1. Hedgehog signaling blockade diminishes Treg abundance and activity in tumor and spleen of mammary tumor bearing mice.
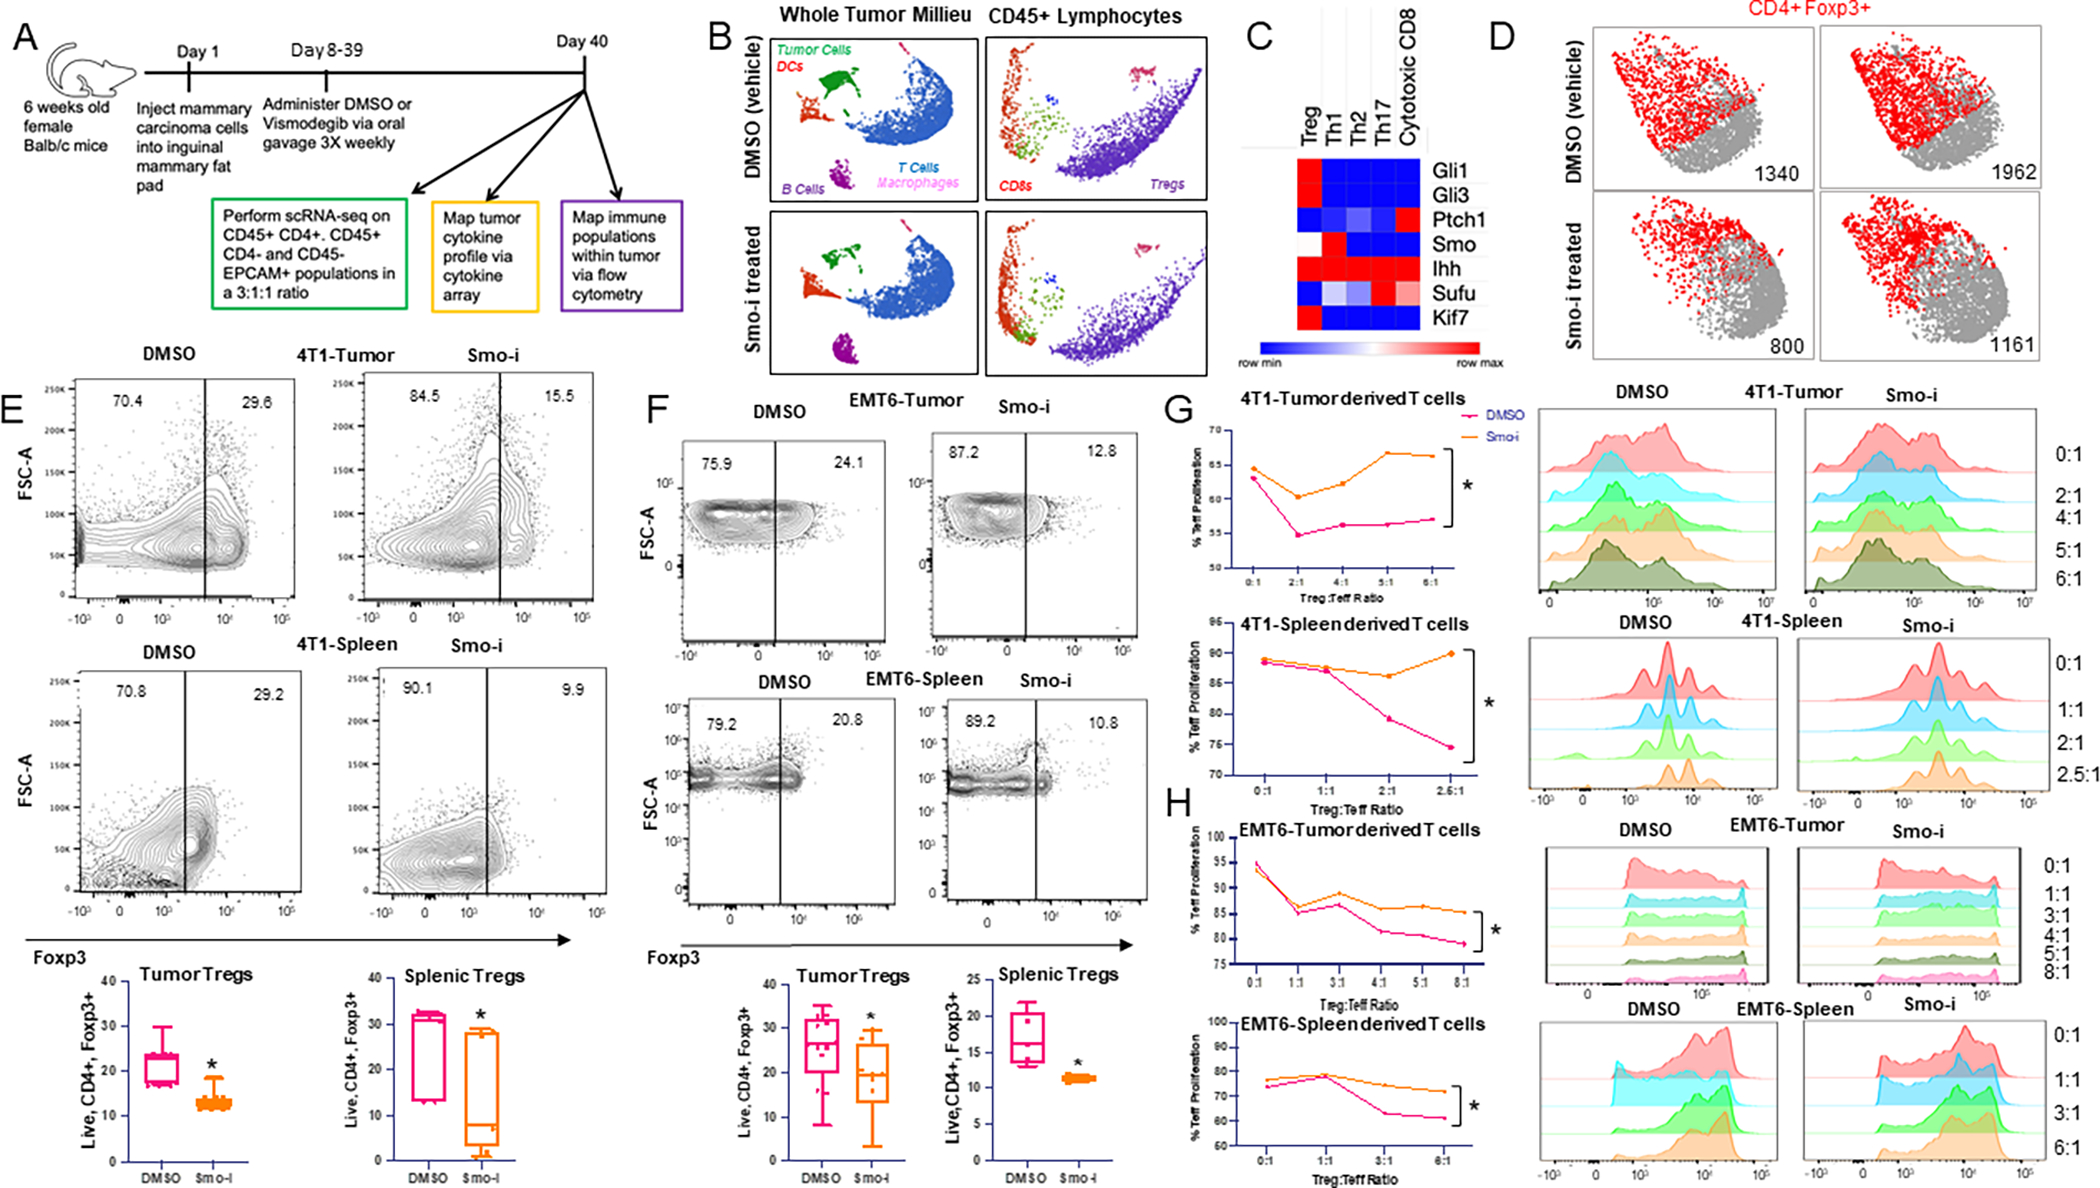
A. Schematic of in vivo experimental timeline. Briefly, tumor-bearing mice (E0771, 4T1, or EMT6) were treated with Smo-i or Veh 3 times per week for three weeks via oral gavage. B. UMAPs of immune and tumor cell clusters (left) and T cell subsets (right) identified from scRNA-seq analysis of 4T1 mammary tumors from mice treated +/− Smo-i. C. Heatmap depicting relative expression of Hh pathway gene expression in T cell subsets from scRNA-seq analysis. D. Foxp3 expression in T cell cluster from 2 representative Smo-i or vehicle treated mice. E. Flow cytometric contour plots and quantitation of 4T1 tumor infiltrating (top) and splenic (bottom) Treg populations (% positive Foxp3 out of CD4+ T cells). Independent experiments were performed at least twice. N=15 mice per group for tumors and 8 mice per group for spleens. F. Flow cytometric contour plots and quantitation of EMT6 tumor infiltrating (top) and splenic (bottom) Treg populations (% positive Foxp3 out of CD4+ T cells). Independent experiments were performed at least twice. N=12 mice per group for tumors and 5 mice per group for spleens. G. Line plots representing Teff proliferation and CFSE intensity of CD4+ Teffs from Treg suppression assay from tumors (top) or spleens (bottom) of 4T1 tumor bearing mice or H. EMT6 tumor bearing mice treated +/− Smo-i. Treg suppression assays were performed twice from 4T1 model and once from EMT6 model. For Treg suppression assay, Tregs were pooled from 10 tumor bearing mice per treatment group. All data is from Tregs differentiated within the tumor or spleens of tumor bearing mice.
Single-cell RNA-seq was performed using the 10xGenomics system according to the 3’ v3.1 NextGem Dual Index manual using the 10xGenomics 3’ v3.1 kit (s PN-1000268, 10X Genomics, Pleasanton, CA). Briefly, a single-cell suspension, barcoded microbeads, and oil were added to 10xGenomics chip G, which was then loaded into 10xChromium controller, and individual cells were captured into oil droplets and GEMs (Gel Bead-In-Emulsions) were generated. GEMs were transferred into 200μL PCR tubes and reverse-transcription was performed. Post GEM reverse transcription was cleaned up using Dynabeads MyOne SILANE beads (PN-2000048, 10X Genomics). The reverse transcription reagents were included in the 10xGenomics 3’ v3.1 kit (PN-1000268). cDNA was then cleaned up and pre-amplified for sequencing library construction. Preamplified cDNA was cleaned up by using SPRIselect reagent (0.6X) (10X Genomics). The 3’-biased cDNA libraries were constructed by the following steps using the Library Construction kit (PN-1000190, 10X Genomics): cDNA fragmentation, end repair and A-tailing, size selection by SPRIselect beads, adaptor ligation, and sample index PCR amplification, and then SPRIselect beads size selection again. The final constructed 3’-biased single cell libraries were sequenced by Illumina Nextseq500 machine for paired-end sequencing, targeting total reads per cell for 20,000 at minimum, and the sequencing cycles consisted of 28bp for read 1, 90bp for read 2, 10bp for i7 index, and 10bp for i5 index. Single Cell 3’ Gene Expression libraries are made up of Illumina paired-end constructs beginning with P5 and ending with P7. 16 bp 10x Barcodes are encoded at the start of TruSeq Read 1, while 10 bp i5 and i7 sample index sequences are incorporated as sample index reads. TruSeq Read 1 and Read 2 are standard Illumina sequencing primer sites used in paired-end sequencing. TruSeq Read 1 is used to sequence 16 bp 10x Barcodes and 12 bp UMI.
Single-cell RNA-sequencing data analysis
The 10X Genomics Cellranger software (version 4.0.0) mkfastq was used to create the fastq files from the sequencer. After fastq file generation, Cellranger count was used to align the raw sequence reads to the reference genome (mm10) using STAR. The count software created three data files (barcodes.tsv, genes.tsv, matrix.mtx) from the “filtered_gene_bc_matrices” folder that were loaded into the R package Seurat version 3.2.1 which allows for selection and filtration of cells on the basis of quality control metrics, data normalization and scaling, and detection of highly variable genes. We followed the Seurat vignette (https://satijalab.org/seurat/pbmc3k_tutorial.html) to create the Seurat data matrix object. In brief, we kept all genes expressed in more than three cells and cells with at least 200 detected genes. Cells with mitochondrial gene percentages >10% and unique gene counts >4000 or <200 were discarded. The data were normalized using Seurat’s “NormalizeData” function, which uses a global-scaling normalization method, LogNormalize, to normalize the gene expression measurements for each cell to the total gene expression. The result is multiplied by a scale factor of 1e4 and the result is log-transformed. Highly variable genes were then identified using the function “FindVariableFeatures” in Seurat. Anchors were identified using “FindIntegrationAnchors” in order to integrate the two datasets together using “IntegrateData” (https://satijalab.org/seurat/articles/integration_introduction.html). We also regressed out the variation arising from library size using the function “ScaleData” in Seurat. We performed PCA of the variable genes as input and determined significant principal components on the basis of the “JackStraw” function in Seurat. The first 50 principal components were selected as input for UMAP using the functions “FindClusters” and “RunUMAP” in Seurat. To identify differentially expressed genes (DEGs) in each cell cluster, we used the function “FindMarkers” in Seurat on the normalized gene expression data. Principle component analysis (PCA) of the variable genes was performed as input and visualized by graph-based clustering and UMAP visualization. Clusters were identified by bonafide immune specific or epithelial biomarkers that are well established I in the literature. Differential expressed gene and pathway analysis was applied to individual clusters to assess drug-induced changes within individual cell populations the using gene-specific analysis (GSA) feature in Partek Flow. The analysis was performed using Partek Flow software, version 8.0, Partek Inc. (https://www.partek.com/) (34). Within each cluster, we identified separate gene lists upregulated in Smo-i-treated mice vs. controls and performed a comparison of Kyoto Encyclopedia of Genes and Genomes (KEGG) pathway or Gene Ontology (GO) term annotations, which were illustrated as bubble plots using the “ggplot2” package in RStudio v4.1.2 (Boston, MA, USA). This pathway analysis was performed using the Partek Flow platform using gene set enrichment (GSEA). Rich factor was defined as the number of differentially expressed genes divided by total genes within GO term or pathway.
Publicly Available Datasets
We utilized previously published publicly available datasets: scRNA-seq data from patient breast tumor biopsies (GSE75688) and RNA-seq data from tumor biopsies of patients 18 years or older with advanced basal cell carcinoma (BCC) treated with 150mg of Vismodegib per day and classified as Vismodegib-sensitive (exhibited partial or complete response to Vismodegib therapy) or Vismodegib-resistant (patients exhibited stable or progressive disease) (GSE58377). scRNA-seq data for 10 patients (BC01, BC02, BC03, BC04, BC06, BC07, BC08, BC09, BC10, AND BC11) was normalized, clustered, and analyzed in Partek Flow, as described in the single-cell RNA-sequencing data analysis section. RNA-seq data were filtered by a fold-change of 2 or greater and false discovery rate (FDR) adjusted p-value < 0.05. CIBERSORT and ingenuity pathway analyses were applied to RNA-seq data. To determine correlations between Tregs or CD8+ T cells and GLI2 expression, TISIDB was used (35). We filtered data based on p < 0.05 and rho > 0.3 or < −0.3.
Metabolomics
Naïve CD4+ T cells were isolated from spleens of non-tumor-bearing treatment naïve mice and differentiated into Th0 cells and/or iTregs, followed by treatment with DMSO or Hhi (20μM) for 24 hours.
Metabolite extraction:
Metabolite extraction was performed as described in previous study (36). The supernatant was transferred to a new Eppendorf tube and dried in vacuum concentrator at room temperature. The dry pellets were reconstituted into 30 μl sample solvent (water:methanol:acetonitrile, 2:1:1, v/v) and 3 μl was further analyzed by liquid chromatography-mass spectrometry (LC-MS).
LC-MS:
Ultimate 3000 UHPLC (Dionex) is coupled to Q Exactive Plus-Mass spectrometer (QE-MS, Thermo Scientific) for metabolite profiling. A hydrophilic interaction chromatography method (HILIC) employing an Xbridge amide column (100 × 2.1 mm i.d., 3.5 μm; Waters) is used for polar metabolite separation. Detailed LC method was described previously (37) except that mobile phase A was replaced with water containing 5 mM ammonium acetate (pH 6.8). The QE-MS is equipped with a HESI probe with related parameters set as below: heater temperature, 120 °C; sheath gas, 30; auxiliary gas, 10; sweep gas, 3; spray voltage, 3.0 kV for the positive mode and 2.5 kV for the negative mode; capillary temperature, 320 °C; S-lens, 55; A scan range (m/z) of 70 to 900 was used in positive mode from 1.31 to 12.5 minutes. For negative mode, a scan range of 70 to 900 was used from 1.31 to 6.6 minutes and then 100 to 1,000 from 6.61 to 12.5 minutes; resolution: 70000; automated gain control (AGC), 3 × 10⁶ ions. Customized mass calibration was performed before data acquisition.
Metabolomics data analysis:
LC-MS peak extraction and integration were performed using commercially available software Sieve 2.2 (Thermo Scientific). The peak area was used to represent the relative abundance of each metabolite in different samples. The missing values were handled as described in previous study (37).
Metabolic Extracellular Flux Analyzer
The Seahorse XF96 extracellular flux analyzer (Seahorse Bioscience, MA, USA) was used to measure the oxygen consumption rate (OCR) and the extracellular acidification rate (ECAR). Th0s, iTregs + DMSO, or iTregs + GANT61 (20μM) were diluted to a concentration of 1 × 10⁷ in XF DMEM assay buffer (DMEM with 5.5mM glucose, 1mM Pyr, 4mM glutamine, and 5mM HEPES) (Agilent, Santa Clara, CA) and seeded onto Cell-Tak-coated XF96 microplates (Agilent) at 250,000 cells/well. XF96 microplates were pre-coated with 22.4 μg/mL Cell-Tak (Corning) the day prior to seeding and stored at 4C and warmed to room temperature prior to cell seeding. During the MST, the basal respiration was determined by taking three OCR readings prior to adding mitochondrial effectors. ATP-linked OCR and proton leak were determined by adding 1μg/mL oligomycin (Sigma). 2μM FCCP (Sigma) was added to determine the maximal respiration rate. The complex III inhibitor, antimycin A (Sigma), was injected at a concentration of 10μM. These readings were used to calculate mitochondrial basal respiration, proton leakage, and maximal respiration using the following calculations with each rate referring to data in Figure 3: basal respiration = Basal OCR (rate 4; before Oligo) minus non-mitochondrial OCR (rate 12; after AA), proton leakage = Oligo OCR (rate 6) minus non-mitochondrial OCR (rate 12; after AA), maximal respiration = FCCP-stimulated OCR (rate 8) minus non-mitochondrial OCR (rate 12; after AA) reserve capacity = OCR after FCCP (rate 8) minus basal OCR (rate 4) and Non-Mitochondrial = rate 12.
Figure 3. Hh signaling blockade alters iTreg bioenergetics.
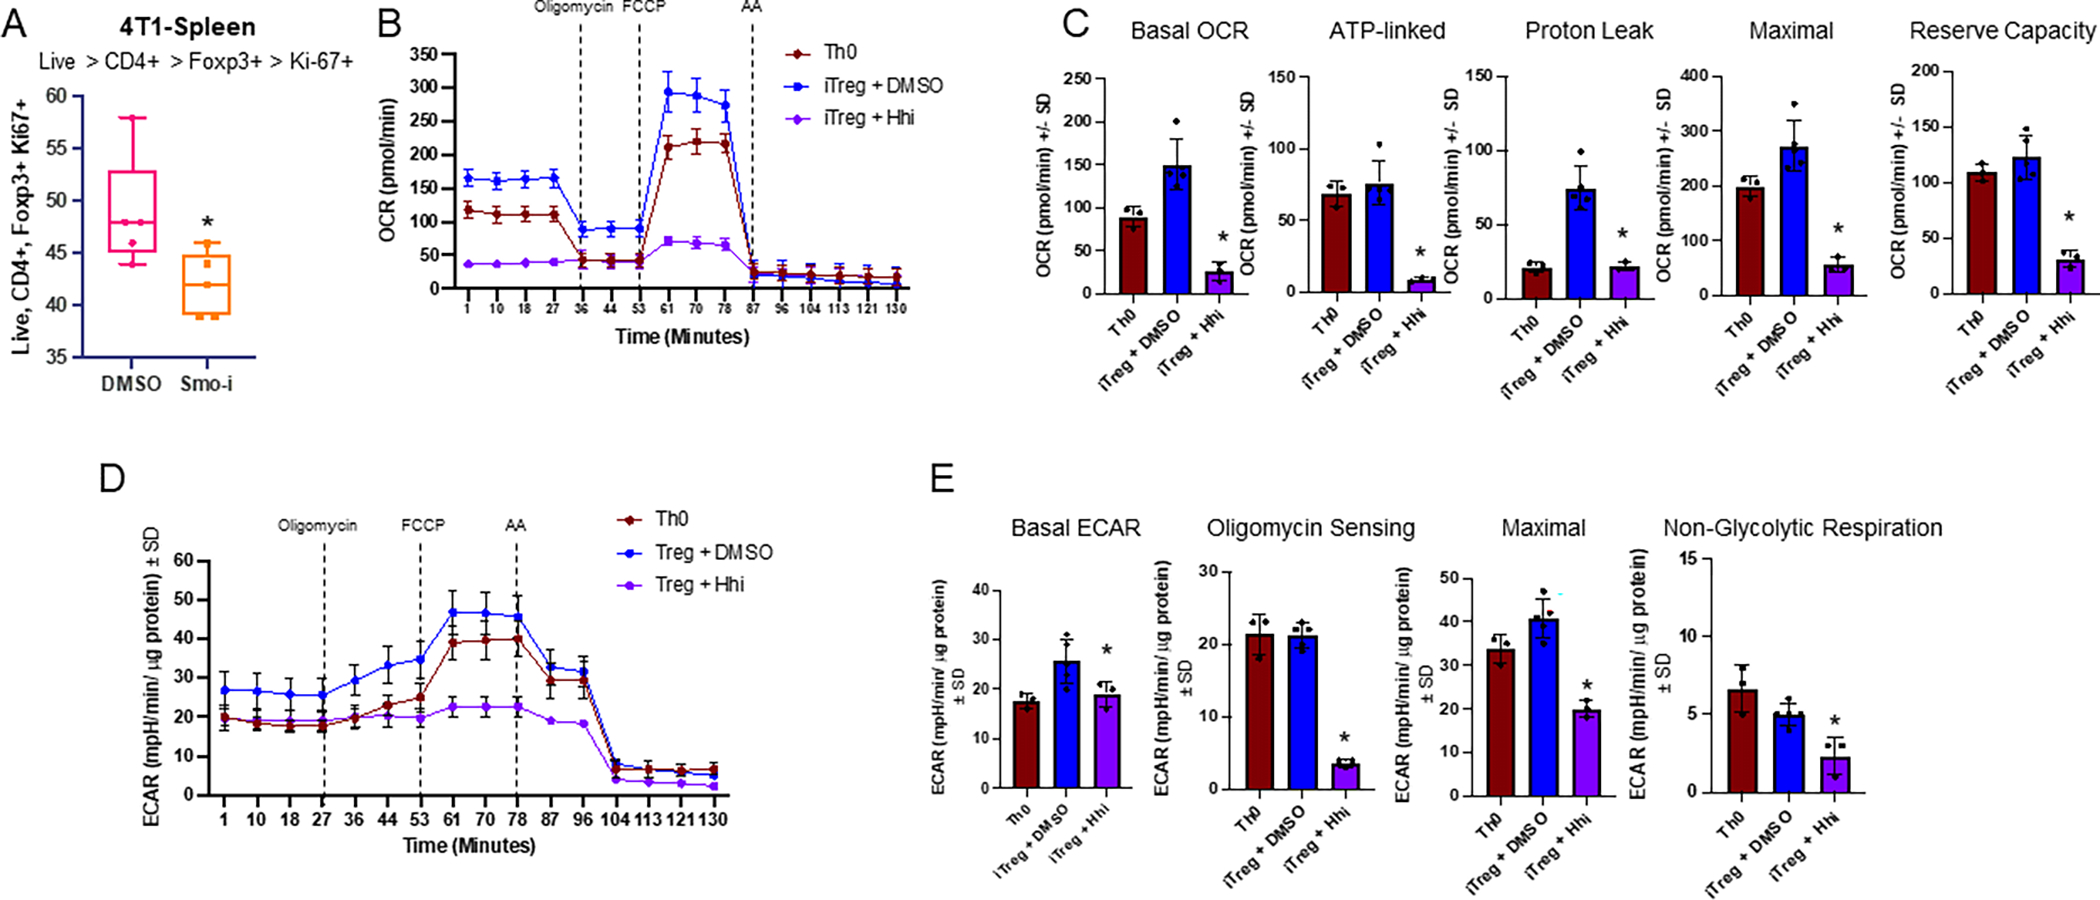
A. Flow cytometry of 4T1 splenic Tregs differentiated in vivo expressing Ki-67 from mice treated with Veh or Smo-i bearing 4T1 tumors. N=5 per treatment group +/− SEM. B. Seahorse extracellular flux analyzer used to calculate OCR of Th0 and iTregs treated with Hhi for 24 hours following differentiation, from mitochondrial stress test C. Seahorse extracellular flux analyzer was used to calculate basal OCR, ATP-linked respiration, proton leak, and reserve capacity of Th0s and iTregs +/− Hhi. D. Seahorse extracellular flux analyzer used to calculate ECAR of Th0 and iTregs +/− Hhi E. Seahorse extracellular flux analyzer was used to calculate basal ECAR, oligomycin sensing respiration, maximal respiration, and non-glycolytic respiration of iTregs +/− Hhi. Seahorse data (B-E) was collected once and is from iTregs differentiated ex vivo and Hhi (GANT61) was used at 20μM. Technical replicates for Seahorse experiment include the following: n=3 for Th0 group, n=5 for iTreg + DMSO group, and n=3 for iTreg + Hhi group. T cells from 30 mice were pooled to contribute to the various groups for Seahorse assay and all data is plotted +/− SD.
Statistical analysis
Statistics were calculated and plotted using GraphPad Prism software (La Jolla, CA). Student’s t-test or ANOVA analysis were used as appropriate. Statistical significance was defined as p <0.05 and is denoted where applicable by an asterisk. Non-significant data are denoted by ‘ns’. All data is represented as mean +/− SEM.
Data Availability Statement
The data generated and utilized in this study are available upon request. Publicly available data can be accessed using the following accession numbers: GSE58377 for bulk tumor RNA-seq from Vismodegib-resistant and -sensitive patients and GSE75688 for scRNA-seq data from breast tumor patient biopsies.
Results
Hh signaling blockade diminishes Treg abundance and activity in mammary tumor models
To determine the impact of Smo-i on the tumor microenvironment (TME) of mammary cancer, we investigated three immunocompetent, syngeneic mouse models of mammary carcinoma (4T1, EMT6, E0771) to ensure that we had representative tumor models for both Type 1 and Type 2 immunity. Tumor cells were orthotopically injected into the inguinal mammary fat pad of BALB/c (4T1 and EMT6) or C57BL/6 (E0771) mice. Once tumors were palpable, we initiated administration of Vismodegib (Smo-i) or DMSO (Veh) via oral gavage three times weekly for three weeks and proceeded with downstream analyses outlined in Figure 1A. Mice were treated with 2mg/mouse which is equivalent to the physiologically relevant dosage of 100mg/kg and has been reported previously (29–31). Data from 4T1 and EMT6 tumor models are reported in the main figures as our primary models, and all validating E0771 data are presented in the supplementary figures. Although there were no remarkable changes in tumor growth in the mouse models (Supplementary Figure S1A), we have previously reported that Smo-i treatment mitigates lung metastases and tumor vascularity, while augmenting tumor cell apoptosis (29,38,39). To validate the efficacy of systemic treatment with Smo-i, we assessed Hh-relevant transcripts across bulk tumors of all three tumor models and contralateral mammary fat pad and intestines of the 4T1 mammary model and observed a significant reduction in Hh-related transcript levels (Supplementary Figure S1B–F). We used single-cell RNA sequencing (scRNA-seq) analysis of 4T1 mammary tumors from mice treated with Veh or Smo-i to examine the role of Smo-i on the tumor immune microenvironment (TIME) (Figure 1A). Using Partek Flow software, we clustered the data and generated uniform manifold approximation and projections (UMAPs) for visualization. We identified each cluster based on the expression of relevant immune or tumor signatures. We identified five major cell types: tumor cells (green), dendritic cells (DCs, red), B cells (purple), T cells (blue), and macrophages (pink) (Figure 1B). The top ten expressed genes per cluster are outlined in Supplementary Table S2, and the top ten differentially expressed genes per cluster are outlined in Supplementary Table S3. We further classified the CD45+ lymphocyte cluster into T cell subsets: Tregs (purple), Th17 cells (magenta), Th1 cells (teal), Th2 cells (dark blue), and CD8+ T cells (red) (Figure 1B). T cells play a critical role in tumor immunity (40,41), so to determine the status of Hh signaling in the T cell subsets, we generated cell type–specific gene lists from our scRNA-seq analysis for each T cell subset from the vehicle-treated mice and queried them for Hh-relevant genes. The highest expression of Hh-related genes was observed within the Treg subset (Figure 1C). Our findings were in agreement with scRNA-seq data from treatment-naïve breast tumor biopsies, where we observed several Hh-related genes with higher expression in immunosuppressive Tregs and Th2 cells (Supplementary Figure S1G) (42).
Our scRNA-seq analysis revealed a decrease in tumor-infiltrating CD4+ T cells expressing Foxp3 in Smo-i-treated mice (Figure 1D). Therefore, we evaluated the Treg populations and noted a significant decrease in Tregs within 4T1, EMT6, and E0771 tumors and spleens of the mice that were treated with Smo-i (Figure 1E–F; Supplementary Figure S1H). A notable proportion (18–36%) of the CD4+ T cells consisted of Tregs. There were no significant changes in Treg viability across all mammary models (Supplementary Figure S1I–K).
We next evaluated the effect of Smo-i on Treg activity with Treg suppression assays using Tregs and CD4+ T effectors (Teffs) from tumors and spleens of mice treated with Smo-i or Veh. Tregs from the tumor and the spleen of Smo-i treated mice were less efficient in suppressing the proliferation of CFSE-labeled Teffs from Smo-i treated mice (Figure 1G–H). To account for potential direct impact of Smo-i on the Teffs, we additionally performed a Treg suppression assay utilizing Tregs from tumor-bearing mice treated with Veh or Smo-i, and splenic Teffs from tumor-naïve non-treated Balb/c mice. We similarly detected higher Teff proliferation when co-cultured with Tregs from Smo-i treated mice, indicating that the results were due to the impact of Smo-i on Treg suppressive activity (Supplementary Figure S1L). In the 4T1 and EMT6 mouse models, we mapped the cytokine and chemokine profiles of tumors and sera and noted a reduction of Treg-derived cytokines and chemokines involved in Treg recruitment (Supplementary Figures S1M, Supplementary Figure S2A–D). IL10 is secreted by activated, suppressive Tregs (43), and IL27, IL2, and IL12 promote Treg differentiation, proliferation, and suppressive activity (44–46), whereas the chemokines CCL2, CCL3, CCL4, CCL22, and CCL17 mediate Treg recruitment.
To put our findings in a clinical perspective, we queried data from TISIDB (35) and noted a significant, positive correlation between Treg abundance and GLI1 and GLI2 expression with minimal correlation between Treg abundance and GLI3 expression across several cancer types (Supplementary Figures S2E–F). We also assessed the immune composition of cancer patients treated with Vismodegib, utlizing a publicly available RNA-seq dataset, where Atwood et al. obtained basal cell carcinoma (BCC) tumor biopsies from patients who were responsive or resistant to orally administered Vismodegib (47). We applied CIBERSORT analysis to this dataset to estimate the abundance of tumor-infiltrating immune populations. Patients who were sensitive to Vismodegib treatment had a low tumor Treg:naïve CD4+ T cell ratio compared to patients who were resistant to treatment (Supplementary Figure S2G). Taken together, the data indicate that Hh blockade reduces Treg abundance and activity within the TME.
Hh activity is upregulated in iTregs, and Hh blockade diminishes Treg differentiation and activity
Next, to determine the status of Hh signaling in Tregs, we assessed the steady-state transcript levels of Gli1 and Gli2, Hh transcription factors that are bonafide readouts of Hh signaling. We found a robust upregulation of Gli1 and Gli2 in splenic Tregs compared with naïve (Th0) cells and a significant reduction in the transcriptional repressor, Gli3 (Figure 2A, Supplementary Figure S3A). Led by these observations, we tested if activation of Hh signaling with Shh ligand would be sufficient to spur differentiation of Th0 cells to inducible Tregs (iTregs) even in the absence of added iTreg stimuli (TGF-β, IL-2, αIFN-γ, αIL-4). Indeed, providing Shh exogenously to Th0 cells increased Ptch1 transcript expression (transcriptional target of GLI proteins) (Supplementary Figure S3B). This was accompanied by an increase in Tgfb1 and Il2ra transcript expression, both of which were upregulated during iTreg differentiation (Supplementary Figure S3C–D). Next, to examine the role of tumor-derived Hh ligands on iTreg differentiation, we queried the impact of tumor cell conditioned medium (CM) on iTreg differentiation. CM from 4T1 cells induced a significant increase in differentiated iTregs. To specifically query if tumor-derived Hh ligands impacted iTreg differentiation, we depleted the CM of Hh ligands using the Hh ligand-squelching 5E1 antibody. This medium was unable to robustly support iTreg differentiation (Figure 2B) and elicited reduced transcript expression of Tgfb1 and Il2ra (Supplementary Figure S3E), cumulatively solidifying that tumor-derived Hh ligands potentiate Tregs.
Figure 2. Hedgehog signaling is upregulated in iTregs, and blocking Hh signaling diminishes Treg differentiation and activity.
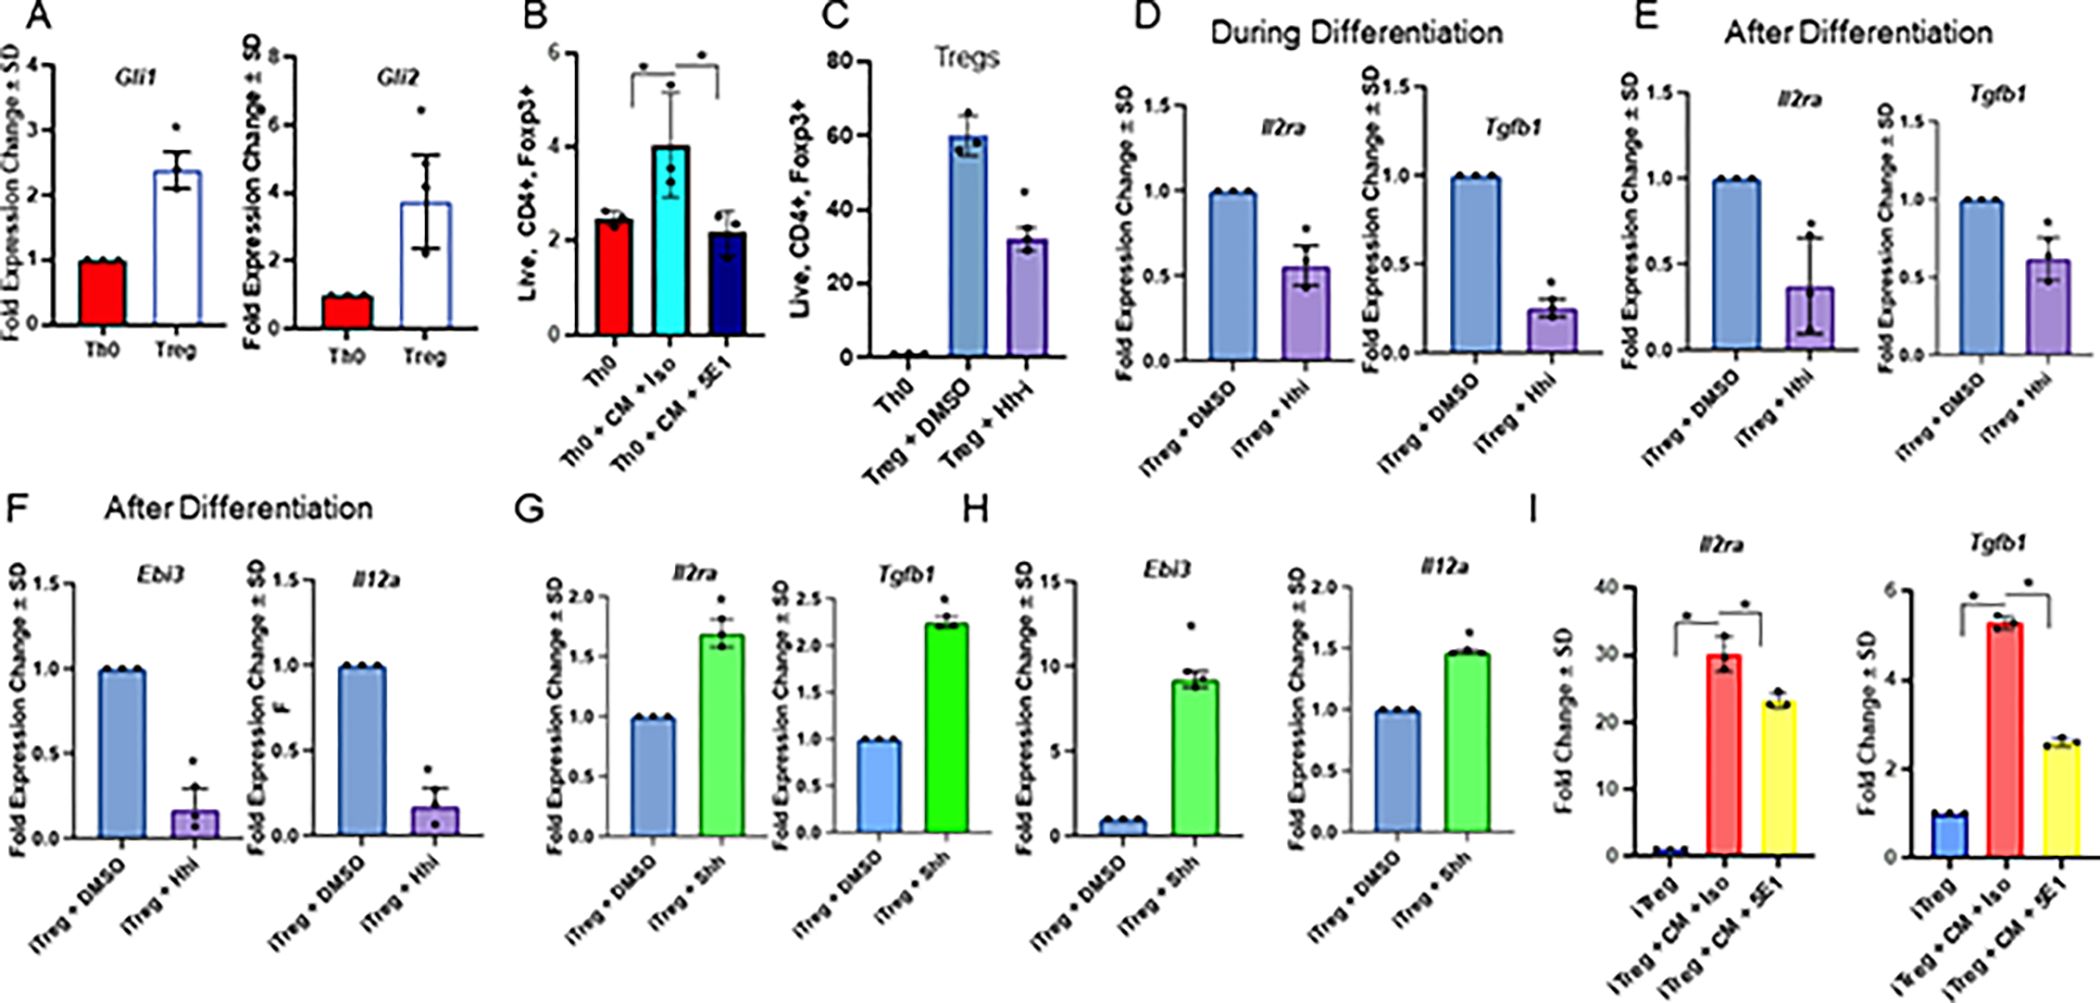
A. Transcript levels of Gli1 and Gli2 in Th0s vs Tregs, B. Flow cytometry quantitation of Th0s cultured with 4T1 tumor CM +/− 5E1 or isotype control (% positive Foxp3 out of CD4+ T cells) C. Flow cytometry quantitation of Th0s and iTregs treated with Hhi or Veh for 24 hours post differentiation (% positive Foxp3 out of CD4+ T cells). D. Transcript levels of Il2ra and Tgfb1 in iTregs, where Hhi is incorporated into the differentiation cocktail, or E. after differentiation. F. Transcript levels of Ebi3, and Il12a in iTregs differentiated for 72 hours, followed by a 24 hour treatment with Hhi post differentiation. G, H. Transcript levels of Il2ra, Tgfb1, Ebi3, and Il12a in iTregs treated with exogenous Shh for 24 hours following differentiation. I. Transcript levels of Il2ra and Tgfb1 in iTregs treated with 4T1 CM +/− 5E1 or isotype control for 24 hours after differentiation. All transcript levels in this figure were determined by qRT-PCR. qRT-PCRs and flow cytometry in A, C-H were repeated at least twice, qRT-PCR in I and flow cytometry in B was performed once. All data is from iTregs differentiated ex vivo. Hhi (GANT61) was used at 20μM for all experiments. N=3 per treatment group for all panels and data plotted as +/− SD.
To complement these findings, we incorporated the GLI inhibitor, GANT61 (Hhi), into the differentiation cocktail (experimental outline detailed in Supplementary Figure S3F). GANT61 directly targets and blocks GLI transcription factors, thus presenting a direct way to disable and inhibit Hh (GLI) activity. Hhi diminished iTregs (Figure 2C) and was accompanied by decreased transcript expression of Tgfb1 and Il2ra, indicating that Hh signaling is important for iTreg differentiation (Figure 2D). The abundance of these transcripts and TGFB proteins were also decreased when iTregs were treated with Hhi post-differentiation (Figure 2E, Supplementary Figure S3G–H). We did not observe any toxicity to the cells when treated with Hhi, either during or after differentiation (Supplementary Figure S3I).
Next, we assessed the effects of Hh activity on molecular readouts of iTreg activity. Ebi3 and Il12a are subunits of the cytokine IL35, which is enriched in highly suppressive Tregs. Transcript expression of Ebi3 and Il12a were diminished in iTregs inhibited for Hh signaling (Figure 2F). In contrast, exogenous Shh ligand elicited a robust increase in Ptch1 (bonafide Gli transcription target gene), Il2ra, and Tgfb1, as well as activity indicators, Ebi3 and Il12a (Figure 2G–H; Supplementary Figure S3J). Complementing this, there was an increase in Treg-specific transcripts Il2ra and Tgfb1 in iTregs cultured in tumor cell CM, but not in CM depleted of Hh ligands (Figure 2I), solidifying that tumor-derived Hh ligands contribute to enhancing Treg differentiation. We confirmed these findings using an additional endogenous control for qRT-PCR experiments, Gapdh (Supplementary Figure S3K). Treatment with Smo-i elicited similar phenotypes (Supplementary Figure S3L–N). Finally, because we utilized iTregs for these experiments, we tested whether the findings could be recapitulated in thymic derived nTregs because nTregs make up a significant proportion of Tregs within the tumor and have more stable expression of Foxp3 compared with iTregs. To assess the role of Hh blockade in nTregs, we magnetically enriched nTregs from the thymus of non-tumor bearing mice and treated them with Hhi or Veh for 24 hours. We registered a significant reduction in Treg-specific transcript expression of Tgfb1, Il2ra, Ebi3, and Il12a in nTregs treated with Hhi (Supplementary Figure S3O). Collectively, the data demonstrate that Hh activity is upregulated in iTregs and blocking Hh signaling diminishes Treg differentiation and activity.
Hh activity augments iTreg bioenergetics
Treg metabolism is intricately connected to differentiation and activity. Tregs have a highly glycolytic bioenergetic profile during differentiation that switches to oxidative phosphorylation in fully differentiated, highly suppressive Tregs to meet their high energy demand. Tregs within the spleens of tumor-bearing Smo-i-treated mice had significantly reduced Ki-67 expression, indicative of diminished proliferation (Figure 3A, Supplementary Figure S4A). Considering our observations indicating a critical role for Hh activity in iTreg differentiation and activity, we evaluated the impact of Hh on iTreg bioenergetics with a mitochondrial stress test, the Seahorse assay. Tregs mainly rely upon an oxidative metabolism, which was evident in our data showing that relative to Th0 cells, iTregs had an elevated oxygen consumption rate (OCR) and extracellular acidification rate (ECAR). Hhi caused a significant reduction in basal and maximal OCR and ECAR in iTregs (Figure 3B–E). These findings were corroborated by a Seahorse glycolytic stress test that also demonstrated a reduction in ECAR, glycolysis, glycolytic capacity, and glycolytic reserve in iTregs treated with Hhi (Supplementary Figure S4B–C). This was complemented by pathway analysis of a metabolism-focused, Treg-specific gene list from our scRNA-seq analyses, revealing a significant enrichment of carbohydrate and lipid metabolic pathways in Tregs from Smo-i treated mice (Supplementary Figure S4D).
Attenuation of Hh signaling decreases O-GlcNAcylation of Foxp3 and STAT3 and pivots Tregs to an inflammatory Tr17 phenotype
Bioenergetic and metabolic changes often precede phenotypic and functional changes. To determine whether Hh signaling blockade impinges on iTreg metabolism, we conducted unbiased mass spectrometry-based metabolomics on iTregs differentiated from naive CD4+ T cells ex vivo and treated with Hhi or vehicle control after differentiation. Metabolomics data analyses based on significance and greatest fold-change presented the hexosamine biosynthetic pathway (HBP) as a key candidate altered when Hh/GLI activity was inhibited (Figure 4A, Supplementary Figure S5A).
Figure 4. Hh signaling blockade diminishes Treg O-GlcNAcylation of Foxp3 and STAT3, potentiating the Treg to Th17 switch.
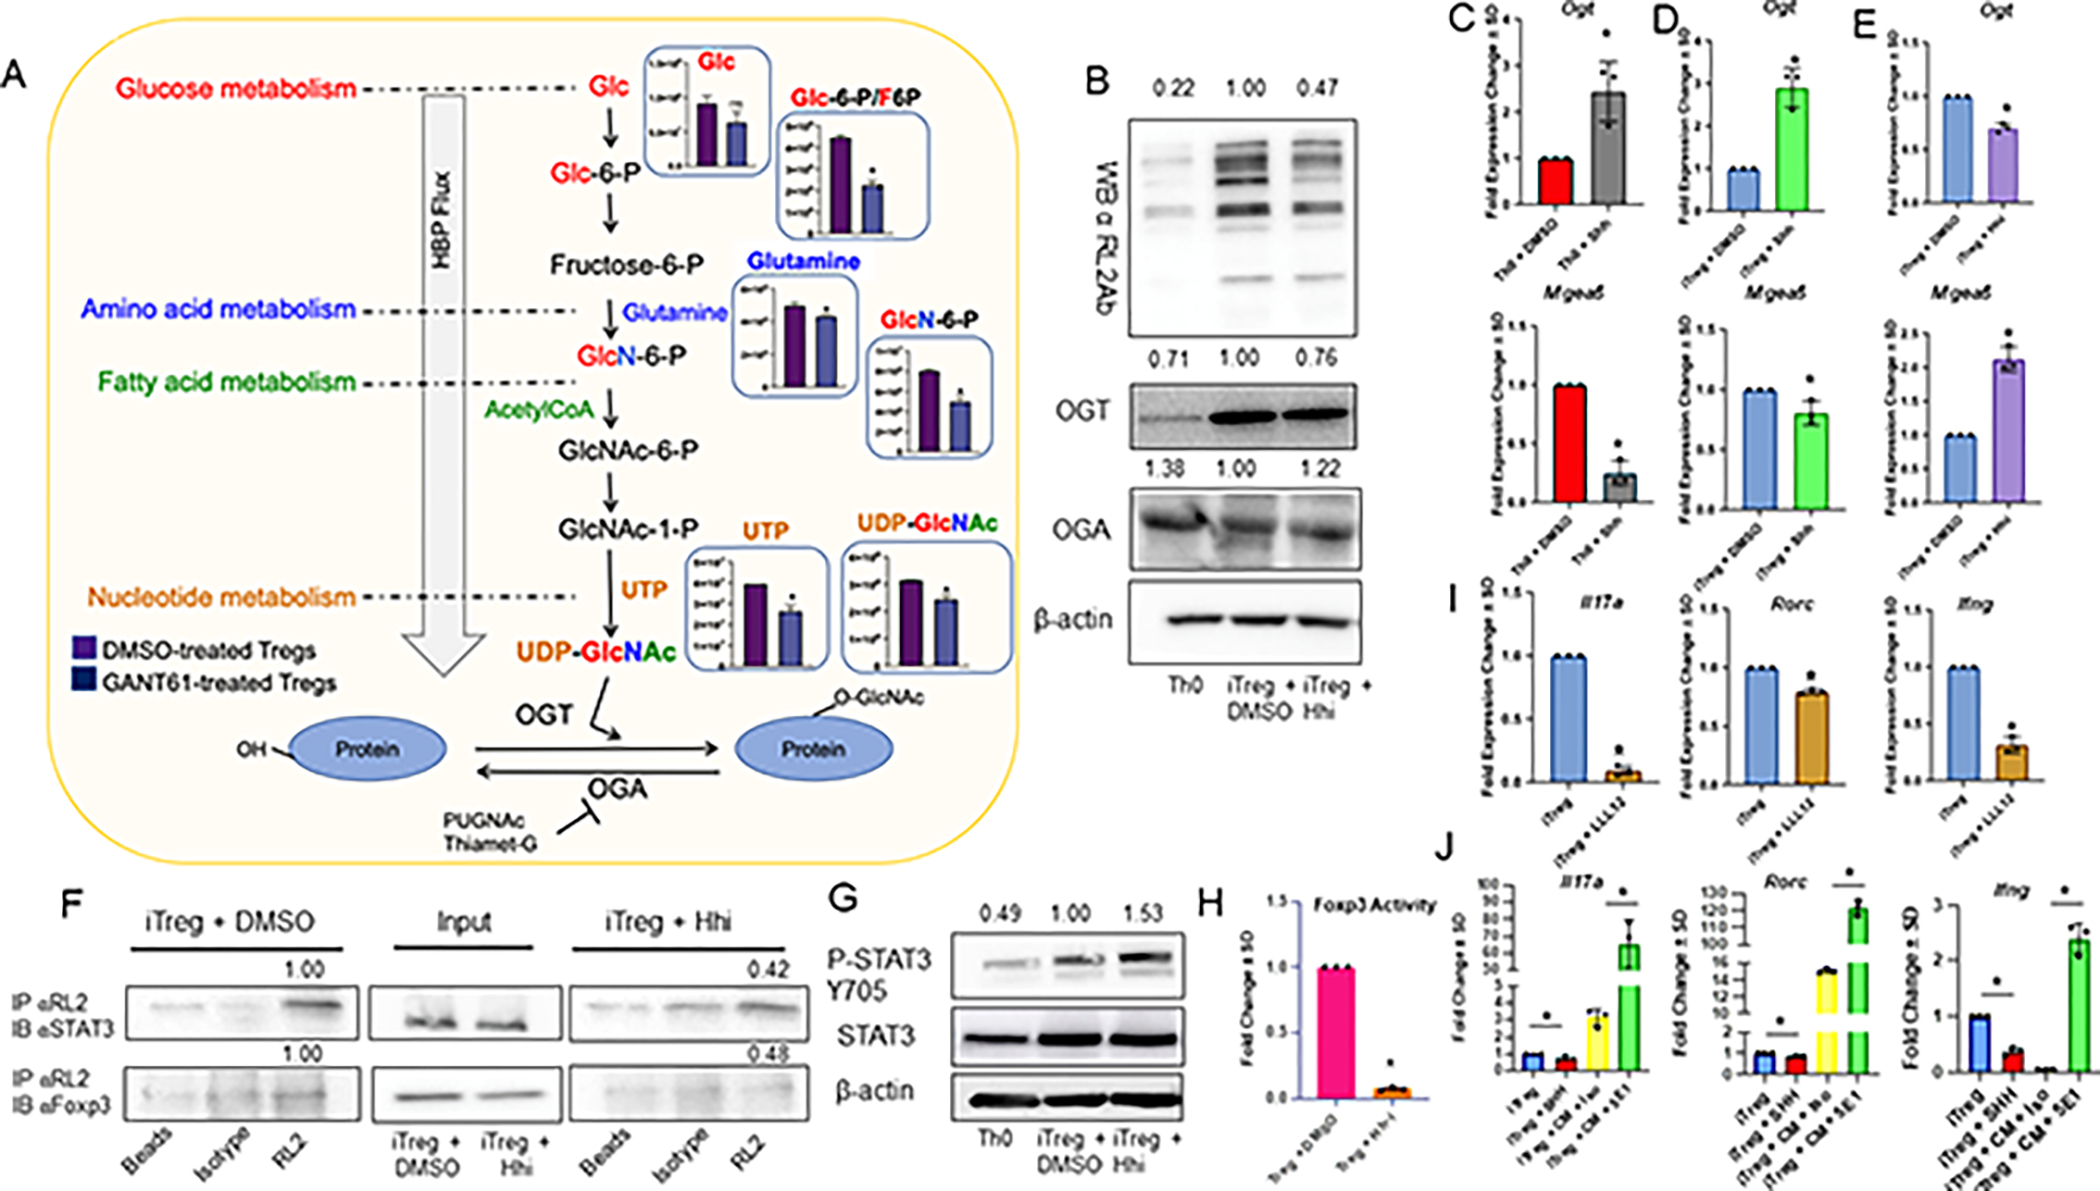
A. iTregs were treated with Veh or Hhi for 24 hours following differentiation followed by metabolomics assessment. Schematic of HBP depicting fold change of metabolites involved in UDP-GlcNAc biosynthesis from iTregs + Hhi (purple bar) and iTregs + DMSO (blue bar). B. Western Blot for O-GlcNAcylated proteins (RL2Ab), OGT, and OGA expression in Th0s, or iTregs +/− Hhi for 24 hours following differentiation. C. Transcript levels of Ogt and Mgea5 in Th0s, or D. iTregs treated with Shh for 24 hours following differentiation. E. Transcript levels of Ogt and Mgea5 in iTregs +/− Hhi. F. iTregs +/− Hhi for 24 hours following differentiation were immunoprecipitated for O-GlcNAcylated (RL2Ab), then immunoblotted for Foxp3 or STAT3. Densitometry values for Ips were determined by normalizing by the average of empty beads and isotype control lanes, and additionally normalized to input. G. Western Blot for p-STAT3 (Y705), and STAT3 expression in Th0s, or iTregs treated with Hhi or Veh for 24 hours post differentiation. H. Luciferase assay to assess Foxp3 activity in EL4 cells differentiated into Tregs and treated +/− Hhi for 24 hours following differentiation. N=3 per treatment group. I. Transcript levels of Il17a, Rorc, and Ifng in iTregs, where LLL12 is added after differentiation for 24 hours. J. Transcript levels of Il17a, Rorc, and Ifng in iTregs treated with 4T1 either SHH, or CM +/− 5E1 or isotype control for 24 hours after differentiation. All transcript levels in this figure were determined by qRT-PCR, and data is plotted as fold change +/− SEM. Immunoblots in B-E, G, and luciferase assay in H were performed at least twice. Immunoprecipitation in F and qRT-PCR in J was performed once. All data is from iTregs differentiated ex vivo and Hhi (GANT61) was used at 20μM. N=3 per treatment group for all qRT-PCR assessments and data plotted as +/− SD.
Uridine-diphosphate-N-acetylglucosamine (UDP-GlcNAc) is the key metabolite of the HBP, which integrates metabolism of carbohydrates (glucose), amino acids (glutamine), fat (acetyl-CoA), and nucleotides (uridine and ATP). Using UDP-GlcNAc as a substrate, O-GlcNAc-transferase (OGT) catalyzes O-GlcNAcylation of proteins. O-GlcNAc is removed from proteins by O-GlcNAcase (OGA), permitting dynamic regulation of O-GlcNAcylation. In Tregs, O-GlcNAcylation is essential for lineage stability and effector function by stabilizing key Treg proteins, Foxp3 and CD25 (48). Because we detected a reduction in the concentration of metabolites involved in the HBP, we evaluated cellular O-GlcNAcylation in iTregs in the context of Hh activity. Compared to Th0 cells, iTregs demonstrated enhanced cellular O-GlcNAcylation and OGT protein expression that was significantly reduced in iTregs inhibited for Hh signaling. The reverse trend was noted for OGA (Figure 4B). Recombinant Shh augmented the transcript expression of Ogt and concomitantly decreased expression of Mgea5 (OGA) (Figure 4C–D). On the contrary, inhibiting Hh signaling decreased Ogt and elevated Mgea5 (Figure 4E).
Th17 cells and Tregs exhibit plasticity, manifested in their ability to adapt to signaling cues. Because Hh inhibition resulted in a reduced Treg population in mammary tumors (Figure 1), with no significant changes in Treg viability (Supplementary Figure S1I–K), we hypothesized that Hh blockade might promote a phenotypic switch of Tregs to another cell type subset. ScRNA-seq analysis and cytokine profiling led us to hypothesize that in the context of Hh inhibition, Tregs were skewing toward a Th17 phenotype. Tregs and Th17 cells are programmed by specific transcription factors, with Foxp3 being the Treg fate–governing transcription factor and STAT3 being vital for Th17 cells. O-GlcNAcylation of Foxp3 enhanced its activity and stability, whereas O-GlcNAc modification of STAT3 mitigated its activity (Supplementary Figure S5B) (49). To determine whether there were changes in O-GlcNAcylation of Foxp3 and Stat3, we inhibited iTregs for Hh signaling, immunoprecipitated O-GlcNAcylated proteins using the RL2 antibody, and immunoblotted for STAT3 and Foxp3 (Figure 4F, Supplementary Figure S5C). For Foxp3 and STAT3, we found that inhibiting Hh diminished protein O-GlcNAcylation in iTregs. Because the O-GlcNAc modification of STAT3 mitigated its activity, we tested STAT3 phosphorylation at Tyr 705, a site that principally impacts STAT3 activity and Th17 conversion (50). iTregs inhibited for Hh demonstrated enhanced STAT3 phosphorylation (Figure 4G), indicating increased STAT3 activation. Concordantly, guided by previous findings that O-GlcNAc modification of Foxp3 enhances its activity (51), we hypothesized that Hh blockade mitigated Foxp3 activity. Because efficient transfection of primary T lymphocytes is challenging (52), we adapted an in vitro system previously reported for differentiating EL4 cells into Tregs (53). The transcript expression of classic Treg transcription factors (Foxp3, Tgfb1, Il2ra, Ebi3, Il12a) showed upregulation in EL4 cells that were cultured with TGFB and IL2 and stimulated with anti-CD3 and anti-CD28. This was abrogated when cells were blocked for Hh signaling (Supplementary Figure S5D–E). We utilized this system to transfect a luciferase reporter containing eight repeats of the Foxp3 consensus binding element, 5’-GTAAACA-3’, to assess Foxp3 activity in response to Hhi. There was a reduction in Foxp3 activity in EL4-derived Tregs inhibited for Hhi (Figure 4H).
Next, because Foxp3 activity was reduced with a concomitant increase of p-STAT3 expression in conditions of Hhi, we tested if Hh blockade enhanced STAT3 activity and shifted suppressive Tregs toward a hybrid Treg-Th17, or ‘Tr17’, phenotype. To assess this, we queried molecular markers of inflammatory Tr17 cells, Il17a, Rorc, and Ifng, in iTregs treated with LLL12, a p-STAT3 Tyr 705 inhibitor. STAT3 inhibition significantly reduced Il17a, Rorc, and Ifng in iTregs, highlighting the importance of STAT3 in influencing the Tr17 phenotype (Figure 4I). In contrast, tumor cell-derived CM increased the transcript levels of STAT3-regulated Tr17 specific markers Il17a and Rorc (54,55). Depleting the CM of Hh ligands with the 5E1 antibody starkly increased the levels of Il17a, Rorc, and Ifng compared to CM treated with an isotype control antibody and iTregs treated with exogenous Shh (positive control) (Figure 4J). In agreement with this, there was a significant increase in iTreg expression of IL17a, Rorγt, and IFNγ in CM supplemented with the 5E1 antibody (Supplementary Figure S5F–G). These data indicate that attenuating tumor cell Hh signaling promotes iTregs to shift to an inflammatory Tr17 phenotype.
Hh signaling blockade promotes the switch from Tregs to Th17s
RORγt+Foxp3+CD4+ T cells or IL17-producing Foxp3+ Tregs have been demonstrated in mice and humans. RORγt+Foxp3+CD4+ T cells represent a subset of Tregs with the potential to be precursors of Th17 cells or an intermediate differentiation stage with a bipolar potential to develop into Tregs or Th17 cells (56,57). To determine whether Hh blockade could skew Tregs towards a pathogenic Th17 phenotype in the dynamic TME, we mapped Tr17 and inflammatory Tr17 populations of tumor-bearing mice. We see a robust increase of Tr17 cells and inflammatory Tr17 cells within the tumors and spleens of Smo-i treated mice bearing 4T1 tumors (Figure 5A–D), EMT6 tumors (Figure 5E–H), or E0771 tumors (Supplementary Figure S6A–B), indicating that Smo-i induces Tregs to a less suppressive, more inflammatory phenotype. KEGG and GO pathway analyses using a Treg-specific gene list (using all genes p < 0.05, fold-change > 2) from our scRNA-seq data highlighted an increase in the expression of Th17 gene signatures in Tregs from Smo-i treated tumors (Supplementary Figure S6C–D). Treatment of iTregs with Hhi during differentiation led to a modest but significant increase in the population of cells expressing Th17-specific indicators IL17a and Rorγt (Figure 5I), complemented by a concomitant increase in Il17a and Rorc transcripts (Figure 5J). Concordantly, there was a significant upregulation of IFNγ-expressing Tr17 cells when treated with Hhi during differentiation, which indicated an inflammatory nature of these Tr17 cells (Figure 5K). Treatment of iTregs with Hhi after differentiation yielded similar results (Figure 5L–N). We also observed an increase in IL17a and Rorγt expression in iTregs treated with Hhi during or after differentiation, regardless of Foxp3 expression (Supplementary Figure S6E–F). Moreover, Il17a and Rorc transcript expression was also enhanced in physiologically relevant nTregs treated with Hhi (Supplementary Figure S6G). Collectively, the data solidify that inhibiting Hh activity promotes Tregs to pivot towards inflammatory Tr17 cells.
Figure 5. Hh signaling blockade promotes the switch from Tregs to Th17 cells.
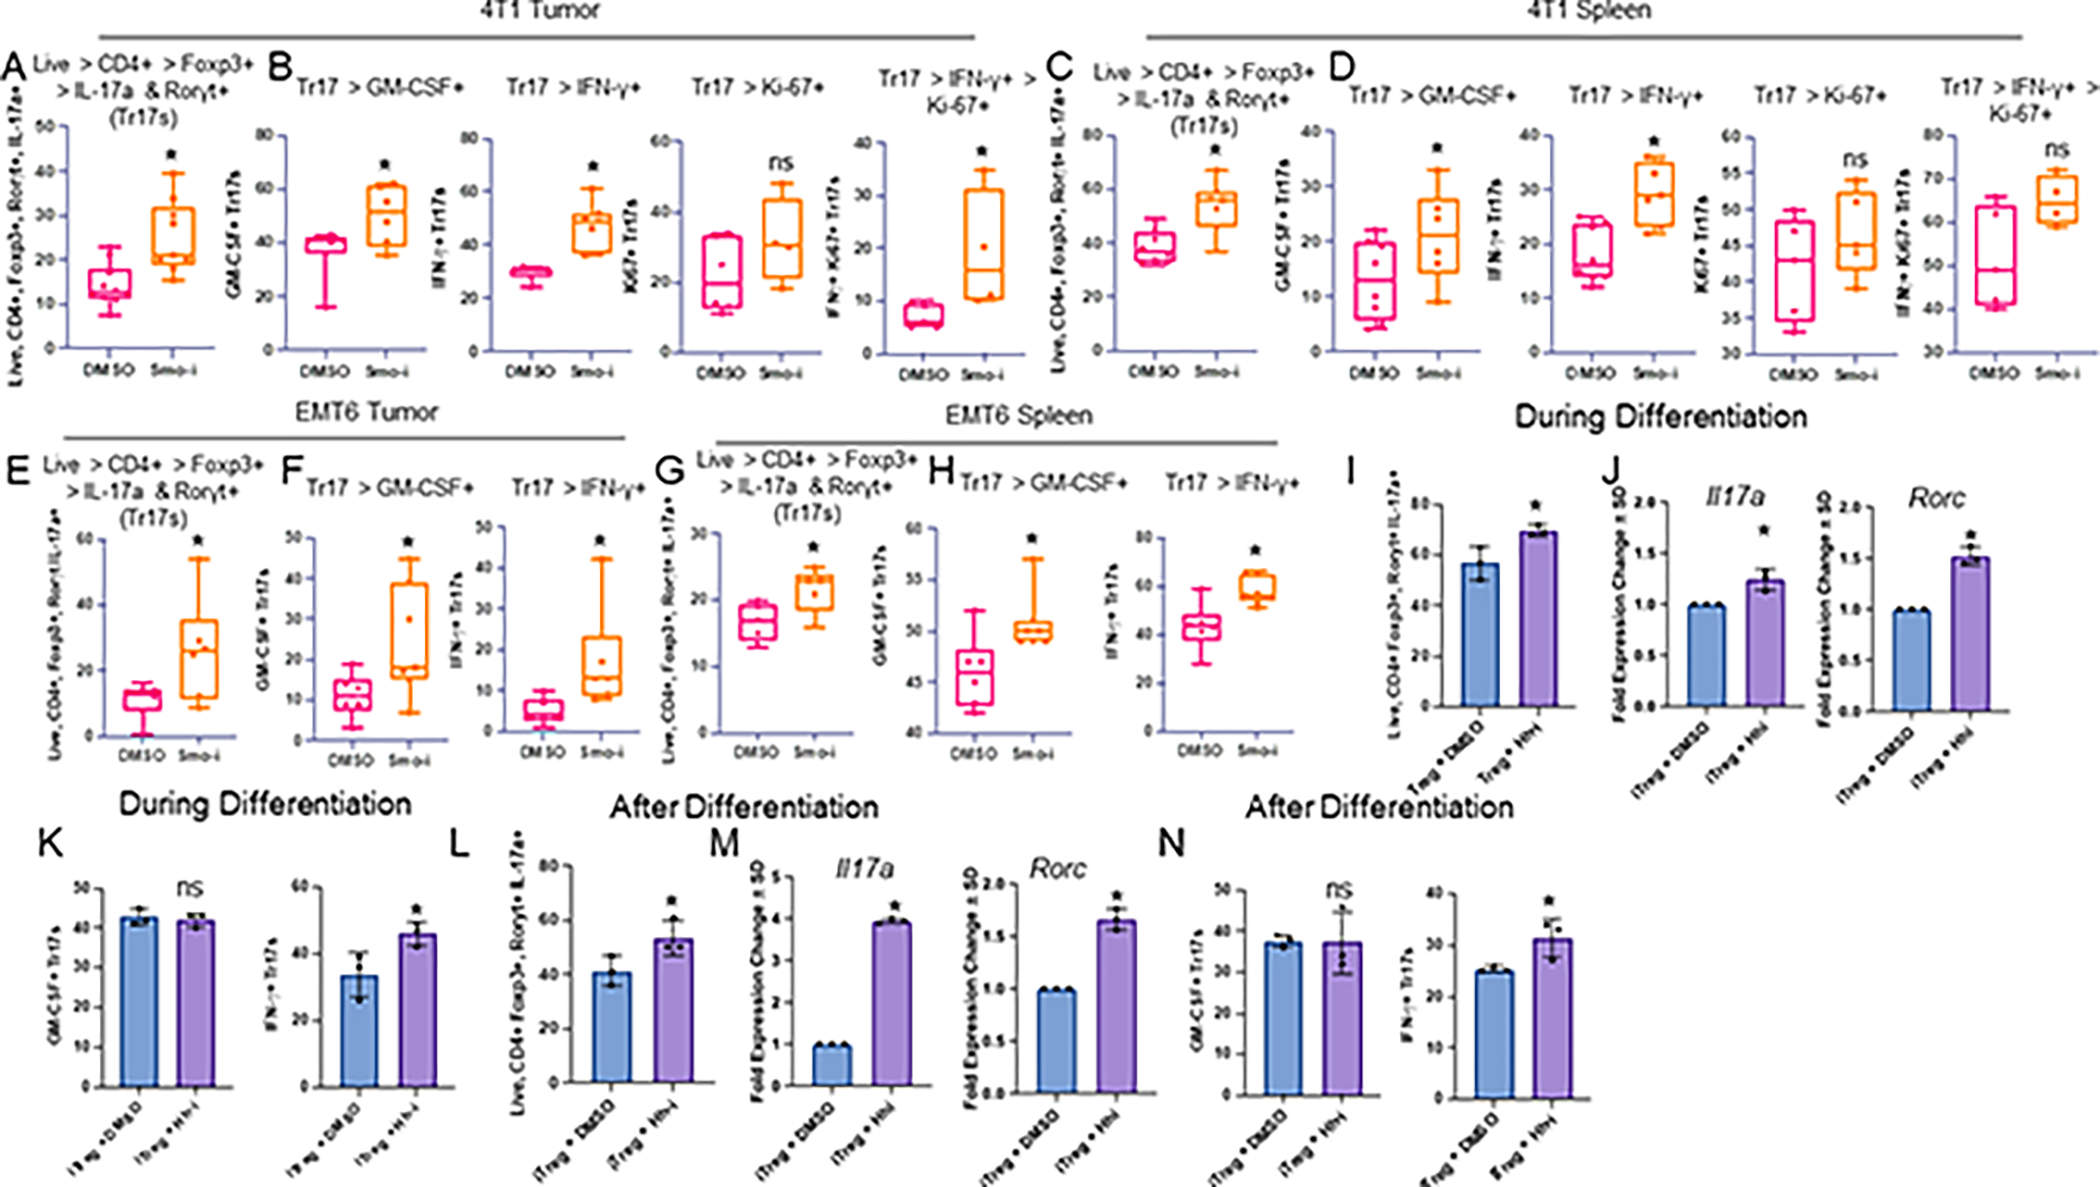
A. Flow cytometric quantitation of 4T1 tumor infiltrating Tr17 populations from 4T1 tumor-bearing mice treated with Smo-i or Veh for 3 weeks (% positive IL-17a+ Rorγt+ out of Tregs, n=9 per treatment group), and B. Inflammatory Tr17 populations from the 4T1 tumor (% positive IFN-γ+ or GM-CSF+ out of Tr17s, n=7 per treatment group), and Ki-67 expression in these populations (n=5 per treatment group) and C,D spleen (n=8 per treatment group for Tr17s and inflammatory Tr17s, n=5 per treatment group for Ki-67+ Tr17s and inflammatory Tr17s. E. Flow cytometric quantitation of EMT6 tumor infiltrating Tr17 populations (n=7 per treatment group), and F. inflammatory Tr17 populations from the EMT6 tumor (n=7 per treatment group), and G,H. Spleen (n=7 per treatment group). Data in A-H plotted as +/− SEM. I. Flow cytometric quantitation of Th17 markers in iTregs treated with Hhi during differentiation (% positive IL-17a+ Rorγt+ out of Tregs, n=3 per treatment group). J. qRT-PCR analysis of transcript levels of Il17a and Rorc in iTregs, where Hhi is incorporated into the differentiation cocktail (n=3 per treatment group). K. Flow cytometric quantitation of Th17 inflammatory markers in iTregs treated with Hhi during differentiation (% positive IFN-γ+ or GM-CSF+ out of Tr17s, n=3 per treatment group). L. Flow cytometric quantitation of Th17 markers in iTregs treated with Hhi for 24 hours after differentiation (n=3 per treatment group). M. qRT-PCR analysis of transcript levels of Il17a and Rorc in iTregs, where Hhi is incorporated for 24 hours after differentiation (n=3 per treatment group). N. Flow quantitation of inflammatory markers in iTregs treated with Hhi after differentiation (n=3 per treatment group). All qRT-PCR data is plotted as fold change +/− SD. In vivo experiments A-D were repeated at least twice. In vivo experiments E-H were performed once. Ex vivo experiments I-N were performed once and T cells were pooled from 20 mice. Hhi (GANT61) was used at 20μM for all ex vivo experiments.
Inhibiting Hh activity augments pro-inflammatory Th17 cells
We highlighted differential expression of Il17a (red dots) within the CD4+ T cell cluster from our scRNA-seq analysis between Smo-i– and Veh-treated mice (Figure 6A). The Th17 cluster from the scRNA-seq data revealed a robust increase in Th17 signatures and inflammatory genes in Smo-i–treated tumors (Figure 6B). The tumor lysate and sera of Smo-i–treated mice showed an increased abundance of Th17-related cytokines and chemokines in 4T1 (Supplementary Figure S7A–B) and EMT6 tumor-bearing mice (Supplementary Figure S7C). The changes in IL17a and IL6 expression within the tumors were not recapitulated in the EMT6 model. The tumors and spleens from Smo-i–treated mice had a significant increase in Th17 cells that expressed inflammatory markers (Figure 6C–F, Supplementary Figure S7D–E). Consistent with an increase in proliferative Tr17 cells from Smo-i–treated tumors (Figure 5B and 5D, Supplementary Figure S6C–D), we found a trending increase in the populations of proliferative Th17 cells and inflammatory Th17 cells in the 4T1 model and a significant increase of these populations in the E0771 model (Figure 6C–D, Supplementary Figure S7D–E).
Figure 6. Tumor derived Hh ligand promotes iTreg differentiation and blunts Th17 differentiation.
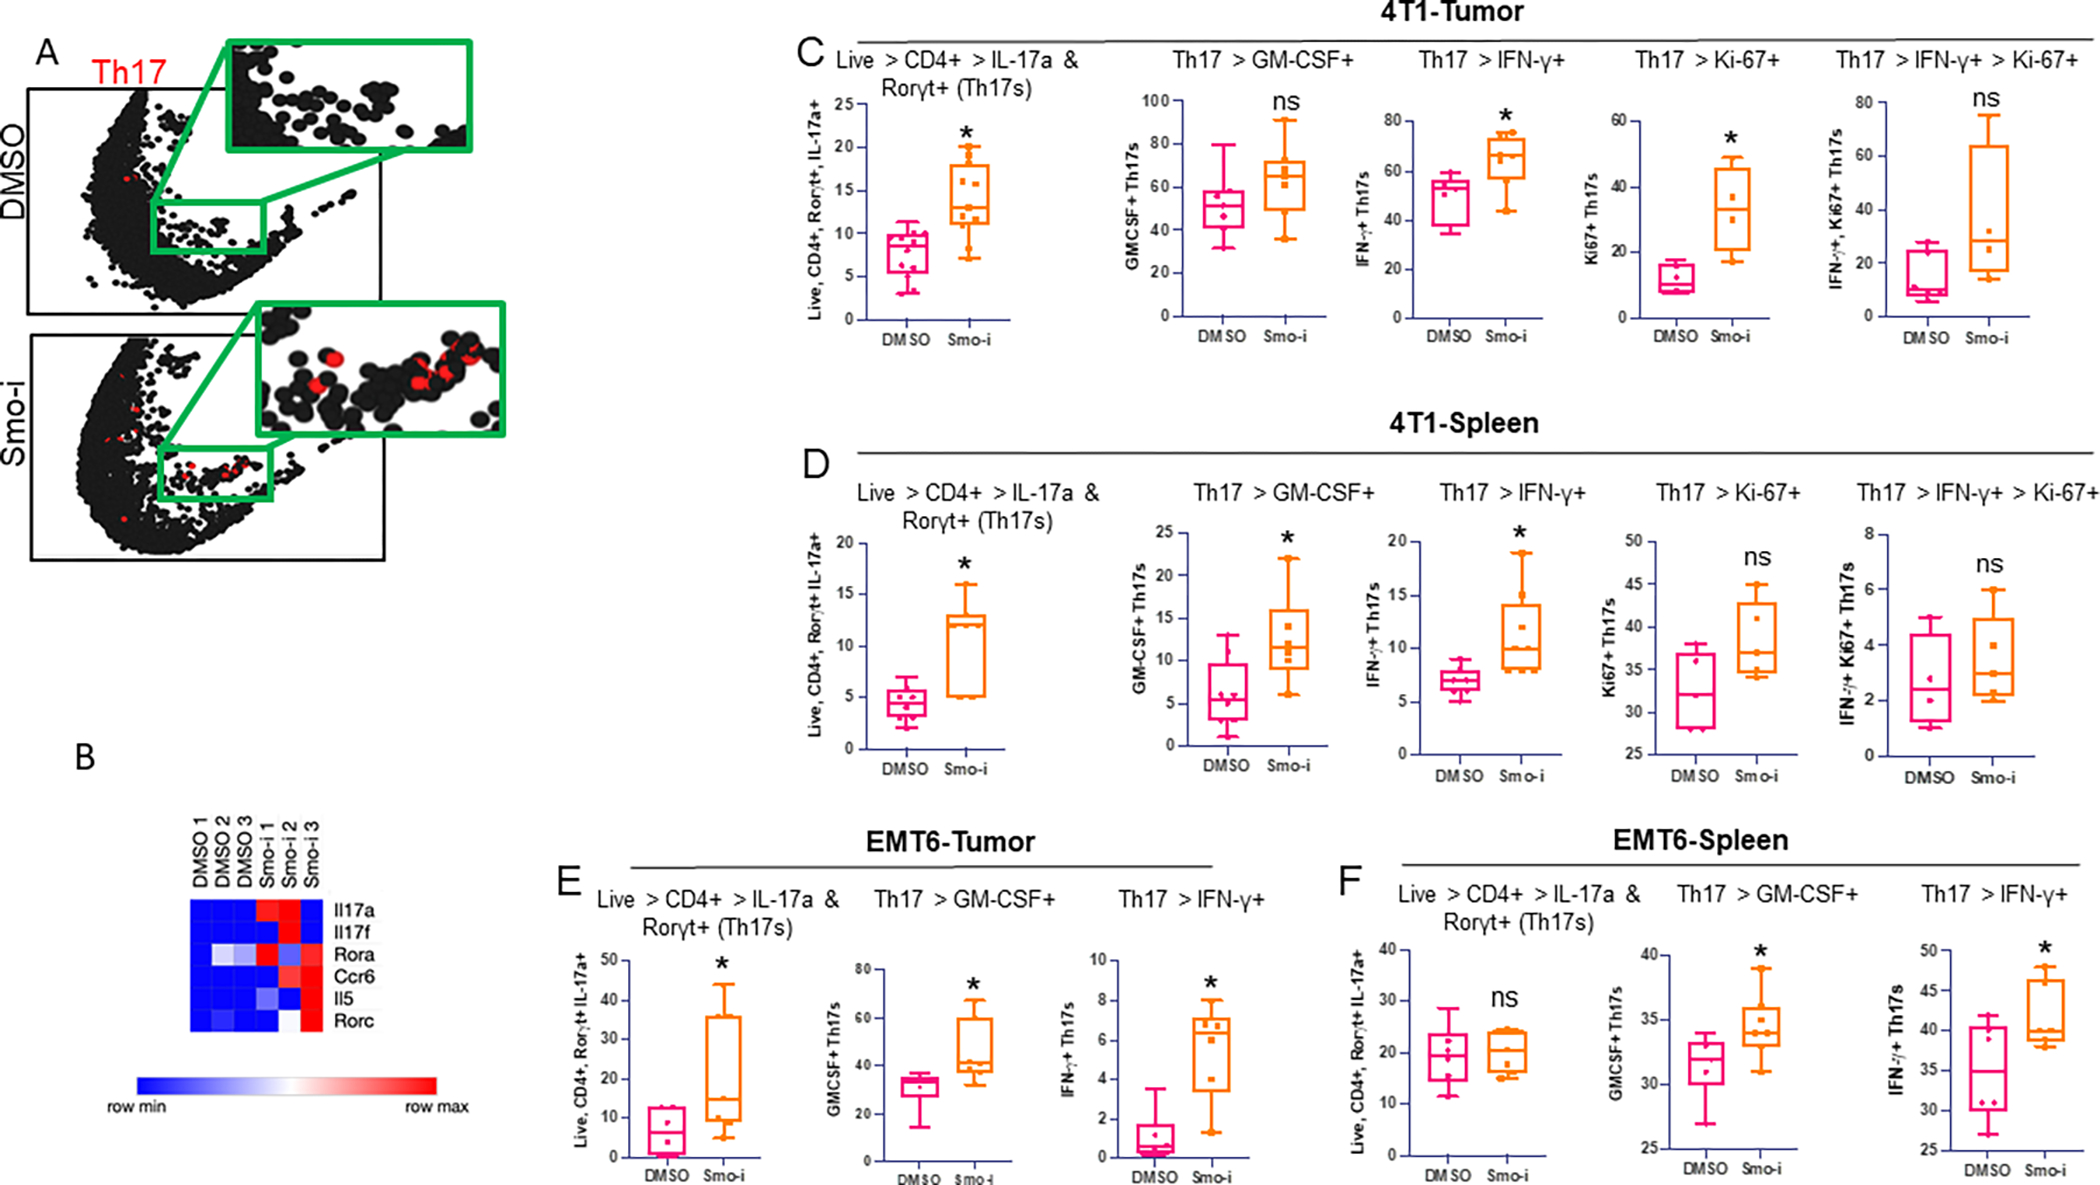
A. Il17a expression from scRNA-seq analysis in the lymphocyte cluster from representative Smo-i treated or Veh treated 4T1 tumor-bearing mice. B. Heatmap of Th17 related genes in Th17s from scRNA-seq analysis from vehicle or Smo-i treated 4T1 tumor-bearing mice. C. Flow cytometric quantitation of 4T1 tumor infiltrating populations from mice treated with Veh or Smo-i from left to right: i) Th17 populations (% positive IL-17a+ Rorγt+ out of CD4+ T cells, n=12 per treatment group), ii) inflammatory Th17 populations from the tumor (% positive IFN-γ+ or GM-CSF+ out of Th17s, n=7 per treatment group), and Ki-67 expression in iii) Th17s (n=5 per treatment group) and iv) inflammatory Th17s (n=5 per treatment group). D. Flow cytometric quantitation of 4T1 tumor bearing mice splenic populations from left to right: i) splenic Th17 populations (% positive IL-17a+ Rorγt+ out of CD4+ T cells, n=7 per treatment group), ii) splenic inflammatory Th17 populations from the tumor (% positive IFN-γ+ or GM-CSF+ out of Th17s, n=7 per treatment group), and Ki-67 expression in iii) splenic Th17s (n=5 per treatment group) and iv) splenic inflammatory Th17s (n=5 per treatment group). E. Flow cytometric quantitation of EMT6 tumor infiltrating Th17 populations (left, n=7 per treatment group) and (right) inflammatory Th17 populations (n=7 per treatment group) and F. Splenic Th17 populations (left n=7 per treatment group) and (right) inflammatory Th17 populations (n=7 per treatment group). In vivo experiments C-D were performed at least twice. In vivo experiments E-F were performed once. Data plotted as +/− SEM.
To contextualize the clinical relevance of these findings, we evaluated an RNA-seq dataset from BCC tumor biopsies from Vismodegib-sensitive and -resistant patients. Six immune-related pathways were significantly altered between Vismodegib-sensitive and Vismodegib-resistant patients, with the top two most significant being ‘IL17 Signaling’ and ‘Th17 Activation Pathway’ (Supplementary Figure S7F). Further analysis of these data revealed a significant increase in inflammatory Th17 gene signatures in Vismodegib-sensitive patients (Supplementary Figure S7G–H), indicating that Hh blockade elicits an inflammatory Th17 milieu in patients with BCC who respond favorably to Vismodegib.
Th17 cells contribute to a robust population of cytotoxic CD8+ T cells in Smo-i treated tumor-bearing mice
A well-defined role for inflammatory Th17 cells includes the recruitment of cytotoxic CD8+ T cells to the TME (20,58). We therefore tested whether Smo-i influenced the population of CD8+ T cells in tumors. The scRNA-seq Th17-specific gene list showed a robust increase in expression for transcripts of CD8+ T cell–recruiting chemokines, CCL5, CCL4, CXCL10, and CCL25, in tumors from Smo-i–treated mice (Figure 7A). In agreement with this, there was a significant increase in the expression of chemokine receptors in CD8+ T cells and cytotoxic CD8+ T cells in our scRNA-seq data (Figure 7B–C). We next assessed total CD8+ T cells (Figure 7D–E) and granzyme (GZMB)-expressing cytotoxic CD8+ T cells and noted a significant increase in these populations in the tumors and spleens of Smo-i-treated mice (Figure 7F–G, Supplementary Figure S8A). This was consistent with analysis of tumor-infiltrating CD8+ T cell– and cytotoxic CD8+ T cell–specific gene lists from scRNA-seq, which revealed a significant enrichment in migration signatures in these populations from Smo-i–treated mice (Figure 7H–I). The tumors from Smo-i–treated mice had a significantly increased population of inflammatory, IFNγ-expressing CD8+ T cells (Figure 7J, Supplementary Figure S8B). As such, the increase in inflammatory Th17 cells in Smo-i–treated tumors was accompanied by a robust increase in the cytotoxic CD8+ T cells.
Figure 7. Hh signaling blockade increases the abundance and activity of tumor CD8+ T cells.
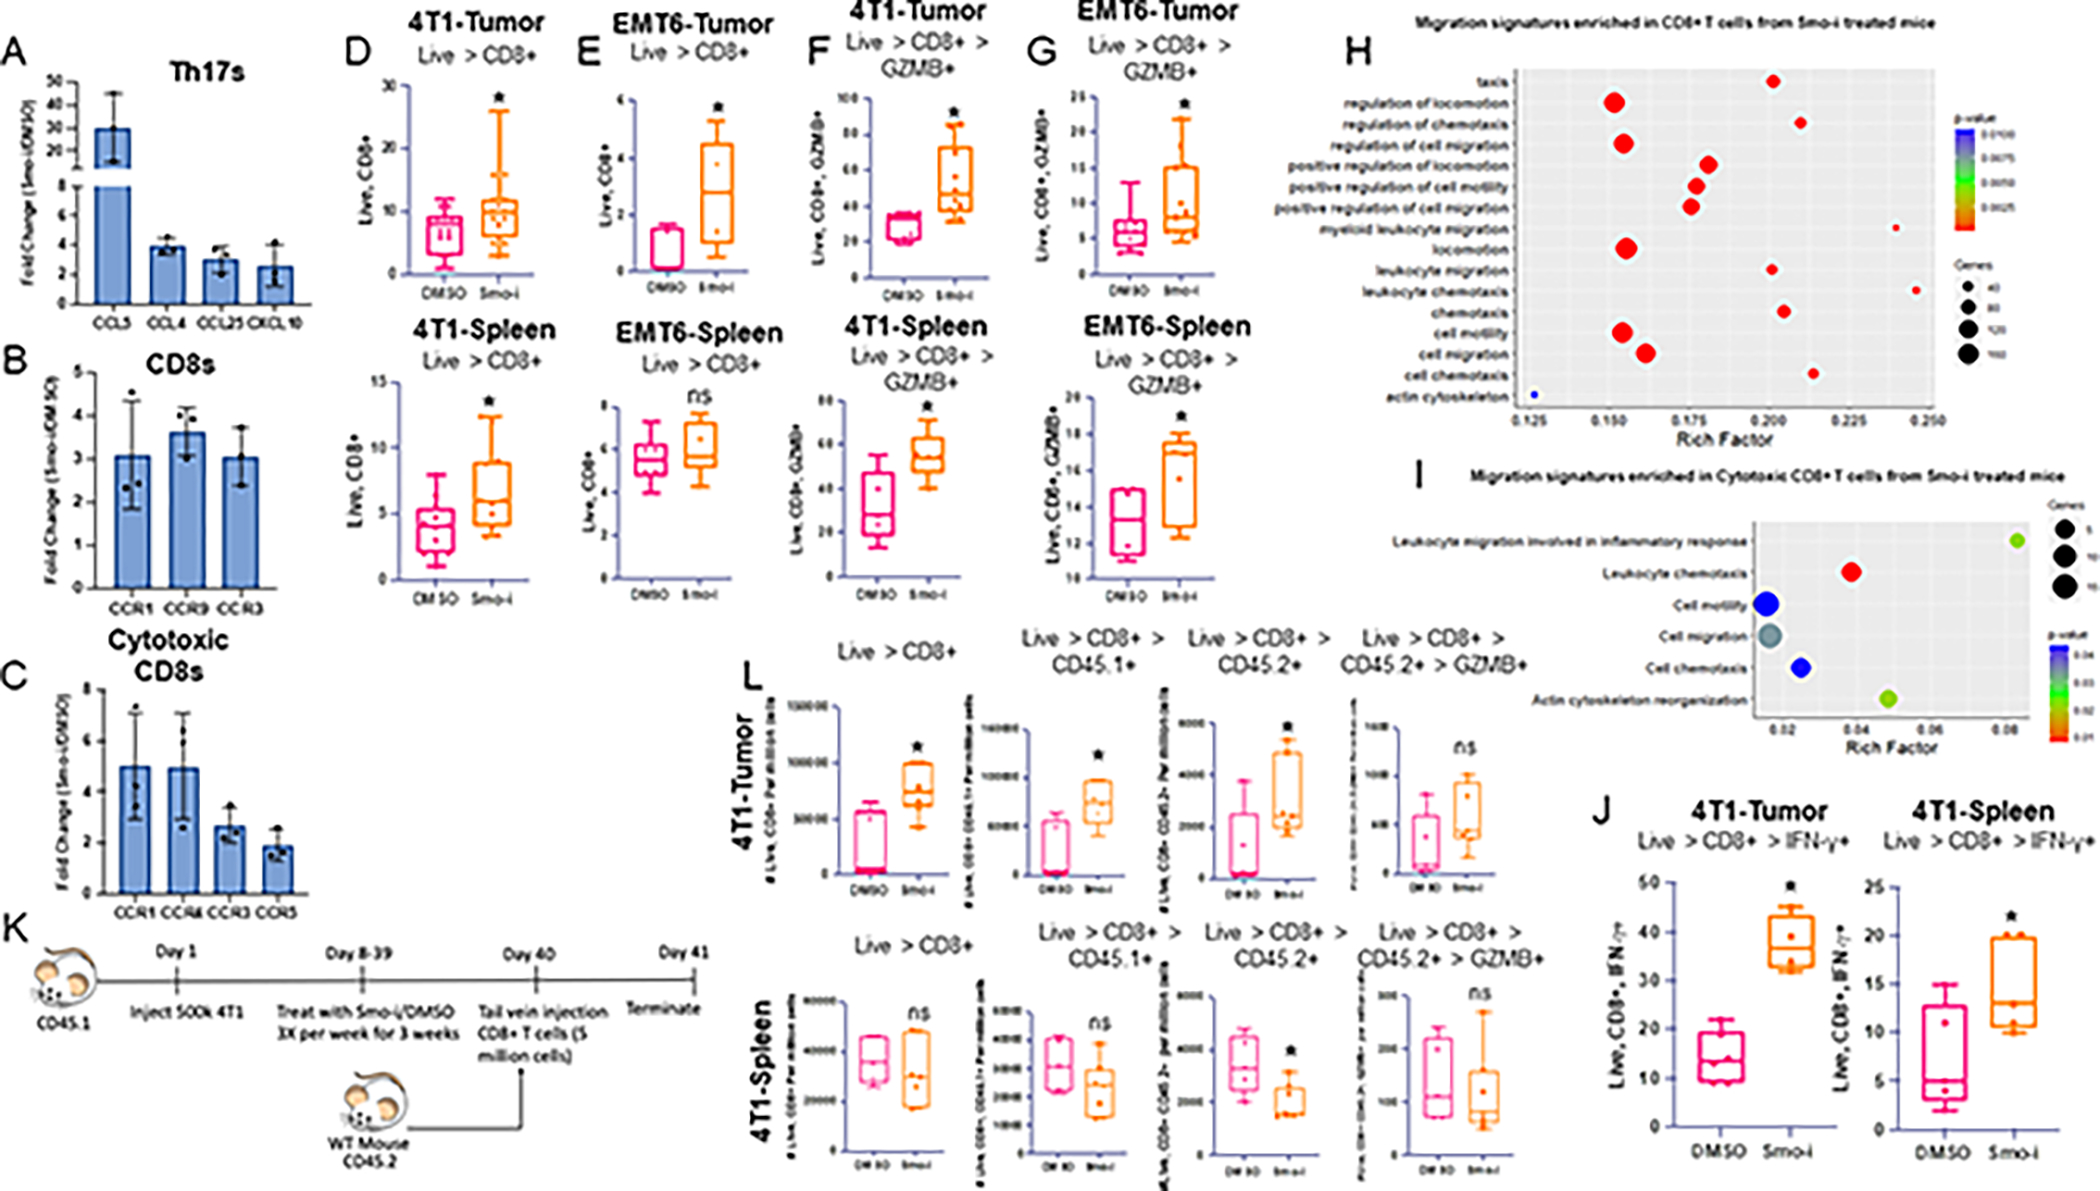
A. Fold change of CD8+ T cell recruiting chemokine transcript expression in 4T1 tumor infiltrating Th17s from scRNA-seq analysis of tumor from 4T1 tumor-bearing mice treated with Veh or Smo-i. B. Fold change of CD8+ T cell recruiting chemokine receptor transcript expression in 4T1 tumor infiltrating CD8+ T cells and C. cytotoxic T cells from scRNA-seq analysis. D. Flow cytometric quantitation of 4T1 tumor infiltrating CD8+ T cells from mice treated with Veh or Smo-i (n=15 per treatment group) and splenic total CD8+ T cells (n=12 per treatment group). E. Flow cytometric quantitation of EMT6 tumor infiltrating CD8+ T cells (n=5 per treatment group) and splenic total CD8+ T cells (n=7 per treatment group) F. 4T1 tumor infiltrating (n=10 per treatment group) and splenic cytotoxic CD8+ T cells (n=7 per treatment group) (% positive GZMB+ out of CD8+ T cells), and G. EMT6 tumor infiltrating (n=12 per treatment group) and splenic (n=7 per treatment group) cytotoxic CD8+ T cells. H. GO pathway analysis of migration pathways significantly enriched in CD8+ T cells and I. cytotoxic CD8+ T cells from Smo-i treated mice. Rich factor is calculated using the following formula: # of differentially-expressed genes divided by total genes within GO term or pathway. J. Flow cytometric quantitation of 4T1 tumor and spleen infiltrating inflammatory CD8+ T cells (% positive IFN-γ+ out of CD8+ T cells). K. Schematic for in vivo adoptive transfer experiment. L. Flow cytometric quantitation of 4T1 tumor (n=5 Vehicle and 7 treated) and spleen infiltrating (n=5 vehicle and 7 treated) total CD8+ T cells, CD8+ CD45.1+ cells, CD8+ CD45.2+ cells, and CD8+ CD45.2+ GZMB+ cells, represented as number of cells per million total cells. In vivo experiments D-G were performed at least twice. In vivo experiments in J and L were performed once. Data plotted as +/− SEM.
Next, we evaluated whether Smo-i-mediated changes in the TME were sufficient to alter CD8+ T cell trafficking to the tumor. To test this, we performed an adoptive transfer experiment in which CD45.1+ BALB/c mice were inoculated with 4T1 tumor cells, followed by three weeks of treatment with DMSO or Smo-i, as in our previous experiments. At the end of three weeks, we enriched CD8+ T cells from the spleens of non-tumor bearing, treatment-naïve CD45.2+ BALB/c mice, injected the cells into the tail veins of tumor-bearing mice, and assessed recipient tumor-bearing mice 24 hours later for CD8+ T cell trafficking into tumors (Figure 7K). Flow cytometric analysis of the tumors and spleens of these mice revealed a significant increase in overall CD8+ T cells, CD8+CD45.1+ T cells, and CD8+CD45.2+ T cells in tumors (Figure 7L). There were no significant changes in these populations in the spleens of the recipient mice, except for the CD8+CD45.2+ T cells, suggesting that they likely were preferentially trafficked to the tumor in Smo-i–treated mice. We also assessed the CD8+CD45.2+ GZMB+ population and found a trending increase in this population in tumors, although not significant (Figure 7L). These changes were corroborated by an increased expression of cytokines and chemokines within both the tumors and sera of Smo-i-treated mice, including CCL20, CCL5 (Supplementary Figure S7A–C), IL5, IL15, LDLR, and P-Selectin (Supplementary Figure S8C–D), which promote CD8+ T cell migration and proliferation. These findings are promising and solidify the role of Hh blockade in promoting CD8+ T cell recruitment to the TME, and further mechanistic studies are needed to assess whether this is Th17 cell–dependent. Finally, to assess the clinical relevance of our findings, we queried the correlation between GLI2 and activated CD8+ T cell abundance using TISIDB. We noted a significant, negative correlation between GLI1 and GLI2 expression and the abundance of activated CD8+ T cells in several cancer types (Supplementary Figure S8E–F). An estimation of cell counts for all flow cytometry data is included in Supplementary Figures S9–S10. Overall, our data highlight an increase in the abundance of overall CD8+ T cells, including cytotoxic CD8+ T cells, in response to Hh blockade, likely through an increased Th17 population.
Discussion
In this study, we showed a biological role for Hh signaling in regulating the homeostasis of a subset of CD4+ T cells. Our study demonstrates that Hh signaling is vital for the effective differentiation and activity of immunosuppressive iTregs. In support of this, we registered a positive correlation between Treg abundance and GLI1 and GLI2 expression across several cancers, further solidifying our findings. This finding is critical considering several reports demonstrating a correlation between Treg abundance and worse patient prognosis and survival in breast cancer (59–62). Tregs promote tumor progression by secreting inhibitory cytokines IL10, IL35, and TGFβ to hamper the response of effector cells and potentiate other suppressive cells, such as myeloid-derived suppressor cells (MDSCs), in the TME (63). Tregs can further mitigate the effector functions of CD8+ T cells by IL2 deprivation, a cytokine which is necessary for CD8+ T cell expansion. Treg expression of CTLA-4 and LAG3 can additionally induce dendritic cell tolerance. Although previous reports substantiate our findings that Hh signaling regulates Treg activity in atopic dermatitis (64) and Treg expansion in the context of Mycobacteria infection (65), this is the first report to substantiate a role for tumor-derived Hh ligands in promoting Treg differentiation and activity in the TME.
Inhibiting Hh signaling diminished the differentiation and activity of tumor-promoting Tregs and potentiated their conversion to pathogenic, inflammatory Th17 cells. Although the role of Th17 cells in the TME of BC remains controversial, there is evidence that the inflammatory nature of pathogenic Th17 cells may play a protective role in tumor immunity (66). Our findings support this; however, further studies are needed to establish the role of Th17 cells in breast cancer. Mechanistically, we uncovered a role for Hh signaling in inducing alterations in iTreg metabolism through changes in the HBP pathway, which then mitigated Foxp3 and STAT3 O-GlcNAcylation resulting in reduced Treg suppressive activity and enhanced expression of pathogenic Th17-related proteins IL17a, Rorγt, IFNγ, and GM-CSF. Therefore, Hh signaling activity is a determinative factor in the fate and functionality of CD4+ T cells. Although some studies indicate that STAT3 transcriptionally enhances Foxp3 expression, exacerbating the Treg suppressive phenotype (67,68), other studies show that STAT3 transcriptionally represses Foxp3 expression, mitigating the suppressive activity (69–72). Our studies are aligned with the latter; in the context of Hh blockade, we found an enhanced STAT3 activity profile and blunted Treg suppressive activity. In accordance with this, there was an increase in the expression of STAT3 targets Rorc and Il17a and a concomitant decrease in characteristic Treg proteins.
Th17 cells are present within tumor tissue, but their function in breast cancer progression and metastasis has been debated. Th17 cells are reported to upregulate CXCL1 production during breast cancer progression, a chemokine associated with promoting cancer development and growth (73). Similarly, elevated Th17 tumor infiltration associates with increased infiltration of immunosuppressive MDSCs (74). In our model systems, tumors from Smo-i-treated mice had decreased expression of CXCL1 and a significant reduction of MDSC infiltration (29), indicating that Hh-inhibited Th17 cells play a distinct functional role in the mammary TME. In support of this, multiple studies report that Th17 cells drive anti-tumor immune responses by recruiting CD4+ T cells, CD8+ T cells, and DCs into tumors, activating effector CD8+ T cells, or by producing IFNγ (20,21,75–78). Consistently, we found increased populations of tumor-eradicating GZMB- and IFNγ-expressing CD8+ T cells.
The discrepancies in the literature regarding Th17 cells are likely due to several factors. Much of the current clinical data correlates patient prognosis and tumor growth with cytokines secreted by Th17 cells, such as IL22, IL17a, and IL23 (74,76,78). However, other immune cells are also responsible for these cytokines. Furthermore, it is becoming clearer that the role of Th17 cells is context-dependent. They can assume a homeostatic or pathogenic phenotype in distinct tissue types and under different disease conditions. Here, we showed that Hh blockade reduced Treg differentiation and suppressive activity, while promoting pathogenic, inflammatory Th17 cells and creating a tumor-eliminating immune microenvironment in BC. In light of previous reports identifying a role for Vismodegib in mitigating lung metastases and tumor vascularity (29, 39), the data here open avenues for potential combinatorial therapies for BC patients. We effectively demonstrated that Vismodegib turns ‘cold’ TNBC tumors ‘hot’ through an increased abundance of pathogenic Th17 cells and cytotoxic CD8+ T cells. Thus, combining Vismodegib with immunotherapy may augment the efficacy of immunotherapy treatment in patients with TNBC.
Study Limitations
We recapitulated our ex vivo findings in the context of the dynamic TME. One limitation of our study includes the usage of a systemic Hh inhibitor. This can be addressed with genetically modified mouse models to solidify a mechanistic connection between Th17 cells and CD8+ T cell recruitment. Another limitation of our study includes our estimation of T cell abundance through flow cytometric data. It is challenging to estimate with precision the volume aspirated by the flow cytometer which may lead to variations in calculating cell abundance. To address this, we performed flow cytometric analyses in the 4T1 Balb/c mammary cancer model for T cell populations and utilized counting beads to accurately estimate the number of cells/μL.
Supplementary Material
Synopsis.
Hedgehog signaling metabolically programs and supports differentiation and activity of Tregs. Inhibiting Hedgehog shifts Tregs into inflammatory Th17 cells and creates an immune-reactive tumor microenvironment, paving the way for novel combinatorial approaches to treat triple-negative breast cancer.
Acknowledgements
The authors would like to acknowledge the following funding sources for supporting this work: Department of Defense (W81XWH-14-1-0516, W81XWH-18-1-0036, W81XWH-19-1-0755), NCI R01CA169202, NCI R01CA262160, Metavivor, O’Neal Invests, and The Breast Cancer Research Foundation of Alabama (BCRFA), all awarded to L. A. Shevde. The work is supported in part by T32AI007051 awarded to D.C. Hinshaw. The authors also acknowledge the UAB Comprehensive Flow Cytometry Core supported by NIH Grant P30 AI027667. The authors thank the Juan Liu and the Jason Locasale laboratory at Duke University for their assistance with the metabolomics data acquisition.
Abbreviations
- BC
breast cancer
- BCC
basal cell carcinoma
- CFSE
Carboxyfluorescein succinimidyl ester
- CM
conditioned medium
- CTLA-4
cytotoxic T-lymphocyte-associated antigen 4
- DHH
desert hedgehog
- DMSO
dimethyl sulfoxide
- Ebi3
Epstein-Barr virus Induced 3
- ECAR
extracellular acidification rate
- ES
Enrichment Score
- FBS
fetal bovine serum
- Foxp3
forkhead box P3
- GZMB
granzyme B
- HBP
hexosamine biosynthetic pathway
- Hh
hedgehog
- Hhi
hedgehog inhibitor
- IFN-γ
interferon gamma
- IHH
Indian hedgehog
- IL-10
interleukin 10
- IL-12a
interleukin 12a
- IL-17a
interleukin 17a
- IL-2
interleukin 2
- InfTh17s
Inflammatory Th17s; Th17s expressing GM-CSF or IFN-γ
- InfTr17s
Inflammatory Tr17s; Tr17s expressing GM-CSF or IFN-γ
- iTreg
inducible regulatory T cell
- MDSC
myeloid derived suppressor cell
- mTNBC
metastatic triple negative breast cancer
- OGA
O-GlcNAcase
- OGT
O-GlcNAc transferase
- OCR
oxygen consumption rate
- PTCH
Patched
- Rorγt
RAR-related orphan receptor gamma
- scRNA-seq
single cell RNA sequencing
- SHH
sonic hedgehog
- SMO
smoothened
- Smo-i
smoothened inhibitor
- STAT3
signal transducer and activator of transcription 3
- Tbet
T-box transcription factor
- Teff
effector T cell
- TGF-β
transforming growth factor beta
- Th0
naïve CD4+ T cells
- Th1
T helper 1 cell
- Th2
T helper 2 cell
- Th17
T helper 17 cell
- TIME
tumor immune microenvironment
- TNBC
triple negative breast cancer
- Treg
regulatory T cell
- Tr17
Th17-like regulatory T cells
- UDP-GlcNAc
uridine-diphosphate-N-acetylglucosamine
- Veh
vehicle control (DMSO)
- γδT cells
gamma delta T cells
Footnotes
Declaration of Interests: The authors declare no competing conflicts of interest for this work.
References
- 1.Wilkinson L, Gathani T. Understanding breast cancer as a global health concern. Br J Radiol 2022;95:20211033. [DOI] [PMC free article] [PubMed] [Google Scholar]
- 2.Chue BM, La Course BD. Case report of long-term survival with metastatic triple-negative breast carcinoma: Treatment possibilities for metastatic disease. Medicine (Baltimore) 2019;98:e15302. [DOI] [PMC free article] [PubMed] [Google Scholar]
- 3.Emens LA, Cruz C, Eder JP, Braiteh F, Chung C, Tolaney SM, et al. Long-term Clinical Outcomes and Biomarker Analyses of Atezolizumab Therapy for Patients With Metastatic Triple-Negative Bsreast Cancer: A Phase 1 Study. JAMA Oncol 2019;5:74–82 [DOI] [PMC free article] [PubMed] [Google Scholar]
- 4.Silva D, Mesquita A. Evolving Evidence for the Optimization of Neoadjuvant Therapy in Triple-Negative Breast Cancer. Breast Cancer (Auckl) 2022;16:11782234221107580. [DOI] [PMC free article] [PubMed] [Google Scholar]
- 5.Zahran AM, El-Badawy O, Kamel LM, Rayan A, Rezk K, Abdel-Rahim MH. Accumulation of Regulatory T Cells in Triple Negative Breast Cancer Can Boost Immune Disruption. Cancer Manag Res 2021;13:6019–29 [DOI] [PMC free article] [PubMed] [Google Scholar]
- 6.Hoechst B, Gamrekelashvili J, Manns MP, Greten TF, Korangy F. Plasticity of human Th17 cells and iTregs is orchestrated by different subsets of myeloid cells. Blood 2011;117:6532–41 [DOI] [PubMed] [Google Scholar]
- 7.Kleinewietfeld M, Hafler DA. The plasticity of human Treg and Th17 cells and its role in autoimmunity. Semin Immunol 2013;25:305–12 [DOI] [PMC free article] [PubMed] [Google Scholar]
- 8.Liu X, Wu Y, Li M, Hao J, Wang Q, Zeng X. Plasticity of Treg and imbalance of Treg/Th17 cells in patients with systemic sclerosis modified by FK506. Int J Immunopathol Pharmacol 2021;35:2058738421998086. [DOI] [PMC free article] [PubMed] [Google Scholar]
- 9.Capone A, Volpe E. Transcriptional Regulators of T Helper 17 Cell Differentiation in Health and Autoimmune Diseases. Front Immunol 2020;11:348. [DOI] [PMC free article] [PubMed] [Google Scholar]
- 10.Buckner JH, Harrison OJ. Th17 cells: from gut homeostasis to CNS pathogenesis. Trends Immunol 2022 [DOI] [PMC free article] [PubMed] [Google Scholar]
- 11.Dai Y, Jiao H, Teng G, Wang W, Zhang R, Wang Y, et al. Embelin reduces colitis-associated tumorigenesis through limiting IL-6/STAT3 signaling. Mol Cancer Ther 2014;13:1206–16 [DOI] [PubMed] [Google Scholar]
- 12.Lanca T, Silva-Santos B. The split nature of tumor-infiltrating leukocytes: Implications for cancer surveillance and immunotherapy. Oncoimmunology 2012;1:717–25 [DOI] [PMC free article] [PubMed] [Google Scholar]
- 13.Fialova A, Partlova S, Sojka L, Hromadkova H, Brtnicky T, Fucikova J, et al. Dynamics of T-cell infiltration during the course of ovarian cancer: the gradual shift from a Th17 effector cell response to a predominant infiltration by regulatory T-cells. Int J Cancer 2013;132:1070–9 [DOI] [PubMed] [Google Scholar]
- 14.Paulos CM, Wrzesinski C, Kaiser A, Hinrichs CS, Chieppa M, Cassard L, et al. Microbial translocation augments the function of adoptively transferred self/tumor-specific CD8+ T cells via TLR4 signaling. J Clin Invest 2007;117:2197–204 [DOI] [PMC free article] [PubMed] [Google Scholar]
- 15.Benevides L, da Fonseca DM, Donate PB, Tiezzi DG, De Carvalho DD, de Andrade JM, et al. IL17 Promotes Mammary Tumor Progression by Changing the Behavior of Tumor Cells and Eliciting Tumorigenic Neutrophils Recruitment. Cancer Res 2015;75:3788–99 [DOI] [PMC free article] [PubMed] [Google Scholar]
- 16.Coffelt SB, Kersten K, Doornebal CW, Weiden J, Vrijland K, Hau CS, et al. IL-17-producing gammadelta T cells and neutrophils conspire to promote breast cancer metastasis. Nature 2015;522:345–8 [DOI] [PMC free article] [PubMed] [Google Scholar]
- 17.Dawod B, Liu J, Gebremeskel S, Yan C, Sappong A, Johnston B, et al. Myeloid-derived suppressor cell depletion therapy targets IL-17A-expressing mammary carcinomas. Sci Rep 2020;10:13343. [DOI] [PMC free article] [PubMed] [Google Scholar]
- 18.Qian XL, Xu P, Zhang YQ, Song YM, Li YQ, Li WD, et al. Increased number of intratumoral IL-17+ cells, a harbinger of the adverse prognosis of triple-negative breast cancer. Breast Cancer Res Treat 2020;180:311–9 [DOI] [PubMed] [Google Scholar]
- 19.Welte T, Zhang XH. Interleukin-17 Could Promote Breast Cancer Progression at Several Stages of the Disease. Mediators Inflamm 2015;2015:804347. [DOI] [PMC free article] [PubMed] [Google Scholar]
- 20.Martin-Orozco N, Muranski P, Chung Y, Yang XO, Yamazaki T, Lu S, et al. T helper 17 cells promote cytotoxic T cell activation in tumor immunity. Immunity 2009;31:787–98 [DOI] [PMC free article] [PubMed] [Google Scholar]
- 21.Faucheux L, Grandclaudon M, Perrot-Dockes M, Sirven P, Berger F, Hamy AS, et al. A multivariate Th17 metagene for prognostic stratification in T cell non-inflamed triple negative breast cancer. Oncoimmunology 2019;8:e1624130. [DOI] [PMC free article] [PubMed] [Google Scholar]
- 22.Horlock C, Stott B, Dyson PJ, Morishita M, Coombes RC, Savage P, et al. The effects of trastuzumab on the CD4+CD25+FoxP3+ and CD4+IL17A+ T-cell axis in patients with breast cancer. Br J Cancer 2009;100:1061–7 [DOI] [PMC free article] [PubMed] [Google Scholar]
- 23.Eftekhari R, Esmaeili R, Mirzaei R, Bidad K, de Lima S, Ajami M, et al. Study of the tumor microenvironment during breast cancer progression. Cancer Cell Int 2017;17:123. [DOI] [PMC free article] [PubMed] [Google Scholar]
- 24.Chen Y, Chauhan SK, Shao C, Omoto M, Inomata T, Dana R. IFN-gamma-Expressing Th17 Cells Are Required for Development of Severe Ocular Surface Autoimmunity. J Immunol 2017;199:1163–9 [DOI] [PMC free article] [PubMed] [Google Scholar]
- 25.Carballo GB, Honorato JR, de Lopes GPF, Spohr T. A highlight on Sonic hedgehog pathway. Cell Commun Signal 2018;16:11. [DOI] [PMC free article] [PubMed] [Google Scholar]
- 26.Riobo-Del Galdo NA, Lara Montero A, Wertheimer EV. Role of Hedgehog Signaling in Breast Cancer: Pathogenesis and Therapeutics. Cells 2019;8. [DOI] [PMC free article] [PubMed] [Google Scholar]
- 27.Dessaud E, McMahon AP, Briscoe J. Pattern formation in the vertebrate neural tube: a sonic hedgehog morphogen-regulated transcriptional network. Development 2008;135:2489–503 [DOI] [PubMed] [Google Scholar]
- 28.Choudhry Z, Rikani AA, Choudhry AM, Tariq S, Zakaria F, Asghar MW, et al. Sonic hedgehog signalling pathway: a complex network. Ann Neurosci 2014;21:28–31 [DOI] [PMC free article] [PubMed] [Google Scholar]
- 29.Hanna A, Metge BJ, Bailey SK, Chen D, Chandrashekar DS, Varambally S, et al. Inhibition of Hedgehog signaling reprograms the dysfunctional immune microenvironment in breast cancer. Oncoimmunology 2019;8:1548241. [DOI] [PMC free article] [PubMed] [Google Scholar]
- 30.Hinshaw DC, Hanna A, Lama-Sherpa T, Metge B, Kammerud SC, Benavides GA, et al. Hedgehog Signaling Regulates Metabolism and Polarization of Mammary Tumor-Associated Macrophages. Cancer Res 2021;81:5425–37 [DOI] [PMC free article] [PubMed] [Google Scholar]
- 31.Petty AJ, Dai R, Lapalombella R, Baiocchi RA, Benson DM, Li Z, et al. Hedgehog-induced PD-L1 on tumor-associated macrophages is critical for suppression of tumor-infiltrating CD8+ T cell function. JCI Insight 2021;6. [DOI] [PMC free article] [PubMed] [Google Scholar]
- 32.Furmanski AL, Saldana JI, Ono M, Sahni H, Paschalidis N, D’Acquisto F, et al. Tissue-derived hedgehog proteins modulate Th differentiation and disease. J Immunol 2013;190:2641–9 [DOI] [PMC free article] [PubMed] [Google Scholar]
- 33.Lee JJ, Rothenberg ME, Seeley ES, Zimdahl B, Kawano S, Lu WJ, et al. Control of inflammation by stromal Hedgehog pathway activation restrains colitis. Proc Natl Acad Sci U S A 2016;113:E7545–E53 [DOI] [PMC free article] [PubMed] [Google Scholar]
- 34.Butler A, Hoffman P, Smibert P, Papalexi E, Satija R. Integrating single-cell transcriptomic data across different conditions, technologies, and species. Nat Biotechnol 2018;36:411–20 [DOI] [PMC free article] [PubMed] [Google Scholar]
- 35.Ru B, Wong CN, Tong Y, Zhong JY, Zhong SSW, Wu WC, et al. TISIDB: an integrated repository portal for tumor-immune system interactions. Bioinformatics 2019;35:4200–2 [DOI] [PubMed] [Google Scholar]
- 36.Liu X, Sadhukhan S, Sun S, Wagner GR, Hirschey MD, Qi L, et al. High-Resolution Metabolomics with Acyl-CoA Profiling Reveals Widespread Remodeling in Response to Diet. Mol Cell Proteomics 2015;14:1489–500 [DOI] [PMC free article] [PubMed] [Google Scholar]
- 37.Liu X, Ser Z, Locasale JW. Development and quantitative evaluation of a high-resolution metabolomics technology. Anal Chem 2014;86:2175–84 [DOI] [PMC free article] [PubMed] [Google Scholar]
- 38.Hinshaw DC, Swain CA, Chen D, Hanna A, Molina PA, Maynard CL, et al. Hedgehog blockade remodels the gut microbiota and the intestinal effector CD8(+) T cells in a mouse model of mammary carcinoma. Lab Invest 2022 [DOI] [PubMed] [Google Scholar]
- 39.Lama-Sherpa TD, Das S, Hinshaw DC, Kammerud SC, Song PN, Alsheikh HA, et al. Quantitative Longitudinal Imaging Reveals that Inhibiting Hedgehog Activity Alleviates the Hypoxic Tumor Landscape. Mol Cancer Res 2022;20:150–60 [DOI] [PMC free article] [PubMed] [Google Scholar]
- 40.Fridman WH, Pages F, Sautes-Fridman C, Galon J. The immune contexture in human tumours: impact on clinical outcome. Nat Rev Cancer 2012;12:298–306 [DOI] [PubMed] [Google Scholar]
- 41.Kim HJ, Cantor H. CD4 T-cell subsets and tumor immunity: the helpful and the not-so-helpful. Cancer Immunol Res 2014;2:91–8 [DOI] [PubMed] [Google Scholar]
- 42.Chung W, Eum HH, Lee HO, Lee KM, Lee HB, Kim KT, et al. Single-cell RNA-seq enables comprehensive tumour and immune cell profiling in primary breast cancer. Nat Commun 2017;8:15081. [DOI] [PMC free article] [PubMed] [Google Scholar]
- 43.Mahmud SA, Manlove LS, Farrar MA. Interleukin-2 and STAT5 in regulatory T cell development and function. JAKSTAT 2013;2:e23154. [DOI] [PMC free article] [PubMed] [Google Scholar]
- 44.Chaudhry A, Samstein RM, Treuting P, Liang Y, Pils MC, Heinrich JM, et al. Interleukin-10 signaling in regulatory T cells is required for suppression of Th17 cell-mediated inflammation. Immunity 2011;34:566–78 [DOI] [PMC free article] [PubMed] [Google Scholar]
- 45.Do J, Kim D, Kim S, Valentin-Torres A, Dvorina N, Jang E, et al. Treg-specific IL-27Ralpha deletion uncovers a key role for IL-27 in Treg function to control autoimmunity. Proc Natl Acad Sci U S A 2017;114:10190–5 [DOI] [PMC free article] [PubMed] [Google Scholar]
- 46.Verma ND, Hall BM, Plain KM, Robinson CM, Boyd R, Tran GT, et al. Interleukin-12 (IL-12p70) Promotes Induction of Highly Potent Th1-Like CD4(+)CD25(+) T Regulatory Cells That Inhibit Allograft Rejection in Unmodified Recipients. Front Immunol 2014;5:190. [DOI] [PMC free article] [PubMed] [Google Scholar]
- 47.Atwood SX, Sarin KY, Whitson RJ, Li JR, Kim G, Rezaee M, et al. Smoothened variants explain the majority of drug resistance in basal cell carcinoma. Cancer Cell 2015;27:342–53 [DOI] [PMC free article] [PubMed] [Google Scholar]
- 48.Shyer JA, Flavell RA, Bailis W. Metabolic signaling in T cells. Cell Res 2020;30:649–59 [DOI] [PMC free article] [PubMed] [Google Scholar]
- 49.Li X, Zhang Z, Li L, Gong W, Lazenby AJ, Swanson BJ, et al. Myeloid-derived cullin 3 promotes STAT3 phosphorylation by inhibiting OGT expression and protects against intestinal inflammation. J Exp Med 2017;214:1093–109 [DOI] [PMC free article] [PubMed] [Google Scholar]
- 50.Renner ED, Rylaarsdam S, Anover-Sombke S, Rack AL, Reichenbach J, Carey JC, et al. Novel signal transducer and activator of transcription 3 (STAT3) mutations, reduced T(H)17 cell numbers, and variably defective STAT3 phosphorylation in hyper-IgE syndrome. J Allergy Clin Immunol 2008;122:181–7 [DOI] [PMC free article] [PubMed] [Google Scholar]
- 51.Liu B, Salgado OC, Singh S, Hippen KL, Maynard JC, Burlingame AL, et al. The lineage stability and suppressive program of regulatory T cells require protein O-GlcNAcylation. Nat Commun 2019;10:354. [DOI] [PMC free article] [PubMed] [Google Scholar]
- 52.Rahimmanesh I, Totonchi M, Khanahmad H. The challenging nature of primary T lymphocytes for transfection: Effect of protamine sulfate on the transfection efficiency of chemical transfection reagents. Res Pharm Sci 2020;15:437–46 [DOI] [PMC free article] [PubMed] [Google Scholar]
- 53.Tone Y, Furuuchi K, Kojima Y, Tykocinski ML, Greene MI, Tone M. Smad3 and NFAT cooperate to induce Foxp3 expression through its enhancer. Nat Immunol 2008;9:194–202 [DOI] [PubMed] [Google Scholar]
- 54.Yang XP, Ghoreschi K, Steward-Tharp SM, Rodriguez-Canales J, Zhu J, Grainger JR, et al. Opposing regulation of the locus encoding IL-17 through direct, reciprocal actions of STAT3 and STAT5. Nat Immunol 2011;12:247–54 [DOI] [PMC free article] [PubMed] [Google Scholar]
- 55.Zhao M, Tan Y, Peng Q, Huang C, Guo Y, Liang G, et al. IL-6/STAT3 pathway induced deficiency of RFX1 contributes to Th17-dependent autoimmune diseases via epigenetic regulation. Nat Commun 2018;9:583. [DOI] [PMC free article] [PubMed] [Google Scholar]
- 56.Furuyama K, Kondo Y, Shimizu M, Yokosawa M, Segawa S, Iizuka A, et al. RORgammat+Foxp3+ regulatory T cells in the regulation of autoimmune arthritis. Clin Exp Immunol 2022;207:176–87 [DOI] [PMC free article] [PubMed] [Google Scholar]
- 57.Kim BS, Lu H, Ichiyama K, Chen X, Zhang YB, Mistry NA, et al. Generation of RORgammat(+) Antigen-Specific T Regulatory 17 Cells from Foxp3(+) Precursors in Autoimmunity. Cell Rep 2017;21:195–207 [DOI] [PMC free article] [PubMed] [Google Scholar]
- 58.Ankathatti Munegowda M, Deng Y, Mulligan SJ, Xiang J. Th17 and Th17-stimulated CD8(+) T cells play a distinct role in Th17-induced preventive and therapeutic antitumor immunity. Cancer Immunol Immunother 2011;60:1473–84 [DOI] [PMC free article] [PubMed] [Google Scholar]
- 59.Kim S, Lee A, Lim W, Park S, Cho MS, Koo H, et al. Zonal difference and prognostic significance of foxp3 regulatory T cell infiltration in breast cancer. J Breast Cancer 2014;17:8–17 [DOI] [PMC free article] [PubMed] [Google Scholar]
- 60.Merlo A, Casalini P, Carcangiu ML, Malventano C, Triulzi T, Menard S, et al. FOXP3 expression and overall survival in breast cancer. J Clin Oncol 2009;27:1746–52 [DOI] [PubMed] [Google Scholar]
- 61.Miyashita M, Sasano H, Tamaki K, Hirakawa H, Takahashi Y, Nakagawa S, et al. Prognostic significance of tumor-infiltrating CD8+ and FOXP3+ lymphocytes in residual tumors and alterations in these parameters after neoadjuvant chemotherapy in triple-negative breast cancer: a retrospective multicenter study. Breast Cancer Res 2015;17:124. [DOI] [PMC free article] [PubMed] [Google Scholar]
- 62.Takenaka M, Seki N, Toh U, Hattori S, Kawahara A, Yamaguchi T, et al. FOXP3 expression in tumor cells and tumor-infiltrating lymphocytes is associated with breast cancer prognosis. Mol Clin Oncol 2013;1:625–32 [DOI] [PMC free article] [PubMed] [Google Scholar]
- 63.Seyerl M, Kirchberger S, Majdic O, Seipelt J, Jindra C, Schrauf C, et al. Human rhinoviruses induce IL-35-producing Treg via induction of B7-H1 (CD274) and sialoadhesin (CD169) on DC. Eur J Immunol 2010;40:321–9 [DOI] [PubMed] [Google Scholar]
- 64.Papaioannou E, Yanez DC, Ross S, Lau CI, Solanki A, Chawda MM, et al. Sonic Hedgehog signaling limits atopic dermatitis via Gli2-driven immune regulation. J Clin Invest 2019;129:3153–70 [DOI] [PMC free article] [PubMed] [Google Scholar]
- 65.Holla S, Stephen-Victor E, Prakhar P, Sharma M, Saha C, Udupa V, et al. Mycobacteria-responsive sonic hedgehog signaling mediates programmed death-ligand 1- and prostaglandin E2-induced regulatory T cell expansion. Sci Rep 2016;6:24193. [DOI] [PMC free article] [PubMed] [Google Scholar]
- 66.Marques HS, de Brito BB, da Silva FAF, Santos MLC, de Souza JCB, Correia TML, et al. Relationship between Th17 immune response and cancer. World J Clin Oncol 2021;12:845–67 [DOI] [PMC free article] [PubMed] [Google Scholar]
- 67.Barsheshet Y, Wildbaum G, Levy E, Vitenshtein A, Akinseye C, Griggs J, et al. CCR8(+)FOXp3(+) Treg cells as master drivers of immune regulation. Proc Natl Acad Sci U S A 2017;114:6086–91 [DOI] [PMC free article] [PubMed] [Google Scholar]
- 68.Pallandre JR, Brillard E, Crehange G, Radlovic A, Remy-Martin JP, Saas P, et al. Role of STAT3 in CD4+CD25+FOXP3+ regulatory lymphocyte generation: implications in graft-versus-host disease and antitumor immunity. J Immunol 2007;179:7593–604 [DOI] [PubMed] [Google Scholar]
- 69.Hou C, Zhong Y, Wang Z, Ming Z, Huang G, Ouyang L, et al. STAT3-mediated epigenetic silencing of FOXP3 in LADA T cells is regulated through HDAC5 and DNMT1. Clin Immunol 2018;191:116–25 [DOI] [PubMed] [Google Scholar]
- 70.Laurence A, Amarnath S, Mariotti J, Kim YC, Foley J, Eckhaus M, et al. STAT3 transcription factor promotes instability of nTreg cells and limits generation of iTreg cells during acute murine graft-versus-host disease. Immunity 2012;37:209–22 [DOI] [PMC free article] [PubMed] [Google Scholar]
- 71.Xu L, Kitani A, Stuelten C, McGrady G, Fuss I, Strober W. Positive and negative transcriptional regulation of the Foxp3 gene is mediated by access and binding of the Smad3 protein to enhancer I. Immunity 2010;33:313–25 [DOI] [PMC free article] [PubMed] [Google Scholar]
- 72.Yang XO, Nurieva R, Martinez GJ, Kang HS, Chung Y, Pappu BP, et al. Molecular antagonism and plasticity of regulatory and inflammatory T cell programs. Immunity 2008;29:44–56 [DOI] [PMC free article] [PubMed] [Google Scholar]
- 73.Ma K, Yang L, Shen R, Kong B, Chen W, Liang J, et al. Th17 cells regulate the production of CXCL1 in breast cancer. Int Immunopharmacol 2018;56:320–9 [DOI] [PubMed] [Google Scholar]
- 74.Nunez S, Saez JJ, Fernandez D, Flores-Santibanez F, Alvarez K, Tejon G, et al. T helper type 17 cells contribute to anti-tumour immunity and promote the recruitment of T helper type 1 cells to the tumour. Immunology 2013;139:61–71 [DOI] [PMC free article] [PubMed] [Google Scholar]
- 75.Asadzadeh Z, Mohammadi H, Safarzadeh E, Hemmatzadeh M, Mahdian-Shakib A, Jadidi-Niaragh F, et al. The paradox of Th17 cell functions in tumor immunity. Cell Immunol 2017;322:15–25 [DOI] [PubMed] [Google Scholar]
- 76.Duan MC, Huang Y, Zhong XN, Tang HJ. Th17 cell enhances CD8 T-cell cytotoxicity via IL-21 production in emphysema mice. Mediators Inflamm 2012;2012:898053. [DOI] [PMC free article] [PubMed] [Google Scholar]
- 77.Feng T, Qin H, Wang L, Benveniste EN, Elson CO, Cong Y. Th17 cells induce colitis and promote Th1 cell responses through IL-17 induction of innate IL-12 and IL-23 production. J Immunol 2011;186:6313–8 [DOI] [PMC free article] [PubMed] [Google Scholar]
- 78.Guery L, Hugues S. Th17 Cell Plasticity and Functions in Cancer Immunity. Biomed Res Int 2015;2015:314620. [DOI] [PMC free article] [PubMed] [Google Scholar]
Associated Data
This section collects any data citations, data availability statements, or supplementary materials included in this article.
Supplementary Materials
Data Availability Statement
The data generated and utilized in this study are available upon request. Publicly available data can be accessed using the following accession numbers: GSE58377 for bulk tumor RNA-seq from Vismodegib-resistant and -sensitive patients and GSE75688 for scRNA-seq data from breast tumor patient biopsies.