Abstract
Background
The use of mapping to guide peripheral lung navigation (PLN) represents an advance in the management of peripheral pulmonary lesions (PPL). Software has been developed to virtually reconstruct CT images into 3-D airway maps and generate navigation pathways to target PPL. Despite this there remain significant gaps in understanding the factors associated with navigation success and failure including the cartographic performance characteristics of these software algorithms. This study was designed to determine whether differences exist when comparing PLN mapping platforms.
Methods
An observational direct comparison was performed to evaluate navigation planning software packages for the lung. The primary endpoint was distance from the terminal end of the virtual navigation pathway to the target PPL. Secondary end points included distal virtual and segmental airway generations built to the target and/or in each lung.
Results
Twenty-five patient chest CT scans with forty-one PPL were evaluated. Virtual airway and navigation pathway maps were generated for each scan/nodule across all platforms. Virtual navigation pathway comparison revealed differences in the distance from the terminal end of the navigation pathway to the target PPL (RB 9.4 mm vs. TTI-EMN 14.2 mm vs. CB-EMN 17.2 mm, P = 0.0005) and in the generation of complete distal airway maps.
Conclusion
Comparing PLN planning software revealed significant differences in the generation of virtual airway and navigation maps. These differences may play an unrecognized role in the accurate PLN and biopsy of PPL. Further prospective trials are needed to quantify the effect of the differences reported.
Keywords: interventional bronchoscopy, lung nodule, navigation bronchoscopy, robotic bronchoscopy, airway roadmap
Introduction
The word cartography is an anglicized adaption of the 19th century French cartographie, itself derived from the Middle Latin carta or “map”. Map making has been an essential practice by humans since at least the 14th millennium BC(1) and represents the ability to communicate complex patterns that allow for travel between two or more points.
The application of cartographic principles to the human body is the basis for the study of anatomy. From the first known anatomic maps developed in Egypt(2) to the detailed drawings by Galen, da Vinci and Vesalius(3), man’s understanding of the human body has been through the graphic depiction of anatomic maps. These concepts are the basis on which computed tomography (CT) and magnetic resonance imaging are used in the diagnosis and treatment of disease, culminating in the rapidly growing application of pre- or peri-procedural medical imaging.
Procedural medical imaging has evolved from single-plane fluoroscopy to three-dimensional (3-D) computer-based mapping platforms. These approaches were initially developed to aid in complex neurologic and cardiac interventions including catheterization, ablation, and tumor resection.(4, 5) Since then procedural medical imaging has expanded to include the field of pulmonology and peripheral lung navigation (PLN).
The use of bronchoscopy to localize and sample peripheral pulmonary lesions (PPL) has seen a similar evolution from single plane fluoroscopy to virtual 3-D navigated guidance.(6–8) Though these advances have improved the ability to traverse the lung to a distant point of interest, the field lacks pre-clinical data evaluating what factors are important to PLN success. This fact is paramount as the field continues to strive for improved clinical outcomes yet lacks data evaluating the effects of individual factors (alone or in combination) on PLN diagnostic success. A previously unstudied factor that may affect PLN success in arriving at a preplanned destination are the virtual airway and navigation pathway maps generated by proprietary platform software packages. Each lung navigation platform is paired with a software package that utilizes distinct computational algorithms to segment chosen target destinations and airways from thinly cut chest CT images. These segmentation algorithms generate virtual airway maps (and in some cases pulmonary and mediastinal vasculature) designed to mirror the patient’s anatomy on chest CT. After selection of a target destination, the planning software produces a 3-D rendering of the lung’s airways and a best-fit airway path to the target destination.
Although multiple systems exist, there have been no known assessments of mapping accuracy to assess the ability to recognize airways, generate virtual airway maps and construct an accurate pathway to target destinations. Understanding the differences in software mapping technology of the lung is crucial to defining limitations that currently exist in the bronchoscopic success of peripheral nodule sampling. In this study we conducted a comparative study of PLN planning software packages in an effort to assess whether differences exist in the ability of three clinically available bronchoscopic software mapping packages to successfully render virtual airway maps and endobronchial pathways for PLN.
Material and Methods
Study Design
We performed an observational comparative study to assess three peripheral navigation planning systems – catheter based electromagnetic navigation (CB-EMN, superDimension™ Navigation System v7.1, Medtronic, Minneapolis, MN), tip-tracked instrument based electromagnetic navigation (TTI-EMN, SPiN Planning™ v4.2.0, Veran Medical Technologies, St. Louis, MO) and robotic shape sensing navigation (RB, Ion PlanPoint™ v1.1.0, Intuitive Surgical, Sunnyvale, CA) – using de-identified CT scans with known lung lesions from procedures that were performed previously using one of the three software systems studied (Figure 1). The CT scans used in this study to generate virtual airway maps were each previously formatted for one of the three navigation planning systems; ten scans each formatted for CB-EMN and TTI-EMN and five scans for RB. The planning station graphic generating algorithm for each of the three platforms was run for all 25 scans without user interference. After creation of a virtual airway map on each system, the identical target lesion(s) were selected and independently verified by two of more study investigators to ensure that the targets were consistently chosen across the three platforms. Following this each platform developed a best fit pathway from the trachea to the terminal recognized airway closest to the target. Pathways/airway maps generated were not edited after creation by the software platform. Data from the CT scan, virtual airway map, target lesion and pathway from trachea to target were subsequently collected and analyzed.
Figure 1.
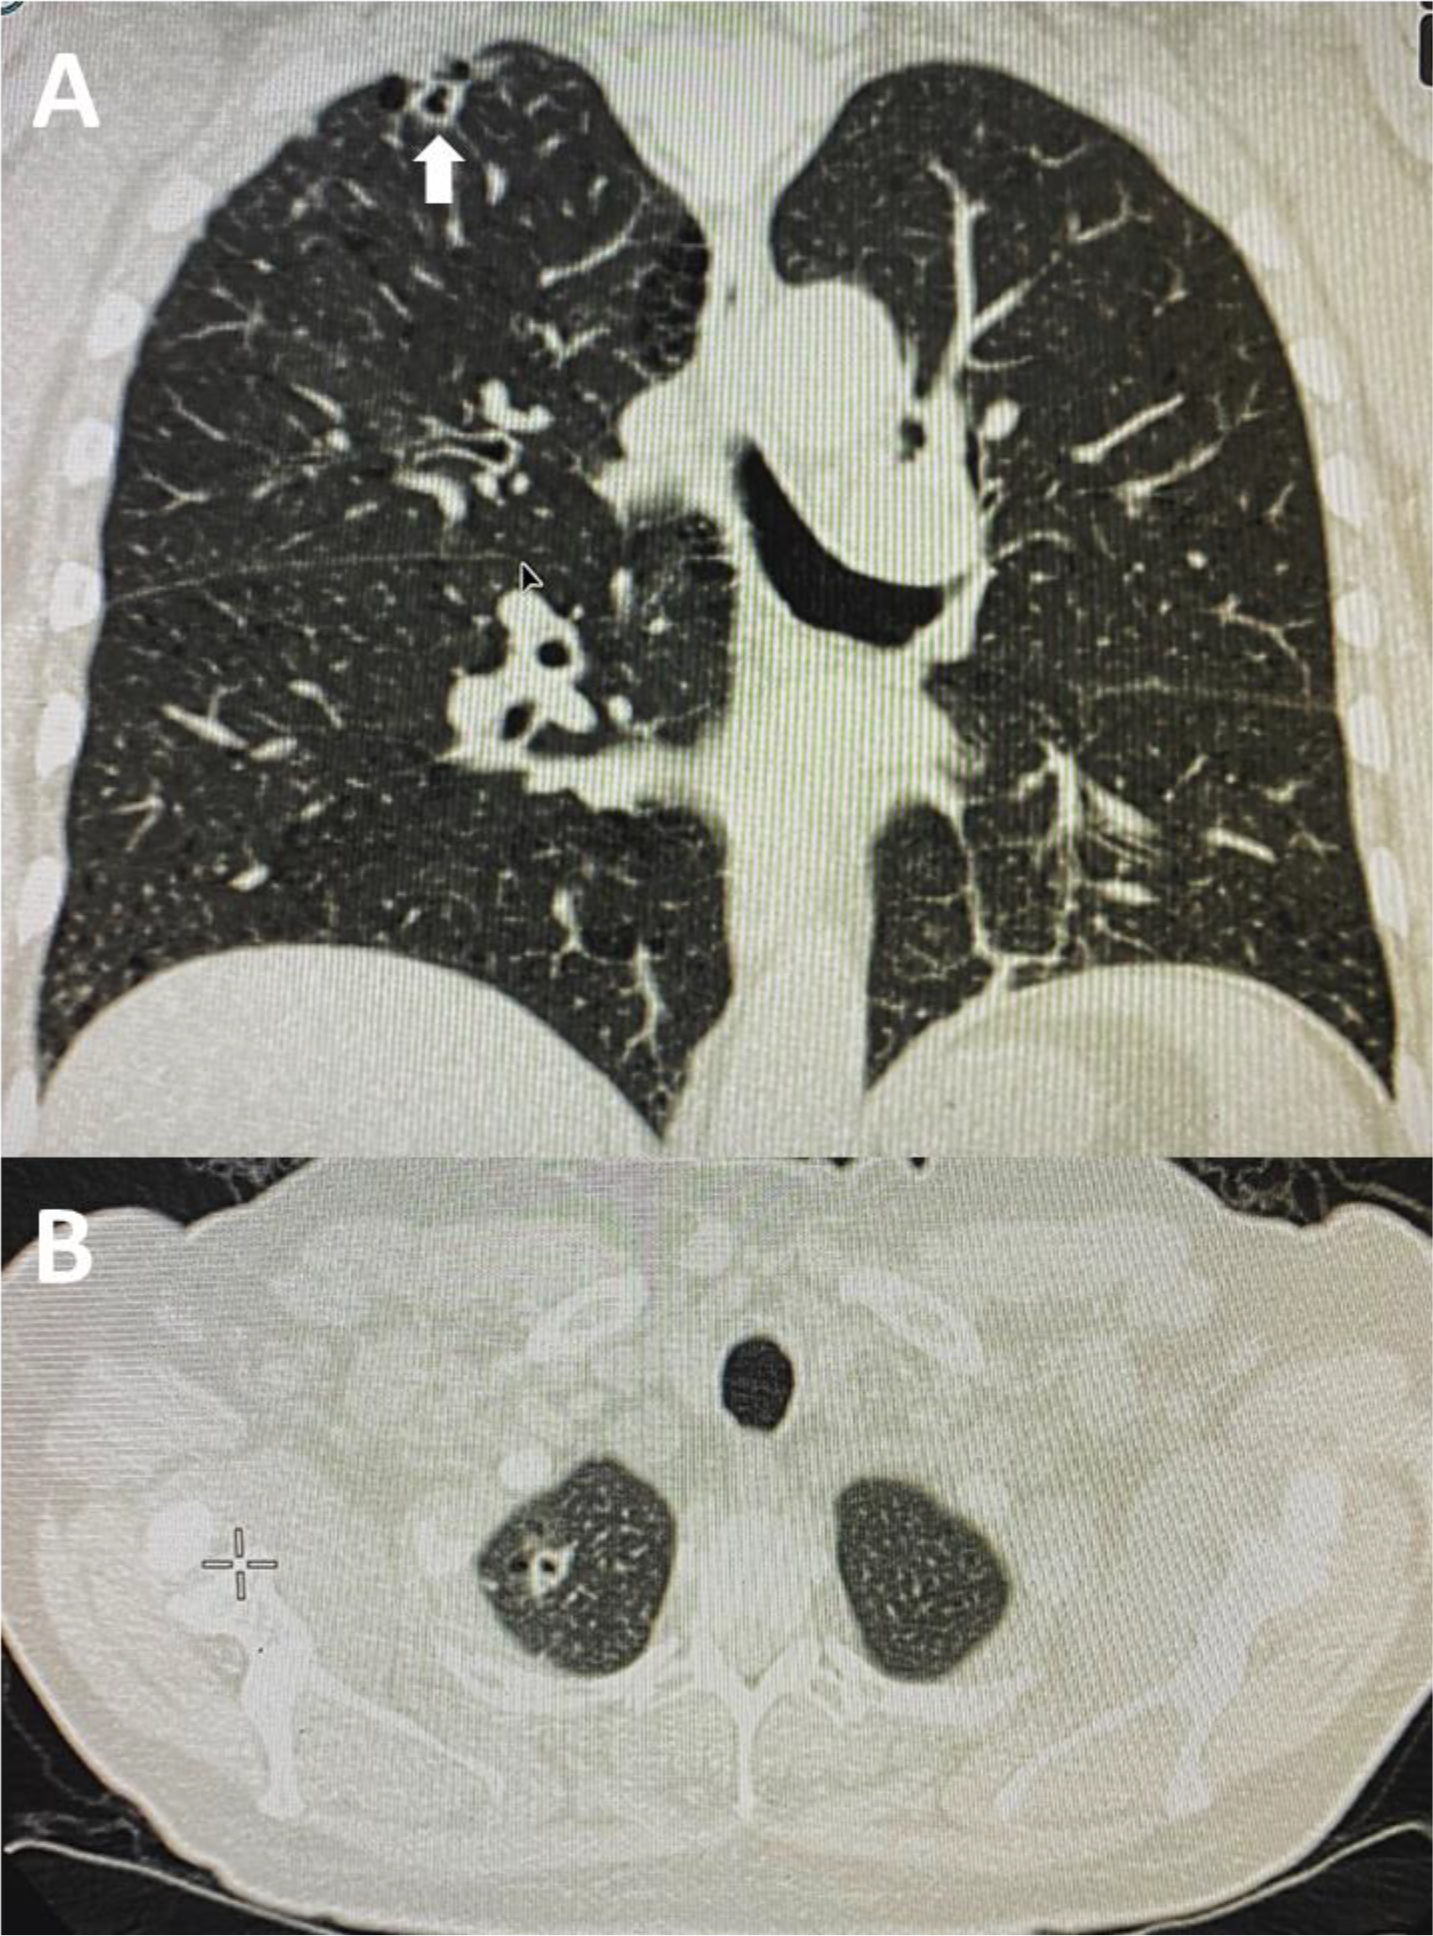
Representative chest CT imaging use in the comparison of peripheral navigation planning software packages. A) Coronal chest CT image note RUL cavitary lung nodule (large arrow). B) Axial chest CT image.
Study End Points
The primary endpoint for this study was distance from the end of the software generated navigation pathway to the target PPL as a surrogate to determine the software ability to generate a precise and navigable map to the target lesion. Secondary endpoints include the total number of distal virtual airways generated in each lung and the number of segmental airway generations built to the target PPL. These secondary endpoints were chosen as they represent the extent to which each software package is able to render complete 3-D cartographic representations of the lung from patient CT scanning.
Terminal end of pathway to target PPL measurement
After selection of the target PPL(s) and generation of a guidance pathway by the planning station (Figure 2), measurements from the terminal point of the platform generated pathway to the target lesion were performed. Measurement of the target to terminal pathway distance for CB-EMN was acquired by building a pathway from the target PPL to the terminal point of the generated pathway. The TTI-EMN and RB planning stations both report this distance as part of their standard workflow.
Figure 2.
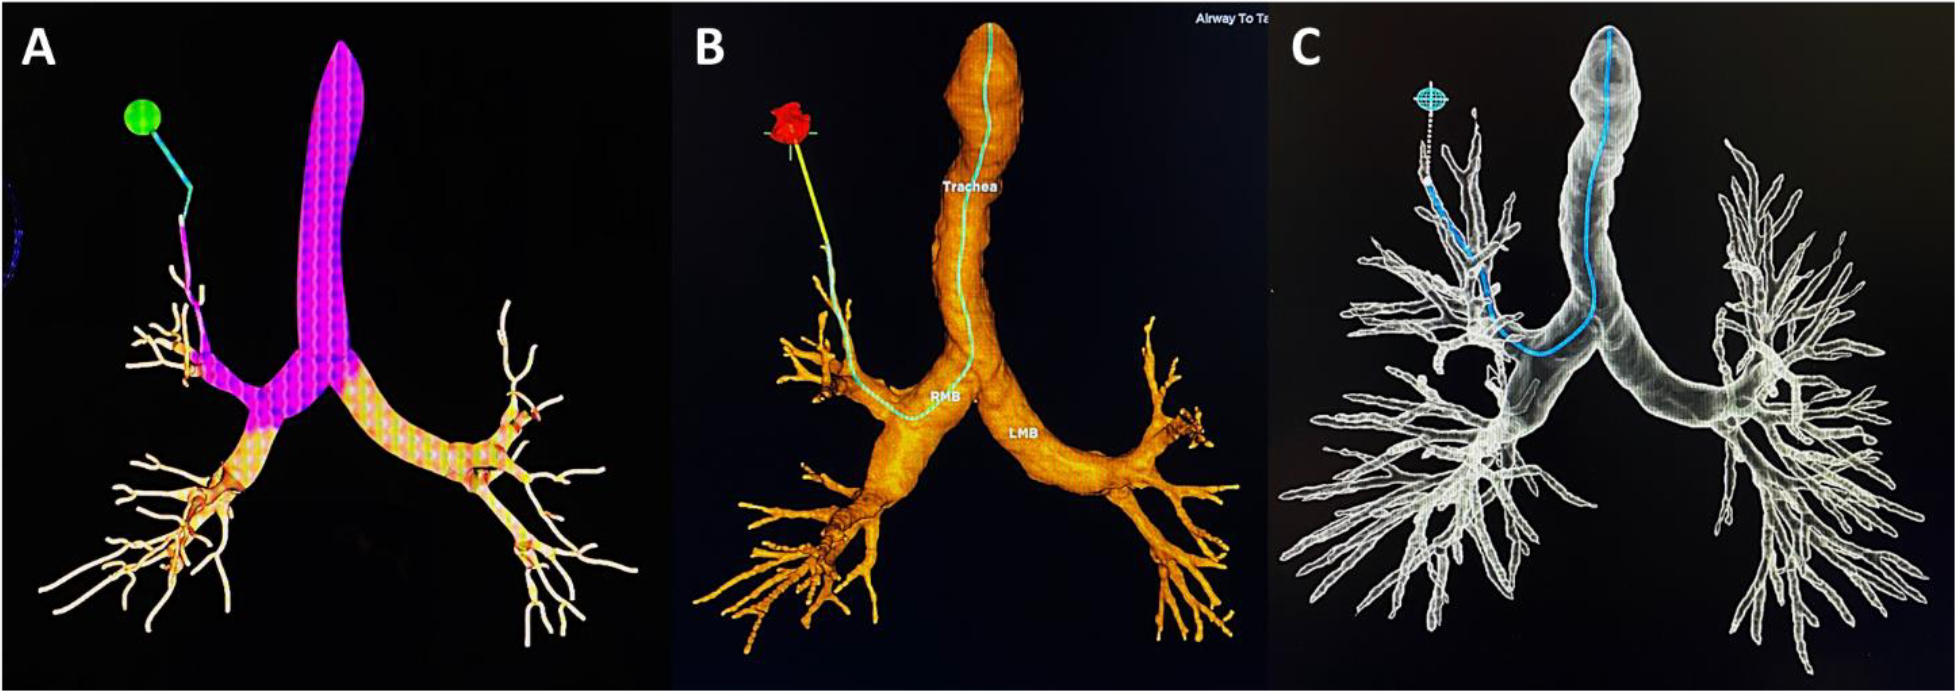
Virtual reconstruction of the representative chest CT (Figure 1) with airway map and navigation pathway to the RUL target. A) CB-EMN. B) TTI-EMN. C) RB.
Measurement of distal virtual airway generation
Upon completion of platform virtual airway generation (Figure 3), two of the investigators independently performed a manual count of the number of terminal airways in each lobe in a systematic fashion – RUL, RML, RLL, LUL and LLL. In cases with discrepancies, the terminal airways on the CT were assessed together to achieve consensus. This process was repeated to assess the number of segmental airway generations built toward the target PPL from the first segmental airway to the most distal.
Figure 3.
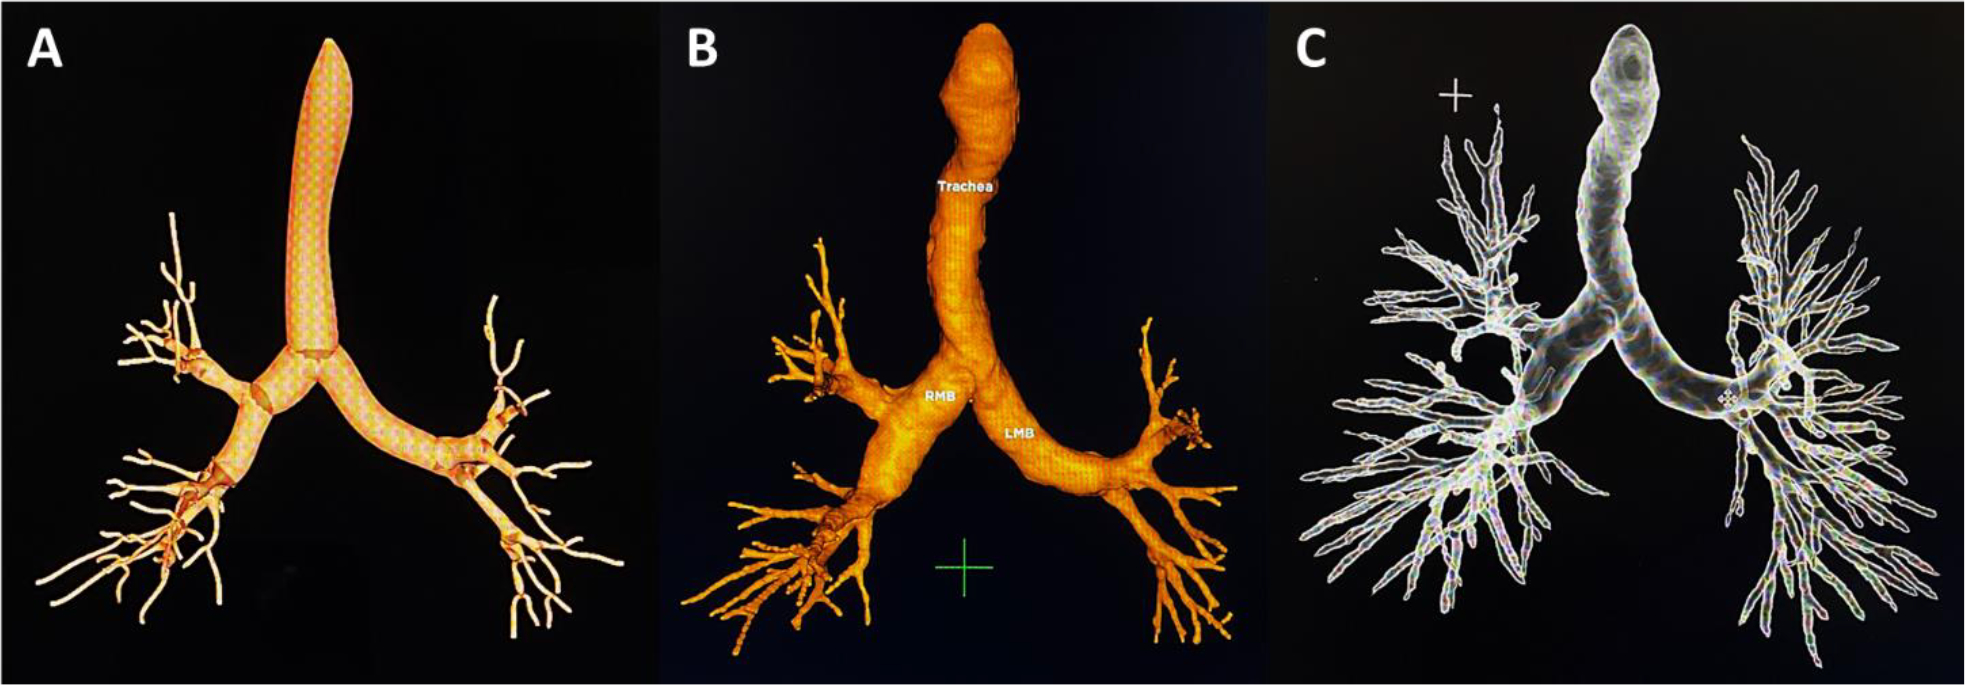
Virtual airway map reconstruction of the representative chest CT (Figure 1). A) CB-EMN. B) TTI-EMN. C) RB.
Statistical Analysis
Descriptive statistics including means (± SD), medians (IQR25–75), proportions and raw numbers were used as appropriate when reporting nodule size, number of distal airways/segments generated, distance from terminal end of the navigation pathway to target PPL, number of carinas and lobar airways generated. ANOVA sample size calculation for evaluation of the primary endpoint showed a minimum sample size of 37 nodules measured per group (Number of groups = 3, Power 0.8, Effect size 0.3 (30% difference in means), alpha = 0.05). Comparison of platform mean values including distance from target lesion to computer generated airway and number of terminal airways generated in each lung was performed with a mixed-effects model ANOVA using a restricted maximum likelihood method controlling for each type of scan followed by post-hoc Tukey’s multiple comparison testing. This approach was used to account for the potential lack of independence between comparison groups and/or correlated within-subject data caused by two identifiable factors: 1) a single CT was used to generate each platform plan (RB, TTI-EMN and CB-EMN) per measure and 2) the contribution of five CT scans containing four PPLs each (Twenty of forty-one nodules evaluated). All analyses were performed with GraphPad Prism 9.0.2 (GraphPad Software, Inc.).
Results
A virtual airway map was successfully created for the 25 chest CT scans (RB, 5; TTI-EMN and CB-EMN, 10 each) by each of the three platforms, resulting in a total of 75 virtual airway maps for analysis. The chest CT scans included a total of 41 PPLs (range 1 to 4 per scan). Median CT slice thickness, number and overlap were 1.0 mm (IQR25–75,0.75–1mm), 526 (IQR25–75,441–682) and 33% (IQR25–75,20–40%) respectively. The target PPL(s) were distributed across all lobes with an upper lobe predominance (58.5%). Mean PPL size was 21.8 ± 10.9 mm. A majority of PPL (73%) were located in the outer one-third of the lung and 58.5% had a CT bronchus sign.
Primary End Point – Distance from terminal end of navigation pathway to target PPL
A comparison of each planning system’s ability to generate navigation pathways and virtual airway trees is shown in Table 1. The three platforms successfully generated navigation pathway plans for all 41 target PPL(s) permitting measurement of the primary endpoint (Table 1). The distance from the terminal end of the navigation pathway to the target PPL differed across the three platforms (ANOVA p<0.01; Table 1). Post-hoc individual comparisons revealed that RB provided the shortest distance between the terminal end of the navigation pathway and the target PPL when compared with either of the other two software packages. The TTI-EMN software package was also found to be superior to CB-EMN with significantly shorter distances seen from the terminal end of the virtual navigation pathway to the target PPL (Figure 4).
Table 1.
Navigation Platform Planning Comparison
| Navigation Platform (No. Scans Used) | RB (n=5) | TTI-EMN (n=10) | CB-EMN (n=10) | P |
|---|---|---|---|---|
| Navigation pathway end to target, mean ± SD, mm | 9.4 ± 5.7 | 14.2 ± 12.9 | 17.2 ± 15.6 | <0.01 |
| Segmental airway generations built to target, mean ± SD | 3.3 ± 1.1 | 3.1 ± 1.1 | 3.0 ± 1.0 | 0.19 |
| Airway path taken (lobe) | ||||
| RUL | 10 | 10 | 10 | |
| RML | 2 | 2 | 2 | |
| RLL | 8 | 8 | 8 | |
| LUL | 14 | 14 | 14 | |
| LLL | 7 | 7 | 7 | |
| Airway path taken (segment) | ||||
| Anterior | 12 | 11 | 12 | |
| Apical | 8 | 9 | 8 | |
| Posterior | 5 | 4 | 6 | |
| Medial | 2 | 3 | 2 | |
| Lateral | 5 | 5 | 5 | |
| Lingula | 3 | 3 | 3 | |
| Apical-posterior | 2 | 2 | 1 | |
| Superior | 4 | 4 | 4 | |
| Virtual airway reconstruction from chest CT (No., VR/CT) | ||||
| Trachea | 25/25 | 24/25 | 24/25 | |
| Right lung | ||||
| Mainstem | 25/25 | 25/25 | 25/25 | |
| RULa | 68/68 | 68/68 | 65/68 | |
| RMLa | 48/50 | 45/50 | 44/50 | |
| RLLa | 116/118 | 118/118 | 110/118 | |
| Left lung | ||||
| Mainstem | 25/25 | 25/25 | 24/25 | |
| LULa | 54/54 | 52/54 | 53/54 | |
| Lingulaa | 49/49 | 50/49 | 48/49 | |
| LLLa | 95/99 | 96/99 | 97/99 | |
| VR distal airway generation (No. airways counted, mean±SD) | ||||
| Right lung | 71.2 ± 18.5 | 43.3 ± 23.0 | 37.6 ± 21.1 | <0.01 |
| Left lung | 67.7 ± 23.1 | 46.9 ± 20.5 | 42.3 ± 22.3 | <0.01 |
P values represent ANOVA comparisons.
Counts segments generated.
ANOVA indicates analysis of variance; CB-EMN, catheter based electromagnetic navigation; CT, computed tomography; LLL, left lower lobe; LUL, left upper lobe; RB, robotic bronchoscopy; RLL, right lower lobe; RML, right middle lobe; RUL, right upper lobe; TTI-EMN, tip-tracked electromagnetic navigation; VR, virtual reconstruction.
Figure 4.
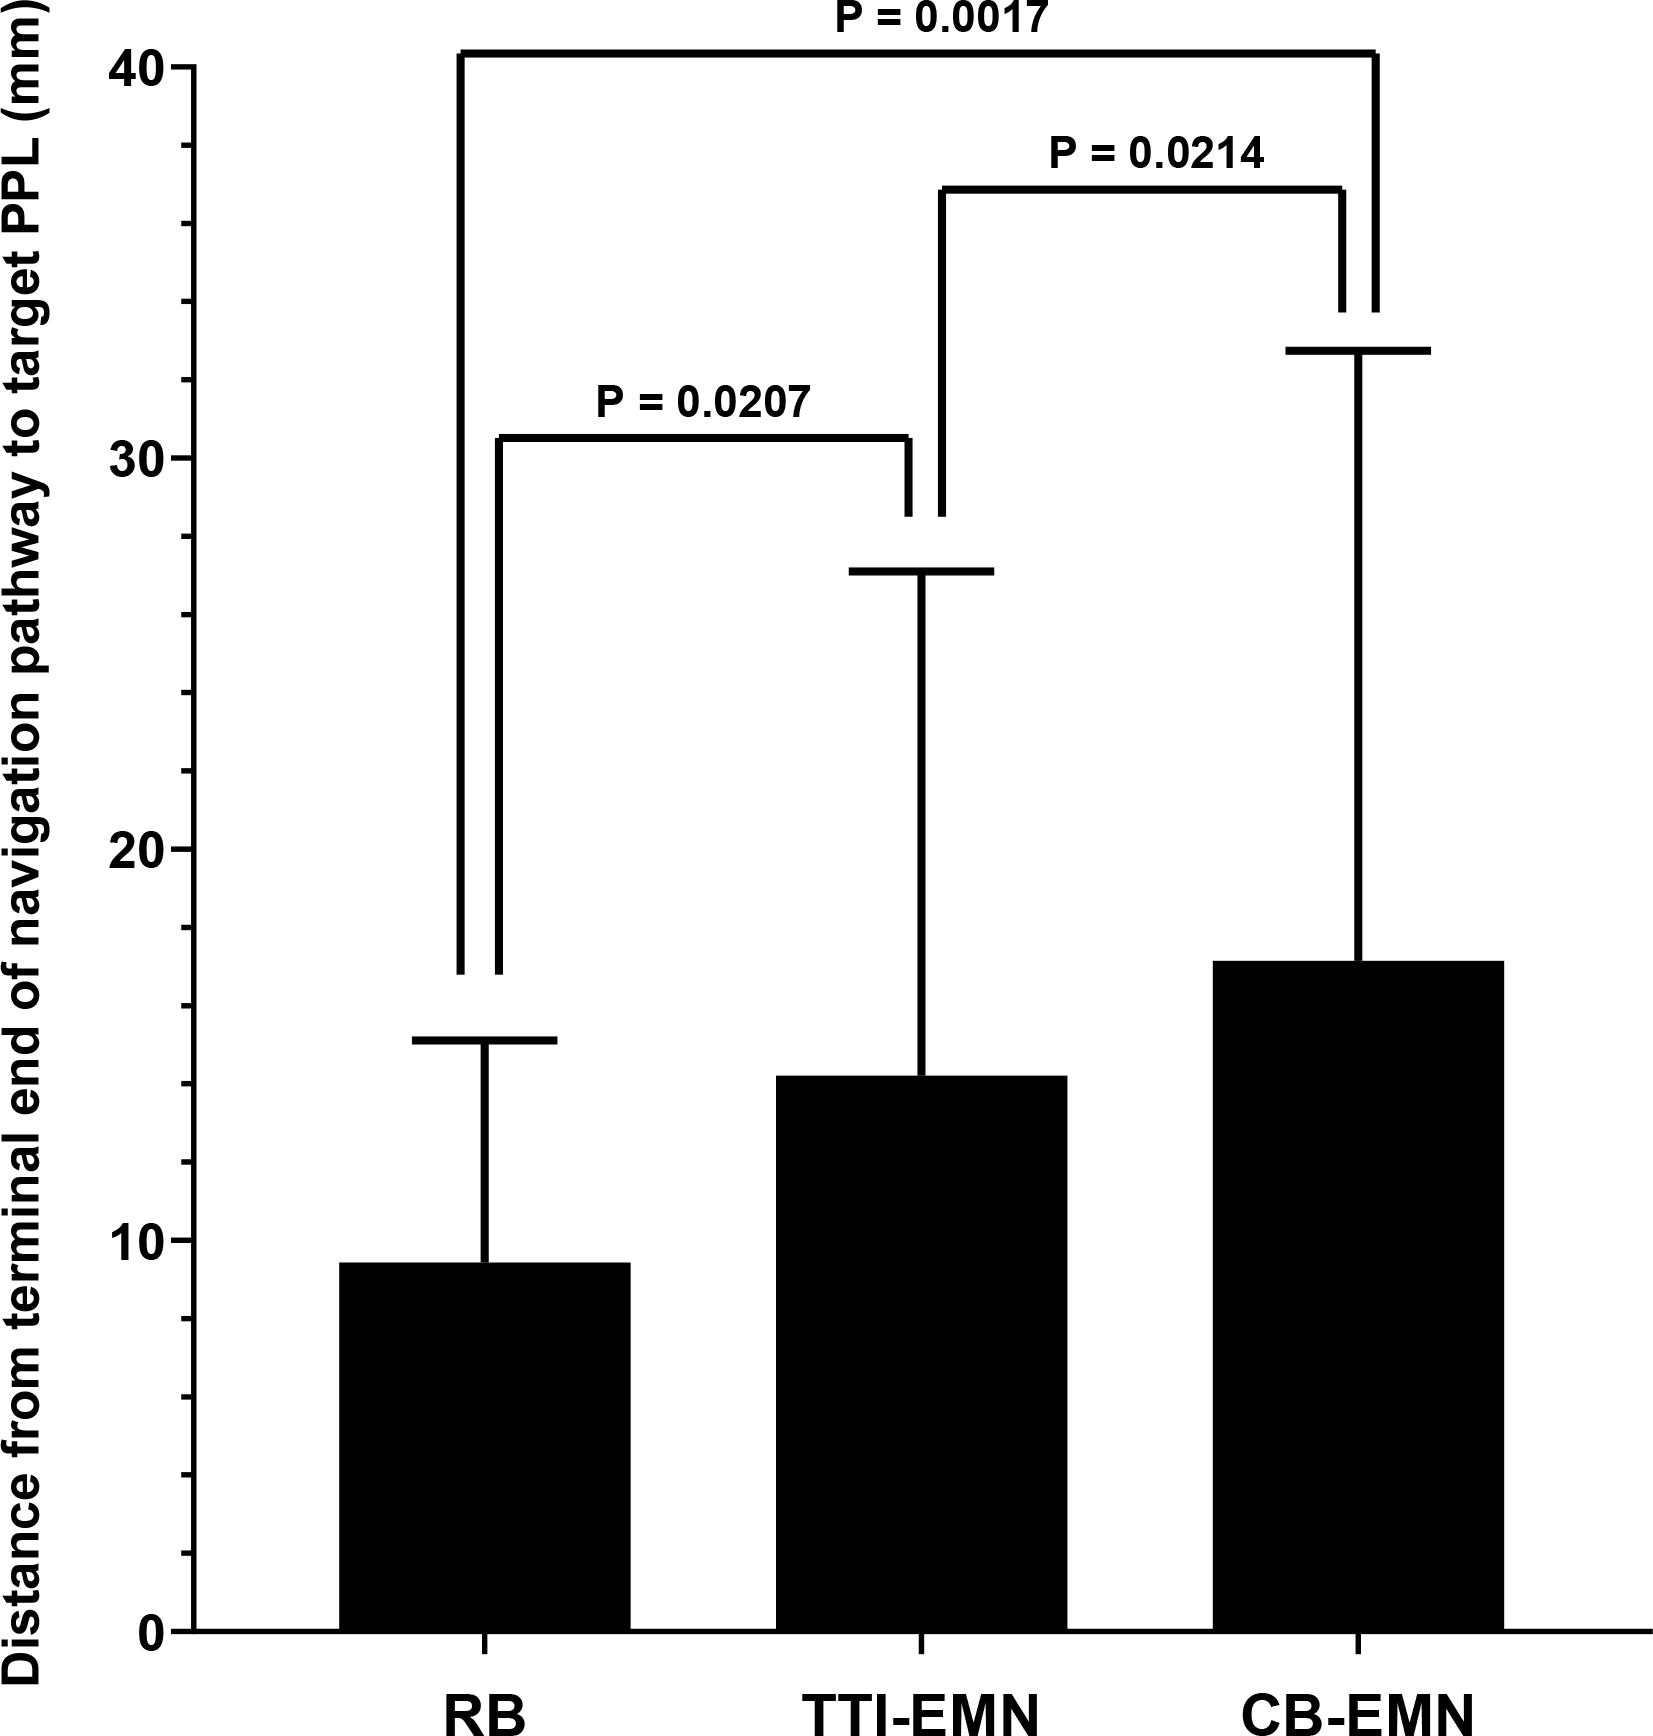
Comparison of the mean distance from the terminal end of the virtually reconstructed navigation pathway to the target peripheral pulmonary lesion. Whiskers represent standard deviation. Mixed-effects ANOVA P = 0.0005. Post-ANOVA Tukey’s comparison P values are shown.
Secondary Endpoints
Large/lobar airway generation as well as lobar and segmental airway identification as the best fit pathways were similar across software packages. The mean number of terminal airway branches generated was significantly different in both the right and left lung across all packages (Table 1). Distal airway generation by RB was superior to the other two software packages and TTI-EMN was superior to CB-EMN (Figure 5). Analysis of each software platform’s ability to build segmental airway generations from the first segmental airway to the target PPL showed no significant difference (Table 1).
Figure 5.
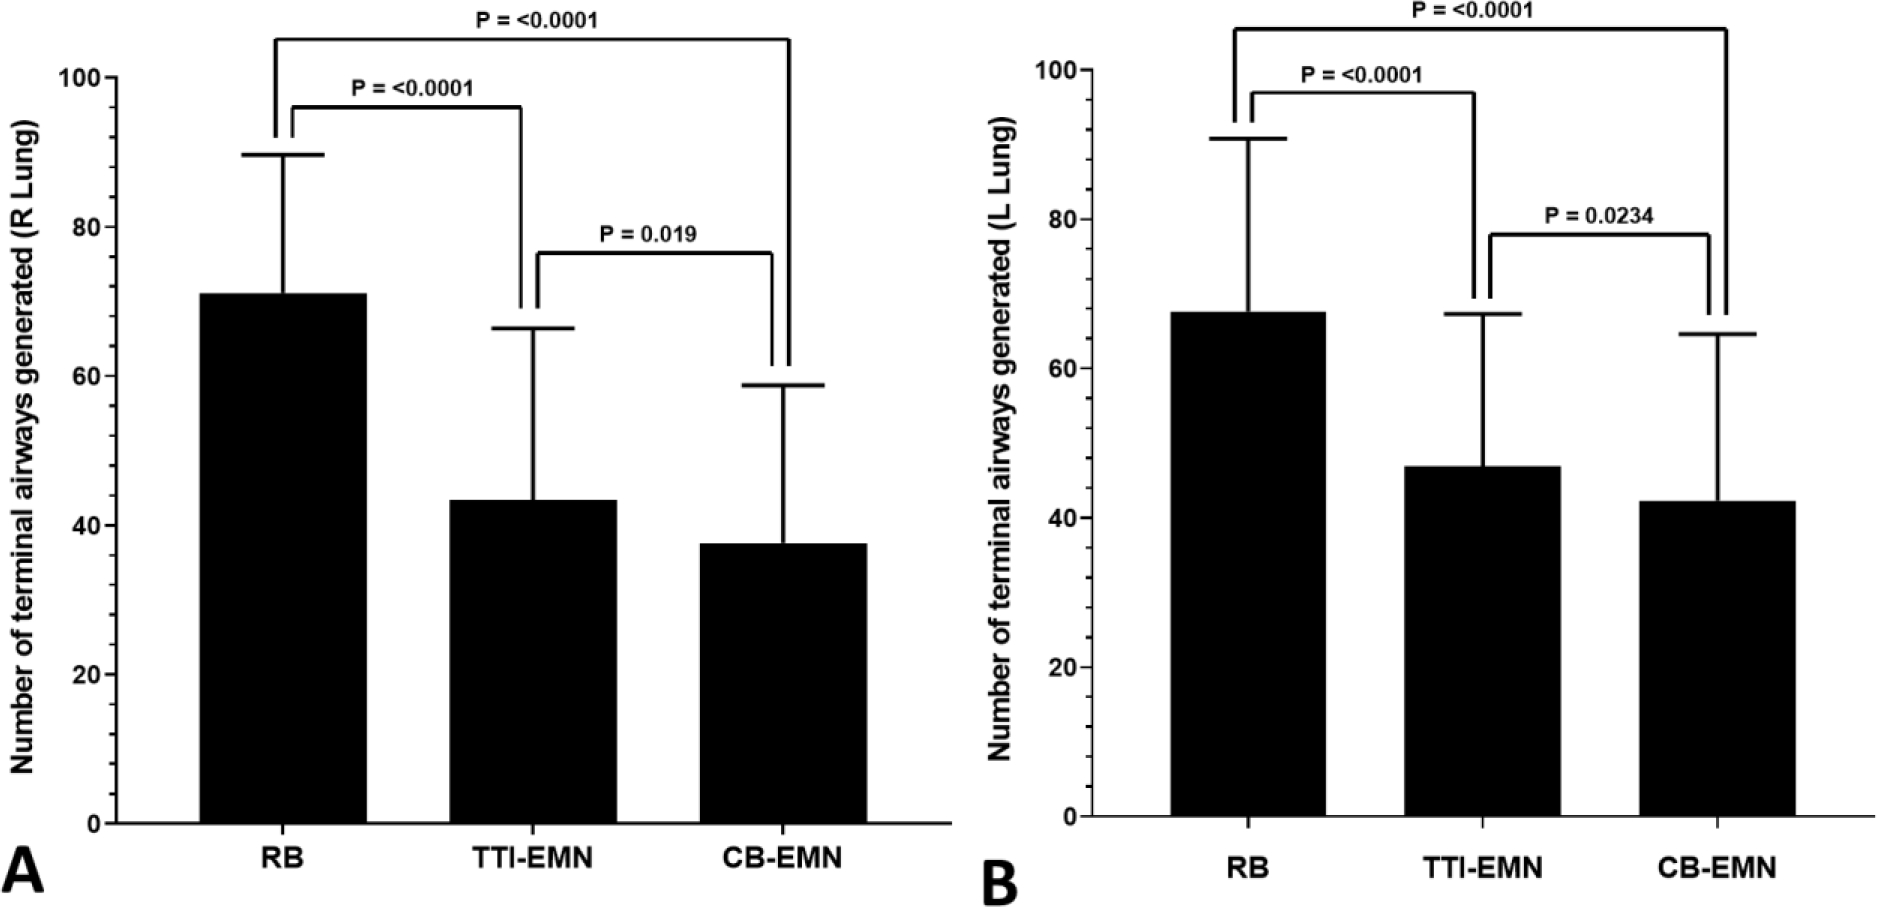
Comparison of mean terminal airway generation by lung. Whiskers represent standard deviation. A) Right lung, Mixed-effects ANOVA P < 0.0001. B) Left lung, Mixed-effects ANOVA P < 0.0001. Post-ANOVA Tukey’s comparison P values are shown.
Discussion
The ability to accurately depict a series of landmarks to form a map is a long-standing challenge. From Napoleon’s defeat at Waterloo to the stranding of drivers in remote locations, cartographical errors have been shown to have significant consequences.(9–11) These lessons hold true for medical procedures that incorporate mapping technology into their performance. In addition to the basic challenges of anatomic cartography, peri-procedural medical imaging now routinely translates static multiplanar CT images into 3-D rendering of specific organ systems. The challenges associated with this leap are myriad and fail to account for organ motion or patient changes during the procedure.
Despite technologic advances in guided peripheral lung navigation, the ability to reliably and reproducibly navigate to and successfully biopsy a target remains a challenge. Previous studies evaluating the performance of peripheral bronchoscopy have reported provider and patient/target factors including but not limited to lesion size, location within the lung, center procedural volumes, respiratory cycle nodule motion, presence of a bronchus sign and the development of peri-procedural atelectasis.(12–17) These prior analyses have been limited by retrospective and/or single center designs leading to inconsistent findings resulting in a continued uncertainty in identifying which factors are critical for successful bronchoscopic diagnosis of peripheral lesions. This is particularly important as lung cancer screening, an aging population, a move toward minimally invasive diagnostics and the potential for the application of peripheral ablative technologies has led to an increase in the number of PPLs being referred for peripheral navigation bronchoscopy.
Previous publications have suggested that factors associated with PLN diagnostic success include lesion size, location, bronchus sign status (present/absent), CT-to-body divergence, nodule motion and/or peri-procedural anatomical changes (atelectasis etc.).(14, 15, 18) While these factors, as well as others not yet defined, may play a role in PLN, their individual and/or combined effect on procedural success/failure has not been adequately quantified. This highlights the need to develop pre-clinical data that breaks PLN into its constitutive components and evaluates their individual effects.
The ATLAS study was designed to evaluate 3-D map and navigation pathway generation in isolation from diagnostic success to assess whether heterogeneity exists between commercially available systems. Previous data reported during the development of PLN reported endobronchial path selection to be a significant source of error during peripheral bronchoscopy.(19, 20) These data also suggest that the use of virtual based path-planning software was associated with improvement in bronchoscopist pathway selection when compared to 2-D CT scan section analysis.(20) While these publications suggest that the use of virtual airway maps aid in PLN, they do not address their role in biopsy success or the proximity to the target with which their use allows the user to navigate to. In addition, data regarding the relationship between virtual map completeness and navigation pathway generation also remain unstudied. With the proliferation of PLN platforms, their associated planning algorithms and a lack of comparative data there remains a lack of insight into the completeness of the virtual map creation and navigation pathways generation by each PLN planning.
This study is the first to directly compare three peripheral navigation software planning stations in their ability to generate virtual airway trees and map a navigation pathway to a target destination. When comparing peripheral navigation planning, the RB software generated navigation pathways whose distal terminal end was significantly closer to the target lesion than either of the other two planning software packages. In addition to measuring the terminal navigation pathway to target relationship, assessment of virtual airway tree generation completeness by evaluating the total number of distal virtual airways generated in each lung showed the RB planning software to be superior to the other two. Additional interesting findings included inconsistencies in platform recognition of segmental airways seen on CT during virtual reconstruction and segmental airways navigation path. Reconstruction inconsistencies generally involved the generation of fewer virtual airways than existed on CT. Airway navigation pathway map differences were found across all segments except the lateral RML, lingula and superior segment of the lower lobes bilaterally.
These data suggest that significant differences exist when comparing virtual airway generation software packages and that these differences may provide the user with a superior map by which to perform navigation bronchoscopy. Improvements in creation of virtual airway trees and navigation pathways may be one of the previously unevaluated factors that played a role in the success or failure of peripheral lung navigation. Although these data are encouraging, additional study is required to confirm and/or quantify the effect of improved airway and navigation pathway mapping on PPL localization and biopsy.
Our study does have limitations, chiefly that a lack of comparative procedure outcomes limits the ability to fully extrapolate the peri-procedural effects of the differences seen. Another potential limitation is the use of CT scans formatted for one system used by another to generate airway maps (ex. TTI-EMN formatted scan for CB-EMN and RB planning). This could theoretically bias the airway map generated in favor of the planning software it was formatted for however no format was dominant (see methods) and RB, which data suggests generated a more complete map, only accounted for five of the twenty-five scans evaluated (20%) as it relates to terminal airway generation. When considering the effect of CT scan formatting on distal terminal navigation pathway to target distance, the five RB scans used did account for 49% (20/41) of the pathways generated. This factor introduced the potential for a lack of independent measures between comparison groups and/or correlated within-subject data and was addressed by applying a mixed-effects model ANOVA using a restricted maximum likelihood method which controlled for each type of scan by making internal and external comparisons for each measure evaluated. An additional limitation is the assumption that the virtual maps generated are an accurate representation of the CT scan used. While this is generally true, some deviations in the central airways where clear comparisons were easy to make between CT and virtual images were noted which gives rise to the question of whether all of the airways seen/counted were in fact true representations of distal airways seen on CT and whether the differences seen represent real improvements in map generation accuracy. That said, the divergent airway generation noted was in all cases an under-representation of the airways seen on CT which suggests that errors in distal airway mapping may be weighted toward under reporting. Another potential limitation in this study is the assumption that “closeness” to the PPL, or a smaller distance from the terminal end of the navigation pathway to the PPL is directly correlated with success in biopsy. This measure was used as the primary endpoint as distance to the PPL has historically been measured and reported, particularly as it relates to PLN success and should be a focus of subsequent study. In addition, the study does not utilize the user’s ability to grow or extend the pathways generated. While this approach may limit the generalizability of study’s findings, we specifically avoided taking this approach as it holds the potential to introduce human/user error to a mapping process already relying on software algorithms whose error rates have not been reported. Finally, the counts of segments built to the target lesion and number of distal airway branches generated in each lung is potentially subject to count error. We attempted to mitigate any error in count by utilizing independent members of the study team and when a count discrepancy was found a combined effort was undertaken resulting in a consensus decision.
One additional point that should be considered is that of distal tip angulation at the point of biopsy. The RB platform reports this measure to the user while the other two systems do not. It has been hypothesized that angulation of the distal tip is potentially as or more important than distance to the target lesion (within the throw length of the needle to be deployed) as closer throw distances may result in more acute angles of exit that are not possible with the current needle designs. In addition, the angle of biopsy may predicate the point from which the RB system recommends biopsy. Given that both EMN platforms do not report or account for this issue of angulation during planning we were unable to use this as a measure within the study however it remains unclear if this feature over or under-represents the RB system’s ability to generate pathways proximate to the target and warrants further study in vivo.
This is the first study to perform a direct head-to-head comparison of three peripheral bronchoscopy mapping software packages. The results presented in this study demonstrate the existence of significant differences in virtual airway and navigation pathway map generation. Despite the compelling results presented here, prospective comparative trials evaluating the effect of the findings presented in this manuscript as well as TBNA needle throw distance, biopsy tool angulation/placement, adjunct peri-operative imaging and their effect on PLN diagnostic yield are needed.
Funding:
This study was funded by the Association of Interventional Pulmonary Program Directors.
Abbreviations
- PPL
Peripheral Pulmonary Lesion
- PLN
Peripheral Lung Navigation
- r-EBUS
Radial Endobronchial Ultrasound
- EMN
Electromagnetic Navigation
- CB-EMN
Catheter Based Electromagnetic Navigation
- TTI-EMN
Tip-tracked Electromagnetic Navigation
- RB
Robotic Bronchoscopy
- SD
Standard Deviation
Footnotes
Disclosures: JA: Research, educational grants, and consulting fees from Intuitive, Veran Medical, SuperDimension and Boston Scientific. LY: Research, educational grants, and consulting fees from Intuitive, Olympus, SuperDimension, Veran Medical, Inspire Medical Consulting, Boston Scientific. MW: Research, educational grants, and consulting fees from Olympus, Intuitive, Pulmonx, Lung Therapeutics, Boston Scientific, Cook Medical, Nuvaira and Veracyte, HL: Research, educational grants, and consulting fees from Intuitive, Veran Medical, Olympus, Inspire Medical Consulting, Veracyte and SuperDimension. AC: Research, educational grants, and consulting fees from Olympus, Auris, Boston Scientific and Johnson and Johnson. DY: none, DM: Research, educational grants, and consulting fees from Intuitive Surgical. FM: Research grants from Medtronic; consulting fees from Medtronic and Intuitive. AV: Research grants from Johnson and Johnson, MagArray, Inc., and Broncus Medical; consulting fees from Johnson and Johnson.
References
- 1.Utrilla P, Mazo C, Sopena MC, et al. A palaeolithic map from 13,660 calBP: engraved stone blocks from the Late Magdalenian in Abauntz Cave (Navarra, Spain). J Hum Evol. 2009;57(2):99–111. doi: 10.1016/j.jhevol.2009.05.005. [DOI] [PubMed] [Google Scholar]
- 2.Loukas M, Hanna M, Alsaiegh N, et al. Clinical anatomy as practiced by ancient Egyptians. Clin Anat. 2011;24(4):409–15. doi: 10.1002/ca.21155. [DOI] [PubMed] [Google Scholar]
- 3.Galen Pasipoularides A., father of systematic medicine. An essay on the evolution of modern medicine and cardiology. International journal of cardiology. 2014;172(1):47–58. doi: 10.1016/j.ijcard.2013.12.166. [DOI] [PubMed] [Google Scholar]
- 4.Platonov P, Xia Y, Yuan S, et al. Non-fluoroscopic catheter-based mapping systems in cardiac electrophysiology--from approved clinical indications to novel research usage. The international journal of medical robotics + computer assisted surgery : MRCAS. 2006;2(1):21–7. doi: 10.1002/rcs.65. [DOI] [PubMed] [Google Scholar]
- 5.Schulz C, Waldeck S, Mauer UM. Intraoperative image guidance in neurosurgery: development, current indications, and future trends. Radiol Res Pract. 2012;2012:197364. doi: 10.1155/2012/197364. [DOI] [PMC free article] [PubMed] [Google Scholar]
- 6.Rivera MP, Mehta AC, American College of Chest P. Initial diagnosis of lung cancer: ACCP evidence-based clinical practice guidelines (2nd edition). Chest. 2007;132(3 Suppl):131S–48S. doi: 10.1378/chest.07-1357. [DOI] [PubMed] [Google Scholar]
- 7.Gildea TR, Mazzone PJ, Karnak D, et al. Electromagnetic navigation diagnostic bronchoscopy: a prospective study. American journal of respiratory and critical care medicine. 2006;174(9):982–9. doi: 10.1164/rccm.200603-344OC. [DOI] [PMC free article] [PubMed] [Google Scholar]
- 8.Eberhardt R, Anantham D, Herth F, et al. Electromagnetic navigation diagnostic bronchoscopy in peripheral lung lesions. Chest. 2007;131(6):1800–5. doi: 10.1378/chest.06-3016. [DOI] [PubMed] [Google Scholar]
- 9.Chazan D Map error hastened Napoleon’s Waterloo defeat. The Telegraph. 2014. [Google Scholar]
- 10.Jacquez GM. A research agenda: does geocoding positional error matter in health GIS studies? Spat Spatiotemporal Epidemiol. 2012;3(1):7–16. doi: 10.1016/j.sste.2012.02.002. [DOI] [PMC free article] [PubMed] [Google Scholar]
- 11.Friedman M 21st Century War: Google Maps Error Leads to Nicaraguan Invasion. Time Magazine. 2010. [Google Scholar]
- 12.Bach PB, Cramer LD, Schrag D, et al. The influence of hospital volume on survival after resection for lung cancer. The New England journal of medicine. 2001;345(3):181–8. doi: 10.1056/NEJM200107193450306. [DOI] [PubMed] [Google Scholar]
- 13.Smith CB, Wolf A, Mhango G, et al. Impact of Surgeon Volume on Outcomes of Older Stage I Lung Cancer Patients Treated via Video-assisted Thoracoscopic Surgery. Seminars in thoracic and cardiovascular surgery. 2017;29(2):223–30. doi: 10.1053/j.semtcvs.2017.01.013. [DOI] [PubMed] [Google Scholar]
- 14.Gex G, Pralong JA, Combescure C, et al. Diagnostic yield and safety of electromagnetic navigation bronchoscopy for lung nodules: a systematic review and meta-analysis. Respiration; international review of thoracic diseases. 2014;87(2):165–76. doi: 10.1159/000355710. [DOI] [PubMed] [Google Scholar]
- 15.Ali MS, Sethi J, Taneja A, et al. Computed Tomography Bronchus Sign and the Diagnostic Yield of Guided Bronchoscopy for Peripheral Pulmonary Lesions. A Systematic Review and Meta-Analysis. Annals of the American Thoracic Society. 2018;15(8):978–87. doi: 10.1513/AnnalsATS.201711-856OC. [DOI] [PubMed] [Google Scholar]
- 16.Chen A, Pastis N, Furukawa B, et al. The effect of respiratory motion on pulmonary nodule location during electromagnetic navigation bronchoscopy. Chest. 2015;147(5):1275–81. doi: 10.1378/chest.14-1425. [DOI] [PubMed] [Google Scholar]
- 17.Pritchett MA, Schampaert S. Tipping Point: Cone Beam CT With Augmented Fluoroscopy for the Biopsy and Treatment of Peripheral Nodules. Journal of bronchology & interventional pulmonology. 2019;26(1):e13–e5. doi: 10.1097/LBR.0000000000000561. [DOI] [PubMed] [Google Scholar]
- 18.Jensen KW, Hsia DW, Seijo LM, et al. Multicenter experience with electromagnetic navigation bronchoscopy for the diagnosis of pulmonary nodules. Journal of bronchology & interventional pulmonology. 2012;19(3):195–9. doi: 10.1097/LBR.0b013e3182616ece. [DOI] [PubMed] [Google Scholar]
- 19.Graham MW, Gibbs JD, Higgins WE. Computer-based route-definition system for peripheral bronchoscopy. J Digit Imaging. 2012;25(2):307–17. doi: 10.1007/s10278-011-9433-7. [DOI] [PMC free article] [PubMed] [Google Scholar]
- 20.Dolina MY, Cornish DC, Merritt SA, et al. Interbronchoscopist variability in endobronchial path selection: a simulation study. Chest. 2008;133(4):897–905. doi: 10.1378/chest.07-2540. [DOI] [PubMed] [Google Scholar]


