Significance
Policymakers and academics alike tend to focus on the share of Americans who do not have health insurance. Yet, many insured Americans are at risk of losing their coverage. We estimate that although only 12.5% of under-65 Americans were uninsured at any given point in time, twice as many—one in four—were uninsured at some point over a 2-y period. Moreover, the risk of an insured individual losing coverage barely declined after the passage of the landmark 2010 Affordable Care Act. These observations point to the much broader impact of the lack of universal health insurance coverage and indicate that coverage uncertainty—in addition to lack of insurance—should be an important object of attention.
Keywords: health insurance, uncertainty, universal coverage, United States
Abstract
Health insurance coverage in the United States is highly uncertain. In the post-Affordable Care Act (ACA), pre-COVID United States, we estimate that while 12.5% of individuals under 65 are uninsured at a point in time, twice as many—one in four—are uninsured at some point over a 2-y period. Moreover, the risk of losing insurance remained virtually unchanged with the introduction of the landmark ACA. Risk of insurance loss is particularly high for those with health insurance through Medicaid or private exchanges; they have a 20% chance of losing coverage at some point over a 2-y period, compared to 8.5% for those with employer-provided coverage. Those who lose insurance can experience prolonged periods without coverage; about half are still uninsured 6 mo later, and almost one-quarter are uninsured for the subsequent 2 y. These facts suggest that research and policy attention should focus not only on the “headline number” of the share of the population uninsured at a point in time, but also on the stability and certainty (or lack thereof) of being insured.
The United States is the only high-income country without universal coverage. This has prompted considerable policy and academic attention on the share of people in the United States who are uninsured, the costs and benefits of providing them with insurance, and the relative merits of various potential policies that might cover the uninsured.
In this paper, we focus on another, inevitable consequence of the lack of universal coverage, which has received considerably less attention: the risk that the currently insured may become uninsured. We use data from the Medical Expenditure Panel Survey that covers the time period after the landmark Affordable Care Act (ACA) and before the COVID-19 pandemic—from 2014 to 2019—as well as the period 2007 to 2013 prior to the ACA. We focus on individuals under 65. We estimate that although only 12.5% were uninsured in any given month in the post-ACA period, twice as many—one in four—were uninsured at some point over a 2-y period. Moreover, although the risk of being uninsured in any given month fell substantially after the ACA—from 20 to 12.5%—the risk of an insured individual losing coverage barely declined. These results underscore how policies that increase the share of people with insurance at a point in time do not necessarily increase the stability and certainty associated with having insurance.
In the post-ACA period, we also document that the risk of insurance loss is particularly pronounced among those with health insurance through Medicaid or the health insurance exchanges, two forms of coverage that were greatly increased by the ACA. Those with Medicaid or insurance through the exchanges have about a 20% chance of losing coverage at some point over a 2-y period, compared to 8.5% for those with employer-provided coverage. Moreover, for those who lose insurance coverage, the subsequent period without insurance can be prolonged. About half of those who lose coverage remain uninsured for at least 6 mo, and almost one-quarter remain uninsured for at least 2 y.
Perversely, we find that US health insurance coverage—whose very purpose is to provide a measure of certainty in an uncertain world—is itself highly uncertain. The risk of losing insurance reduces its value for risk-averse individuals. It also creates the potential for suboptimal medical choices as individuals may suboptimally shift the timing of their medical treatments to align with when they have insurance coverage. They may also seek treatment under the mistaken impression that they have coverage, or forego treatment under the mistaken impression that they do not. Our findings suggest that these issues should receive more attention both from academic research and public policy.
The rest of the paper proceeds as follows. Section 1 describes the data, Section 2 presents the results, and Section 3 concludes with a discussion of some implications and directions for further work.
1. Data
We focus on the under-65 population, as everyone aged 65 and older is covered by Medicare. This makes the elderly the only group (in the United States) who does not face the risk of losing their insurance coverage. Supplementary Information provides more detail on our analysis samples and variable construction.
Our primary analysis uses the Medical Expenditure Panel Survey (MEPS), a nationally representative annual survey conducted by the Agency for Healthcare Research and Quality at the Department of Health and Human Services. The survey is structured around overlapping cohorts. Each year, a new cohort is surveyed over five rounds of interviews, which are roughly equally spaced over a period of two calendar years, thus creating a 1-y overlap with the next cohort. With these two cohorts, the MEPS interviews approximately 15,000 households annually. The data are drawn primarily from interviews with household respondents who provide information on behalf of all household members.
Our analysis draws on twelve consecutive MEPS cohorts, from the 2007 to 2008 cohort through the 2018 to 2019 cohort. We focus primarily on what we refer to as the “post-ACA” sample, which includes five MEPS cohorts, starting with the 2014 to 2015 cohort and extending through the 2018 to 2019 cohort; we deliberately stop the analysis in 2019 to avoid any potential impacts of COVID-19. We also compare results with a “pre-ACA” sample, which includes six cohorts (the 2007 to 2008 cohort through the 2012 to 2013 cohort).*
For each cohort, we restrict the sample to individuals who respond to all the five survey waves, who are at least 2 y old and less than 65 y old by the end of the second survey year, and who have nonmissing information on insurance in every survey wave. The resultant post-ACA sample consists of 59,784 unique individuals.
Our key variable of interest is an individual’s insurance coverage. This is reported on a monthly basis, based on interview answers which ask the respondents about health insurance coverage each month over the reference period, which is typically the previous 4 to 5 mo. The data also contain information on the source of insurance coverage—such as Medicaid, employer provided, or private exchange—as well as additional demographics including race, ethnicity, education, and medical history.†
Our post-ACA analysis sample is roughly evenly split between individuals under 18, 18 to 30, 31 to 50, and 50 to 64. Fifty-eight percent of the individuals in the sample are White, 20% are Hispanic, 13% are Black, and 6% are Asian or Pacific Islanders.‡ For the sample that is 18 and over, about 35% have a college degree or higher, and about 53% have a high school degree or GED as their highest degree completed. About one-quarter of the sample reports a prior diagnosis of high blood pressure, diabetes, coronary heart disease, stroke, or heart attack (with high blood pressure being, by far, the most common condition).§
Of those who report being insured in the first survey month, about two-thirds have private health insurance provided by an employer or union, about one-fifth have Medicaid, and about 3% have insurance through the ACA private exchanges. The remaining few had insurance through other forms of public coverage, such as Medicare coverage for the disabled.¶ All of these individuals face the risk of insurance loss.
To complement and crossvalidate our primary analysis in the MEPS, we also use data from the Survey of Income and Program Participation (SIPP). The SIPP is a multiyear panel survey of the civilian noninstitutionalized population, conducted by the US Census Bureau. The SIPP has undergone several revisions in its history; the most recent design is overlapping 4-y panels that begin each year and have an annual interview frequency. Our SIPP analysis relies on the cohort that covers 2017 to 2020,# although we use only its first 3 y (2017 to 2019), prior to COVID-19. After making similar sample restrictions to those we made for the MEPS data, our sample consists of 14,876 unique individuals. The demographic characteristics of the sample are similar to those in the MEPS. The primary advantage of the SIPP is that it allows us to extend the time frame over which we analyze insurance uncertainty from 2 y to 3 y. However, the change in its structure from quarterly interviews to annual interviews starting in 2014 makes it difficult to use it to compare changes in insurance uncertainty before and after the implementation of the ACA in 2014; the annual interviews also raise concerns about recall bias in monthly insurance coverage over the course of the previous year (1).
2. Results
2.1. Insurance Churn.
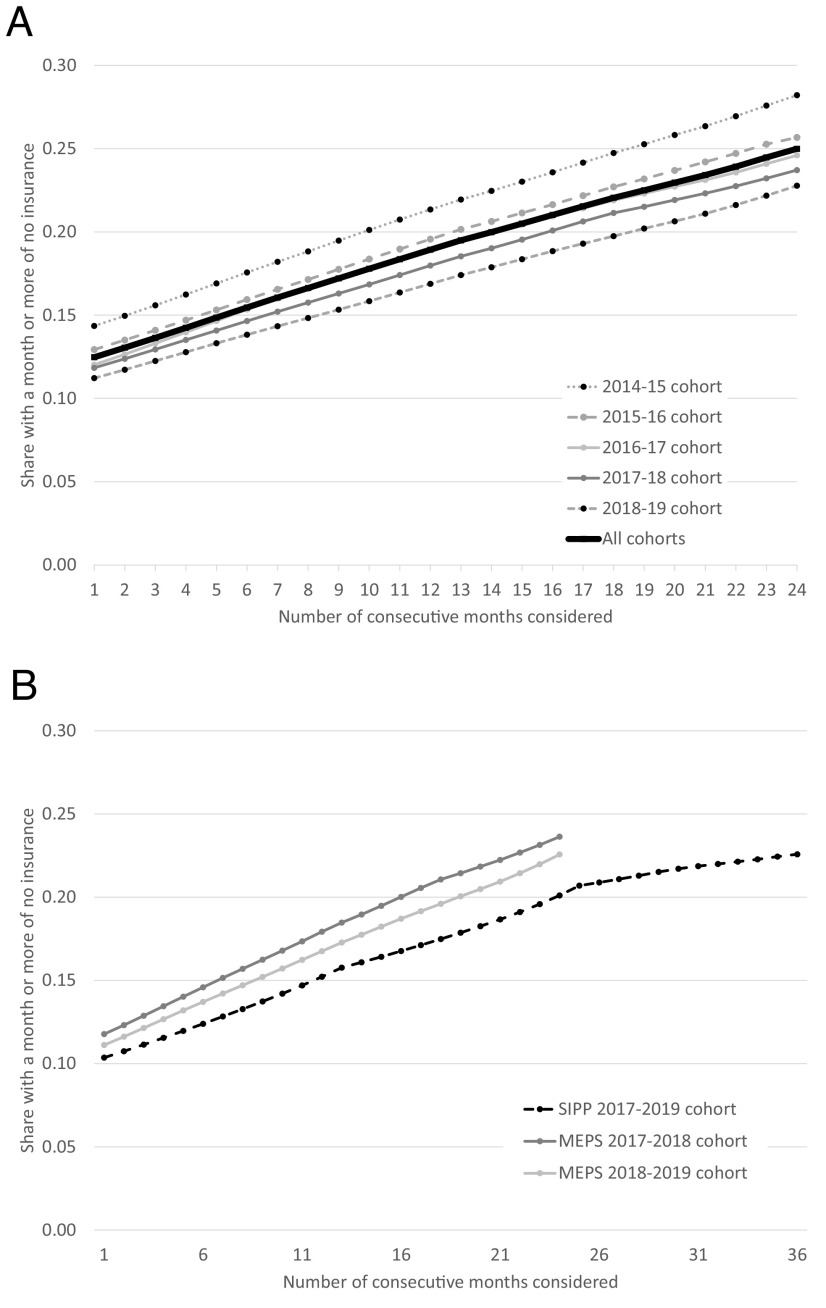
The top panel of Fig. 1 illustrates the importance of considering the dynamics of insurance coverage, rather than treating insurance—or the lack thereof—as a static condition. For each of the five post-ACA MEPS cohorts, we graph the share of the population who experiences a period without insurance over different measurement periods, from 1 mo to 24 mo. Because individuals gain, lose, and regain insurance, the time period over which we look at the lack of insurance substantially impacts its measurement. For example, in the latest cohort (2018 to 2019), 11.2% are uninsured in any given month, 16.9% are uninsured at some point over a 1-y period, and 22.8% are uninsured at some point over a 2-y period. On average, across the cohorts, we estimate that 12.5% are uninsured in any given month, but 18.9% are uninsured at some point over a 1-y period, and 25% are uninsured at some point over a 2-y period. Another way to capture the dynamic nature of insurance coverage is to note that over a 2-y period, while only 6.5% of the population never has insurance, almost one-in-five individuals (18.5%) experience a month or more without insurance coverage (not shown). These types of patterns underscore that the oft-quoted “rate” of people without insurance (at a given point in time) does not fully capture the lack of insurance coverage in the United States.
Fig. 1.
Share without insurance over different length measurement periods. Figures display the average share of individuals under age 65 who are uninsured at some point over the number of consecutive months shown on the x-axis. Panel (A) plots data for the MEPS cohorts from 2014 to 2015 (N = 12,725), 2015 to 16 (N = 13,434), 2016 to 17 (N = 12,259), 2017 to 18 (N = 10,995), and 2018 to 2019 (N = 10,371). “All cohorts” shows the simple average across these five cohorts. Panel (B) plots the same statistic using data from the SIPP, which spans the 36 mo of 2017 to 2019 (N = 14,893), alongside the 2017 to 2018 and 2018 to 2019 MEPS cohorts for reference. For inclusion in the sample, individuals must have observed insurance status and be alive for all survey months. As a result, the sample is limited to individuals in the MEPS who are 2 to 64 by the end of the second survey year in the MEPS sample and to individuals in the SIPP who are 3 to 64 by the end of the third survey year. The appropriate longitudinal weights are applied to each survey.
The bottom panel of Fig. 1 uses the 2017 to 2019 SIPP to look at the share of the population who experiences some time without insurance over measurement periods of up to 3 y. For comparison, we also show the comparable statistics for the 2017 to 2018 and 2018 to 2019 MEPS cohorts. For any given measurement period, the share who experience some time without insurance is slightly lower in the SIPP than that in the MEPS. For example, at 24 mo, 20% of people in the SIPP have experienced some time without insurance, compared to about 23% in the corresponding MEPS cohorts. However, the SIPP shows the same pattern of a doubling of the share without insurance as we move from 1 mo (10%) to 2 y (20%). Over the subsequent (third) year, the share who experience some time without insurance grows more slowly, so that by 3 y, it is about 22%. This suggests that our 2-y measurement period in our primary MEPS analysis captures a large share of the insurance fluctuations.|| The leveling-off of the risk of insurance loss after 2 y also suggests that the risk is concentrated in a subset of the population, a hypothesis we now explore.
2.2. Risk of Insurance Loss.
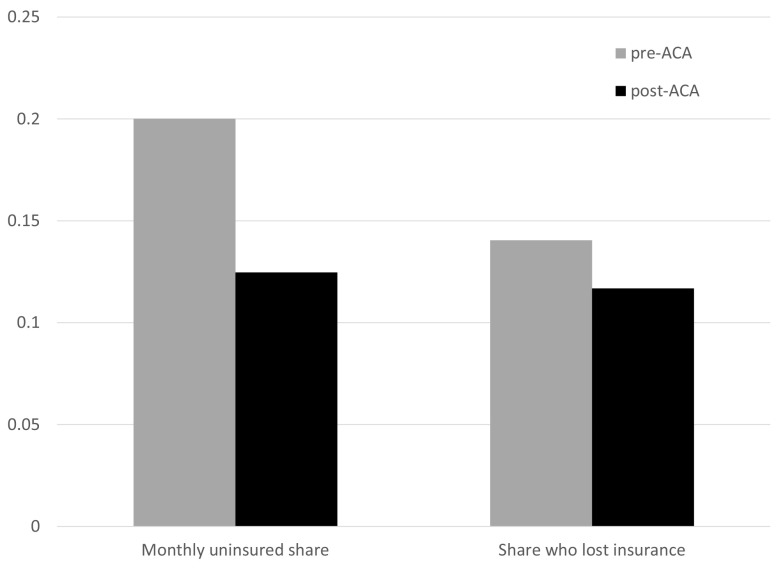
Fig. 2 examines changes after the introduction of the ACA in the share uninsured at a point in time and in the 2-y risk of insurance loss among those insured in the first survey month. Specifically, we report the average share uninsured in any given month, and the share of individuals who were insured in the first survey month who lose coverage at some point over the 2-y survey, separately for our post-ACA and pre-ACA MEPS cohorts. The results indicate that while the ACA has had a very large effect on the share without insurance at a point in time, its effect on insurance uncertainty has been minimal. Specifically, the share uninsured in any given month fell from 20% before the ACA to 12.5% after it. However, the share of the insured who lose coverage over a 2-y period remained very similar: 14% before the ACA compared to 12% after.
Fig. 2.
Average share uninsured and 2-y risk of insurance loss. Figure displays the average share uninsured in any given month and the 2-y risk of insurance loss, before and after the implementation of the ACA. We measure the risk of insurance loss by restricting the sample to individuals who are insured in the first survey month and then estimate the share of those initially insured individuals who are uninsured at some point over the 2-y survey. Data are drawn from the MEPS. The “pre-ACA” period pools the six 2-y cohorts which begin in the years 2007 through 2012 (N = 78,788). The “post-ACA” period pools the five 2-y cohorts which begin in the years 2014 through 2018 (N = 59,784). We exclude the “partially treated” 2-y cohort which begins in 2013. Longitudinal weights are applied.
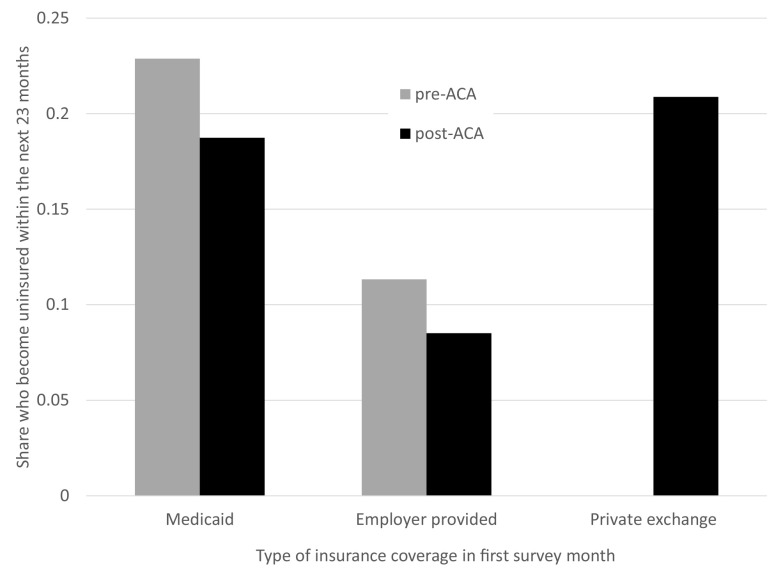
One reason that the risk of insurance loss among the insured does not decline noticeably after the ACA is that the major sources of gains in insurance coverage from the ACA came from expanded coverage of Medicaid and the introduction of the private health insurance exchanges, two sources of insurance with particularly high rates of insurance uncertainty. Fig. 3 illustrates how the risk of insurance loss varies by type of insurance coverage. It is considerably higher for individuals with Medicaid coverage (both pre- ACA and post-ACA) or insurance through the private exchange (only available post ACA) than that for individuals with employer-provided coverage. For example, post ACA, both those with Medicaid and those with insurance through the private exchanges have about a 20% chance of losing coverage at some point over a 2-y period compared to only an 8.5% chance for those with employer-provided coverage. Still, even college-educated workers with employer-provided coverage have a 6% chance of losing insurance over a 2-y period (not shown).**
Fig. 3.
Probability of insurance loss by initial insurance type. Figure reports, among individuals who are insured in the first survey month, the percentage of individuals who will be uninsured at some point during the subsequent 23 mo, before and after the implementation of the ACA. The figure displays three subgroups based on the type of insurance they have in the first survey month: Medicaid, employer-provided insurance, or insurance through the private exchanges (which were available only after the implementation of the ACA). We measure the risk of insurance loss by restricting the sample to individuals who are insured in the first survey month and then estimate the share of those initially insured individuals who are uninsured at some point over the 2-y survey. Data are drawn from the MEPS. The “pre-ACA” period pools the six 2-y cohorts which begin in the years 2007 through 2012 (N = 78,788). The “post-ACA” period pools the five 2-y cohorts which begin in the years 2014 through 2018 (N = 59,784). We exclude the “partially treated” 2-y cohort which begins in 2013. Longitudinal weights are applied throughout.
Fig. 4 shows how the post-ACA risk of insurance loss varies across demographic groups. For comparison, it also shows the share of each demographic group that is uninsured in an average month. As has been well documented (2–4), the share without insurance in a given month varies dramatically across groups, with considerably higher rates for those with less education and those who are non-White, and considerably lower rates for children. In general, groups that have a higher share without insurance in a given month tend to also have a higher risk among the insured of losing insurance, but there are some notable exceptions. For example, among Hispanic people, the share uninsured in an average month is quite high (23%, compared to 15% for Black Americans and 9% for White Americans), but the share of the insured who lose their insurance is quite similar for Hispanic people and Black people (16% and 15%, respectively).
Fig. 4.
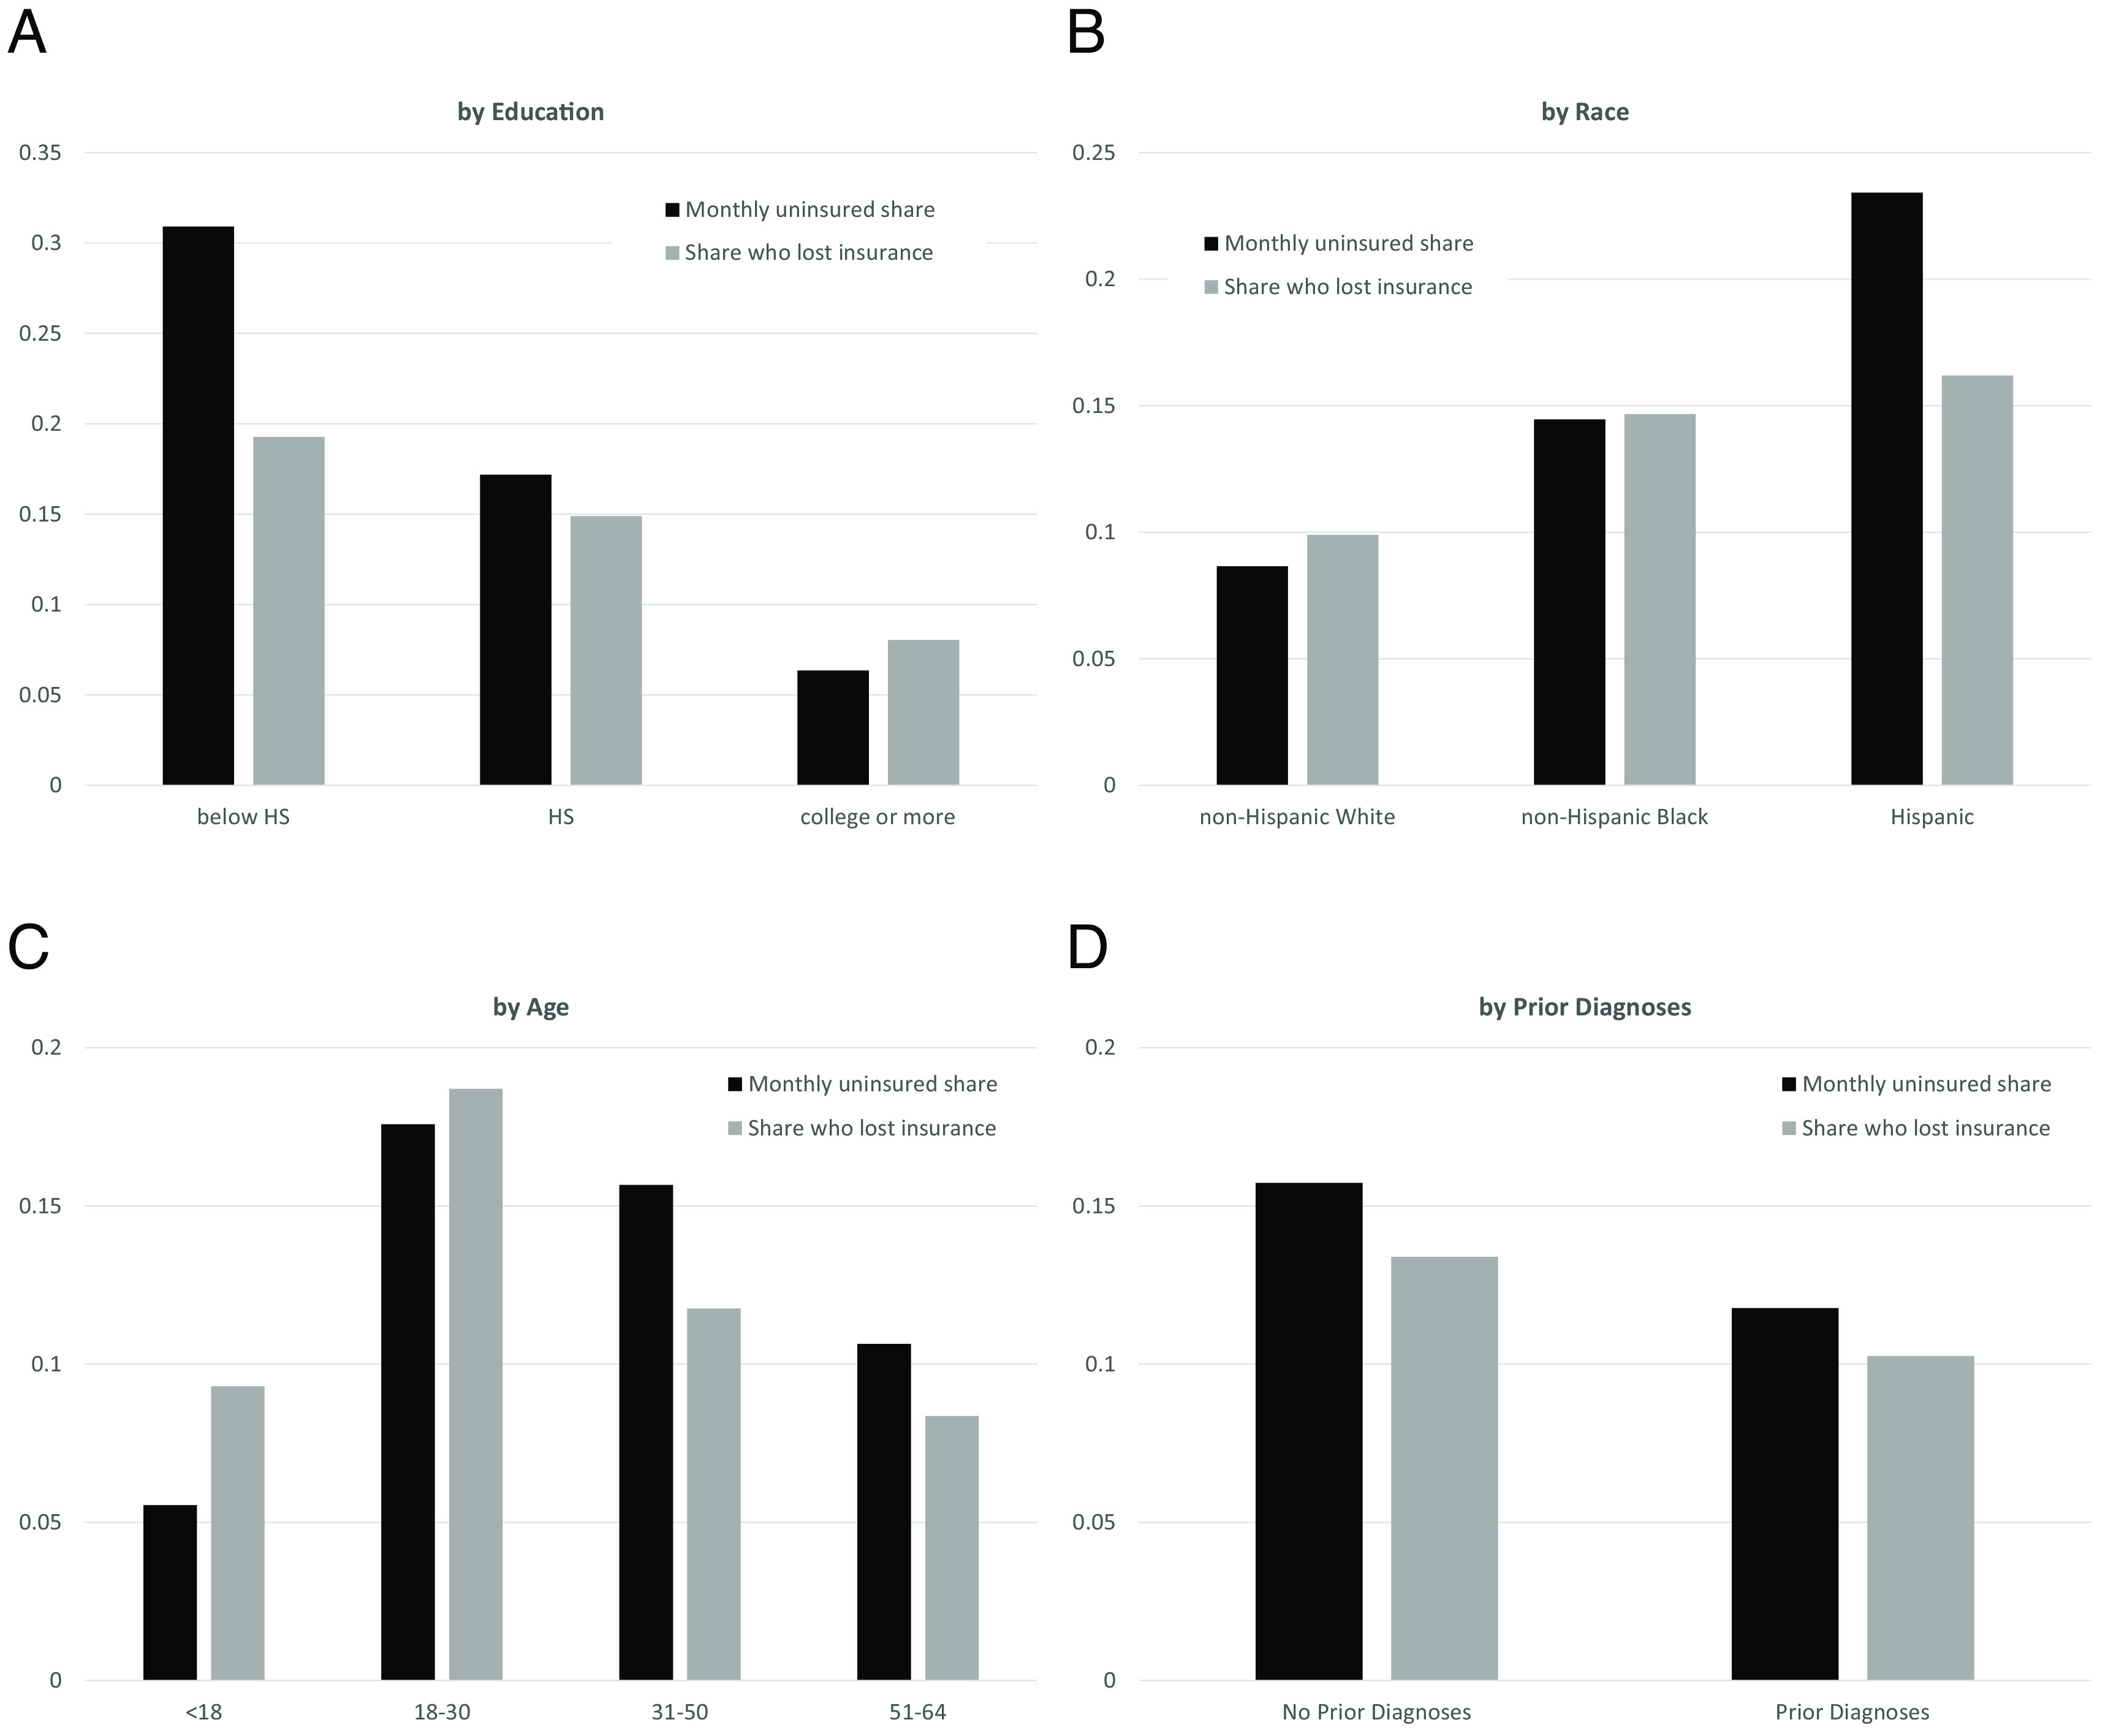
Post-ACA average share uninsured and 2-y risk of insurance loss, by demographics. Figure displays the average share uninsured in any given month and the 2-y risk of insurance loss by various demographics. We measure that risk of insurance loss by restricting the sample to individuals who are insured in the first survey month and then estimate the share of those initially insured individuals who are uninsured at some point over the 2-y survey. Data are from the five 2-y post-ACA MEPS cohorts. SI Appendix, Table S2 displays summary statistics for the demographic groups shown. Panel (A) presents subgroup analysis by education; (B) by race; (C) by age groups; and (D) by those with and without a prior diagnosis of coronary heart disease, diabetes, high blood pressure, heart attack, or stroke. Longitudinal weights are applied throughout. N = 59,784.
2.3. Duration of Lack of Insurance after Losing Coverage.
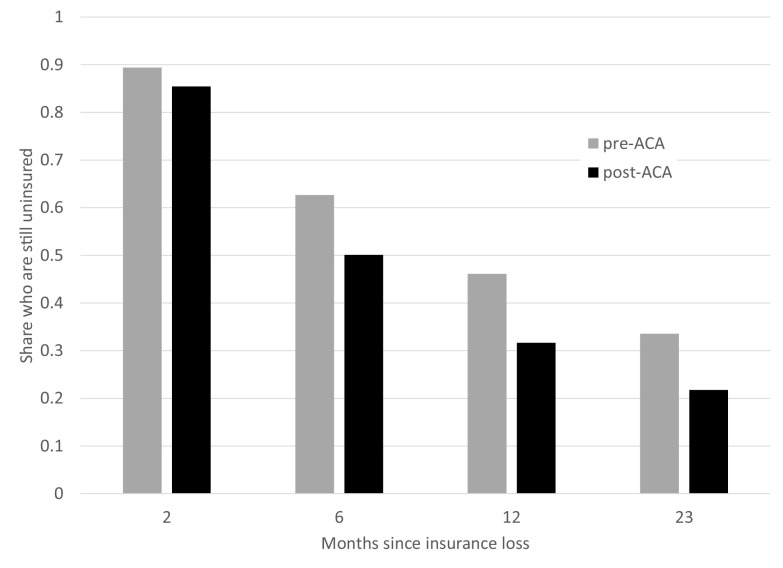
To explore the dynamics of insurance loss more granularly, Fig. 5 restricts attention to the subset of individuals who are insured at the beginning of the survey but then lose insurance in some subsequent month.†† For each individual, we take the first month they are observed without insurance and plot the share who remain uninsured in subsequent months. The figure indicates that most individuals who are uninsured at a point in time remain uninsured for multiple consecutive months, both before and after the implementation of the ACA. At least half of those who are uninsured at a point in time remain uninsured 6 mo later, and over one-fifth are still uninsured 23 mo later.
Fig. 5.
Duration of period without insurance following insurance loss. Figure displays the share remaining uninsured after various periods following insurance loss. Figures plot estimates at 2, 6, 12, and 23 mo. Spells are defined as the first consecutive period with insurance observed for individuals who begin the survey insured (i.e., who lose insurance in time we observe). Only an individual’s first spell of insurance loss is used. Data are drawn from the MEPS. The “pre-ACA” period pools the six 2-y cohorts which begin in the years 2007 through 2012 (N = 78,788). The “post-ACA” period pools the five 2-y cohorts which begin in the years 2014 through 2018 (N = 59,784). We exclude the “partially treated” 2-y cohort which begins in 2013. Longitudinal weights are applied.
Fig. 6 presents these patterns separately for different demographic groups post ACA. Among those who lose insurance, the length of the subsequent spell without insurance is shorter for children and longer for those with less education, those who are Hispanic, and those with insurance through ACA exchanges.
Fig. 6.
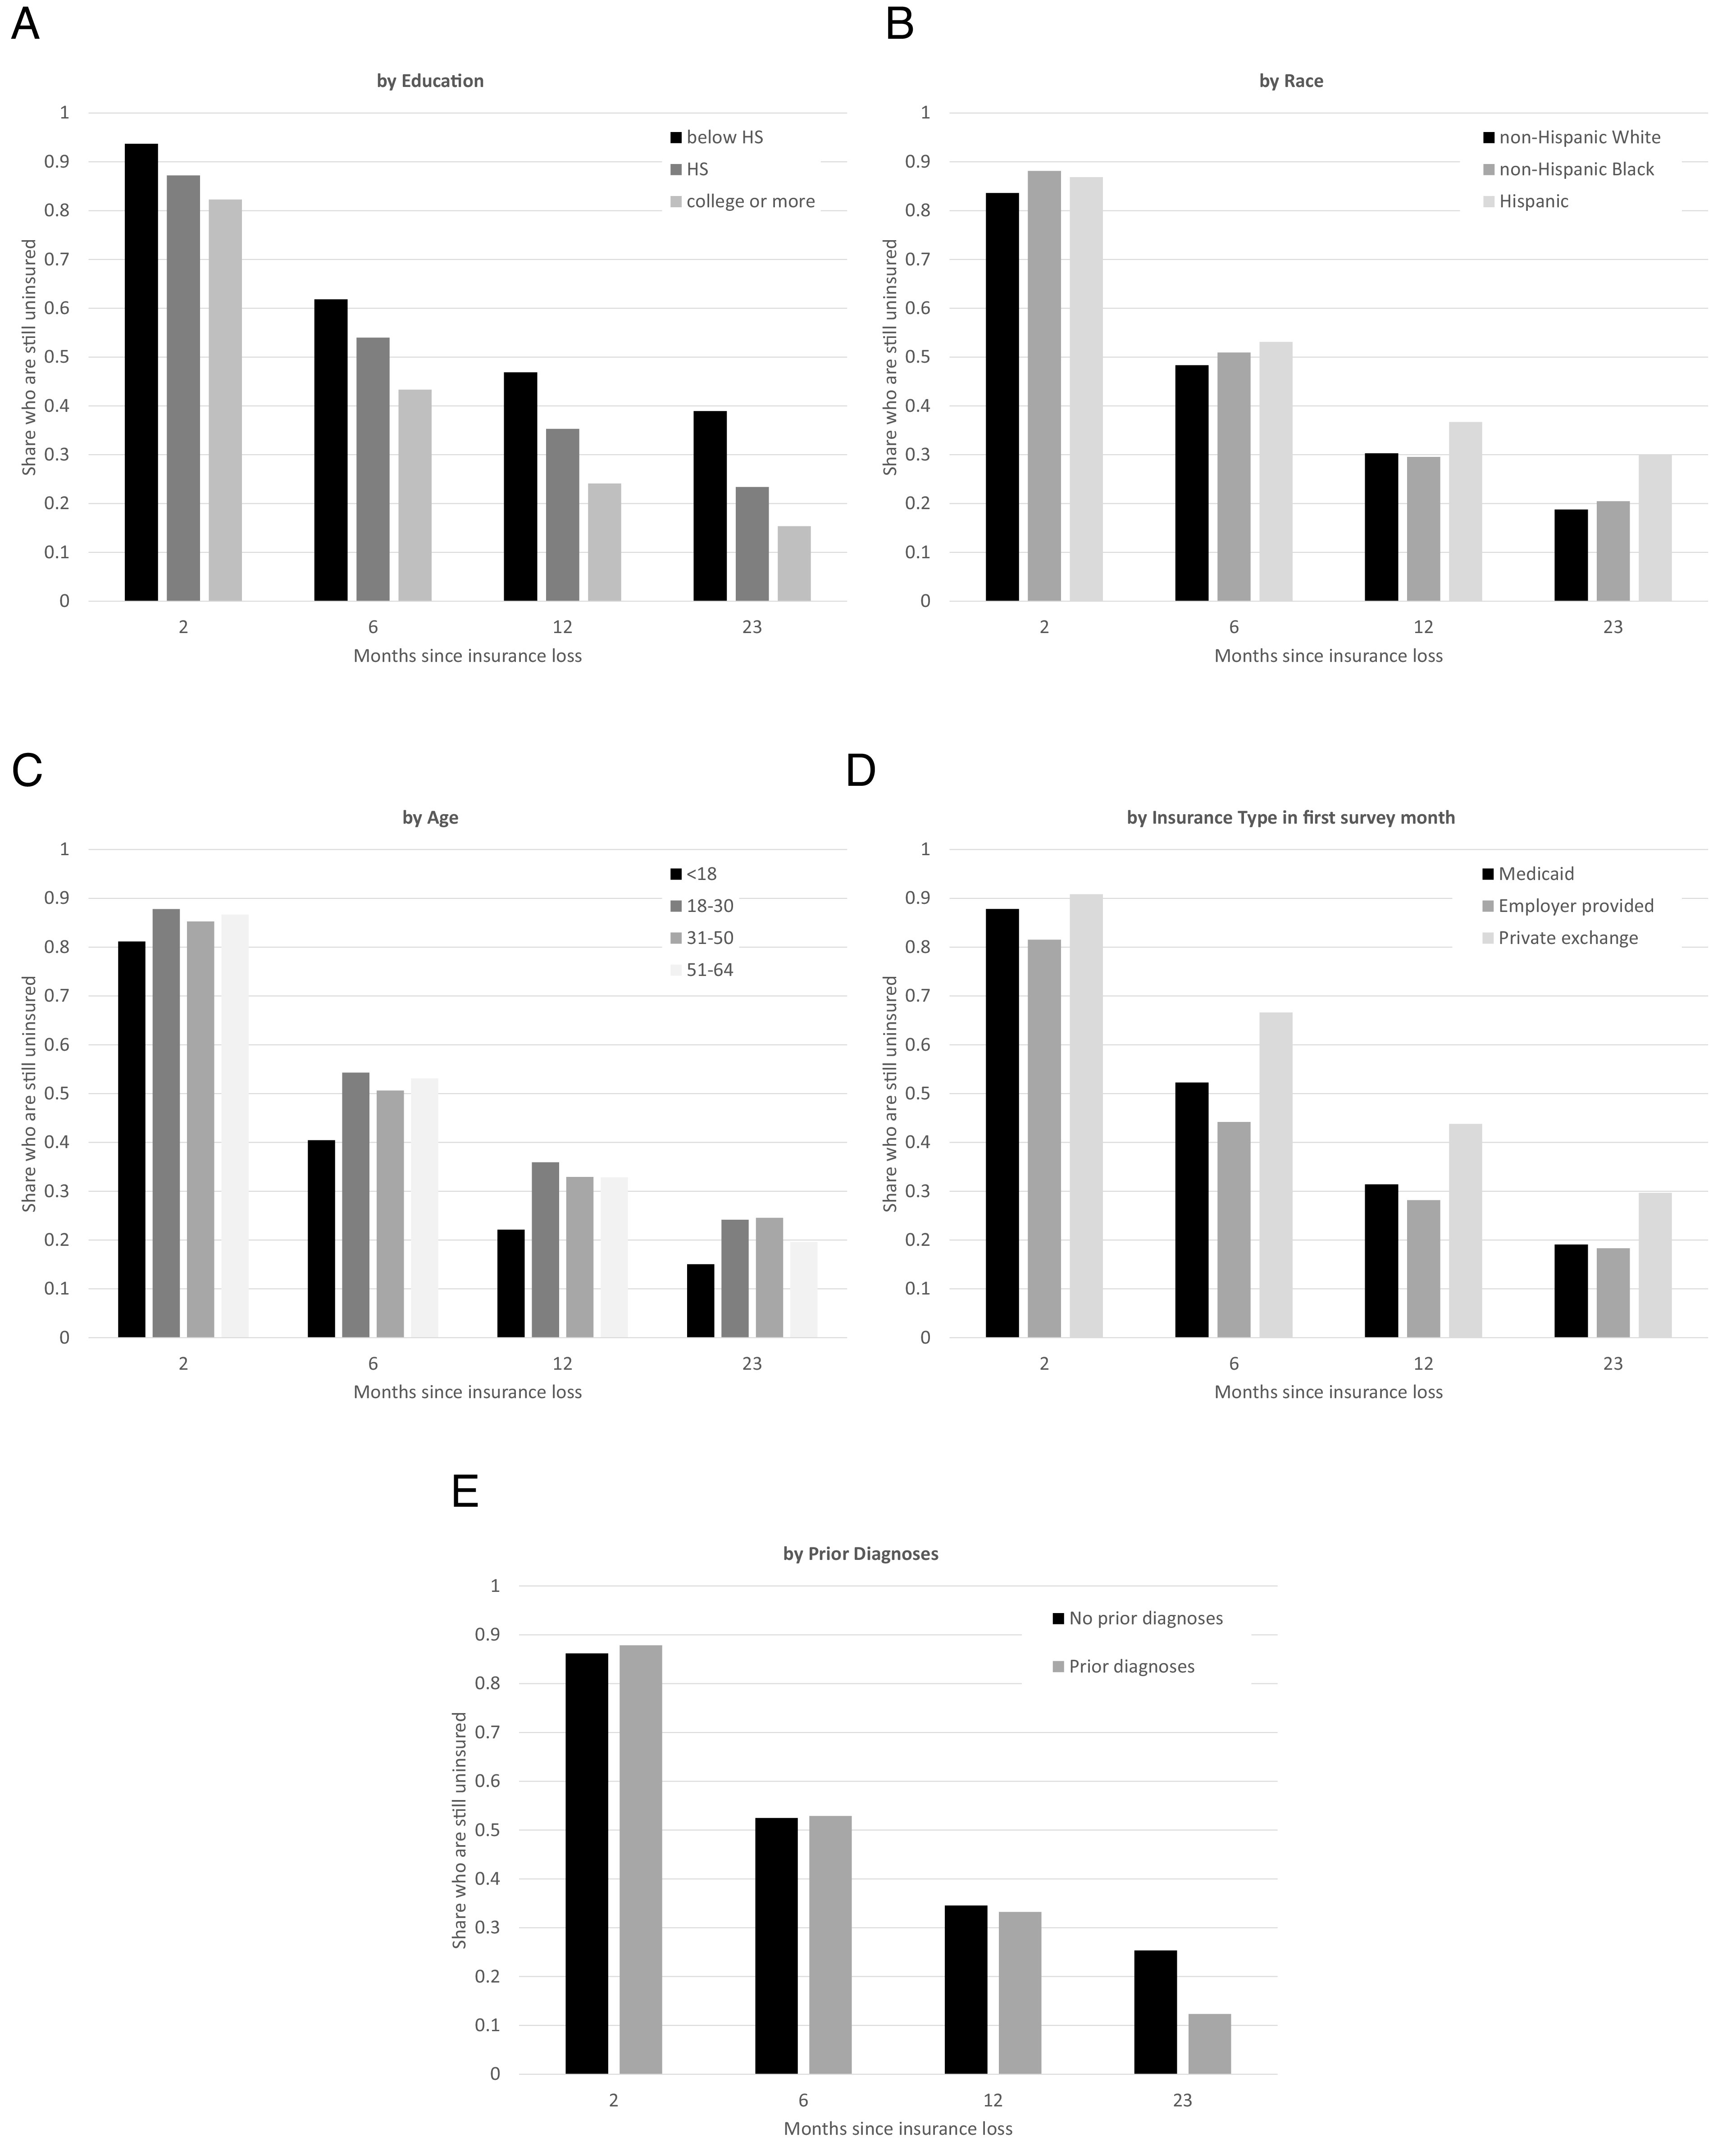
Post-ACA duration of period without insurance following insurance loss, by demographics. Figure displays the share remaining uninsured after various periods following insurance loss. Data are from the five 2-y post-ACA MEPS cohorts. Figures plot estimates at 2, 6, 12, and 23 mo. Spells are defined as the first consecutive period with insurance observed for individuals who begin the survey insured (i.e., who lose insurance in time we observe). Only an individual’s first spell of insurance loss is used. Figure uses the full sample of individuals who are insured in the first survey month and then lose coverage during the 2-y period, with each panel (A-E) splitting that sample by education; race; age; type of insurance in the first survey month; and with or without a prior diagnosis of coronary heart disease, diabetes, high blood pressure, heart attack, or stroke. N = 6,185.
3. Discussion
Despite the term’s common use, the notion of “the uninsured” is conceptually imprecise. Having insurance coverage—or not having it—is a dynamic condition. Because individuals gain, lose, and regain insurance, the time period over which we define insurance coverage can impact its measurement.
Our findings suggest that this impact can be substantial; a considerable fraction of the population is transiently uninsured, rather than “permanently” uninsured. There is notable heterogeneity in the risk of losing coverage—with particularly high rates of insurance loss among those with Medicaid coverage or insurance through the ACA exchanges compared to those with employer-provided coverage—but the risk of insurance loss is substantial for all groups. So too is the risk of a lengthy spell without coverage following the loss of insurance. Yet, most of the policy and academic attention has focused on the share of individuals who are uninsured at a point in time.
There has, of course, been some prior work on insurance uncertainty. For example, Cutler and Gelber (5) use data from the Survey of Income and Program Participation (SIPP) for several years in the early 1980s and the early 2000s to examine insurance uncertainty, and Collins, Bhupal, and Doty (6) use data from the Commonwealth Fund’s Biennial Survey to track how people’s insurance status varies within the year. Most closely related to our work, Gai and Jones (1) use the MEPS to examine insurance instability during 2006 to 2016. Where comparable, our findings are consistent with this past work, which we extend to document that the share of individuals who risk losing insurance over a 2-y period did not noticeably decline after the ACA.
There are a variety of factors behind the insurance loss we document. Individuals can lose employer-provided coverage when the policyholder retires, loses their job, or switches to a job that does not offer coverage. In such instances, they are allowed to continue their previous health insurance coverage for up to 18 mo, but only if they pay the full price of that coverage (7, 8). In practice, the use of this coverage—known as “COBRA”—appears to be quite rare. For example, in 2017, 11 million adults were unemployed and only 130,000 had COBRA (9). Individuals can lose Medicaid coverage for a variety of reasons: if their income increases above the eligibility threshold, if they age into an eligibility category with a lower income-eligibility threshold, or if they move to a state with different eligibility rules. A change in health status can also prompt loss of Medicaid. For example, Medicaid is available to pregnant women higher up the income distribution than it is for nonpregnant women, and as a result many women lose coverage postpartum (10, 11). More niche examples include loss of Medicaid coverage when one is successfully treated for a disease for which Medicaid has expanded eligibility, such as breast or cervical cancer (12). Individuals can also lose Medicaid coverage even while they remain eligible for Medicaid since enrollees are required to periodically refile forms—often every year—to verify their continued eligibility (13). Failure to recertify is therefore yet another source of potential insurance loss.
Empirical work is needed on the relative quantitative importance of these various potential sources of insurance loss. The limited academic literature on the causes of health insurance loss has tended to focus on the potential for strategic enrollment and disenrollment timed around health events (14–16). In other settings, such as the Supplemental Nutrition Assistance Program (SNAP), there is also evidence of inadvertent disenrollment arising from a failure to recertify eligibility (17). Naturally, the consequences of insurance coverage loss will depend in part on whether it is a strategic choice (such as dropping coverage when one is healthy), an inadvertent error (such as failing to refile the forms to stay enrolled), or a factor beyond the individual’s control (such as the loss of a job).
There is relatively little work on the empirical consequences of the substantial, post-ACA health insurance uncertainty that we have documented. Conceptually, there are three main potential adverse consequences of insurance uncertainty. The first is that the risk of losing coverage decreases the value of coverage for the currently insured. This is a staple of economic theory. The purpose of insurance is to provide risk-averse individuals with a hedge against the risk of having to cut back on one’s consumption due to unanticipated expenses, such as large medical bills. Since the purpose of insurance is to reduce exposure to risk, introducing risk of insurance coverage itself is suboptimal. A second potential consequence of time-varying insurance coverage is that individuals may inefficiently retime important medical procedures. They may, for example, delay needed medical care until they have coverage again, or overconsume certain medical treatments “prematurely” given the potential risk of future insurance loss. Finally, the instability of insurance coverage and insurance eligibility within an individual over time may lead individuals to have imperfect information about the correct status of their coverage. This could lead individuals to not get important medical care because they are under the mistaken impression that they must pay for the entire cost themselves, or may get medical care because they believe that it is covered, only to be unpleasantly surprised by a large bill.
The quantitative consequences of insurance loss will depend on a number of empirical factors on which we need more evidence. These include how correlated insurance loss is with adverse health events, and how possible it is to intertemporally substitute when medical treatments occur. Some treatments, such as dental care, may be relatively inconsequential to delay (18), while in other cases, they may be more consequential, such as delays in beginning oncology treatment. Further attention to these factors, and more generally to the existence and nature of insurance uncertainty, will be valuable.
Supplementary Material
Appendix 01 (PDF)
Acknowledgments
We are grateful to Mark Shepard for fixing an embarrassing mistake, to Marika Cabral and Kosali Simon for constructive comments, to Sean Gao, Miray Omurtak, Lisa Smith, and especially Wesley Price for excellent research assistance, and to the National Institute of Aging (Finkelstein - P01AG005842) for financial support.
Author contributions
L.E. and A.F. designed research; L.E. and A.F. analyzed data; and L.E. and A.F. wrote the paper.
Competing interests
The authors declare no competing interest.
Footnotes
Reviewers: M.C., University of Texas at Austin; and K.S., Indiana University Bloomington.
*We exclude the 2013-2014 MEPS cohort as it spans the implementation of the ACA. Open enrollment on the ACA exchanges began in October 2013, with coverage starting in January 1, 2014. January 1, 2014, was also when the Medicaid expansions under the ACA came into effect (20).
†Following the approach of the US Census Bureau (2), we allow individuals to have multiple insurance types, and double count such individuals when creating statistics by type of coverage. About 1% of the sample reports having multiple types of insurance coverage in a given month.
‡All reported statistics use survey weights. See SI Appendix for more details.
§We define an individual as having a prior diagnosis for a health condition if in the first survey year they report ever having received a diagnosis for that condition, and the age at which they report receiving that diagnosis is younger than their age in their first interview.
¶The shares with different types of insurance coverage that we find are typical to what is reported from other data (21).
#This is the first SIPP cohort to have this new structure. It is referred to as the “2018 SIPP Panel.”
||We suspect that there are two possible sources of the slight kinks apparent at 12 and 24 mo in the SIPP data. One is that it reflects recall bias over the 1-y “look-back period,” with individuals more likely to remember insurance coverage that they have had more recently. Another is that there was substantial attrition in the data covering 2018 and 2019, due to a lapse of funding in 2019 and the 2020 pandemic, respectively (22, 23). In principle, the SIPP survey weights are designed to address this attrition.
**In light of the expansion of Medicaid under the ACA, the high risk of insurance loss among those with Medicaid raises the question of how much the small, overall change post-ACA in the likelihood of insurance loss is affected by changes in insurance mix among the insured. In practice, we find that it makes little difference. In particular, in Fig. 2, we estimated that the 2-y risk of losing insurance is 14% pre-ACA and 11.7% post ACA. These numbers are very similar (13.6% and 11.4%, respectively) when we remove “other insurance,” which has a similar share of approximately 8% in both periods. When we then hold the insurance composition fixed at the pre-ACA level, the post-ACA risk of 2-y insurance loss falls only slightly, from 11.4 to 10.5%.
††This share is 11.5% in the pre-ACA sample and 10.4% in the post-ACA sample.
Data, Materials, and Software Availability
Publicly available survey data from MEPS and SIPP data have been deposited in ICPSR (19).
Supporting Information
References
- 1.Gai Y., Jones K., Insurance patterns and instability from 2006 to 2016. BMC Health Services Res. 20, 1–12 (2020). [DOI] [PMC free article] [PubMed] [Google Scholar]
- 2.Keisler-Starkey K., Bunch L. N., Health Insurance Coverage in the United States: 2019 (U.S. Census Bureau, 2021). [Google Scholar]
- 3.Buchmueller T. C., Levy H. G., The ACA’s impact on racial and ethnic disparities in health insurance coverage and access to care: an examination of how the insurance coverage expansions of the Affordable Care Act have affected disparities related to race and ethnicity. Health Affairs 39, 395–402 (2020). [DOI] [PubMed] [Google Scholar]
- 4.Holahan J., Blumberg L. J., Buettgens M., The Potential Implications of Texas v. United States: How Would Repeal of the ACA Change the Likelihood That People With Different Characteristics Would Be Uninsured? (The Robert Wood Johnson Foundation and The Urban Institute, 2019). [Google Scholar]
- 5.Cutler D. M., Gelber A. M., Changes in the incidence and duration of periods without insurance. N. Engl. J. Med. 360, 1740–1748 (2009). [DOI] [PubMed] [Google Scholar]
- 6.Collins S. R., Bhupal H. K., Doty M. M., Health Insurance Coverage Eight Years After the ACA: Fewer Wninsured Americans and Shorter Coverage Gaps, but More Underinsured (The Commonwealth Fund, 2019). [Google Scholar]
- 7.Employee Benefits Security Administration, “Fact sheet: Celebrating 25 years of COBRA” (EBSA, 2011). [Google Scholar]
- 8.Employee Benefits Security Administration, An Employer’s Guide to Group Health Continuation Coverage Under COBRA (United States Department of Labor, 2021). [Google Scholar]
- 9.Pollitz K., et al. , Key issues related to COBRA subsidies (Kaiser Family Foundation, 2020). [Google Scholar]
- 10.Daw J. R., Hatfield L. A., Swartz K., Sommers B. D., Women in the United States experience high rates of coverage ‘churn’in months before and after childbirth. Health Affairs 36, 598–606 (2017). [DOI] [PubMed] [Google Scholar]
- 11.Johnston E. M., McMorrow S., Alvarez Caraveo C., Dubay L., Post-ACA, more than one-third of women with prenatal medicaid remained uninsured before or after pregnancy: Study examines insurance coverage and access to care before, during, and after pregnancy for women with prenatal Medicaid coverage. Health Affairs 40, 571–578 (2021). [DOI] [PubMed] [Google Scholar]
- 12.Roth W., Breast and Cervical Cancer Treatment Act (United States Senate, Committee on Finance (106th Congress, Second Session), 2000). [Google Scholar]
- 13.Brooks T., Roygardner L., Artiga S., Pham O., Dolan R., Medicaid and CHIP Eligibility, Enrollment, and Cost Sharing Policies as of January 2020: Findings from a 50-State Survey (Kaiser Family Foundation, 2020). [Google Scholar]
- 14.Pei Z., Eligibility recertification and dynamic opt-in incentives in income-tested social programs: Evidence from Medicaid/CHIP. Am. Econ. J. Econ. Policy 9, 241–76 (2017). [Google Scholar]
- 15.Diamond R., Dickstein M. J., McQuade T., Persson P., Insurance without Commitment: Evidence from the ACA Marketplaces (National Bureau of Economic Research, 2018). [Google Scholar]
- 16.Banerjee A., et al. , The challenges of universal health insurance in developing countries: Experimental evidence from Indonesia’s national health insurance. Am. Econ. Rev. 111, 3035–63 (2021). [Google Scholar]
- 17.Homonoff T., Somerville J., Program recertification costs: Evidence from SNAP. Am. Econ. J. Econ. Policy 13, 271–98 (2021). [Google Scholar]
- 18.Cabral M., Claim timing and ex post adverse selection. Rev. Econ. Studies 84, 1–44 (2016). [Google Scholar]
- 19.Einav L., Finkelstein A., The risk of losing health insurance in the United States is large, and remained so after the Affordable Care Act. ICSPR. 10.3886/E188164V1. Deposited 4 April 2023. [DOI] [PMC free article] [PubMed]
- 20.French M. T., Homer J., Gumus G., Hickling L., Key provisions of the patient protection and affordable care act (ACA): A systematic review and presentation of early research findings. Health Services Res. 51, 1735–1771 (2016). [DOI] [PMC free article] [PubMed] [Google Scholar]
- 21.Cohen R. A., Cha A. E. C., Terlizzi E. P., Martinez M. E., “Demographic Variation in Health Insurance Coverage: United States, 2019” (National Center for Health Statistics, 2021). [PubMed] [Google Scholar]
- 22.US Census Bureau, “2019 SIPP: Insufficient geographic coverage and unit nonresponse” (US Census Bureau, 2021). [Google Scholar]
- 23.US Census Bureau, “2020 SIPP: COVID-19 collection impacts and unit nonresponse” (US Census Bureau, 2021). [Google Scholar]
Associated Data
This section collects any data citations, data availability statements, or supplementary materials included in this article.
Supplementary Materials
Appendix 01 (PDF)
Data Availability Statement
Publicly available survey data from MEPS and SIPP data have been deposited in ICPSR (19).


