Abstract
Huntington’s disease (HD) is an inherited neurodegenerative disorder with adult-onset clinical symptoms, but the mechanism by which aging drives the onset of neurodegeneration in HD patients remains unclear. Here, we examined striatal medium spiny neurons (MSNs) directly reprogrammed from fibroblasts of HD patients to model the age-dependent onset of pathology. We found that pronounced neuronal death occurred selectively in reprogrammed MSNs from symptomatic HD patients (HD-MSNs) compared to MSNs derived from younger, pre-symptomatic patients (pre-HD-MSNs) and control MSNs from age-matched healthy individuals. We observed age-associated alterations in chromatin accessibility between HD-MSNs and pre-HD-MSNs, and identified miR-29b-3p, whose age-associated upregulation promotes HD-MSN degeneration by impairing autophagic function through human-specific targeting of STAT3 3’UTR. Reducing miR-29b-3p or chemically promoting autophagy increased the resilience of HD-MSNs against neurodegeneration. Our results demonstrate miRNA upregulation with aging in HD as a detrimental process driving MSN degeneration, and potential approaches for enhancing autophagy and resilience of HD-MSNs.
Introduction
Huntington’s disease (HD) is a dominantly inherited neurodegenerative disorder characterized by a range of symptoms, including motor deficits, psychiatric symptoms, and cognitive decline1,2. HD pathology results from a mutation that expands the polymorphic glutamine (CAG) tract within the HTT gene to more than 36 repeats, where the majority of HD patients contain a CAG repeat size of 40–50, leading to adult-onset of clinical symptoms3. The number of CAG repeats is directly linked to the severity of the disease and is inversely proportional to the age of onset4 5. However, how aging in HD patients drives the onset of neurodegeneration remains unclear.
To model the pathogenic events that predispose medium spiny neurons (MSNs), the primary cell type affected by the disease6, to degeneration, direct neuronal reprogramming has been used to recapitulate adult-onset pathology of HD by converting patients’ fibroblasts directly into MSNs7. Direct neuronal reprogramming employs neurogenic factors to drive the fate of non-neural human somatic cells, such as dermal fibroblasts, to neurons8–10. To generate MSNs through direct reprogramming, a reprogramming approach was developed using neurogenic microRNAs (miRNAs), miR-9/9* and miR-124 (miR-9/9*-124) that drive the conversion of human fibroblasts to a general neuronal state10–13, while additional transcription factors CTIP2, DLX1/2, and MYT1L (CDM) guide the conversion to the MSN lineage14–16. miRNA-mediated neuronal conversion occurs through the activity of miR-9/9*-124 that first erases the fibroblast identity and activates the neuronal program in sequence through chromatin reconfiguration12,13,17. Importantly, the age information stored in the starting fibroblasts propagates to reprogrammed MSNs, including the DNA methylation-based epigenetic age clock18, age-associated changes in the transcriptome, and the miRNA landscape19, allowing the generation of neurons that mirror the epigenetic age of fibroblast donors. These findings are also consistent with the notion that age-associated changes in gene expression in human brains were retained in directly reprogrammed neurons20, and contrast neurons differentiated from induced pluripotent stem cells (iPSCs), which manifest an embryonic state through the induction of pluripotency18,21,22. For adult-onset HD (with CAG repeat numbers of 40–50), we previously established directly converted MSNs from symptomatic patients as a model that manifested hallmark HD phenotypes, such as aggregation of mutant HTT (mHTT) and neurodegeneration without additional cellular insults, capturing cell-intrinsic properties underlying MSN degeneration7.
Here, we leverage the conversion system to investigate how aging in HD may contribute to MSN degeneration by focusing on the finding that the degree of neuronal death in patient-derived MSNs corresponds to the stage of HD progression. MSNs converted from fibroblasts collected after the onset of clinical symptoms (HD-MSNs) display significantly higher levels of cell death compared to MSNs reprogrammed from patient fibroblasts collected at younger, pre-symptomatic stages (pre-HD-MSNs) or from age-matched healthy controls. We employ comparative transcriptomics, chromatin accessibility profiling, and cellular phenotyping, to reveal that HD-MSNs are characterized by marked downregulation of autophagy function compared to pre-HD-MSNs and control MSNs from both young and old age groups. We identify miR-29b-3p, whose marked upregulation in HD-MSNs over pre-HD-MSNs significantly limits autophagy in HD-MSNs via directly targeting STAT3 via human-specific binding sites in the 3’UTR. The autophagy deficiency in HD-MSNs can be overcome chemically or genetically by a glibenclamide analog, G2 or inhibiting miR-29b-3p, leading to the reduction of mutant HTT aggregation and protection of HD-MSNs from neuronal death. The current study provide molecular insights into how aging in HD compromises autophagy in MSNs and its enhancement as a potent approach to increase MSN resilience against neurodegeneration in HD.
Results
MSN reprogramming of fibroblasts at different stages of HD
We carried out miR-9/9*-124-CDM-based MSN reprogramming7,14,15 in a total of 24 fibroblast samples, comprising six fibroblast lines from independent HD patients before clinical onset (11 to 44 years of age), six fibroblast lines from symptomatic patients (52 to 71 years of age), six control fibroblasts from healthy young adults (17–29 years of age), and six older control individuals (50 to 60 years of age) (Fig. 1a). Pre-onset fibroblasts were collected 13–17 years before the reported age of the onset of HD symptoms, and all patient samples (pre- and post-onset) contained 40–50 CAG repeats (Supplementary Table 1). 90% of the reprogrammed cells expressed neuronal markers MAP2, TUBB3, and a MSN marker, PPP1R1B (also known as DARPP-32), by post-induction day (PID) 21 or 30 across all samples (Fig. 1b,c and Extended Data Fig. 1a–c), demonstrating consistent reprogramming efficiencies across fibroblast samples used in the study. To further confirm the neuronal identity of reprogrammed cells, we analyzed long gene expression (LGE), a transcriptomic feature unique to functionally mature neurons, which provides an unbiased and stringent measure of neuronal identity in reprogrammed cells13,23–26. As such, LGE analysis by LONGO24 showed a drastic increase in LGE in converted cells over fibroblasts confirming successful neuronal reprogramming of fibroblast samples (Fig. 1d).
Fig. 1. Differential manifestation of neurodegeneration between MSNs derived from healthy control individuals and HD patients.
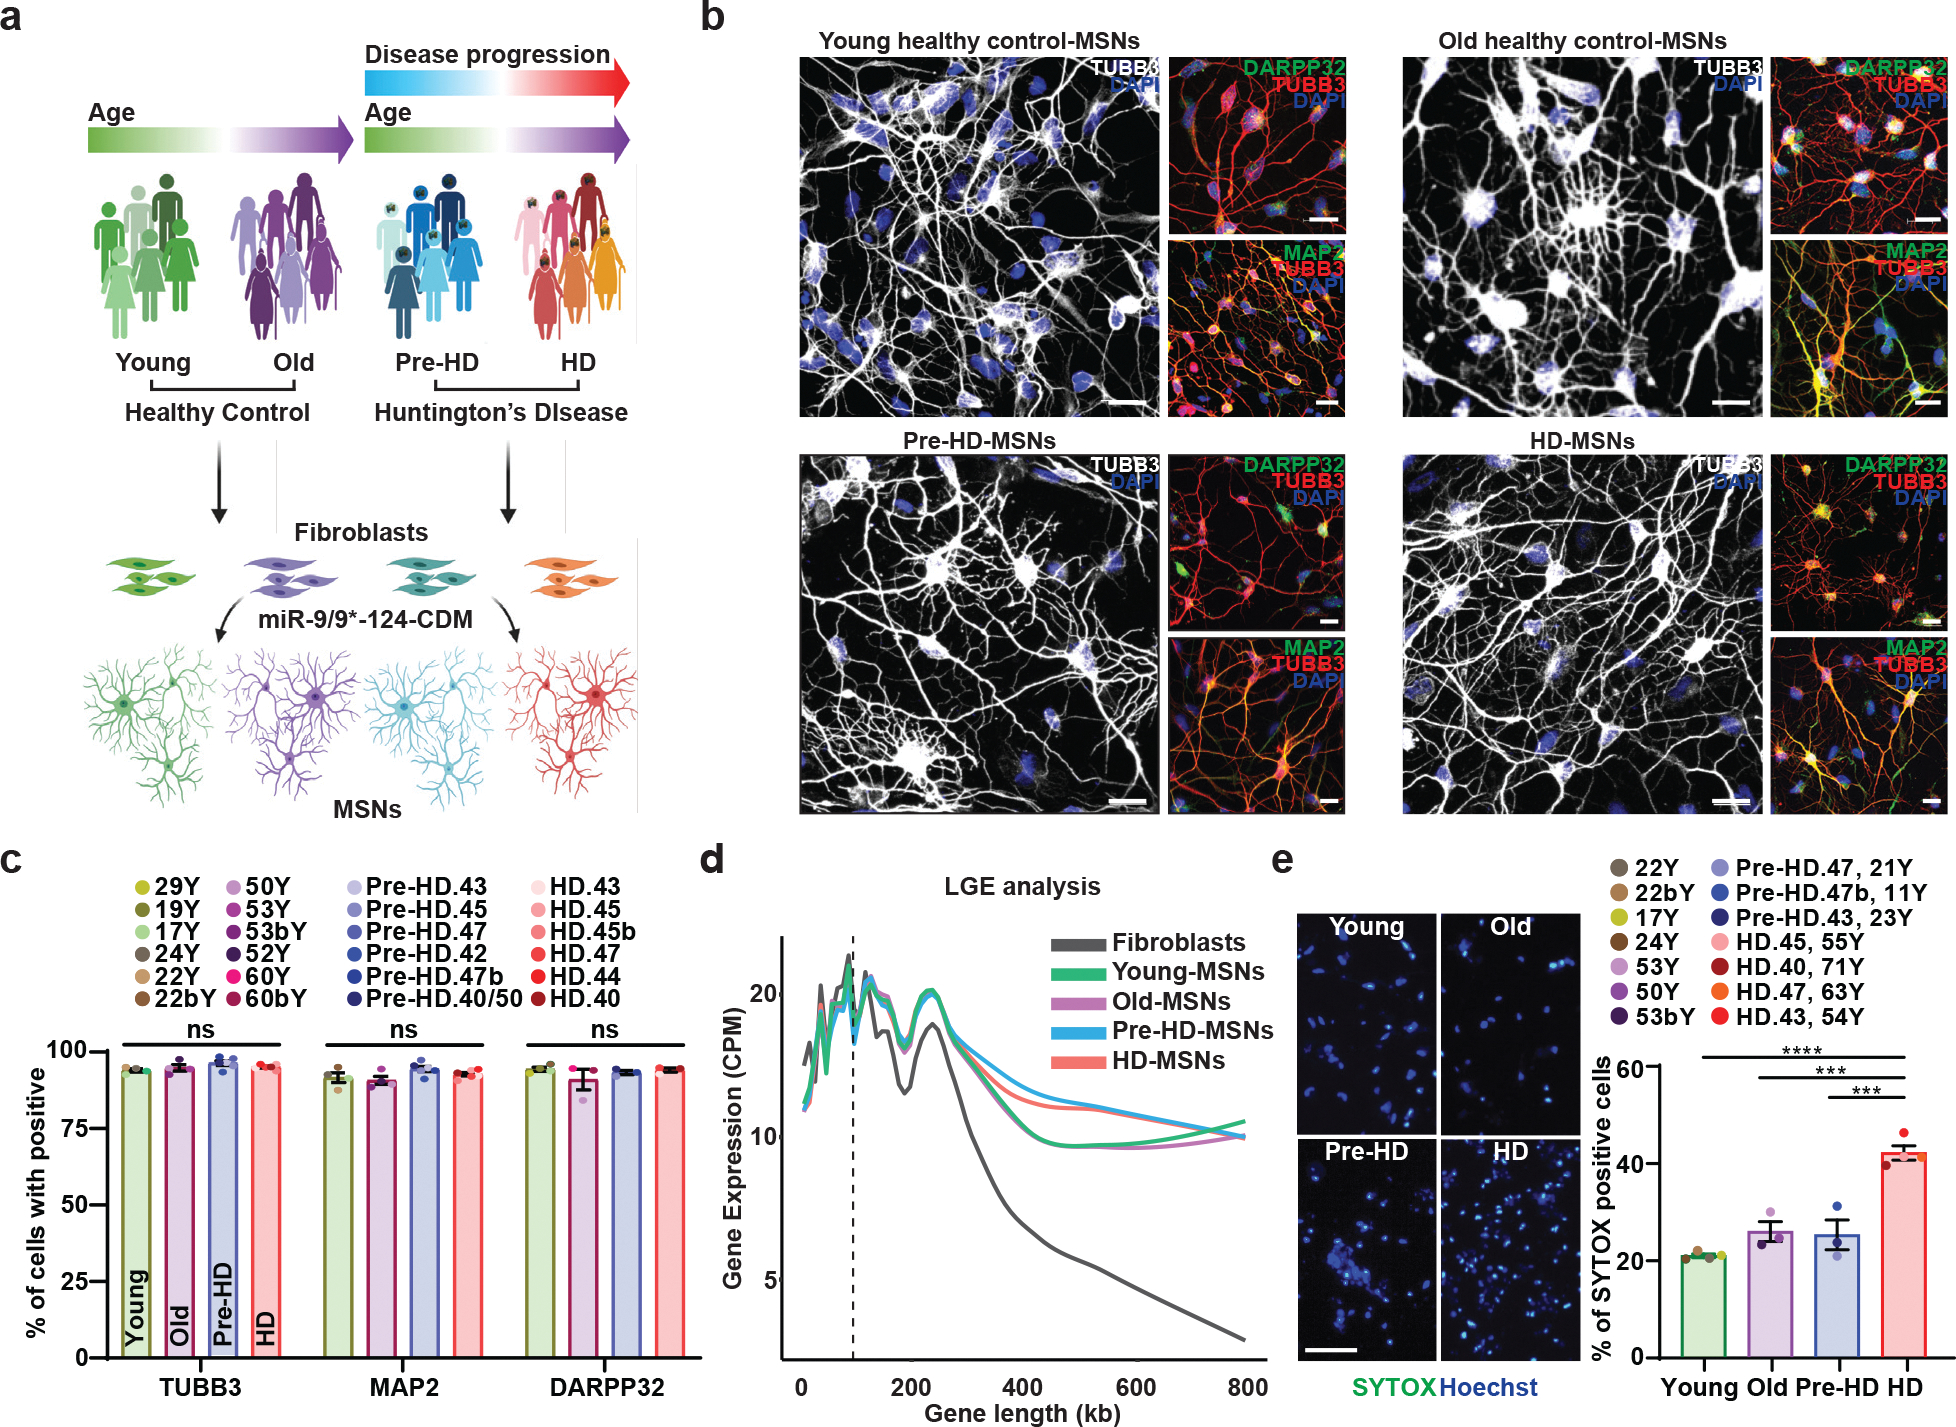
a, Experimental scheme for MSN derivation from fibroblasts of pre-symptomatic (Pre-HD-MSNs), symptomatic HD patients (HD-MSNs), and their respective healthy control individuals of similar ages (Young/Old-MSNs). b, Representative images of TUBB3-, DARPP32-, and MAP2-positive cells from Young/Old healthy control MSNs, Pre-HD-MSNs, and HD-MSNs. c, Quantification of TUBB3-, MAP2- and DARPP-32-positive cells in (b); averages of 300–600 cells per group from independent HD and healthy control lines (n=13 or 20 individual’s reprogrammed MSNs). d, The average long gene expression (LGE), a transcriptomic feature of neuronal identity, in fibroblasts, young/old-MSNs, Pre-HD-, and HD-MSNs. X-axis corresponds to gene lengths (kb) defined by the start and stop genomic coordinates and Y-axis corresponds to gene expression (CPM). The dotted line depicts 100kb in gene length. e, Representative images (left) and quantification (right) of SYTOX-positive cells as a fraction of Hoechst-positive cells (n=14 individual’s reprogrammed MSNs, Young vs. HD p<0.0001, Old vs. HD p=0.0004, Pre-HD vs. HD p=0.0003). For all figures shown, statistical significance was determined by one-way ANOVA (c,e). ****p<0.0001, ***p<0.001, ns, not significant. Scale bars in b 20μm, in e 100μm. Mean±s.e.m.
Age is the primary factor that differs between pre- and post-onset samples. As directly reprogrammed neurons maintain the cellular age of starting fibroblast19,20, we asked whether neurodegeneration would be differentially manifested between young, old control-MSNs (Ctrl-MSNs), pre-HD-MSNs, and HD-MSNs. When we measured the SYTOX-Green signal, a general cell death indicator, as previously described in patient-derived neurons7, neuronal death was specifically increased only in HD-MSNs over pre-HD-MSNs and young and old Ctrl-MSNs (Fig. 1e). We also measured morphological features such as average neurite lengths and the average number of neurite branches in these MSNs at both PID21 (3 weeks, early reprogramming phase) and PID35 (5 weeks, fully converted phase). The mean number of neurite length and the average number of neurite branches at PID21 did not differ between MSNs demonstrating consistent reprogramming efficiencies across all samples. However, at PID35, neurite length and branches were significantly decreased in HD-MSNs over healthy control- and pre-HD MSNs reflecting degenerating HD-MSNs (Extended Data Fig. 1d). These results are consistent with the previous report that HD-MSN death was detected after 30 days into MSN reprogramming7. Altogether, these results demonstrate that despite the mutant HTT present in both pre-HD-MSNs and HD-MSNs with similar repeat numbers, HD-MSNs’ cell death phenotype correlates with the symptomatic stage of patients.
Age-associated alteration of genetic networks
To delineate cellular events underlying HD-MSN degeneration, we compared the transcriptomes of pre-HD-MSNs (six independent patients), HD-MSNs (six independent patients), young-Ctrl-MSNs (six independent samples), and old-Ctrl-MSNs (six independent samples) by RNA-seq (all with triple biological replicates, 72 samples total). RNA samples were collected after 21 days of reprogramming, a time point that aligns with the adoption of neuronal identity during miRNA-mediated reprogramming13 and prior to HD-MSN degeneration in culture7. We carried out weighted gene co-expression network analysis (WGCNA)27 between pre-HD-MSNs and HD-MSNs samples to identify genes with expression changes correlated with donors’ ages and disease stages. Gene modules with positive correlation values indicate increased expression of gene members in HD-MSNs whereas negative correlation values indicate decreased expression in HD-MSNs. Out of gene modules significantly related with stage, age, sex (Extended Data Fig. 2a), six modules were most highly correlated (correlation value > 0.7 or < −0.7) with age (p < 10−7). Four of the six modules (brown, greenyellow, blue, and lightcyan1) also had a high correlation (correlation value > 0.7 or < −0.7) with the disease stage (p < 10−6) (Fig. 2a and Extended Data Fig. 2a). Two (brown and greenyellow) of the four modules showed a correlation with downregulated genes in the symptomatic stage, HD-MSNs, whereas the other two modules (blue and lightcyan1) were correlated with upregulated genes (Fig. 2a and Extended Data Fig. 2b).
Fig. 2. Identification of gene module associated with autophagy dysfunction in HD-MSNs by weighted gene coexpression network analysis (WGCNA).
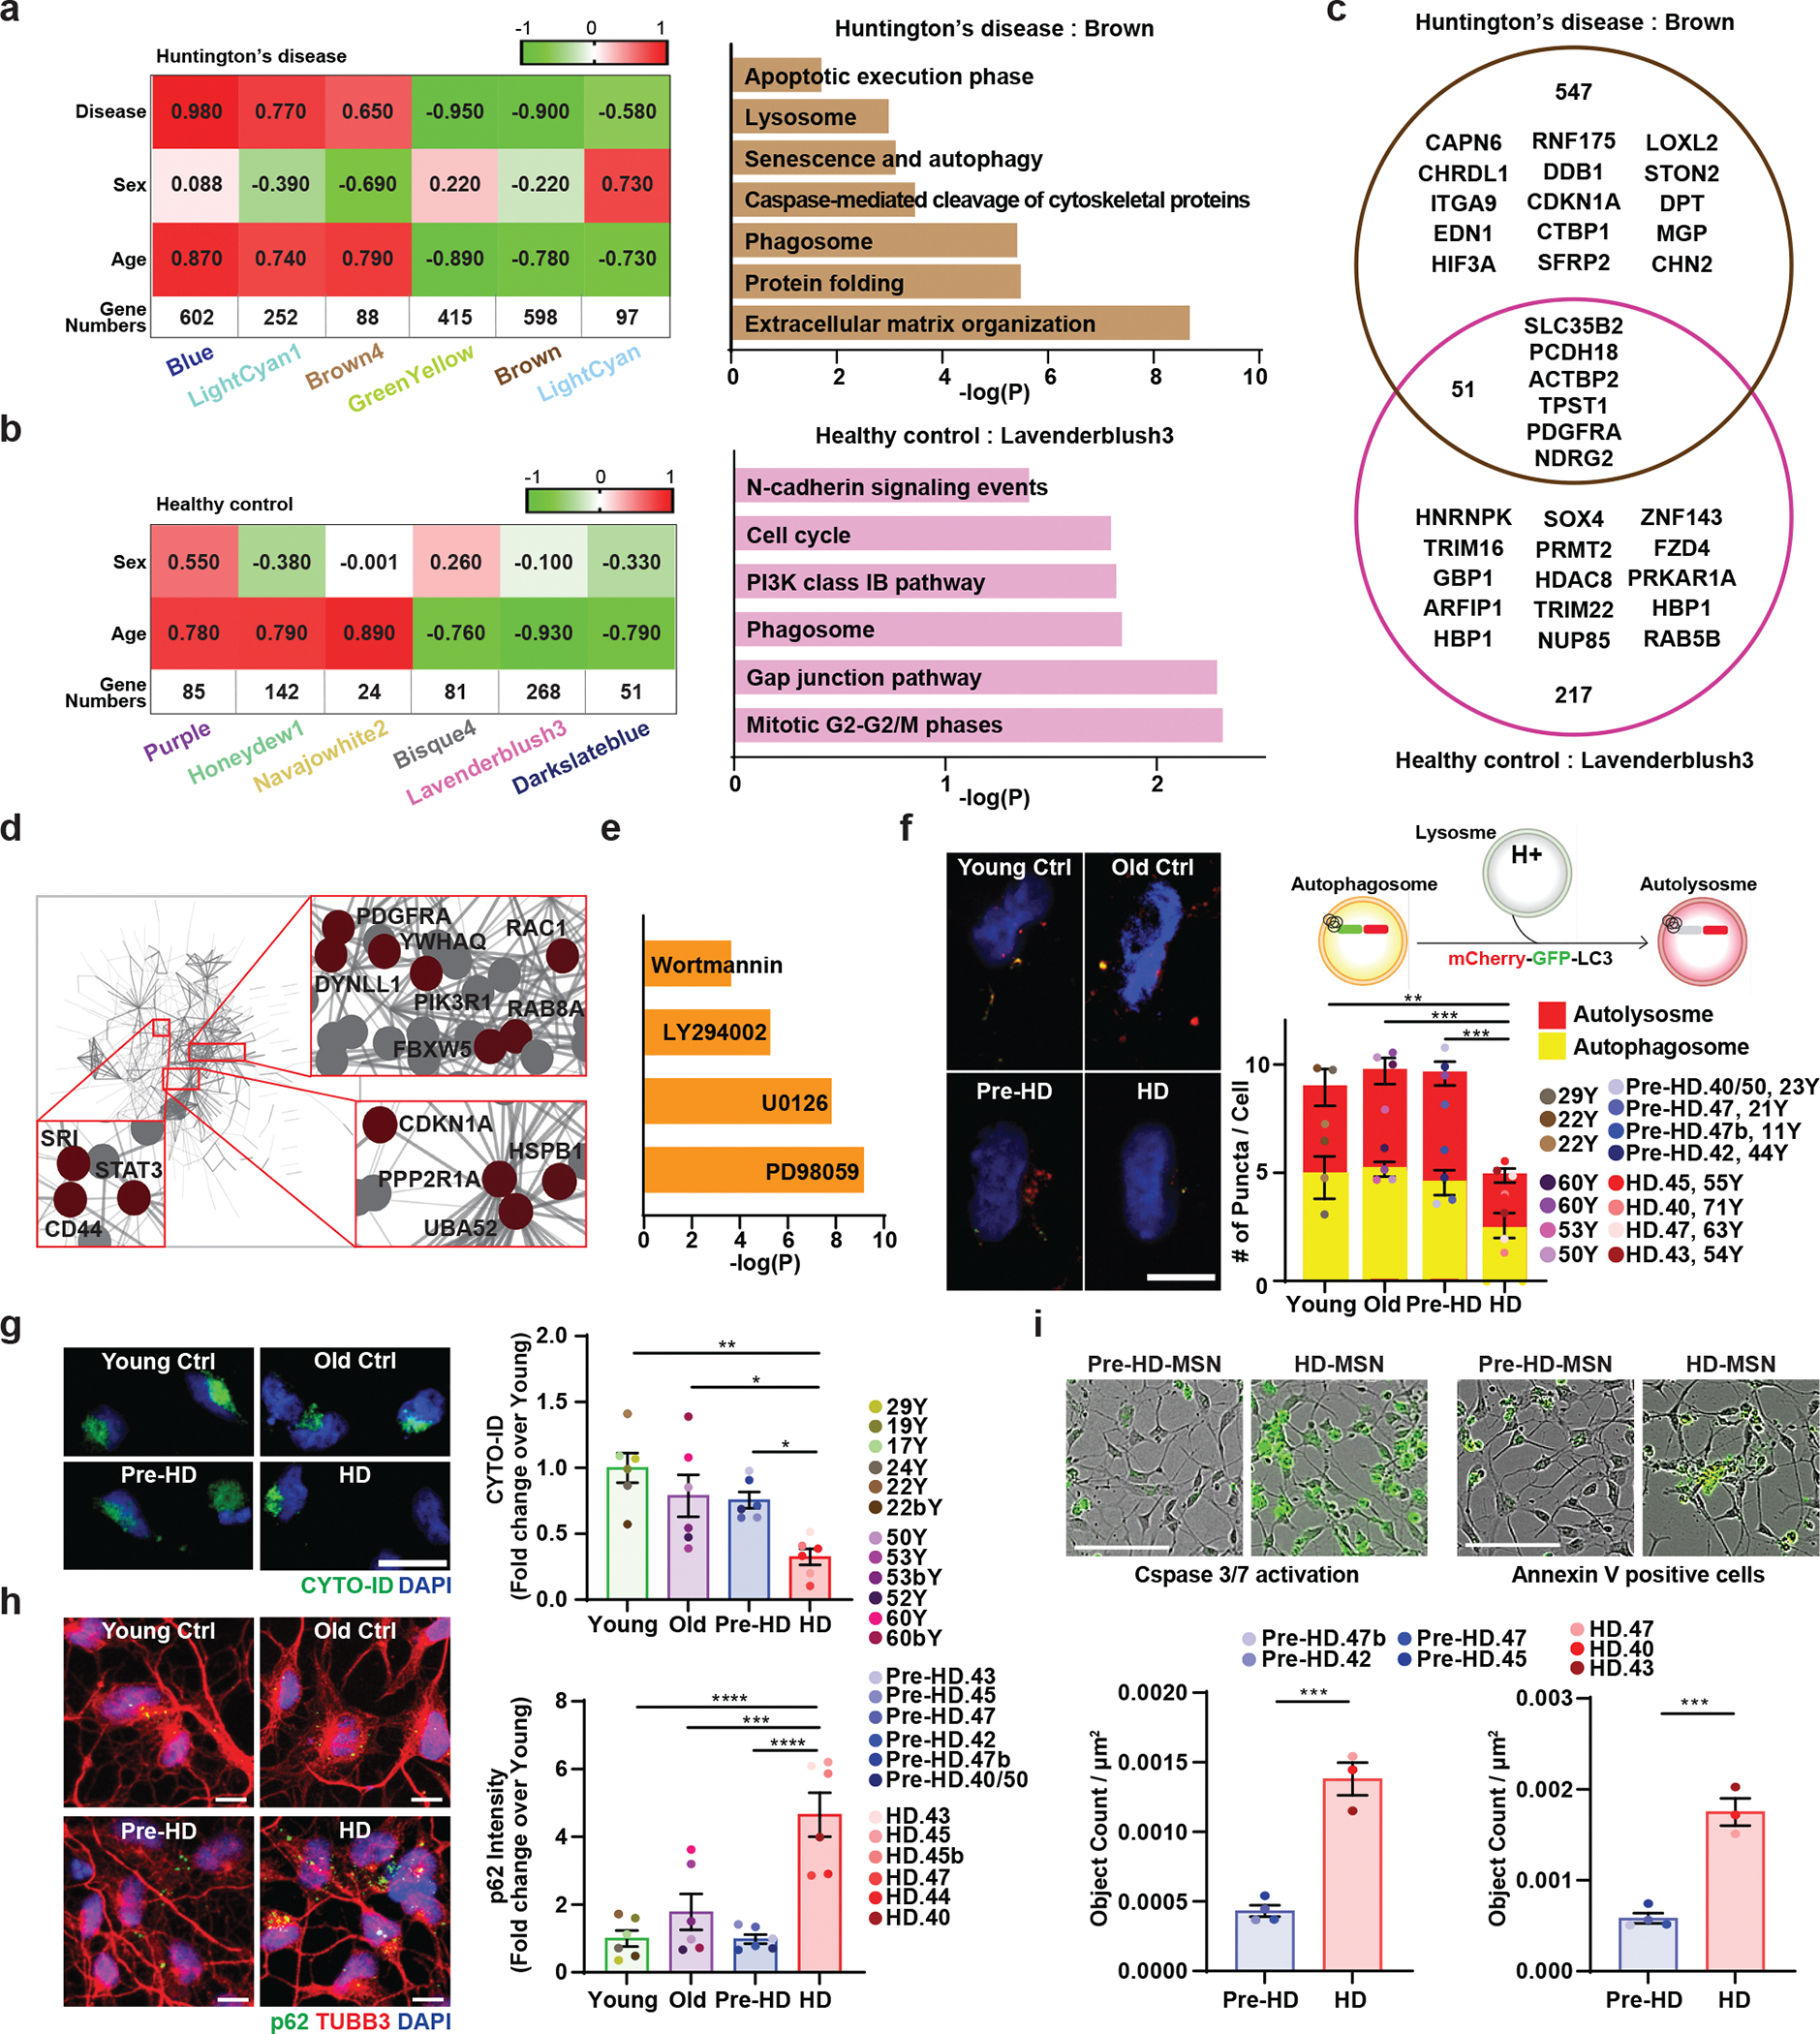
a. A heatmap of six gene modules associated with age and disease stage of HD (left). Pathways enriched in downregulated genes (log2FC<−1) in the brown module by BioPlanet analysis (right). b. A heatmap of six modules associated with age in Ctrl-MSNs from young and old healthy individuals (left). Pathways enriched in downregulated genes (log2FC<−1) in the lavenderblush3 module by BioPlanet analysis (right). c. Venn diagram of the number of gene members from the brown module either overlapping or distinct from gene members in the lavenderblush3 module from control groups. The diagram also contains several representative genes. d. Protein-Protein interaction network of the brown module. e. Chemical compounds are predicted as upstream regulators of the brown module by Ingenuity Pathway Analysis (IPA). f. Left: representative images of MSNs expressing the tandem monomeric mCherry-GFP-LC3 reporter. Right: quantification of autophagosome (i.e., mCherry+, GFP+ puncta) and autolysosome (i.e., mCherry+, GFP− puncta) compartments in MSNs from multiple HD patients and control individuals. Measurements were performed in cells having at least 3 puncta per cell (from more than 50 cells per MSN line, n=15 individual’s reprogrammed MSNs, Young vs. HD p=0.0026, Old vs. HD p=0.0004, Pre-HD vs. HD p=0.0004). g. Representative images (left) and quantification of CYTO-ID green signals in MSNs from multiple HD patients and control individuals (right) at PID 26 (n=24 individual’s reprogrammed MSNs, Young vs. HD p=0.0023, Old vs. HD p=0.0491, Pre-HD vs. HD p=0.0465). h. Reprogrammed cells immunostained for p62 and TUBB3 (right) and quantification of p62 intensity per cell in MSNs from independent HD and healthy control lines (n=24 individual’s reprogrammed MSNs, Young vs. HD p<0.0001, Old vs. HD p=0.0009, Pre-HD vs. HD p<0.0001). i. Representative images (top) and quantification (bottom) of neuronal apoptosis in pre-HD-MSNs and HD-MSNs (four pre-HD-MSN lines and three HD-MSN lines). The green signal represents Caspase 3/7 activation (PID 26) and Annexin V signal (PID 30), (n=7 individual’s reprogrammed MSNs, left p=0.0003, right p=0.0004). For all figures shown, statistical significance was determined by one-way ANOVA (f,g,h) and two-tailed unpaired t-test (i). ****p<0.0001, ***p<0.001, **p<0.01, *p<0.05. Scale bars in f,h 10μm, g 20μm; i 100μm. Mean±s.e.m.
Pathway enrichment analyses of the brown module (598 genes, age and post-symptomatic onset) revealed pathways enriched for cell death-related terms, such as apoptosis and caspase, protein folding, and senescence and autophagy (Fig. 2a), whereas the greenyellow module (415 genes) contained genes for neuronal function, such as the BDNF signaling pathway and axon guidance (Extended Data Fig. 2c). The upregulated blue and lightcyan1 modules were enriched for other cellular functions, such as cholesterol biosynthesis, neurotransmitter release cycle, and neuronal system (Extended Data Fig. 2c). Altogether, we found the brown module to represent the downregulated gene network that most closely resembled the degeneration phenotype in HD-MSNs compared to pre-HD-MSNs.
Age-associated gene networks in HD-MSNs and Ctrl-MSNs
Because the module-trait analysis of WGCNA in HD samples identified modules that were similarly affected by the age and disease progression (Fig. 2a and Extended Data Fig. 2a), we asked whether similar gene groups would appear between healthy Ctrl-MSNs from young and older age groups similarly matched to pre-HD-MSN and HD-MSN groups, respectively. Of the modules associated with age and sex conditions, we found six modules that were correlated with age (p < 10−7) (Fig. 2b and Extended Data Fig. 2d) in Ctrl-MSNs. Three modules showed a correlation with downregulated genes in old Ctrl-MSNs, whereas three modules showed the opposite correlation (Fig. 2b). Pathway enrichment analysis for the downregulated lavenderblush3 module (which had the highest number of gene members, 268) revealed an enrichment for terms not directly related to degeneration, including, for example, cell cycle-related pathways and cadherin signaling (Fig. 2b). The upregulated module, honeydew1 was enriched for terms such as potassium channel and neuronal system (Extended Data Fig. 2e). Next, we performed the module preservation analysis28, to test whether the gene modules detected in HD-MSNs would be manifested in healthy control gene expression data. Four modules (brown, blue, greenyellow, and lightcyan1) that were most highly correlated with age and disease stage in HD show respectively no or weak preservation across all healthy groups with Z summary statistic less than 8.0 (Extended Data Fig. 2f). These results demonstrate that the HD modules reflect gene members more severely affected in pre- vs post-HD compared to young and old healthy control groups. Comparing the gene members from the age-/HD-associated brown module to the lavenderblush3 module from healthy controls showed neuronal death- and autophagy-related terms pronounced only in HD-MSNs. This is consistent with only 7% of the genes common between brown and lavenderblush3 modules (Fig. 2c), and age-associated gene network changes in HD-MSNs are distinct from the age module in Ctrl-MSNs (Fig. 2a and 2b).
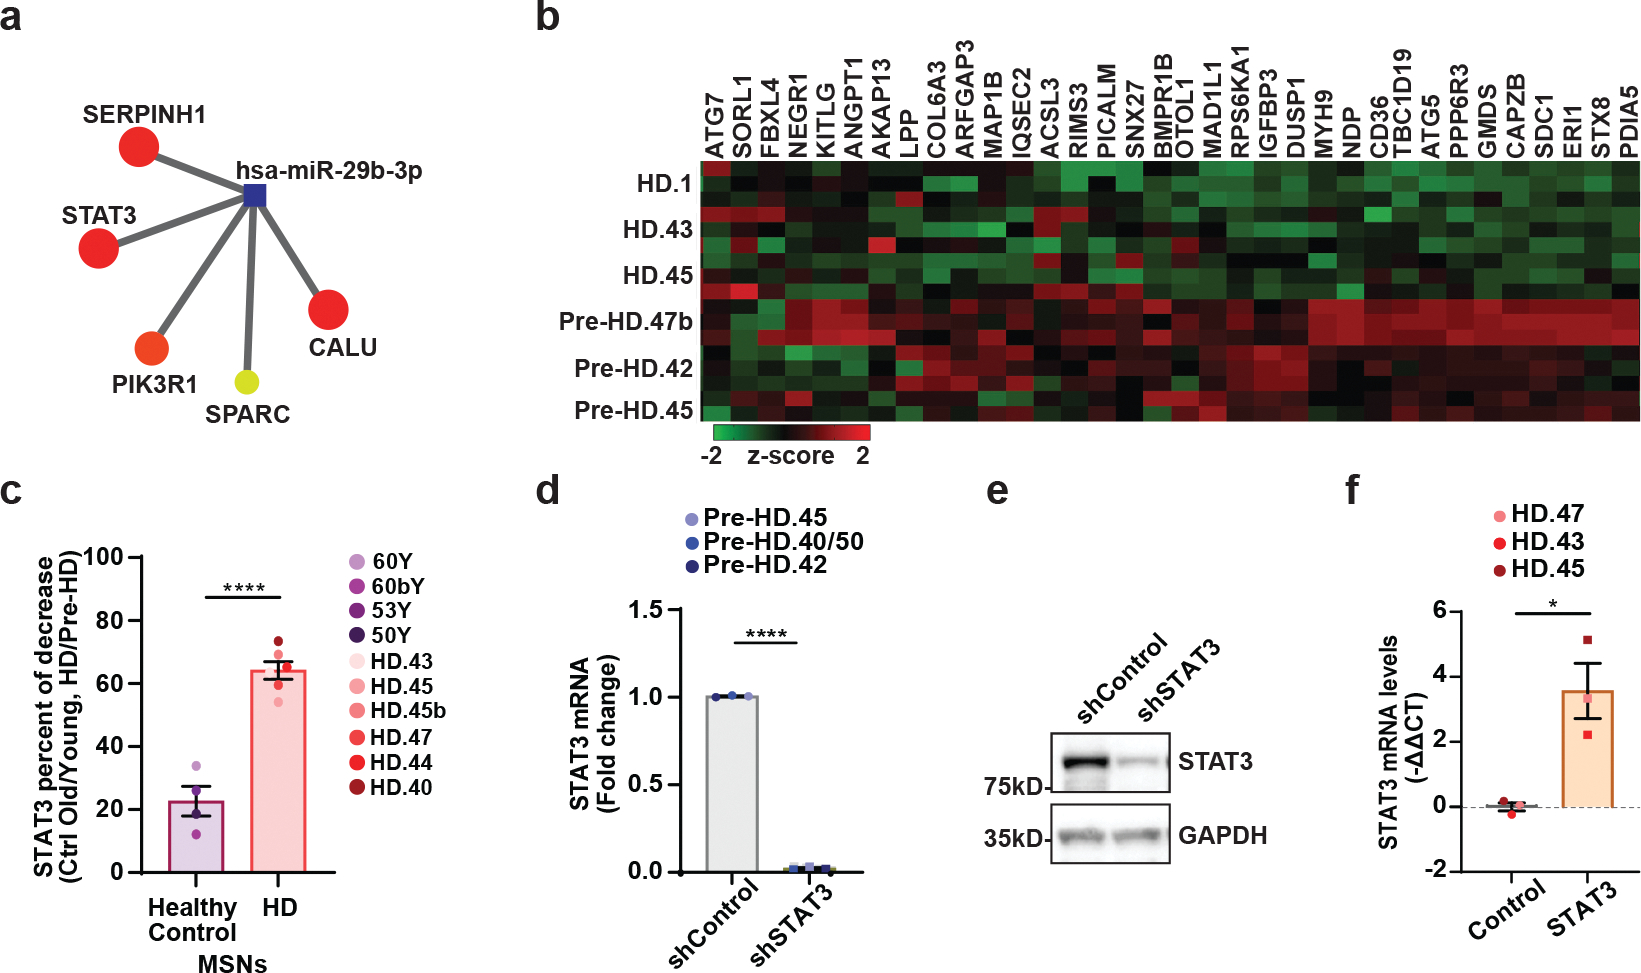
Because of the large number of genes and high correlation with both age and pathology onset in HD-MSNs, we elected to focus on the brown module to further dissect the relationship between gene members of the module. We integrated the coexpression dataset with a protein–protein interactions (PPI) network based on the experimental database of human protein–protein interactions (STRING interaction network) (Fig. 2d). One of the hubs in the brown module is signal transducers and activators of transcription 3 (STAT3) that regulate the balance between autophagy and cell death29–31. Other hub proteins include RAB8A, RAC1, and PIK3R1 that play roles in regulating autophagy and cell death32–34, as well as cell cycle regulators CDKN1A and UBA5235,36 (Fig. 2d). Also, Upstream Regulator Analysis of the brown module by IPA predicted small molecule inhibitors of autophagy as upstream effectors, indicating that HD-MSNs behave as if they had been treated by compounds that compromise autophagy (Fig. 2e).
Autophagy impairment in HD-MSNs
Reflecting gene expression differences, we asked whether pre-HD-MSNs and HD-MSNs would exhibit differential autophagy functions at a cellular level. First, we used tandem monomeric mCherry-GFP-tagged LC3, previously shown to distinguish prefusion autophagic compartments from mature acidic autolysosomes based on the differential pH sensitivity of GFP versus mCherry37. Notably, HD-MSNs from multiple symptomatic patients showed a reduction in the average number of pre-fusion autophagosomes (mCherry-positive; GFP-positive) and post-fusion autolysosomes (mCherry-positive; GFP-negative) per cell compared to pre-HD-MSNs and Ctrl-MSNs (both young and old) (Fig. 2f and Extended Data Fig. 2g), suggesting an overall and specific decrease in autophagy in HD-MSNs. We also performed CYTO-ID assay, a fluorescence-based live-cell assay for accumulated autophagic vacuoles, and immunostaining of p62/SQSTM1, a marker widely used to monitor autophagic activity due to its binding to LC3 and degradation during autophagy38. HD-MSNs consistently showed lower CYTO-ID signals (Fig. 2g) and increased levels of p62/SQSTM1 compared to pre-HD-MSNs and young and old Ctrl-MSNs (Fig. 2h and Extended Data Fig. 2h for a close-up view). The difference in p62 between pre-HD-MSNs and HD-MSNs was also validated by immunoblot assay (Extended Data Fig. 2i). Because caspase activation has been detected in HD6,39–44 and cell death-related pathways (apoptosis and caspase) were enriched in the brown module, we also compared the levels of caspase activation between pre-HD-MSN and HD-MSNs. Live-cell monitoring of Caspase-3/7 Green Dye staining and Annexin V signal (an apoptotic marker via its ability to bind to phosphatidylserine on the extracellular surface) showed significantly higher levels of caspase activation by PID26 and apoptotic signal by PID30 (Fig. 2i). These results altogether indicate a significantly lower level of autophagy activity and increased cell death marks in HD-MSNs compared to pre-HD-MSNs and young and old Ctrl-MSNs.
Autophagy inhibition induces degeneration of pre-HD-MSNs
To test the potential link between autophagy reduction and the onset of MSN degeneration, we treated pre-onset HD-MSNs (pre-HD-MSNs, which normally lack the degeneration phenotype compared to HD-MSNs) with LY294002, a compound that inhibits PI3K and autophagy45. LY294002 decreased the CYTO-ID signals and increased p62/SQSTM1 expression in young Ctrl-MSNs and pre-HD-MSNs (Fig. 3a, 3b and Extended Data Fig. 3a). Additionally, the average number of autophagosomes and autolysosomes was decreased by LY294002 in pre-HD-MSNs expressing the mCherry-GFP-LC3 reporter (Extended Data Fig. 3b), confirming the activity of LY294002 in inhibiting autophagy in reprogrammed MSNs. Importantly, LY294002 specifically elevated neuronal cell death of pre-HD-MSNs, as assessed by SYTOX assay at PID30 (Fig. 3c). The detrimental effect of autophagy inhibition was specific for HD patient-derived neurons because treating Ctrl-MSNs from six independent healthy young individuals with LY294002 did not induce neuronal death (Fig. 3c). LY294002 also increased the caspase 3/7 activation signal at PID26 and neuronal cell death at PID30 as assessed by Annexin V staining (Fig. 3d and 3e). Furthermore, LY294002 treatment in pre-HD-MSNs significantly increased the number of cells with HTT inclusion bodies compared to the DMSO treatment (Fig. 3f).
Fig. 3. Autophagy inhibitor induces neurodegeneration of pre-HD-MSNs.
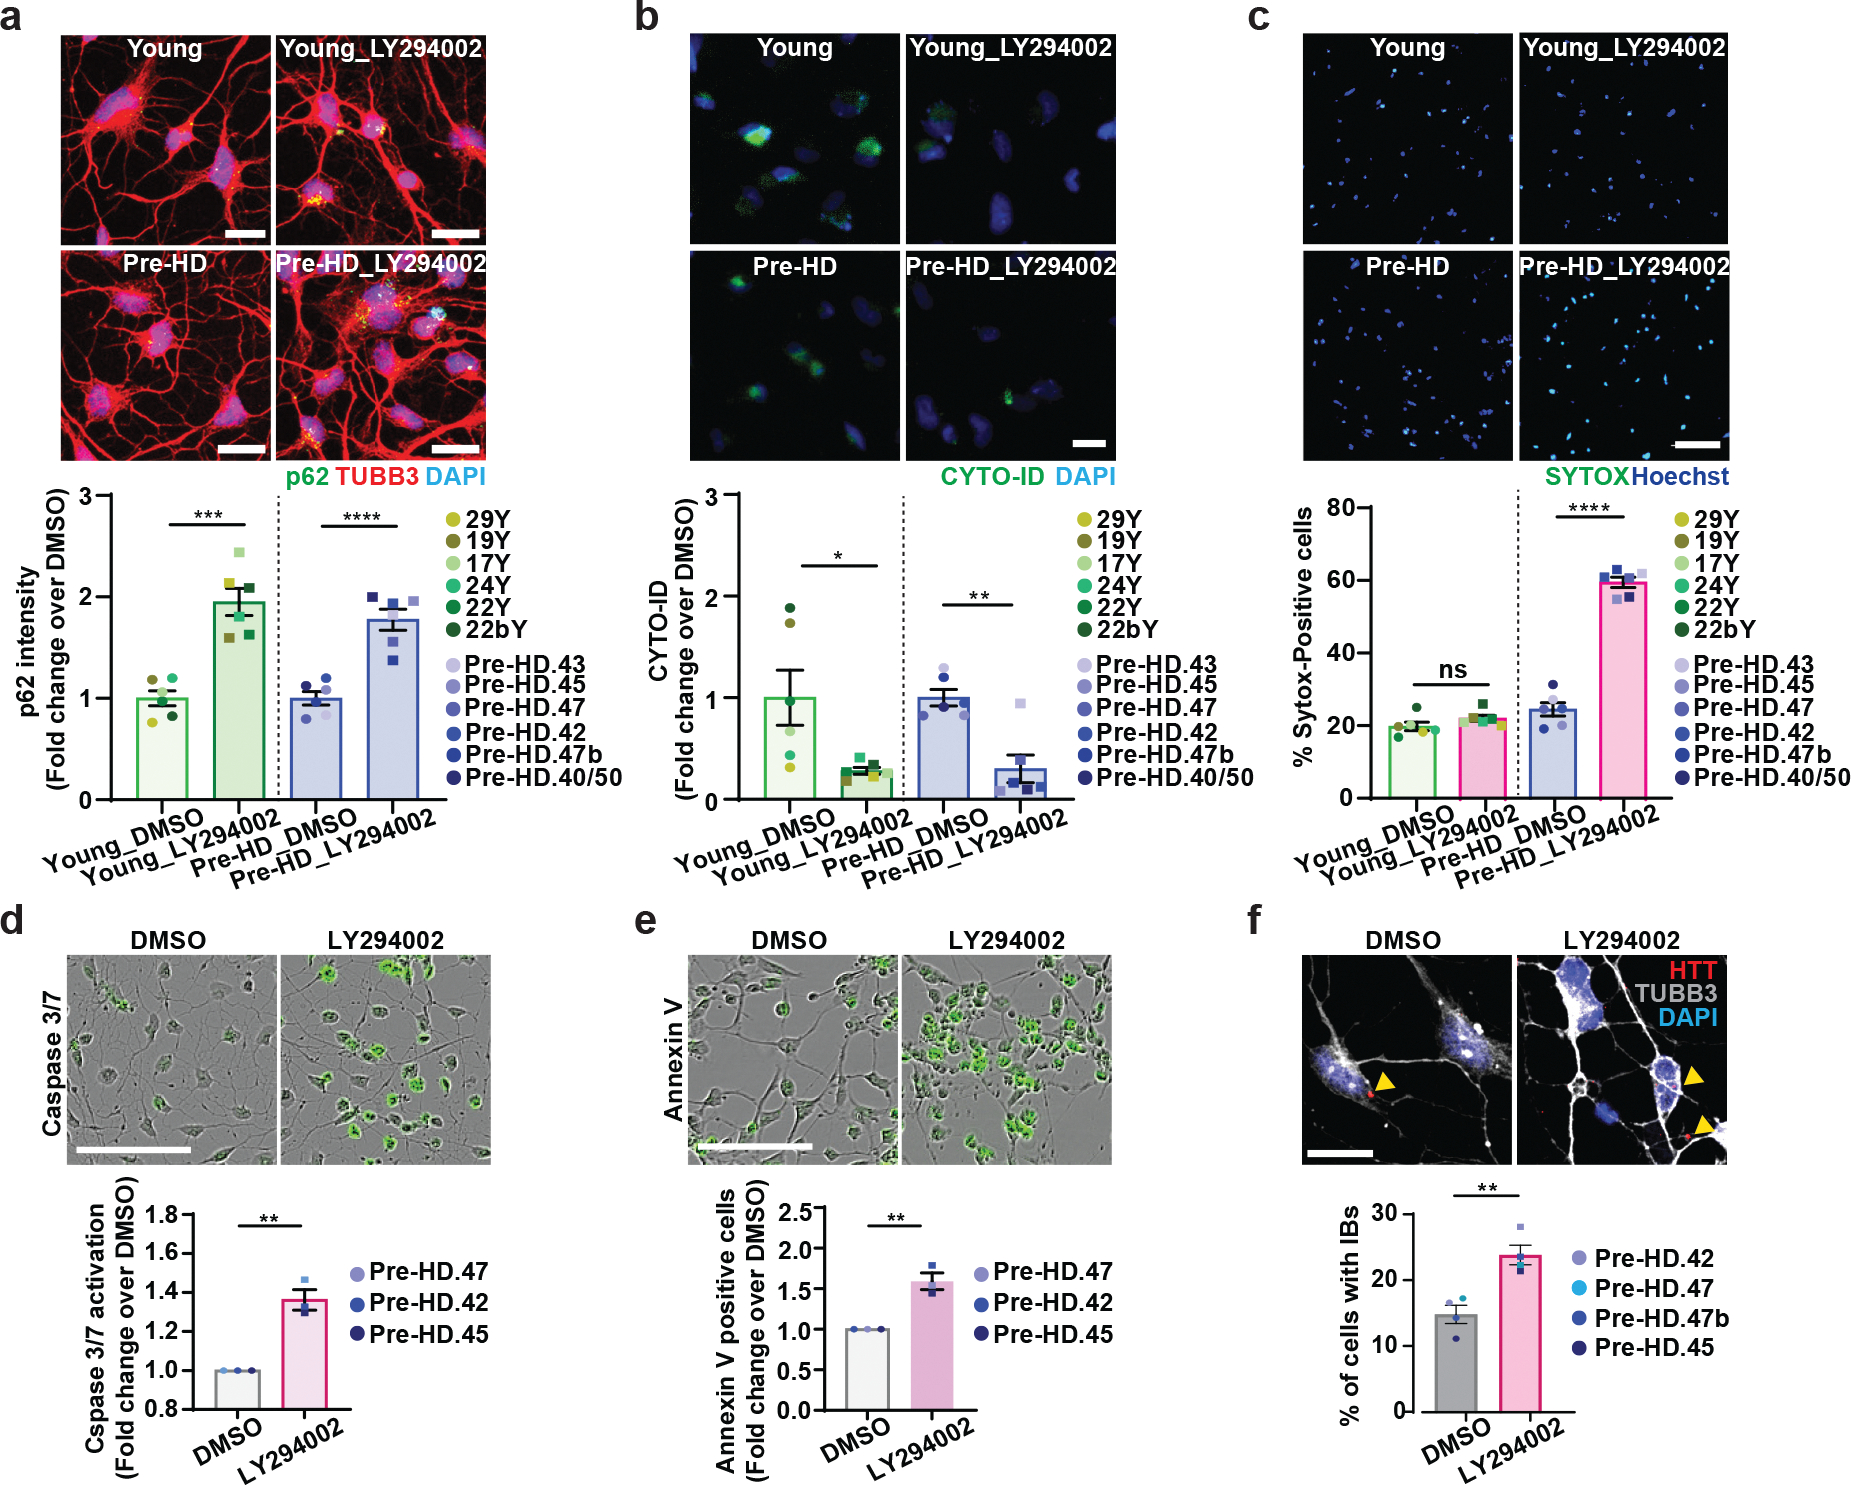
a-c, Representative images of p62 and TUBB3-positive cells (top) and quantification of p62 intensity per cell (bottom) at PID26 (a, n=12 individual’s reprogrammed MSNs, ***p=0.0001, ****p<0.0001), representative images of CYTO-ID green signals (top) and quantification of CYTO-ID signals per cell (bottom) at PID26 (b, n=12 individual’s reprogrammed MSNs, *p=0.0253, **p=0.0013), and representative images of SYTOX staining (top) and quantification of SYTOX-positive cells as a fraction of Hoechst-positive cells (bottom) at PID30 (c, n=12 individual’s reprogrammed MSNs, ****p<0.0001) from multiple healthy control young and pre-HD-MSNs treated with DMSO or 50 μM LY294002. d,e, Representative images (top) and quantification (bottom) of caspase activation (green) at PID 26 (d, n=3 individual’s reprogrammed MSNs, **p=0.0023) and Annexin V signal (green) at PID 30 (e, n=3 individual’s reprogrammed MSNs, **p=0.0045) from three pre-HD-MSN lines treated with DMSO or 50μM LY294002. f, Representative images (top) and quantification (bottom) of HTT inclusion bodies (IBs) present in pre-HD-MSNs treated with DMSO or 50μM LY294002 (four pre-HD-MSNs lines; DMSO: 3947 cells, 50μM LY294002: 4314 cells, PID30), (n=4 individual’s reprogrammed MSNs, **p=0.0075). For all figures shown (a-f), statistical significance was determined using two-tailed unpaired t-test; ****p<0.0001, ***p<0.001, **p<0.01, *p<0.05. Scale bars in a,b,f 20μm; in c,d,e 100μm. Mean±s.e.m.
Enhancing autophagy rescues HD-MSNs from degeneration
We then tested if overriding the autophagy deficiency in MSNs derived from symptomatic patients (HD-MSNs) would shift the degeneration state toward pre-HD-MSNs. For this, we developed a new analog of glibenclamide (GLB), a sulfonylurea drug that has been used broadly in clinics as an oral hypoglycemic agent. A GLB analog, G2, promoted autophagic degradation of misfolded α1-antitrypsin Z variant (ATZ) in mammalian cell models of α1-antitrypsin deficiency (ATD) disorder46,47. The new G2 analog (G2-115), designed to increase the potency of the compound (Fig. 4a and Extended Data Fig. 3c), decreased the steady-state levels of ATZ in a HTO/Z cell line model of ATD (Fig. 4b). G2-115 treatment in old Ctrl-MSNs and HD-MSNs increased the number of autophagic vacuoles as measured by CYTO-ID signals and decreased p62/SQSTM1 signal (Fig. 4c, 4d and Extended Data Fig. 3a). Also, G2-115 increased the average number of autophagosomes and autolysosomes in HD-MSNs expressing the mCherry-GFP-LC3 reporter (Extended Data Fig. 3b), verifying the autophagy-enhancing activity of G2-115 in HD-MSNs. Reprogrammed MSNs were then treated with G2-115 at PID14, a time point when reprogramming cells start adopting the neuronal identity13, followed by treatment every four days for 16 days. Importantly, G2-115 promoted HD-MSN survival in a dose-dependent manner reflected by the reduction of SYTOX signal (Fig. 4e). This beneficial effect was consistent in HD-MSNs from six independent patients and specific to HD-MSNs since age-matched Ctrl-MSNs already have lower levels of cell death (Fig. 4f). G2-115 also reduced Caspase 3/7, Annexin V signals and the number of HTT inclusion bodies in HD-MSNs (Fig. 4g, 4h and Extended Data Fig. 3d). These findings are interesting because in mouse embryonic fibroblasts harboring the repeat number in the range of 100, mutant HTT failed to be loaded into autophagosomes48. Our results, however, indicate that in MSNs derived from adult-onset patients with low repeat numbers, enhancing autophagy increased HD-MSNs’ ability to clear mHTT aggregation and resilience against neurodegeneration.
Fig. 4. Autophagy activator rescues HD-MSNs from degeneration.
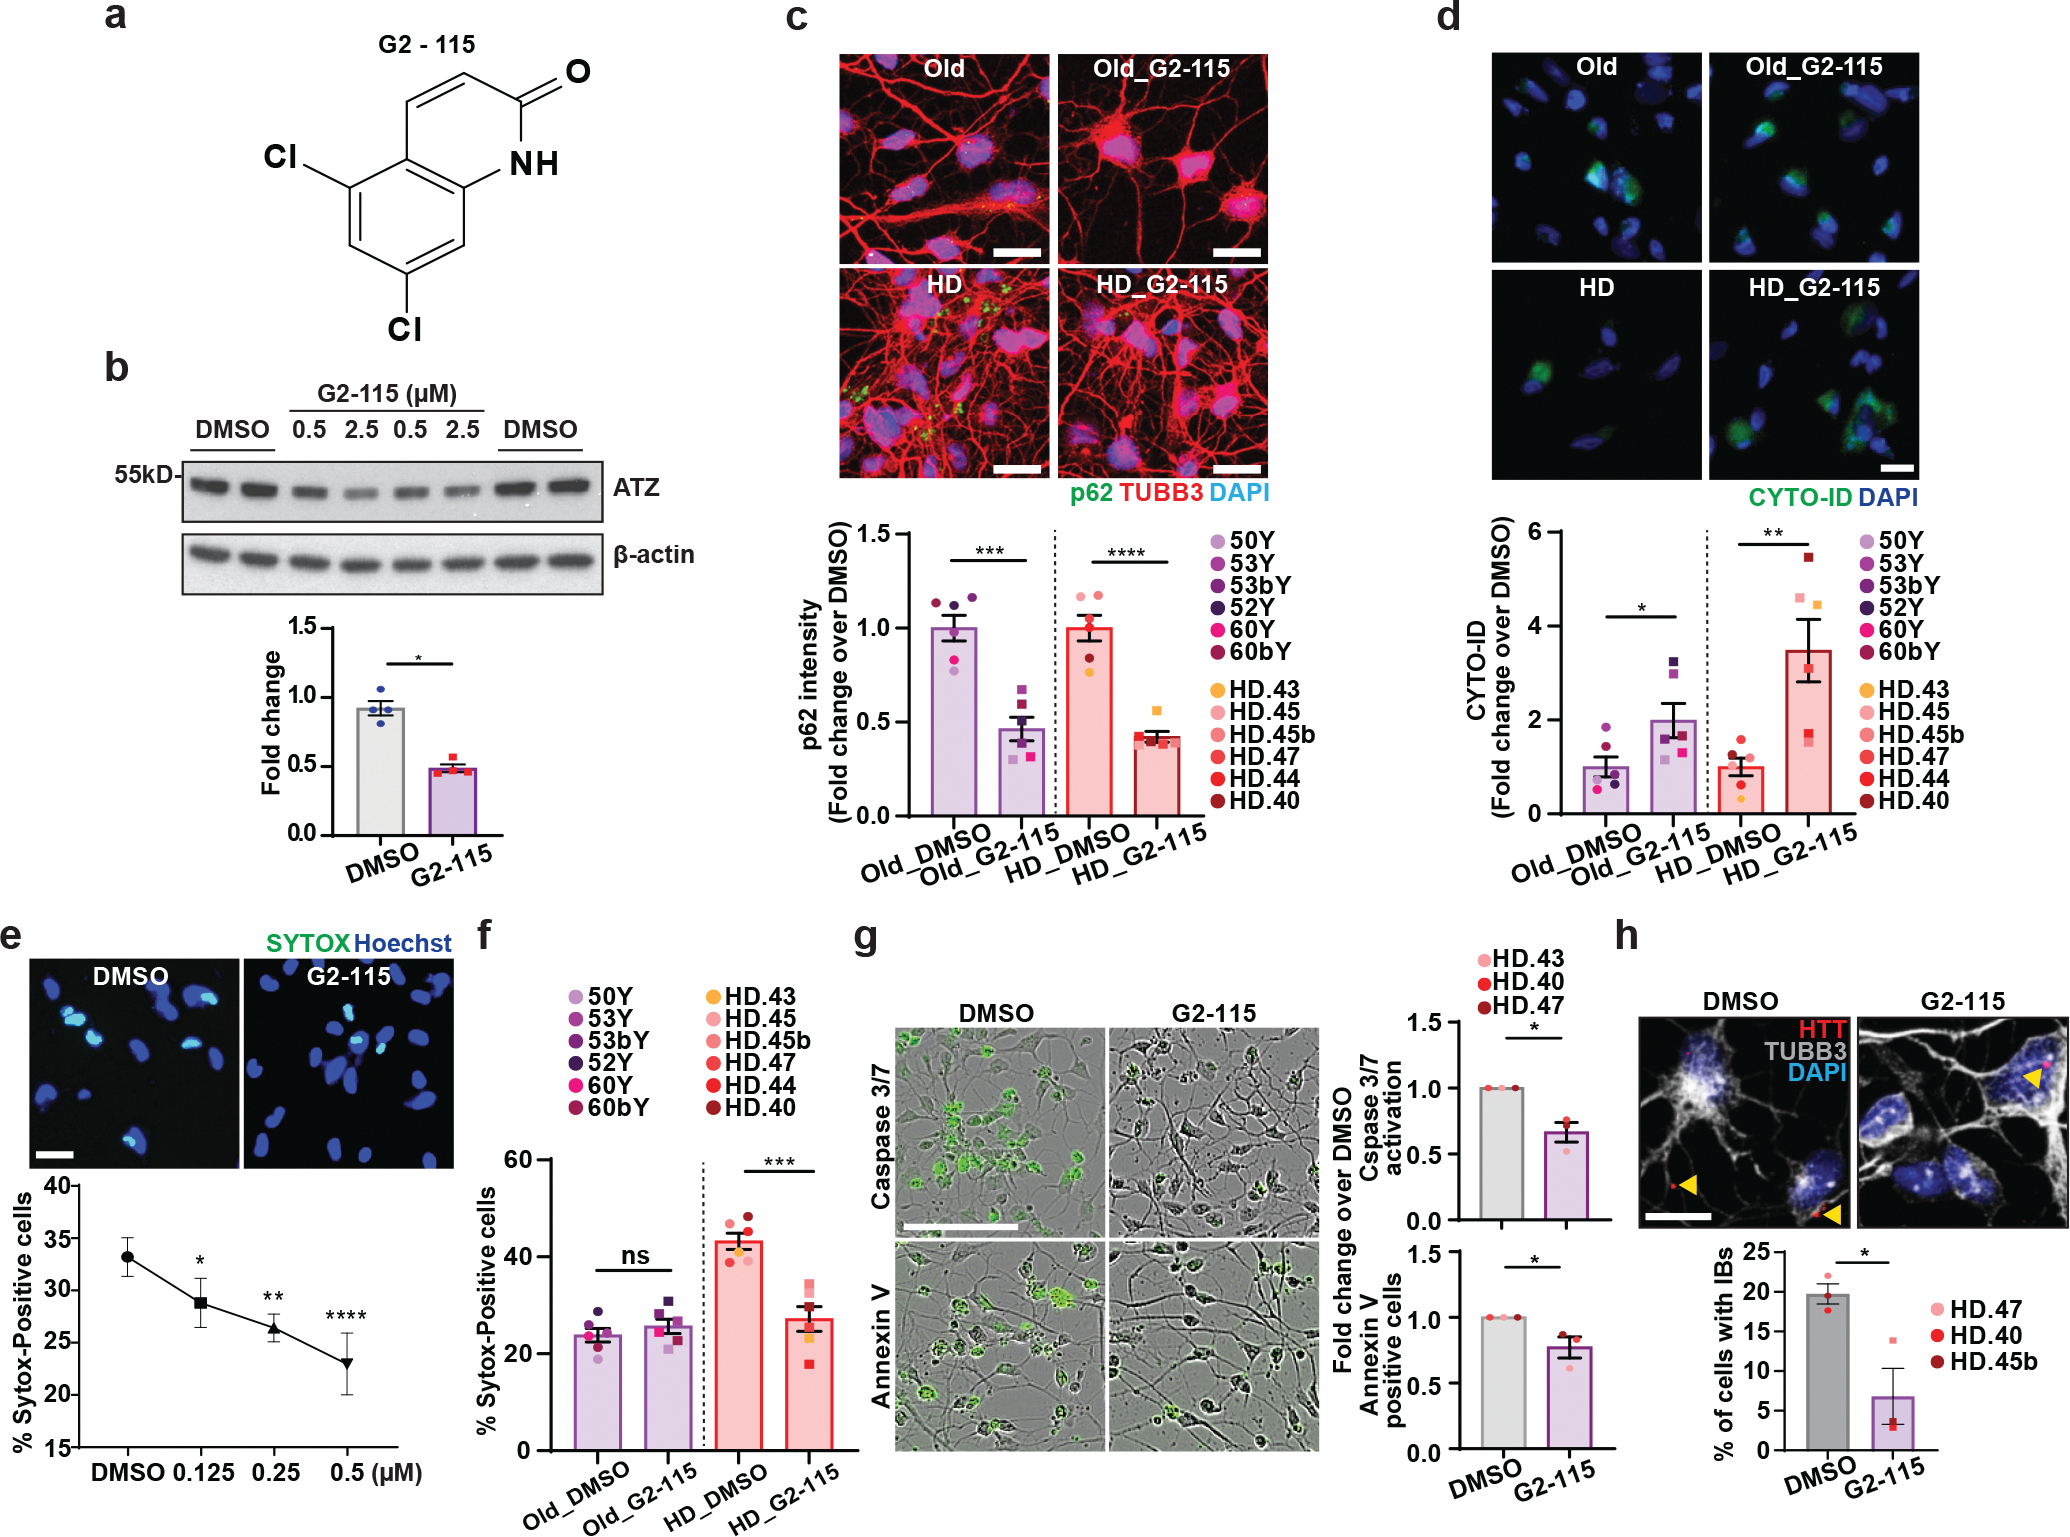
a, Chemical structure of G2-115. b, Representatives immunoblot (top) of steady-state levels of α1-antitrypsin Z variant (ATZ) and β-actin in the HTO/Z cell line model of α1-antitrypsin deficiency after 24 hr treatment with DMSO alone or G2-115 in DMSO at 0.5 and 2.5μM. The normalized intensity (bottom) was calculated from immunoblot images for 0.5μM versus DMSO control (Individual data plotted, n=4; *p=0.003 by t-test; Mean±s.e.m.). c,d, Representative images of p62 and TUBB3-positive cells (top) and quantification of p62 intensity per cell (bottom) at PID26 (c, n=12 individual’s reprogrammed MSNs, ***p=0.0002, ****p<0.0001) and representative images of CYTO-ID staining (top) and quantification of CYTO-ID green signals (bottom) at PID26 (d, n=12 individual’s reprogrammed MSNs, *p=0.0415, **p=0.0049) from multiple healthy control old and HD-MSNs treated with DMSO or 0.5 μM G2-115. e, Representative images (top) and quantification (bottom) of SYTOX-positive cells as a fraction of Hoechst-positive cells in HD-MSN treated with DMSO or different concentration of G2-115 (0.125, 0.25, or 0.5μM) (n=4, *p=0.0390, **p=0.0025, ****p<0.0001). f. Quantification of SYTOX-positive cells from multiple healthy control old and HD-MSNs treated with DMSO or 0.5μM G2-115 (n=12 individual’s reprogrammed MSNs, ***p=0.0004). g, Representative images (left) and quantification (right) of caspase3/7 activation (green) and Annexin V signal (green) from three independent HD-MSN lines treated with DMSO or 0.5μM G2-115 (n=3 individual’s reprogrammed MSNs, top *p=0.0105, down *p=0.0473). h, Representative images (top) and quantification (bottom) of HTT inclusion bodies from three independent HD-MSNs treated with DMSO or 0.5μM G2-115 (DMSO: 285 cells, 0.5μM G2-115: 325 cells) at PID30 (n=3 individual’s reprogrammed MSNs, *p=0.0326). For all figures shown (b-h), statistical significance was determined using two-tailed unpaired t-test; ****p<0.0001, ***p<0.001, **p<0.01, *p<0.05, ns, not significant. Scale bars in c,d,e,h 20μm; in g 100μm. Mean±s.e.m.
Differential chromatin accessibility between Pre- and HD-MSN
To further infer mechanisms underlying differential gene expression, we carried out comparative Omni-ATAC-seq49 to assess differences in chromatin state between pre-HD-MSNs and HD-MSNs. From six independent sex-matched lines of pre- and post-onset HD-MSNs, Omni-ATAC-seq was performed with two or three biological replicates of each MSN line at PID21. Of the total number of 213,045 peaks detected across samples, we identified 28,548 differentially accessible regions (DARs) (adjusted p<0.05, │log2FC│>0.5) between pre-HD-MSNs and HD-MSNs (13% of the total peaks). Of the total DARs, 14,673 DARs corresponded to chromatin regions that became more accessible (opened) and 13,875 DARs to regions that closed more in HD-MSNs. Focusing on DARs ± 2 kb around the transcription start site (TSS) identified 476 genes with increased and 490 genes with decreased ATAC signals in HD-MSNs compared to pre-HD-MSNs (adjusted p<0.05, │log2FC│>1) (Fig. 5a). Pathway analysis revealed that genes associated with DARs in HD-MSNs were enriched with aging-associated pathways, such as senescence and autophagy, FOXO family signaling, and oxidative stress (Fig. 5b). Examples of those genes include ATG16L1 and ATG10, which are involved in senescence and autophagy, and which show reduced chromatin accessibility in HD-MSNs compared to pre-HD-MSNs (Fig. 5c). Next, integrating the DEG list from the RNA-seq (adjusted p < 0.05, │log2FC│>1) with DAR-containing genes at the promoter region (2kb upstream) uncovered 110 upregulated and 253 downregulated genes that coincided with open and closed DARs, respectively (Extended Data Fig. 4a). Gene ontology analysis revealed that downregulated genes with closed DARs were associated with terms such as apoptosis and protein homeostasis, in contrast to upregulated genes with opened DARs (Extended Data Fig. 4b and 4c).
Fig. 5. Comparative analysis of chromatin accessibility between pre-HD- and HD-MSNs.
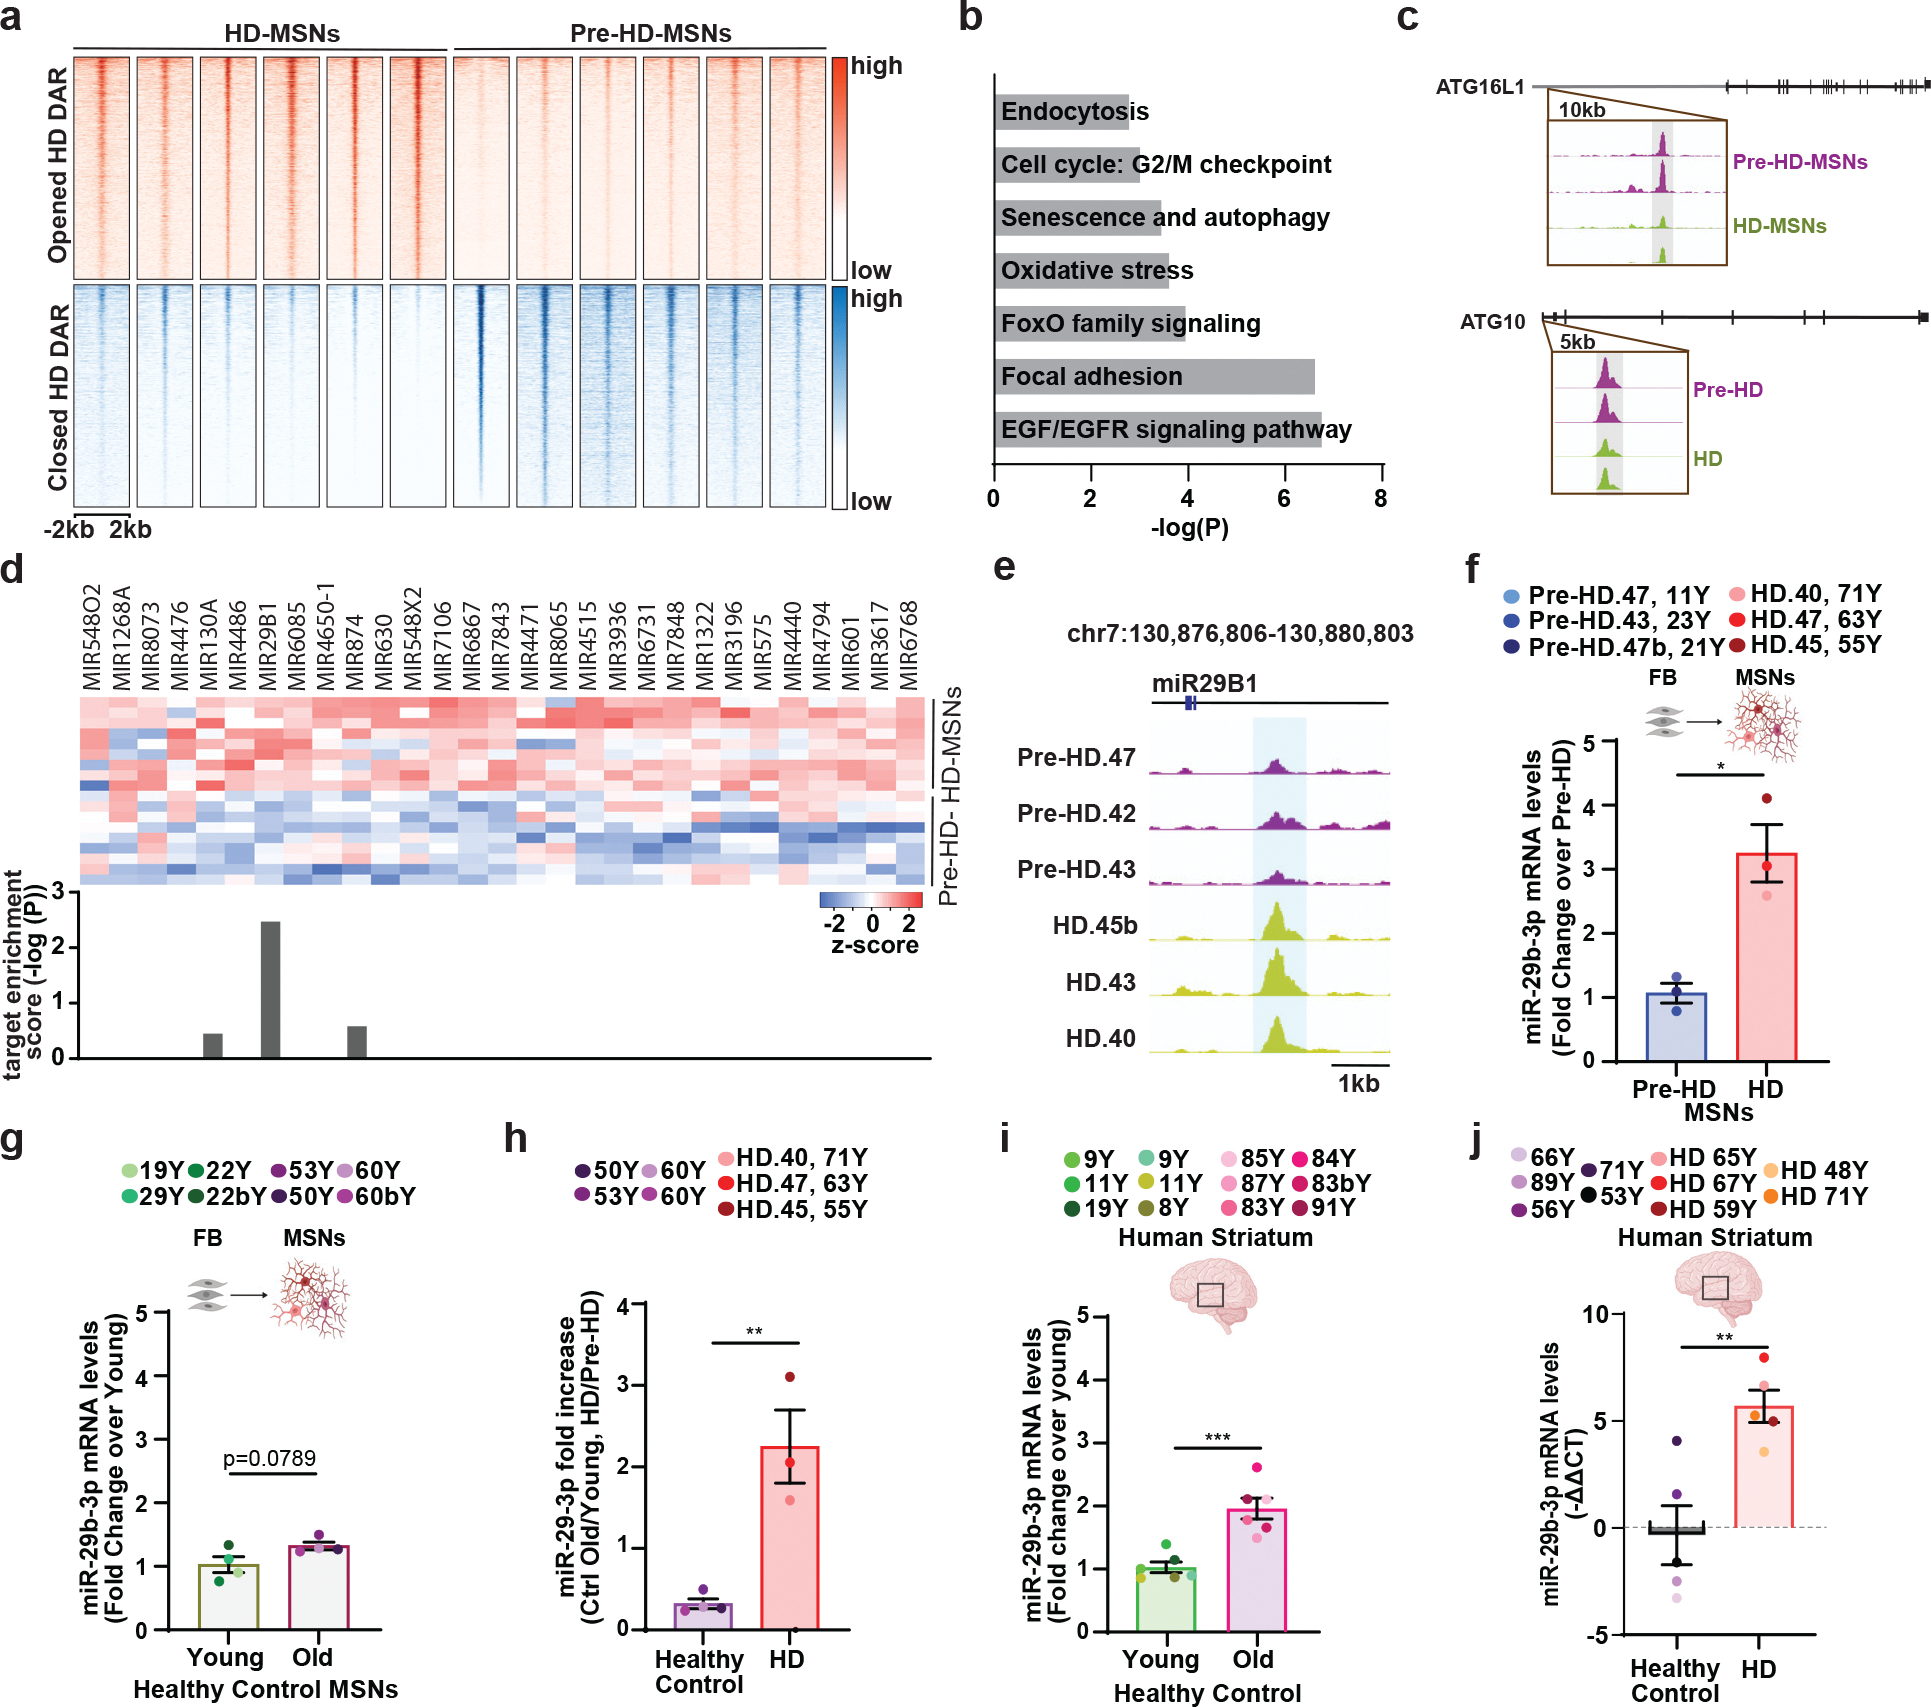
a, Heatmaps showing signal intensities of ATAC-seq peaks for DARs detected between pre-HD-MSNs and HD-MSNs at PID21 (adj. p<0.05, │log2FC│>1). b, Pathway enrichment for genes associated with DARs at promoter regions in pre-HD-MSNs and HD-MSNs at PID21 (adj. p<0.05) by BioPlanet analysis. c, Integrative Genomics Viewer (IGV) snapshots showing DAR peaks (blue highlight) are more accessible in pre-HD-MSNs (purple) compared to HD-MSNs (green). ATG16L1 and ATG10 are shown as these genes are involved in senescence and autophagy. d, Heatmap representation of ATAC-seq signal intensities for promoter regions of miRNA precursors opened in HD-MSNs. Target enrichment score (log(p-value)) of miRNA precursors for the brown module. e, Integrative Genomics Viewer (IGV) snapshots showing peaks enriched in HD-MSNs (green) over pre-HD-MSNs (purple) within miR29B1 (DAR highlighted in blue). f, RT-qPCR analysis of mature miR-29b-3p expression in three independent pre-HD- and HD-MSNs at PID 26 (*p=0.0100). g, RT-qPCR analysis of mature miR-29b-3p expression in four independent healthy control young and old Ctrl-MSNs at PID 26. h, Fold changes of increase of miR-29–3p levels in old versus young Ctrl-MSNs, and HD-MSNs versus pre-HD-MSNs, replotted from f and g (n=7 individual’s reprogrammed MSNs, **p=0.0039). i, RT-qPCR analysis of mature miR-29b-3p expression in human young striatum aged 8, 9, 11, and 19 years and human old striatum aged 83, 84, 85, 87, and 91 years (n=12 individual’s striatum, ***p=0.0005). j, RT-qPCR analysis of mature miR-29b-3p expression in human healthy control striatum (53, 71, 56, 89, and 66 years of age) and human Huntington’s disease patient’s striatum (59, 67, 48, 71 and 65 years of age), (n=10 individual’s striatum, **p=0.0050). For f-j figures shown, statistical significance was determined using two-tailed unpaired t-test; ***p<0.001, **p<0.01, *p<0.05. Mean±s.e.m.
miR-29b-3p drives autophagy impairment in HD-MSNs
Next, we investigated how DARs between pre-HD and HD-MSNs may underlie autophagy impairment and neuronal death in HD-MSNs. We performed the Upstream Regulator Analysis (IPA) for the brown module and lavenderblush3 module downregulated in HD-MSNs and aged Ctrl-MSNs, respectively. Of potential regulators predicted across the modules, SMAD3 and TWIST1 encode transcription factors, and four miRNAs were uniquely detected in the brown module (Extended Data Fig. 4d and 4e). However, transcript levels SMAD3 and TWIST1 remained unchanged in HD-MSNs according to the results from RNA-seq. As for miRNAs, target predictions by miRTarBase and TargetScan identified miR-29b-3p as the sole miRNA commonly detected across multiple prediction algorithms (Extended Data Fig. 4f). In genome-wide scanning, we also located DARs proximal to miRNA precursors (± 2 kb) between pre-HD-MSNs and HD-MSNs and identified 163 DARs (adjusted p<0.05, 61 opened and 102 closed). These DARs corresponded to 29 miRNA precursors with increased DARs and 82 precursors with reduced DARs in HD-MSNs over pre-HD-MSNs. As miRNAs could be upregulated to downregulate genes in the brown module, we focused on precursors that contained increased ATAC signals in HD-MSNs over pre-HD-MSNs (Fig. 5d). Of the 29 miRNA precursors containing increased DARs, miR29B1 was predicted to be the most significant regulator of the brown module determined by the relevance score (Fig. 5d). MiR29B1, which showed increased chromatin accessibility in HD-MSNs over pre-HD-MSNs (Fig. 5e), is a host gene of miR-29b-3p, a mature miRNA predicted as an upstream regulator of the brown module (Extended Data Fig. 4e and 4f). Finally, pathway analysis of miR-29b-3p target genes in the brown module showed association with senescence and autophagy (Extended Data Fig. 4g).
Age-associated expression of miR-29b-3p in HD
We thus tested whether miR-29b-3p, the mature miRNA from miR29B1, would be expressed higher in HD-MSNs compared to pre-HD-MSNs. In line with our hypothesis, miR-29b-3p expression was significantly increased in HD-MSNs over pre-HD-MSNs as measured by qPCR (Fig. 5f). Interestingly, there was a mild increase in miR-29b-3p in old Ctrl-MSNs over young Ctrl-MSNs (Fig. 5g). However, the extent of miR-29b-3p upregulation was significantly more pronounced in HD-MSNs over pre-HD-MSNs (210% increase), compared to old Ctrl-MSNs over young Ctrl-MSNs (20% increase) (Fig. 5h). Of note, the age-associated increase in miR-29b-3p was also observed in the striatum of human brain samples from six elderly, cognitively normal individuals (83, 84, 85, 87, and 91 years of age) over the striatum of six young healthy individuals (8, 9, 11, and 19 years of age) (Fig. 5i). Also, we compared miR-29b-3p levels in the basal ganglia sections from five independent HD patients and five healthy individuals and found that HD samples had higher levels of miR-29b-3p (Fig. 5j), consistent with a previous report that also identified miR-29b as a miRNA upregulated in the striatum of HD patients50. Taken together, we identified miR-29b-3p as a miRNA whose expression increases with aging, which becomes more exaggerated in HD-MSNs over pre-HD-MSNs with alterations in the chromatin accessibility.
miR-29b-3p inhibition protects HD-MSNs from degeneration
To investigate the involvement of miR-29b-3p in autophagy dysfunction, we carried out genetic perturbation experiments by either reducing or increasing miR-29b-3p expression. We found that the antisense power inhibitor of miR-29b-3p (Qiagen) was sufficient to reduce miR-29b-3p substantially in reprogrammed MSNs (Extended Data Fig. 5a). For overexpression, we constructed a lentivirus vector to overexpress the miR-29b precursor (Extended Data Fig. 5b and 5c). Overexpressing miR-29b-3p in pre-HD-MSNs decreased autophagy activity, whereas reducing miR-29b-3p in HD-MSNs increased autophagy activity compared to the scrambled control, as revealed by an increase in the CYTO-ID signal (Fig. 6a) and the average number of both autophagosomes and autolysosome signals from the tandem mCherry-GFP-tagged LC3 reporter (Fig. 6b). These results demonstrate that the autophagic state in HD-MSNs can be modified by altering miR-29b-3p levels, either pushing it towards the pre-HD state by miR-29-3p inhibition in HD-MSNs or towards HD-MSN state by overexpressing in pre-HD-MSNs. We then measured apoptotic signals in pre-HD- and HD-MSNs while altering the miR-29b-3p level. Overexpressing miR-29b-3p in pre-HD-MSNs significantly increased Caspase 3/7 and Annexin V signals compared to the control (RFP expression only), whereas inhibiting miR-29b-3p decreased Caspase 3/7 and AnnexinV signals in HD-MSNs (Fig. 6c and 6d). Because mHTT aggregation has been linked to autophagy51, we examined if altering miR-29b-3p would influence the amount of mHTT aggregation. Overexpressing miR-29b in three independent pre-HD MSN samples significantly increased mHTT aggregation compared to the control (Fig. 6e), whereas treating HD-MSNs with the miR-29b-3p inhibitor significantly reduced the number of cells with mHTT aggregation (Fig. 6f). These results collectively demonstrate that reducing miR-29b-3p promotes autophagy and alleviates HD-MSN from degeneration.
Fig. 6. Inhibition of miR-29b-3p enhances autophagy and rescues HD-MSNs from degeneration.
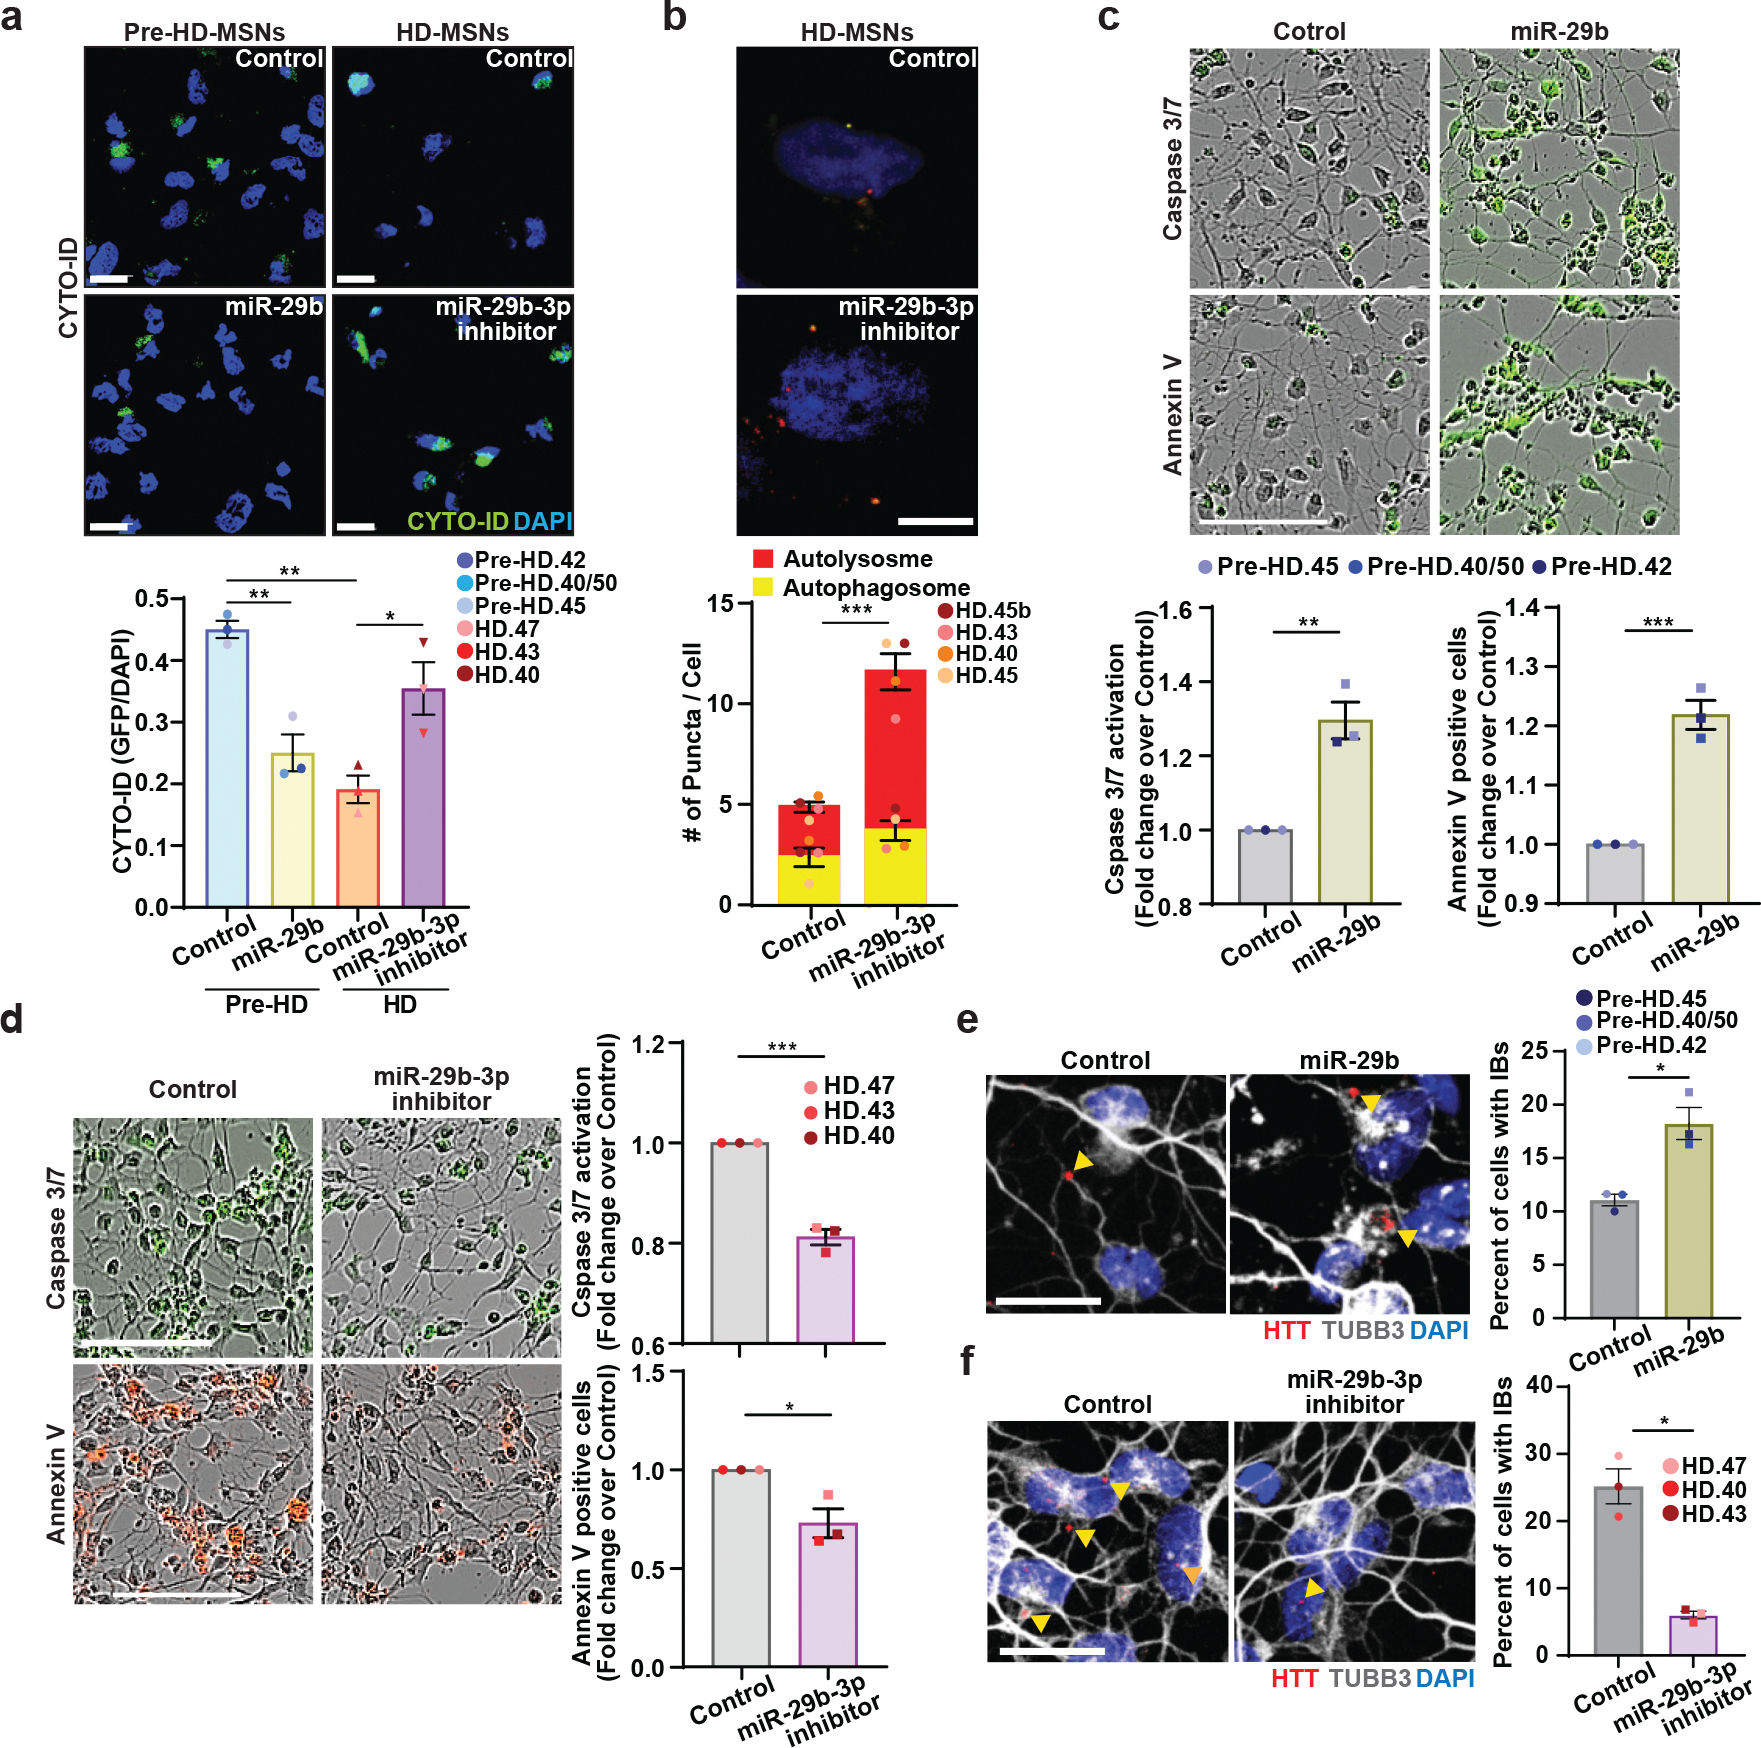
a, Representative images (top) and quantification (bottom) of CYTO-ID green signals from pre-HD-MSNs expressing control or miR-29b (control: 353 cells, miR-29b: 392 cells) and HD-MSNs with control or miR-29b-3p inhibitor (control: 380 cells, miR-29b-3p inhibitor: 421 cells) at PID26 (n=6 individual’s reprogrammed MSNs, Pre-HD Control vs. miR-29b **p=0.0054, HD Control vs. miR-29b-3p inhibitor *p=0.0172, Pre-HD Control vs. HD Control **p=0.0010). b, Representative images (top) of HD-MSNs expressing the tandem monomeric mCherry-GFP-LC3 reporter with control or miR-29b-3p inhibitor. Quantification (bottom) of autophagosome (i.e., mCherry+, GFP+ puncta) and autolysosome (i.e., mCherry+, GFP− puncta) compartments from four independent HD-MSNs. Measurements were performed in cells having at least 3 puncta per cell (from more than 50 cells per MSN line, ***p=0.0004). c,d, Representative images (top) and quantification (bottom) of caspase3/7 activation at PID 26 and Annexin V signal at PID 30 from three independent pre-HD-MSN lines expressing control or miR-29b (c, **p=0.0040, ***p=0.0009). Representative images (left) and quantification (right) of caspase3/7 activation at PID 26 and Annexin V signal at PID 30 from three independent HD-MSN lines with control or miR-29b-3p inhibitor (d, ***p=0.0003, *p=0.0209). e,f, Representative images (left) and quantification (right) of HTT inclusion bodies from three independent pre-HD-MSNs expressing control or miR-29b (e, *p=0.0355) (control: 437 cells, miR-29b: 389 cells) and three independent HD-MSNs with control or miR-29b-3p inhibitor (f, *p=0.0136) (control: 406 cells, miR-29b-3p inhibitor: 630 cells) at PID30. For all figures shown, statistical significance was determined using one-way ANOVA (a) and two-tailed unpaired t-test (b-f); ***p<0.001, **p<0.01, *p<0.05. Scale bars in b 10μm; in a, e, f 20μm; in c, d 100μm. Mean±s.e.m.
miR-29b-3p targets STAT3 to reduce autophagy in HD-MSNs
We then sought to define a critical target of miR-29b-3p responsible for autophagy reduction in HD-MSNs. Among the predicted target genes of miR-29b-3p in the brown module (Extended Data Fig. 6a), we focused on STAT3 for several reasons. First, searching for common sequence motifs within the chromatin regions significantly closed in HD-MSNs compared to pre-HD-MSNs identified a significantly enriched consensus sequence motif corresponding to the binding site of STAT3 (JASPER transcription factor database) (Fig. 7a). Second, STAT3 was identified as one of the autophagy-related hub genes in the brown module (Fig. 2d). Third, genes that contained STAT3 binding site in the closed DARs in HD-MSNs were enriched with genes associated with autophagy (Extended Data Fig. 6b); among 191 genes that contained STAT3 binding sites associated with closed DARs in HD-MSNs, 23% of them were linked to autophagy (adjusted p<0.05, log2FC≤−1), including ATG5 and ATG7 (Fig. 7b). Knocking down STAT3 in pre-HD-MSNs significantly decreased the expression of ATG5 and ATG7 over the shControl (Fig. 7c). Moreover, examining sequences within the 3′UTR of STAT3 revealed a seed-match sequence for miR-29b-3p, which appeared to be human-specific and not conserved in mice (Fig. 7d). We found that STAT3 is a direct target of miR-29b-3p as confirmed by a luciferase assay in HEK293Le cells in which miR-29b-3p expression effectively targeted the 3′UTR of STAT3 and reduced the luciferase activity, whereas point mutations in the seed-match sequence in STAT3 3’UTR abolished the targeting activity (Fig. 7d). Overexpressing miR-29b-3p in pre-HD-MSNs led to decreased expression of STAT3, whereas treating HD-MSNs with miR-29b-3p inhibitor increased STAT3 expression (Fig. 7e), further supporting the notion that miR-29b-3p regulates STAT3 as a direct target. Other targets of miR-29b-3p include FOS and SIRT152,53. However, these genes were not part of the brown module genes and differentially expressed genes between pre-HD-MSNs and HD-MSNs. In addition, while STAT3 mRNA was found to be lower in old Ctrl-MSNs over young Ctrl-MSNs, the degree of reduction was much more pronounced between pre-HD-MSNs and HD-MSNs (20% versus 60%) (Fig. 7f and Extended Data Fig. 6c).
Fig. 7. Inhibition of miR-29b-3p-STAT3 axis enhances autophagy and rescues HD-MSNs from degeneration.
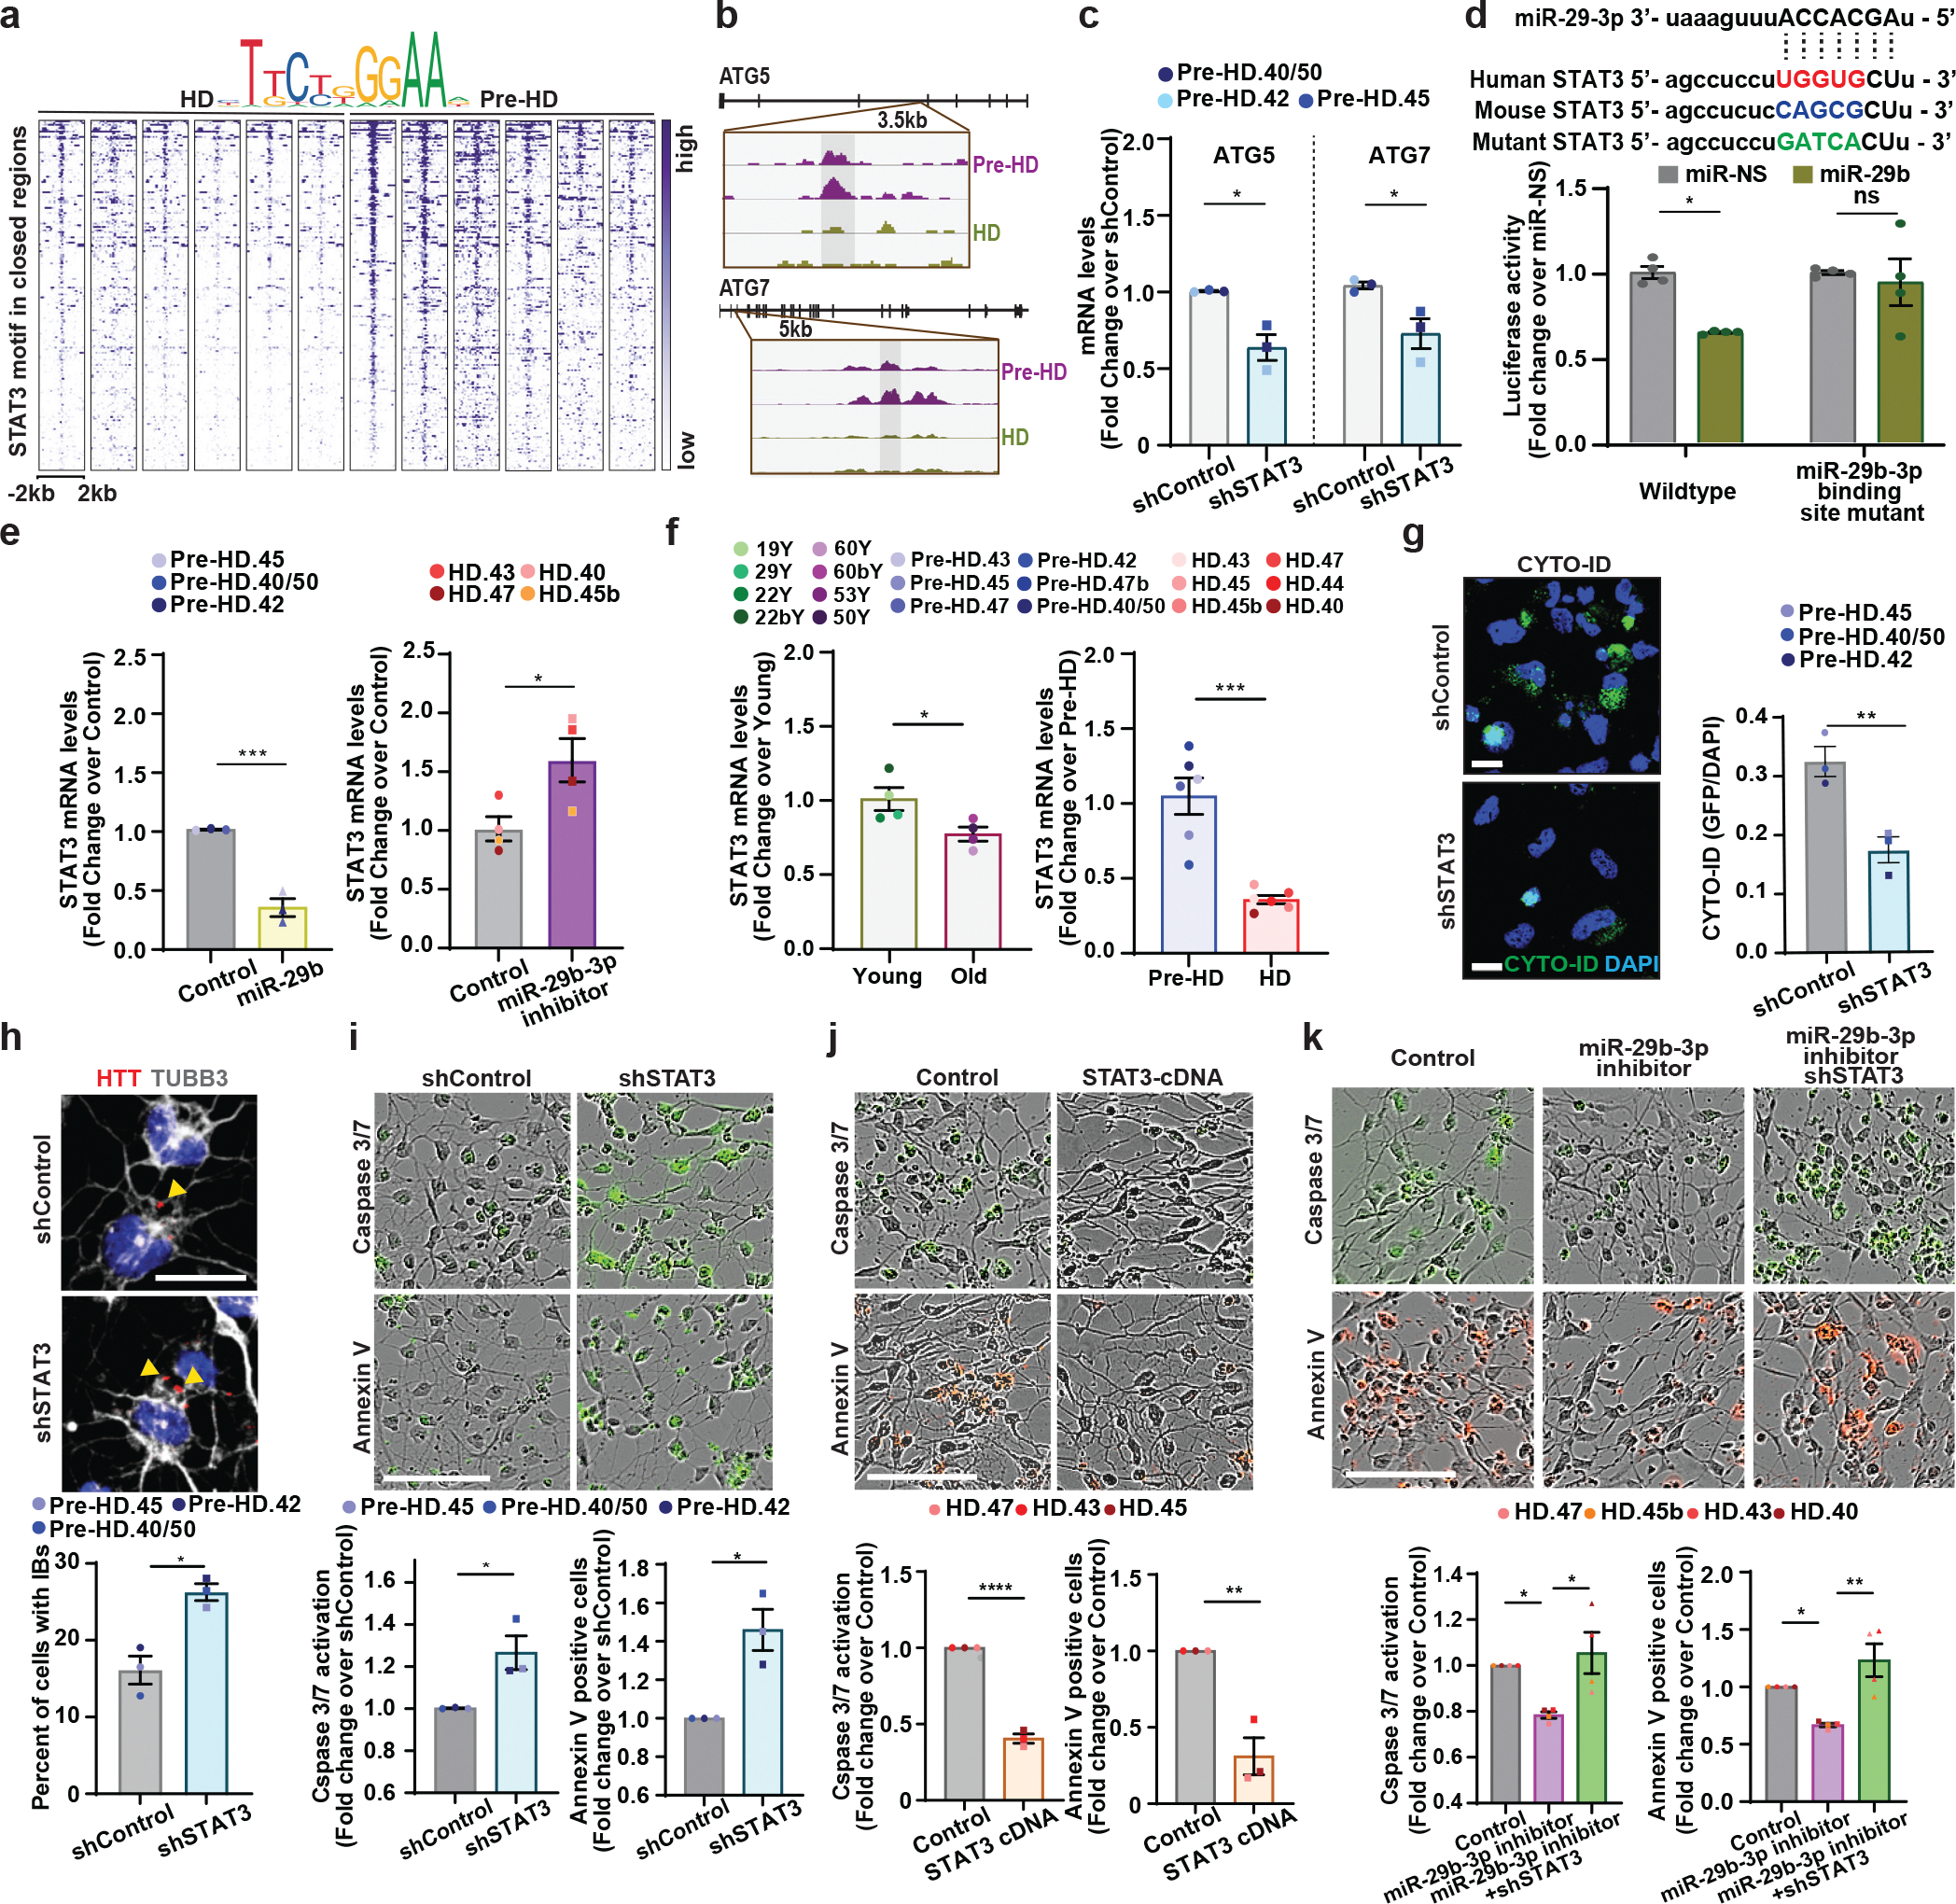
a, Heatmaps of STAT3 binding site intensity within chromatin loci closed in HD-MSNs. Legend depicts representative motifs for STAT3 binding sites. b, Integrative Genomics Viewer (IGV) snapshots showing DAR peaks (blue highlight) are more accessible in pre-HD-MSNs (purple) compared to HD-MSNs (green). ATG5 and ATG7 contained the STAT3 binding motif. c, RT-qPCR analysis of ATG5 and ATG7 mRNA levels in three independent pre-HD-MSNs expressing shControl or shSTAT3 at PID26. Each dot represents one individual’s reprogrammed MSN (ATG5 *p=0.011954, ATG7 *p=0.034887). d, Top: the sequence of miR-29–3p seeds in human and mouse STAT3 3’UTR and human STAT3 3’UTR mutant. Bottom: luciferase assays with HEK293Le cells co-transfected miR-NS or miR-29b-3p and wild-type or mutant of STAT3 3′UTRs containing point mutations to the seed-match regions of miR-29b-3p. The sample size (n) corresponds to the number of biological replicates (n=4, *p=0.0197). e, RT-qPCR analysis of STAT3 expression in three independent pre-HD-MSNs expressing control or miR-29b (left) and four independent HD-MSNs expressing negative control or miR-29–3p inhibitor (right) at PID26 (***p=0.0010, *p=0.0330). f, RT-qPCR analysis of STAT3 expression in four independent healthy control young- and old-MSNs, six independent pre-HD- and HD-MSNs at PID21 (*p=0.0395, ***p=0.0003). g, h, Representative images (left, top) and quantification (right, bottom) of Cyto-ID green signals (g, **p=0.0089) and HTT inclusion bodies (IBs) (h, *p=0.0300) from three independent pre-HD-MSNs expressing shControl or shSTAT3 (for Cyto-ID, shControl: 498 cells, shSTAT3: 404 cells. for HTT inclusion bodies, control: 260 cells, miR-29b: 346 cells). i, j, Representative images (top) and quantification (bottom) of caspase3/7 activation (green) at PID 26 and Annexin V signal (green or red) at PID 30 from three independent pre-HD-MSN lines expressing shControl or shSTAT3 (i, left *p=0.0306, right *p=0.0126) and three independent HD-MSN lines expressing control or STAT3 cDNA (j, left ****p<0.0001, right **p=0.0047). k, Representative images (top) and quantification (bottom) of caspase3/7 activation (green, left ****p<0.0001, right **p=0.0047) at PID 26 and Annexin V signal (red, left *p=0.0415, right *p=0.0133) at PID 30 from four independent HD-MSN lines expressing control, miR-29b-3p inhibitor or shSTAT3. Each dot represents one individual’s reprogrammed MSN in e,f,g,h,i,j,k. For all figures shown, statistical significance was determined using one-way ANOVA (c,k) and two-tailed unpaired t-test (d,e,f,g,h,i,j). ****p<0.0001, ***p<0.001, **p<0.01, *p<0.05, ns, not significant. Scale bars in g, h 20μm; in i, j, k 100μm; Mean±s.e.m.
We next investigated if STAT3 is involved in the regulation of autophagy activity in patient-derived MSNs. First, directly knocking down STAT3 by shRNA in pre-HD-MSNs (Extended Data Fig. 6d and 6e) decreased the autophagy activity (Fig. 7g), increased mHTT aggregation compared to the control (Fig. 7h), and increased apoptosis of pre-HD-MSNs (Fig. 7i), whereas overexpression of STAT3 cDNA in HD-MSNs rescued cells from neuronal death (Fig. 7j). While treating HD-MSNs with miR-29b-3p inhibitor led to decreased neuronal death, this effect was reversed by knocking down STAT3 in the presence of miR-29b-3p inhibitor (Fig. 7k). Overall, our results highlight the interaction between miR-29b-3p and STAT3 as an integral component driving HD-MSN degeneration.
Discussion
HD is an adult-onset disorder in most HD cases. Yet, age-associated pathways that contribute to the onset of HD pathology in patients have remained largely elusive. Elucidating such pathways, especially in the spectrum of human lifespan, has been a challenging task due to the inability to model the progression of HD pathology with patient neurons. We used directly reprogrammed MSNs from pre-symptomatic and symptomatic stages of HD to understand differences in cell-intrinsic properties that render HD-MSNs more vulnerable to degeneration than their pre-symptomatic counterparts. Given that the microRNA-mediated neuronal reprogramming occurs through step-wise processes of fibroblast fate erasure and adoption of the neuronal identity13, detecting differences in genetic networks as cells acquire MSN identity offers an experimental means to dissect gene expression and chromatin landscape changes in directly reprogrammed MSNs from different disease stages. In the current study, we identified age-associated upregulation of miR-29b-3p in HD-MSNs promotes HD-MSN degeneration by impairing autophagic function through human-specific targeting of STAT3 3’UTR. Blocking miR-29b-3p expression or chemically promoting autophagy rescued neurodegeneration of HD-MSNs, revealing an age-associated and neuron-intrinsic mechanism responsible for the onset of neurodegeneration.
The identification of reduced autophagy activities in HD-MSNs (from symptomatic patients) associated with transcriptome and chromatin changes allowed us to reveal the miR-29b-3p-STAT3 axis as a driver of HD-MSN degeneration linked to reduced autophagy. The role of autophagy in clearing mHTT aggregates was recently shown by the discovery of Beclin1 and autophagy related FYVE protein (ALFY) function that modifies the amount of mHTT aggregation51,54. Our results demonstrate the feasibility of enhancing autophagy and increasing MSN resilience against the mHTT-induced toxicity either by repressing miR-29b-3p or through pharmacological means. Of the target genes of miR-29b-3p, we identified STAT3 as a direct target whose reduced expression leads to chromatin closure for genes important for autophagy such as ATG5 and ATG7. Interestingly, the 3’UTR of STAT3 contains a seed-match sequence (UGGUGCU) for miR-29b-3p, which appears to be primarily in humans. Given our results highlighting the importance of STAT3 in maintaining autophagy, future work should be directed at defining the specificity of the miR-29b-3p-STAT3 interaction in different neuronal subtypes, including subtypes not affected by HD, which will provide insights into the differential vulnerability of neuronal cell subtypes to death in HD. Moreover, our findings demonstrating the importance of miRNA-target interaction that may be unique to humans lend further support for the use of patient cell-based modeling platforms.
Because miRNAs usually target not only a single gene, but multiple components of related pathways, the discovery of miRNAs as important modulators for disease pathology has expanded therapeutic opportunities for oligonucleotides, including potential drugs in clinical development, such as Miragen MRG-201, a miR-29 mimic, which is in phase 2 studies to treat keloid and scar tissue formation55,56. Based on the results shown for HD neurons, however, miRNA antagonist approaches should also be considered to mitigate the effect of the age-associated increase in miR-29b-3p, as detected in both reprogrammed MSNs and aged human brain samples. Interestingly, the DAR proximal to miR29B1 is predicted to contain binding motifs for FOXO1 and FOXA3, which warrants further investigations in the future due to their implications in aging (Extended Data Fig. 7a).
Activation of autophagy can successfully lower mHTT aggregations in mouse and human neuron models of HD51. However, how the impairment of autophagy arises during the adult-onset of HD in humans has remained poorly understood. Previous studies have indicated the potential of STAT3 as a regulator of autophagy activity via the transcriptional regulation of several autophagy-related genes29–31. In this current study, we provide evidence that in the context of human neurons, STAT3 reduction, due to miR-29b-3p, plays a critical role during the degeneration of HD patient-derived MSN. Based on these findings, further investigations into the use of autophagy enhancer compounds, such as the G2 analog or antisense oligo against miR-29b-3p, may eventually offer an effective therapeutic angle that could increase the resilience of MSNs against neurodegeneration in HD. Although the molecular target of drug action for the G2 analog is not known, our data provide proof-in-principle that the age-associated decline of autophagy in patients’ MSNs can be countered and alleviated by pharmacological interventions.
The current study isolated genetic pathways and differential neurodegenerative states that correlate with different stages of HD by focusing on phenotypes consistently manifested in MSNs reprogrammed from multiple patients’ samples. Interestingly, HD-specific phenotypes, such as increased cell death and decreased autophagy activity, were not detected in fibroblasts of post-onset, pre-onset HD patients, and healthy control samples. Also, the expression levels of miR-29b-3p and STAT3 were not different between healthy control, pre-HD, and HD fibroblasts, demonstrating the requirement of the directly reprogrammed MSN identity to reveal cellular pathologies and genetic networks underlying HD (Extended Data Fig. 7b). Extending these findings, future studies will be greatly facilitated by the availability longitudinally collected from the same patients before and after the onset of clinical symptoms to allow similar studies in multiple isogenic background. However, obtaining such samples remains challenging. Another avenue not pursued in the current study was to create genome-edited fibroblast lines to correct HTT mutation from HD patients due to the limited passage numbers of primary fibroblasts required for the clonal selection of gene-corrected cells. It is likely that future studies implementing direct neuronal reprogramming should benefit from the rapidly advancing genome-editing technologies that can further advance the modeling and defining pathogenic mechanisms of late-onset neurodegenerative disorders.
METHODS
Plasmids, shRNA, and Cell lines
The construction of all plasmids used in this study has been previously described7,10–17,19, and they are publicly available at Addgene as pTight-9-124-BclxL (#60857), rtTA-N144 (#66810), pmCTIP2-N106 (#66808), phMYT1L-N174 (#66809), phDLX1-N174 (#60859), phDLX2-N174 (#60860). Lentiviral human STAT3 shRNAs (TRCN0000329887) were obtained from Sigma. Lentiviral Vector human STAT3 cDNA (pLenti-GIII-EF1a, #456970610695) was obtained from Applied Biological Materials Inc. For visualize free autophagosomes (GFP and mCherry fluorescence) and autophagosomes, FUW mCherry-GFP-LC3 (# 110060) was obtained from Addgene. For the overexpression of miR-29b-3p, the miRNA-29b-1 genomic sequence was cloned and ligated into the pLemir-turboRFP vector. For luciferase assay, full-length 3’UTR of STAT3 transcripts and 3’UTR mutagenizing miR-29b-3p target sites were cloned and ligated into pmirGLO vector. Adult dermal fibroblasts from symptomatic HD patients (Coriell NINDS and NIGMS Repositories: ND33947, ND30013, GM02173, GM04230, GM04198, GM02147), presymptomatic HD patients (GM04717, GM04861, GM04855, GM04831, GM04857, GM04829), and healthy controls (GM02171, AG11732, GM03440, GM00495, GM07492, GM08399, AG04453, AG10047, AG12956, GM02187, AG08379, AG11798) were acquired from the Coriell Institute for Medical Research. Lenti-X 293T cells were acquired from Clontech (632180).
Lentivirus preparation
Lentiviral production was carried out separately for each plasmid and transduced together as a single pooled cocktail as previously described15,16. Briefly, the supernatant was collected 72 hours after the transfection (polyethyleneimine, Polysciences) of Lenti-X 293T cells with each viral vector with the packaging plasmids, psPAX2 and pMD2.G. Collected lentiviruses were filtered through 0.45 μm PES membranes and the Lenti-X concentrator (Clontech #631232) was added to concentrate the virus 4-fold. Lentivirus samples were spun at 1,500g for 45 mins after overnight incubation and resuspended in 1/10 of the original volume with 1 × PBS. Lentivirus and 7 ml of 20% sucrose cushion solution was added to centrifuge tubes and concentrated at 70,000 g for 2 hr at 4°C. Viral pellets were then resuspended in 10% sucrose solution and stored at −80 °C until transduction. The range of our typical lentivirus titer is 1×10⁷−2.5×10⁸ infection-forming units per milliliter (IFU/ml)15.
MicroRNA-mediated neuronal reprogramming
The lentiviral cocktail of rtTA, pTight-9-124-BclxL, CTIP2, MYT1L, DLX1, and DLX2 was added to human fibroblasts for 16 h, then cells were washed and fed with fibroblasts media containing 1 μg/mL doxycycline (DOX) accordingly to the previously established protocol7,10–17,19. Briefly, transduced fibroblasts were maintained in fibroblasts media containing DOX for two days before selection with Puromycin (3 μg /ml) on day 3, then plated onto poly-ornithine, fibronectin, and laminin-coated coverslips on day 5. Cells were subsequently maintained in Neurobasal A (Gibco) media containing B-27 plus supplement and GlutaMAX supplemented with valproic acid (1 mM), dibutyl cAMP (200 μM), BDNF (10 ng/ml), NT-3 (10 ng/ml), RA (1 μM), ascorbic acid (200 μM), and RVC (RevitaCell Supplement, 1X) until day 13. On day 14, BrainPhys (Stemcell) containing NeuroCult SM1 neuronal supplement and N2 supplement-A neurobasal media were added in half-to-half volume until analysis. DOX treatment was cycled every two days and half volume-feeding every 4 days. On day 6, Blasticidin (3 μg/mL) and G418 (300 μg/mL) were added to the media for selecting transcription factor-expressing cells. From day 10, media with supplements except Blasticidin and G418 were added in half-to-half volume. Ascorbic acid (200 μM), and RVC (RevitaCell Supplement, 1X) were stopped adding to media after day 21. Puromycin was added at a final concentration of 3 μg/mL and continued till further analyses.
SYTOX assay
0.1 μM SYTOX gene nucleic acid stain (Invitrogen, S7020) and 1 μl/mL of Hoechst 33342 (Thermo Scientific, 66249) were added into cell medium. Samples were incubated for at least 30 mins at 37°C prior to live-cell imaging. Images were taken using Leica DMI 4000B inverted microscope with Leica Application Suite (LAS) Advanced Fluorescence.
Apoptosis assay in live cells
Reprogrammed cells grown in 96-well plates were treated with 1X Essen Bioscience IncuCyte® Caspase-3/7 Green Reagent (final concentration 5 μM) and 1X Essen Bioscience IncuCyte® Annexin V Green or Red Reagent on day 22 or 26. Image scheduling, collection, and analysis were conducted with the IncuCyte® S3 LiveCell Analysis System platform and IncuCyte S3 v2017A software. Treated plates were imaged every two hours for 7 days. At each timepoint, over 2 images were taken per well in brightfield, FITC, and TRITC channels. Images were analyzed for the number of green or red objects per well. For the apoptotic index, the number of green or red objects (i.n., fluorescence cells) divided by phase area (μm2) per well was quantified by the IncuCyte® S3 Live-Cell Analysis System.
mCherry-GFP-LC3 construct, transduction, and quantification
FUW mCherry-GFP-LC3 was a gift from Anne Brunet (Addgene plasmid # 110060; http://n2t.net/addgene:110060; RRID:Addgene_110060). The concentrated lentivirus of mCherry-GFP-LC3 was added to reprogrammed MSNs at PID20. For imaging of cells expressing mCherry-GFP-LC3, cells were washed once with PBS, fixed and stained by TUBB3 antibody, after verification of expression of GFP and mCherry by microscopy at PID26. Images were captured using a Leica SP5X white light laser confocal system with Leica Application Suite (LAS) Advanced Fluorescence 2.7.3.9723. For quantification of autophagosome (i.e., mCherry+, GFP+ puncta) and autolysosome (i.e., mCherry+, GFP− puncta) compartments in MSNs from multiple HD patients and control individuals, measurements were performed in cells having at least 3 puncta per cell.
Immunostaining analysis
Reprogrammed cells were fixed with 4% paraformaldehyde (Electron Microscopy Sciences, #15710) for 20 min at room temperature (RT), and permeabilized with 0.2% Triton X-100 for 10 min at RT. Cells were blocked with 5% BSA and 1% goat serum in PBS and incubated with primary antibodies at 4°C overnight, then incubated with secondary antibodies for 1 hr at RT. Cells were incubated with DAPI (Sigma, D-9542) for 5 minutes followed by washing with PBS. Images were captured using a Leica SP5X white light laser confocal system with Leica Application Suite (LAS) Advanced Fluorescence 2.7.3.9723.
Immunoblot analysis
Cells were lysed in 2% SDS buffer. The concentrations of whole-cell lysates were measured using the Pierce BCA protein assay kit (Thermo Scientific, #23227). Equal amounts of whole-cell lysates were resolved by SDS-PAGE and transferred to a nitrocellulose membrane (GE Healthcare Life Sciences, #10600006) using a transfer apparatus according to the manufacturer’s protocols (Bio-rad). After incubation with 5% BSA in TBS containing 0.1% Tween-20 (TBST) for 1 hour, membranes were incubated with primary antibodies at 4°C overnight. Following the incubation with primary antibodies, membranes were incubated with a horseradish peroxidase-conjugated anti-mouse or anti-rabbit secondary antibodies for 30 min. Blots were developed with the ECL system (Thermo Scientific, #34080) according to the manufacturer’s protocols. We provided unprocessed original images of immunoblots in Source Data.
Antibodies
Primary antibodies used for immunostaining and immunoblot included rabbit anti-MAP2 (CST, #4542, 1:1000), mouse anti-tubulin β III (Covance, MMS-435P, 1:5000), rabbit anti-tubulin β III (Covance, PRB-435P-100, 1:1000), chicken anti-beta-tubulin 3 (Aves Labs, AB_2313564, 1:1000), rabbit anti-p62/SQSTM1 (Abcam, ab109012, 1:1000), mouse anti-p62/SQSTM1 (CST, #88588, 1:1000), rabbit anti-STAT3 (CST, #4904, 1:1000), rabbit anti-GAPDH (Santa Cruz, sc-32233, 1:5000), rabbit anti-DARPP-32(19A3) (CST, #2306, 1:200), rat anti-CTIP2 (Abcam, ab18465, 1:500), rabbit anti-DLX1 (Millipore, AB5724, 1:100), rabbit anti-DLX2 (Abcam, ab135620, 1:100), and rabbit anti-MYT1L (Proteintech, 25234-1-AP, 1:500) antibodies. The secondary antibodies for immunostaining included Alexa-488 Goat anti-mouse IgG (H+L) (Invitrogen, A-11029, 1:2000), Alexa-488 Goat anti-rabbit IgG (H+L) (Invitrogen, A-11034, 1:2000), Alexa-568 Goat anti-mouse IgG (H+L) (Invitrogen, A-11031, 1:2000), Alexa-568 Goat anti-rabbit IgG (H+L) (Invitrogen, A-11016, 1:2000), Alexa-594 Goat anti-mouse IgG (H+L) (Invitrogen, A-11032, 1:2000), Alexa-594 Goat anti-rabbit IgG (H+L) (Invitrogen, A-11012, 1:2000), Alexa-647 Goat anti-chicken IgY (Invitrogen, A-21449, 1:2000), and Alexa-594 Goat anti-rat IgG (H+L) (Invitrogen, A-11007, 1:2000).
RNA preparations and RT-qPCR
Total RNA from reprogramming cells was extracted using the RNeasy Micro Kit (Qiagen) or TRIzol Reagent (Invitrogen, 15596026). To verify miR-29b-3p levels, small RNA from the striatum of human brain samples (Fig. 5j) was extracted using TRIzol Reagent (Invitrogen, 15596026) and the RNA from the brain sections of healthy human control young and old samples was extracted using RNeasy FFPE Kit (Qiagen) (Fig. 5i). Reverse transcription was performed using the Superscript IV first strand synthesis system for RT-PCR (Invitrogen, 18090050) according to the manufacturer’s protocol. Quantitative PCR was performed using SYBR Green PCR master mix (Applied Biosystems, 4309155) and StepOnePlus Real-Time PCR system (Applied Biosystems, 4376600) according to the manufacturer’s protocol against target genes. Quantitative PCR analysis was done with the following primers: STAT3; 5’- CTTTGAGACCGAGGTGTATCACC-3’ and 5’- GGTCAGCATGTTGTACCACAGG-3’, DARPP-32; 5’- CCAAGGACCGCAAGAAGAT-3’ and 5’- CTCCTCTGGTGAGGAGTGCT-3’, GAPDH; 5’- ATGTTCGTCATGGGTGTGAA-3’ and 5’- TGTGGTCATGAGTCCTTCCA-3’. For the verification of mature miRNA-29b-3p, individual TaqMan probes for miR-29b-3p and miR-361-5p (as a housekeeping miRNA) were purchased (Life Technologies) and measurements by Taqman qPCR were carried out according to the manufacturer’s protocol.
Luciferase assay
HEK 293 cells plated in a 96-well plate were transfected with 100 ng of pSilencer-miRNA, 100 ng of pmirGLO containing 3’UTR of interest, and PEI (Polysciences, 24765) with Opti-MEM (Life Technologies, 31985). Forty-eight hours after transfection, luciferase activity was assayed using Dual-Glo luciferase assay system (Promega, E2920) according to the manufacturer’s protocol using Synergy H1 Hybrid plate reader (BioTek). Luciferase activity was obtained by normalizing firefly luminescence to renilla luminescence (luciferase activity = firefly/renilla) followed by normalizing to respective pSilencer-miR-NS control.
RNA Sequencing
Samples were submitted to the Genome Access Technology Center (GTAC) at Washington University for library preparation and sequencing. Samples were prepared according to the library kit manufacturer’s protocol, indexed, pooled, and sequenced on an Illumina HiSeq. Basecalls and demultiplexing were performed with Illumina’s bcl2fastq software and a custom python demultiplexing program with a maximum of one mismatch in the indexing read. RNA-seq reads were then aligned to the Ensembl release 76 primary assemblies with STAR version 2.5.1a1. Gene counts were derived from the number of uniquely aligned unambiguous reads by Subread:feature Count version 1.4.6-p52. Isoform expression of known Ensembl transcripts was estimated with Salmon version 0.8.23. Sequencing performance was assessed for the total number of aligned reads, the total number of uniquely aligned reads, and features detected. The ribosomal fraction, known junction saturation, and read distribution over known gene models were quantified with RSeQC version 2.6.24.
Omni-ATAC-sequencing preparation
Omni-ATAC was performed as outlined in Corces et al. (Corces et al., 2017). In brief, each sample was treated with DNase for 30 minutes prior to collection. Approximately 50,000 cells were collected for library preparation. Transposition reaction was completed with Nextera Tn5 Transposase (Illumina Tagment DNA Enzyme and Buffer Kit, Illumina) for 30 minutes at 37°C and library fragments were amplified under optimal amplification conditions. Final libraries were purified by the DNA Clean & Concentrator 5 Kit (Zymo, USA). Libraries were sequenced on Illumina NovaSeq S4 XP (Genome Technology Access Center at Washington University in St. Louis).
ATAC-Seq analyses
ATAC-seq analysis in directly reprogrammed neurons was performed as previously described12,57. Briefly, ATAC-seq reads were aligned to hg38 human genome assembly using bowtie2, and uniquely mapped reads were used for downstream analysis. Peaks for each sample were called using Homer findPeaks and combined altogether to make the own reference map for further differential analysis. Differential peaks were identified using DEseq2 with a cut-off of fold-change (FC) ≥2 and adjusted p-value < 0.05 and regarded as peaks gained or lost. Gained peaks in HD-MSNs were combined and defined as open (more accessible) chromatin regions. Conversely, all reduced peaks in HD-MSNs were defined as closed chromatin regions. We annotated genes nearest to open or closed regions by using Homer and compared them with DEGs of RNA-seq data (adjusted p < 0.05, log2FC≤−0.5 or log2FC≥0.5).
Synthetic route for the preparation of G2-115
Preparation of intermediate 2
To a solution of 3,5-dichloroaniline (2 g, 12.34 mmol, 1 eq.) in DCM (30 mL) was added pyridine (3.42 g, 43.21 mmol, 3.5 eq.) and 3-ethoxyprop-2-enoyl chloride (1.99 g, 14.81 mmol, 1.2 eq.) at 0 °C. The mixture was stirred at 15 °C for 2 hr. The reaction mixture was quenched by aqueous HCl (1M, 10 mL) and extracted with DCM (30 mL × 3). The combined organic layers were washed with aq. sat. NaHCO3 (15 mL), dried over Na2SO4, filtered and concentrated to give (E)-N-(3,5-dichlorophenyl)-3-ethoxy-prop-2-enamide 2 (3.1 g, crude) as a yellow solid. ESI [M+H] = 260.0
Preparation of G2-115
A mixture of 2 (1.5 g, 5.77 mmol, 1 eq.) in sulfuric acid (15 mL, 98% purity) was stirred at 30 °C for 6 hr. The reaction mixture was poured into ice water (30 mL) and filtered. The filter cake was triturated with MeOH (8 mL × 3) and the filter cake was dried to give 5,7-dichloro-1H-quinolin-2-one G2-115 (1.1 g, 4.97 mmol, 86.1% yield, 96.6% purity) as a brown solid. 1H NMR (400MHz, DMSO-d6) δ = 12.72 – 11.45 (m, 1H), 8.05 (br d, J=9.8 Hz, 1H), 7.48 (s, 1H), 7.33 (s, 1H), 6.71 – 6.59 (m, 1H). ESI [M+H] = 214.0/216.0
Gene co-expression network construction by WGCNA
WGCNA27 was performed to construct gene co-expressed networks and identify co-expression gene modules. Expressed genes were normalized for sample depth (count per million read, CPM) and detected for outliers. The optimal soft threshold for adjacency computation was graphically determined, the transformed expression matrix was inputted into the WGCNA package functions, modules, and corresponding eigengenes were obtained. The dynamic clustering function was performed for gene hierarchical clustering dendrograms resulting in co-expression modules; correlation modules (r>0.7) were then merged. The dissimilarity of modules eigengenes (ME) was calculated, and the association between eigengenes values of clinical info was assessed by Pearson’s correlation. For preservation statistics analysis, a total of 4 modules, blue, brown, greenyellow, and lightcyan1, were selected for module preservation calculation to determine which of the properties of the network module change across different experiments, pre-HD vs post-HD and healthy control old vs young groups. These modules contain most differentially expressed genes correlated between pre and post HD stages, also enough genes matched across datasets validate the preservation calculation. The datasets of HD and healthy control were used as reference and test set, respectively. The evidence of preservation was accessed by multiple statistical metrics28.
Pathway enrichment analysis
Pathway enrichment analysis (BioPlanet_2019 and Ontologies) was performed by Enrichr. We provided detailed information on pathway enrichment analysis in Supplementary Table 2. Enrichr implements four scores to report enrichment results: p-value, q-value, rank (Z-score), and combined score. The p-value is computed using a standard statistical method used by most enrichment analysis tools: Fisher’s exact test or the hypergeometric test. This is a binomial proportion test that assumes a binomial distribution and independence for probability of any gene belonging to any set58,59.
Statistics & Reproducibility
For all quantified data, multiple cell cultures were counted from at least three biological replicates from multiple independent patient samples as indicated in Supplementary Table 1. Statistical analyses were performed in GraphPad Prism using a two-tailed unpaired t-test or a one-way ANOVA followed by a post hoc Tukey’s test with *p<0.05 considered significant. Studies were performed blindly and automated whenever possible with the aid of cell counting software tools, and confirmation from multiple investigators with cell score quantification results as needed. For scoring phenotypes that required cell visualizations, at least three lab members blindly counted coded cell samples. For most of cell death assays, we used the automated fluorescence measurement in the IncuCyte® S3 Live-Cell Analysis System with standardized procedures and used the data points generated by the analysis software. Data distribution was assumed to be normal, but this was not formally tested. Data in graphs are expressed as mean values and error bars represent s.e.m. unless noted otherwise. No data were excluded from the analyses. Data collection was not randomized, but always done in parallel with controls and quantified in a blinded manner when necessary. Allocation of primary patient cells acquired from Coriell Biorepository into “HD group” was done randomly. Samples into the “Control group” were allocated by age- and sex-matching healthy controls with HD samples acquired and available through Coriell Biorepository. Samples into the “pre-HD group” were collected 13–17 years before the reported age of HD symptom ranging from 13 to 44 years of age, and sex matching with HD samples. No statistical methods were used to pre-determine sample sizes, but our sample sizes are similar or more than those reported in previous publications7. All data quantified for cellular phenotypes were from 3–6 independent healthy control young, old, HD patients and pre-symptomatic HD individuals. For transcriptome and chromatin accessibility analyses, 12 healthy control MSN, 6 independent HD patients and 6 independent HD pre-symptomatic MSN samples were used with two or three biological replicates per individual. No sample size calculation was done, as the sample sizes used in the study were adequate to yield consistent differential gene expression and chromatin accessibilities with significant adjusted p values (<0.05).
Extended Data
Extended Data Fig. 1. Healthy control and HD patient fibroblasts can be directly reprogrammed into MSNs.
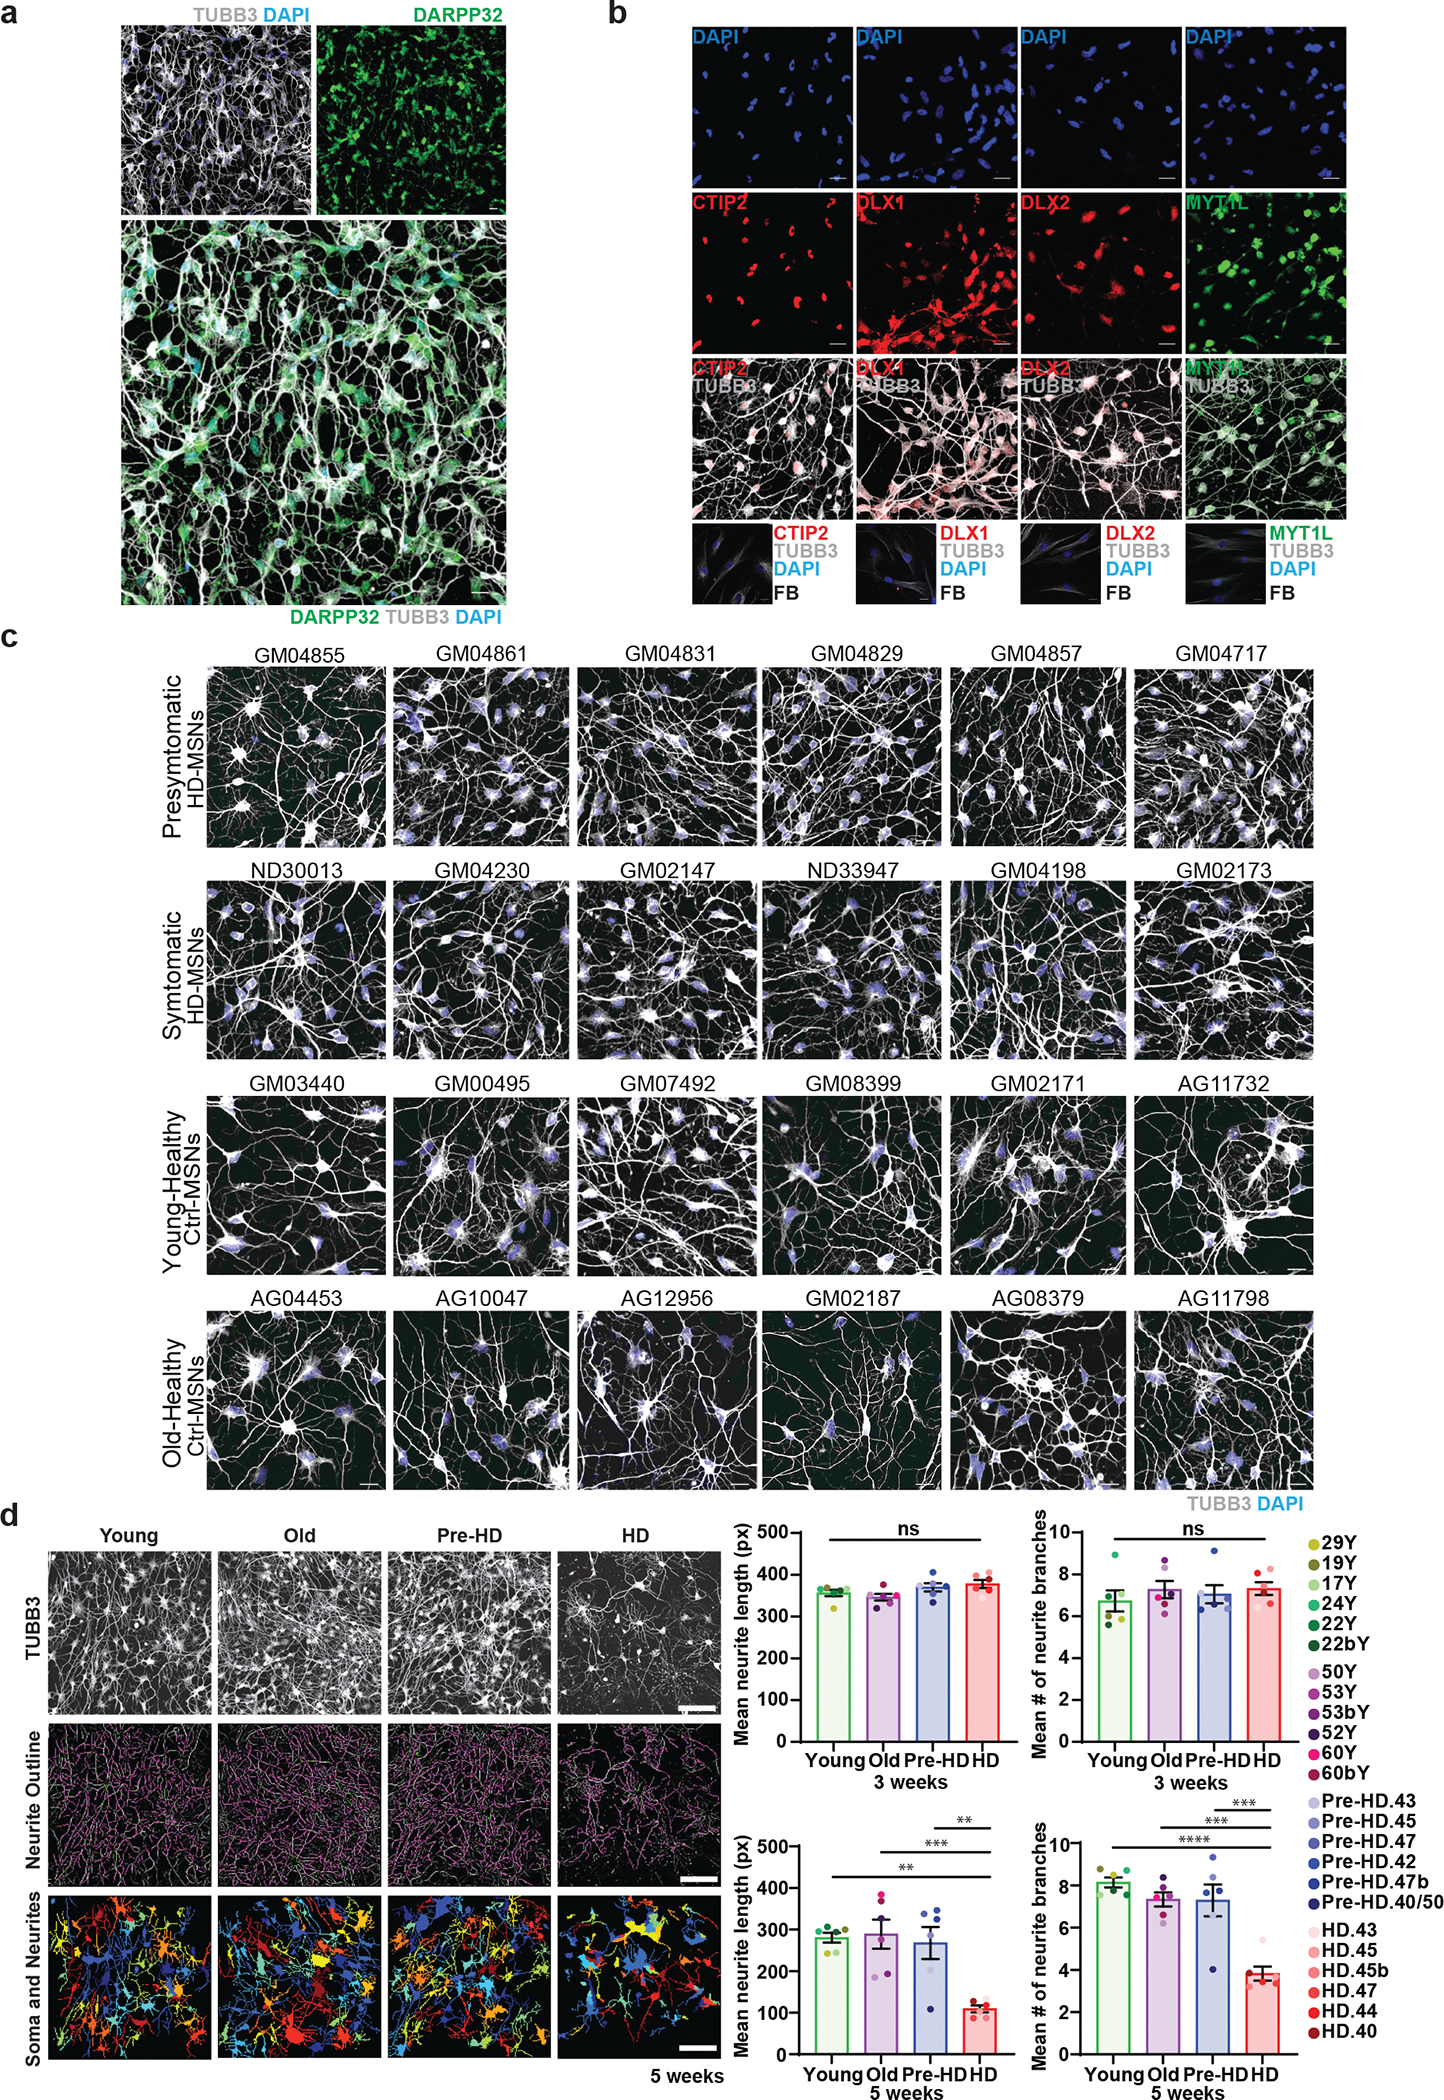
a. Reprogrammed cells by transduction of miR-9/9*-124+CDM immunostained for neuronal markers, TUBB3, and MSN marker, DARPP32 at PID30. Scale bars 20 μm. b. Expression of each CDM factor in reprogramming cells by immunostaining for CTIP2, DLX1, DLX2, MYT1L, and TUBB3. Non-transduced fibroblasts were used as a negative control for immunostaining. Scale bars 20μm. c. The neuronal morphology across all samples we used in the current study stained positive for TUBB3 successfully undergo direct conversion by miR-9/9*-124+CDM. Scale bars 20μm. d. Left, representative images of healthy control Young, Old, Pre-HD, and HD MSNs marked by TUBB3. Images processed by CellProfiler to identify neurites and associated cell soma. Scale bars, 100μm. Right, the measurement of mean neurite length and mean number of neurite branches in reprogrammed Healthy control Young, Old, Pre-HD, and HD-MSNs at PID21 and PID35 (n=24 individual’s reprogrammed MSNs). Statistical significance was determined using one-way ANOVA, ****p<0.0001, ***p<0.001 (Old vs. HD in neurite length p=0.0007, Old vs. HD in neurite branches p=0.0001, Pre-HD vs. HD in neurite branches p=0.0002), **p<0.01 (Young vs. HD in neurite length p=0.0012, Pre-HD vs. HD in neurite length p=0.0026), ns, not significant. Mean±s.e.m.
Extended Data Fig. 2. Genetic networks altered in HD-MSNs by WGCNA.
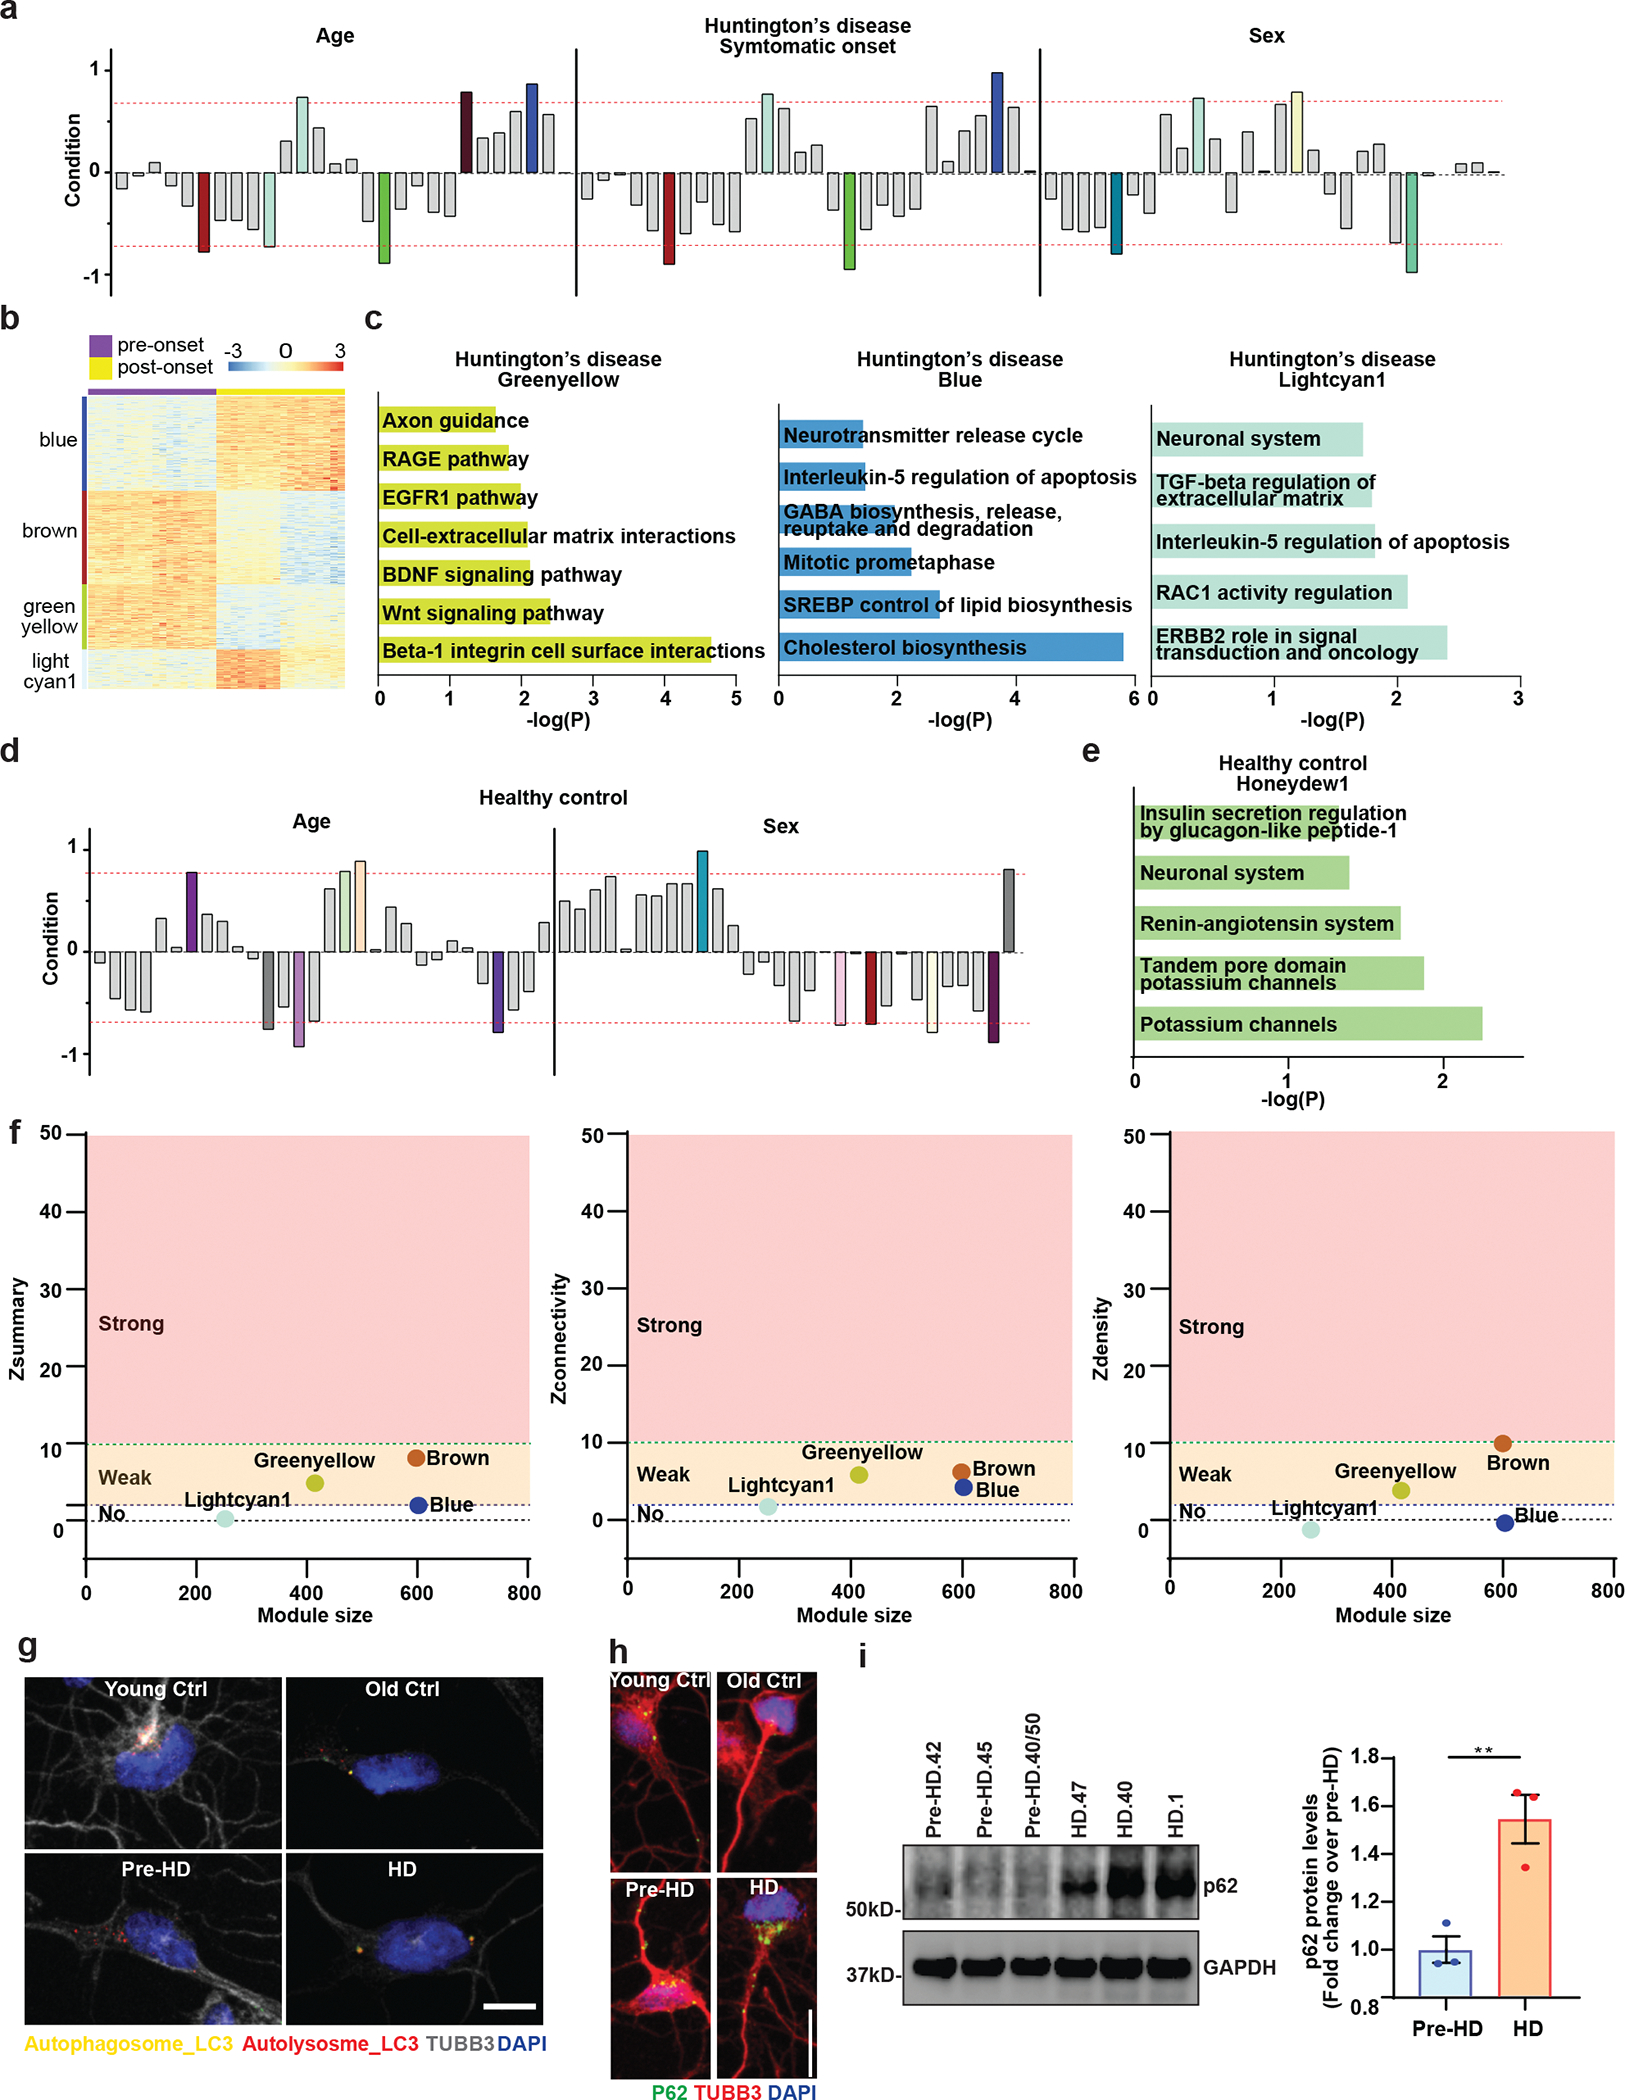
a, The signed association of protein-coding genes with Age, Symptomatic onset, and Sex condition of Huntington’s disease. Modules with positive values indicate increased expression in HD-MSNs; modules with negative values indicate decreased expression in HD-MSNs. The red dotted lines indicate correlation values of 0.7 or −0.7 with p=10–7 for age, p=10–6 for symptomatic onset, and p=10–6 for sex. b, An expression heatmap of our selected modules of HD samples (blue, lightcyan1, brown, and greenyellow) from WGCNA. c, Pathways enriched in downregulated (log2FC<−1) or upregulated (log2FC>1) genes in the greenyellow, blue and lightcyan1 module of Huntington’s disease by BioPlanet analysis. d, The signed association of protein-coding genes with age and sex of healthy control. Modules with positive values indicate increased expression in Old-MSNs; modules with negative values indicate decreased expression in Old-MSNs. The red dotted lines indicate correlation values of 0.7 or −0.7 with p=10–7 for age and p=10–6 for sex condition. e, Pathways enriched in upregulated (log2FC>1) genes in the honeydew1 module of healthy control by BioPlanet analysis. f, Summary preservation statistics as a function of the module size. Left: the composite preservation statistic (Zsummary), Middle: the connectivity statistics (Zconnectivity), Right: the density statistics (Zdensity). Each point represents a module, labeled by color. The dashed blue and green lines indicate the thresholds Z=2 and Z=10, respectively. g. Representative images of MSNs expressing the tandem monomeric mCherry-GFP-LC3 reporter immunostained for TUBB3. Autophagosome (i.e., mCherry+, GFP+ puncta) and autolysosome (i.e., mCherry+, GFP−puncta) compartments in MSNs from HD patients and control individual. Scale bar 20μm. h. Reprogrammed cells immunostained for p62 and TUBB3 from independent HD and healthy control lines. Scale bar 20μm. i. Immunoblot analysis for p62 and GAPDH of three independent pre-HD- and three independent HD-MSN lines at PID26. P62 signal intensities were normalized by GAPDH signals and relative fold changes in HD-MSNs were calculated over pre-HD-MSNs (**p=0.0019 by two-tailed unpaired t-test; Mean±s.e.m.).
Extended Data Fig. 3. The treatment of autophagy inhibitor or inducer in reprogrammed MSNs.
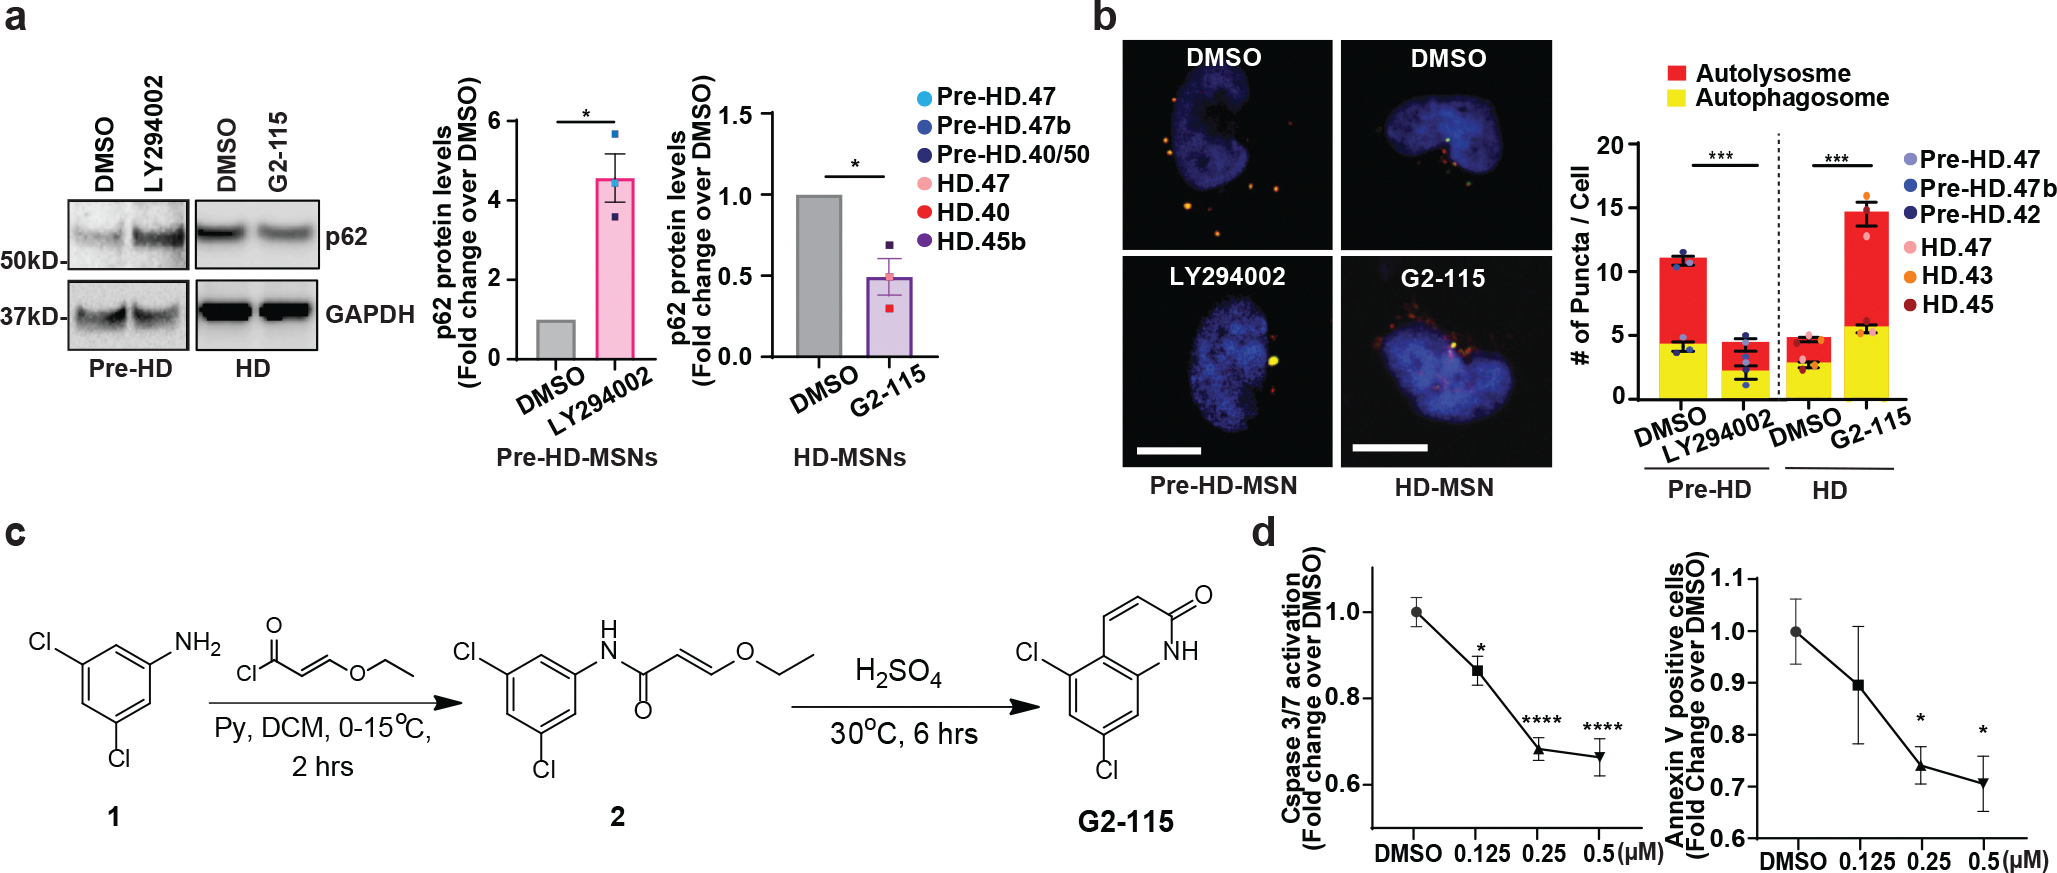
a, Immunoblot of p62 and GAPDH in pre-HD-MSNs treated with DMSO or 50 μM LY294002 and HD-MSNs treated with DMSO or 0.5uM G2-115 at PID26 (left). p62 Intensity values were normalized by GAPDH intensities and the relative fold change over DMSO condition was calculated from immunoblot images of three independent Pre-HD-MSNs (middle, *p=0.0277) and HD-MSNs (*p=0.0460). Each dot represents one individual’s reprogrammed MSN. b, left: representative images of pre-HD-MSNs treated with DMSO or 50μM LY294002 and HD-MSNs treated with DMSO or 0.5uM G2-115 (PID 30). MSNs express the tandem monomeric RFP-GFP-LC3 reporter. Scale bars 20μm. right: quantification of autophagosome (i.e., mCherry+, GFP+puncta) and autolysosome (i.e., mCherry+, GFP− puncta) compartments from three independent Pre-HD-MSNs (***p=0.0004) and HD-MSNs (***p=0.0005). Measurements were performed in cells having at least 3 puncta per cell (from more than 50 cells per MSN line). Each dot represents one individual’s reprogrammed MSNs. c. Synthetic route for the preparation of G2-115. d, Measurement of neuronal cell death of HD.40-MSNs with the treatment of DMSO or three different concentrations of G2 compound at PID 30 by Caspase-3/7 reagents (left, *p=0.0199, ****p<0.0001) or Annexin V reagents (right, *p=0359, *p=0.0326) (n=4–8 cultures). For all figures shown, statistical significance was determined using two-tailed unpaired t-test (a,b) and one-way ANOVA (d); ****p < 0.0001, ***p<0.001, *p<0.05. Mean±s.e.m.
Extended Data Fig. 4. Pre-HD-MSNs and HD-MSNs display differential chromatin accessibilities.
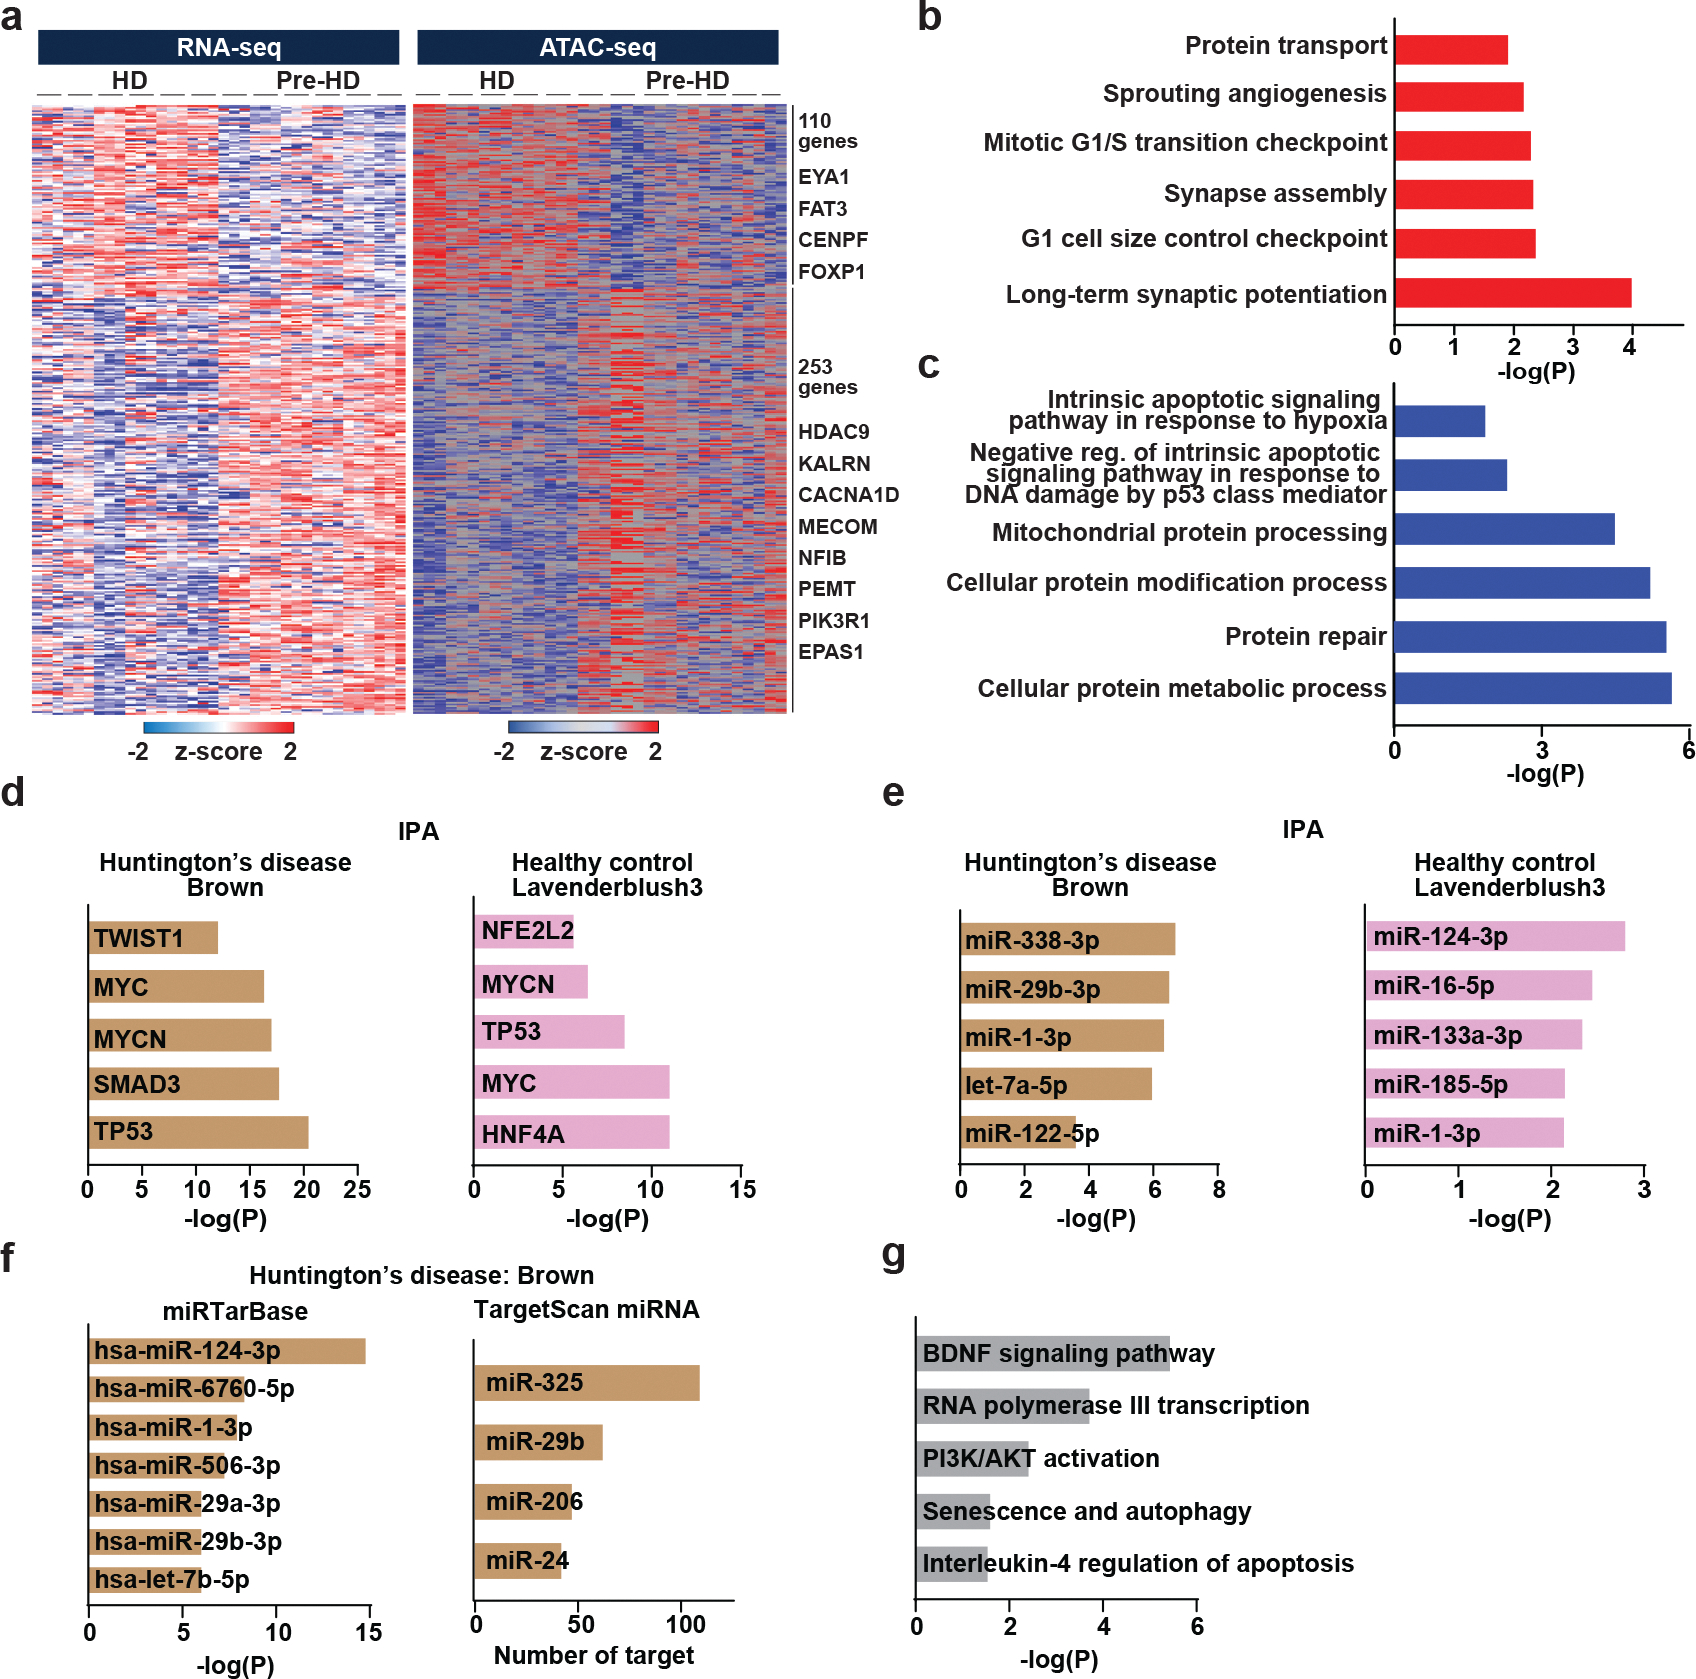
a, A heatmaps showing gene expression levels for DEGs that positively correlated with signal intensities of ATAC-seq in their promoter regions. Signal intensity is based on normalized CPM values. Data are shown as Z-score normalized log2CPM (adjusted p<0.05, │log2FC│>1). b, c, GO terms associated with opened and upregulated genes (b) and closed and downregulated genes (c). d, Transcription regulators predicted as upstream regulators of the brown module (Huntington’s disease) and the lavenderblush3 (healthy control) by Ingenuity Pathway Analysis (IPA). e, Mature microRNAs predicted as an upstream regulator of the brown module (Huntington’s disease) and the lavenderblush3 (healthy control) by Ingenuity Pathway Analysis (IPA). f, MicroRNAs predicted as an upstream regulator of the brown module (Huntington’s disease) by miRTarBase and TargetScan. g, Pathways enriched in target genes of miR-29b-3p in the brown module (Huntington’s disease) by BioPlanet analysis.
Extended Data Fig. 5. miR-29b-3p expression changes by miR-29–3p inhibitor or miR-29b overexpression lentivirus transduction.
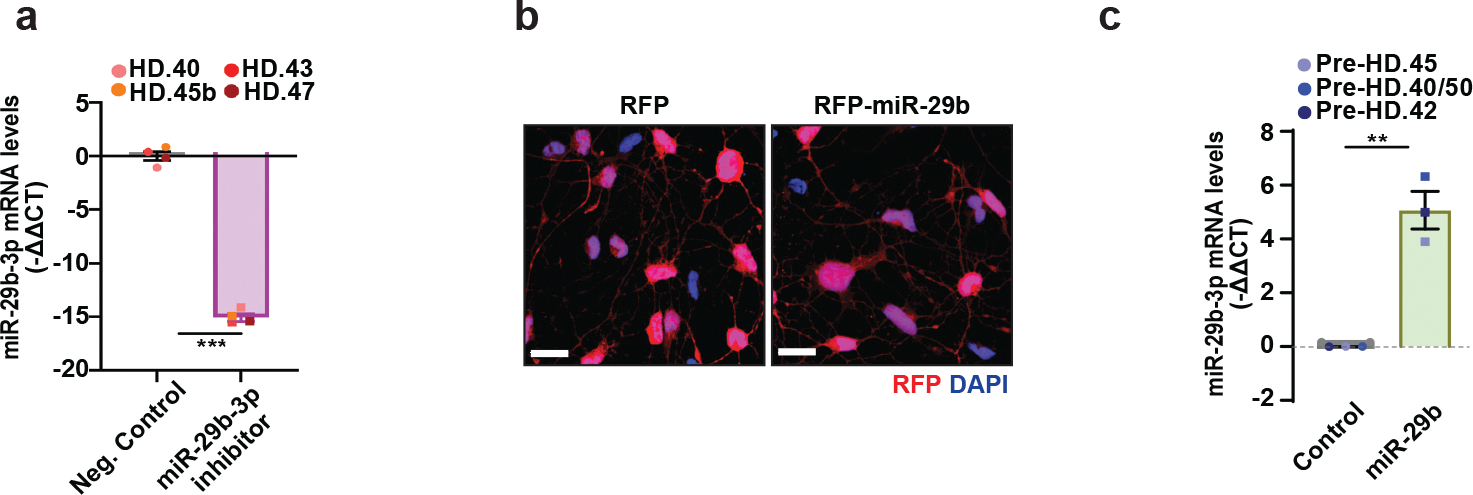
a, RT-qPCR analysis of mature miR-29–3p expression levels in four HD-MSNs with control or miR-29b-3p inhibitor at PID26 (n=4 individual’s reprogrammed HD-MSNs, ***p=0.0002 by two-tailed unpaired t-test; Mean±s.e.m.). b, Pre-HD-MSNs expressing RFP only or RFP-miR-29b immunostained with RFP and DAPI. (Scale bars, 20μm). c, RT-qPCR analysis of mature miR-29–3p expression levels in three independent pre-HD-MSNs expressing control or miR-29b. Each dot represents one individual’s reprogrammed MSNs. (**p=0.0019 by two-tailed unpaired t-test; Mean±s.e.m).
Extended Data Fig. 6. The autophagy-related genes regulated by STAT3 in HD-MSNs.
a, The target genes of miR-29b-3p functionally related to autophagy in the brown module. Visualized by NetworkAnalyst. b, A heatmap of representation of ATAC-seq signal intensities for autophagy-related genes that contained STAT3 binding site in the closed DARs in HD-MSNs (n=8–9 per group). c, Percentage of decrease of STAT3 levels in old versus young Ctrl-MSNs, and HD-MSNs versus pre-HD-MSNs, replotted from Figure 7(f). Each dot represents one individual’s reprogrammed MSNs. (****p<0.0001 by two-tailed unpaired t-test; Mean±s.e.m.). d, RT-qPCR analysis of STAT3 mRNA levels in three independent pre-HD-MSN lines with shControl or shSTAT3 at PID26. Each dot represents one individual’s reprogrammed Pre-HD-MSNs. (****p<0.0001 by two-tailed unpaired t-test; Mean±s.e.m.). e, Western bot for STAT3 expression in human adult fibroblasts with shControl or shSTAT3. f, RT-qPCR analysis of STAT3 mRNA levels in three independent HD-MSN lines with Control or STAT3 overexpression at PID26. Each dot represents one individual’s reprogrammed HD-MSNs. (*p=0.0143 by two-tailed unpaired t-test; Mean±s.e.m.).
Extended Data Fig. 7. Prediction of DAR proximal to miR-29b and HD-specific phenotype in fibroblasts.
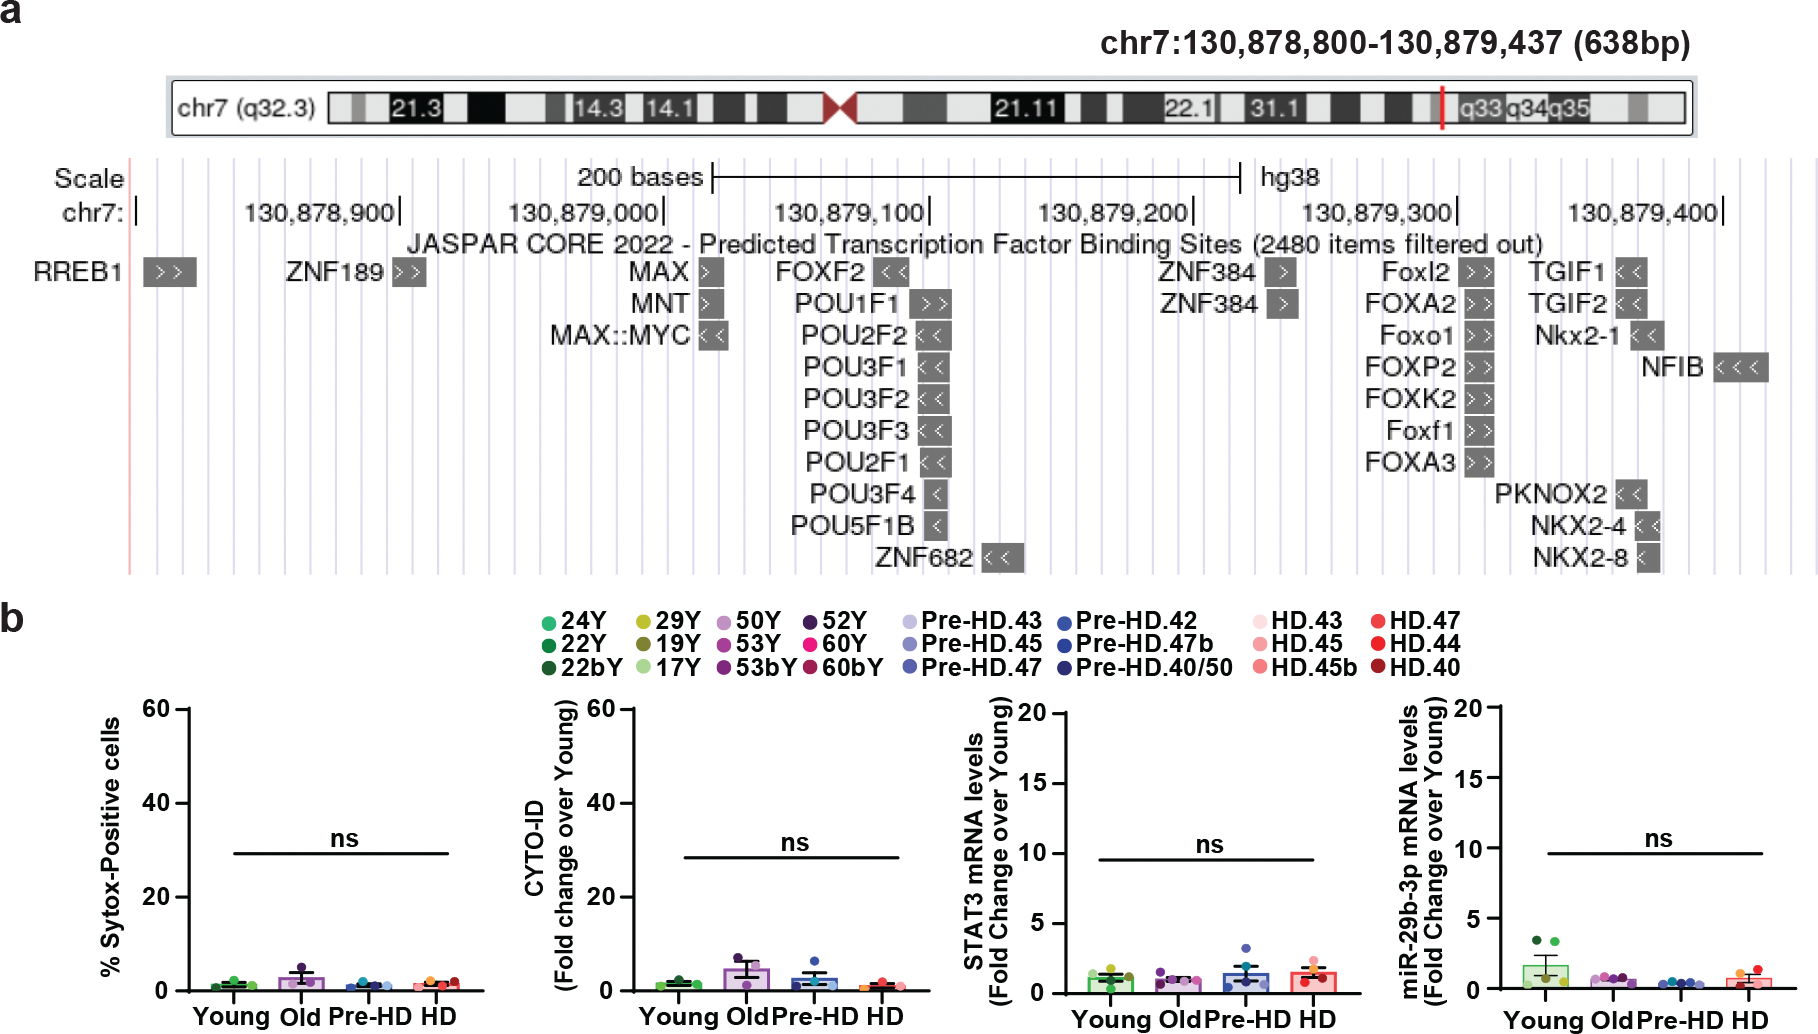
a, Predicted transcription binding sites for the DAR proximal to miR29B1 (chr7:130,878,800–130,879,437). Image from UCSC Genome Browser on Human (GRCh38/hg38). JASPAR CORE 2022, Minimum Score: 500. b, Quantification of Sytox-positive cells, CYTO-ID signal, STAT3 expression, and miR-29b-3p expression in fibroblasts from healthy control Young/Old, Pre-HD, and HD (n= 14 or 19 individual fibroblasts, statistical significance was determined by one-way ANOVA. ns, not significant; Mean±s.e.m.).
Supplementary Material
ACKNOWLEDGMENT
We thank the Genome Technology Access Center at Washington University for deep-sequencing experiments. HD and control brain tissues were received through the NIH NeuroBioBank. Images were created with BioRender.com. We thank D. H. Geschwind and R. Kawaguchi (UCLA) for their suggestions on statistics of miRNAs on gene networks. This study was supported by the following programs, grants, and fellowships: Cellular and Molecular Biology Training Program (T32 GM007067) (K.C.), Cure Alzheimer’s Fund (CAF), CHDI Fund, Hereditary Disease Foundation Grant, RF1AG056296 (NIA), R01NS107488 (NINDS), Farrell Foundation Fund, and Mallinckrodt Scholar Award (A.S.Y.).
Footnotes
COMPETING INTERESTS
The authors declare no competing interests.
Extended Data information is available in the online version of the paper.
Code availability
No new code was used in this study.
Data availability
All the deep-sequencing data (RNA-seq and ATAC-seq) has been uploaded to the Gene Expression Omnibus (GEO) repository: GSE194243. Source data that support all findings in the study are available as supplementary data. The data that support this study are available from the corresponding author upon reasonable request. Source data are provided with this paper.
REFERENCE
- 1.Vonsattel JP & DiFiglia M Huntington disease. J Neuropathol Exp Neurol 57, 369–384, doi: 10.1097/00005072-199805000-00001 (1998). [DOI] [PubMed] [Google Scholar]
- 2.Ross CA et al. Huntington disease: natural history, biomarkers and prospects for therapeutics. Nat Rev Neurol 10, 204–216, doi: 10.1038/nrneurol.2014.24 (2014). [DOI] [PubMed] [Google Scholar]
- 3.Kremer B et al. A worldwide study of the Huntington’s disease mutation. The sensitivity and specificity of measuring CAG repeats. N Engl J Med 330, 1401–1406, doi: 10.1056/NEJM199405193302001 (1994). [DOI] [PubMed] [Google Scholar]
- 4.Brinkman RR, Mezei MM, Theilmann J, Almqvist E & Hayden MR The likelihood of being affected with Huntington disease by a particular age, for a specific CAG size. Am J Hum Genet 60, 1202–1210 (1997). [PMC free article] [PubMed] [Google Scholar]
- 5.Arrasate M, Mitra S, Schweitzer ES, Segal MR & Finkbeiner S Inclusion body formation reduces levels of mutant huntingtin and the risk of neuronal death. Nature 431, 805–810, doi: 10.1038/nature02998 (2004). [DOI] [PubMed] [Google Scholar]
- 6.Hickey MA & Chesselet MF Apoptosis in Huntington’s disease. Prog Neuropsychopharmacol Biol Psychiatry 27, 255–265, doi: 10.1016/S0278-5846(03)00021-6 (2003). [DOI] [PubMed] [Google Scholar]
- 7.Victor MB et al. Striatal neurons directly converted from Huntington’s disease patient fibroblasts recapitulate age-associated disease phenotypes. Nat Neurosci 21, 341–352, doi: 10.1038/s41593-018-0075-7 (2018). [DOI] [PMC free article] [PubMed] [Google Scholar]
- 8.Mertens J, Marchetto MC, Bardy C & Gage FH Evaluating cell reprogramming, differentiation and conversion technologies in neuroscience. Nat Rev Neurosci 17, 424–437, doi: 10.1038/nrn.2016.46 (2016). [DOI] [PMC free article] [PubMed] [Google Scholar]
- 9.Pang ZP et al. Induction of human neuronal cells by defined transcription factors. Nature 476, 220–223, doi: 10.1038/nature10202 (2011). [DOI] [PMC free article] [PubMed] [Google Scholar]
- 10.Yoo AS et al. MicroRNA-mediated conversion of human fibroblasts to neurons. Nature 476, 228–231, doi: 10.1038/nature10323 (2011). [DOI] [PMC free article] [PubMed] [Google Scholar]
- 11.Yoo AS, Staahl BT, Chen L & Crabtree GR MicroRNA-mediated switching of chromatin-remodelling complexes in neural development. Nature 460, 642–646, doi: 10.1038/nature08139 (2009). [DOI] [PMC free article] [PubMed] [Google Scholar]
- 12.Abernathy DG et al. MicroRNAs Induce a Permissive Chromatin Environment that Enables Neuronal Subtype-Specific Reprogramming of Adult Human Fibroblasts. Cell Stem Cell 21, 332–348 e339, doi: 10.1016/j.stem.2017.08.002 (2017). [DOI] [PMC free article] [PubMed] [Google Scholar]
- 13.Cates K et al. Deconstructing Stepwise Fate Conversion of Human Fibroblasts to Neurons by MicroRNAs. Cell Stem Cell 28, 127–140 e129, doi: 10.1016/j.stem.2020.08.015 (2021). [DOI] [PMC free article] [PubMed] [Google Scholar]
- 14.Victor MB et al. Generation of human striatal neurons by microRNA-dependent direct conversion of fibroblasts. Neuron 84, 311–323, doi: 10.1016/j.neuron.2014.10.016 (2014). [DOI] [PMC free article] [PubMed] [Google Scholar]
- 15.Richner M, Victor MB, Liu Y, Abernathy D & Yoo AS MicroRNA-based conversion of human fibroblasts into striatal medium spiny neurons. Nat Protoc 10, 1543–1555, doi: 10.1038/nprot.2015.102 (2015). [DOI] [PMC free article] [PubMed] [Google Scholar]
- 16.Church VA et al. Generation of Human Neurons by microRNA-Mediated Direct Conversion of Dermal Fibroblasts. Methods Mol Biol 2239, 77–100, doi: 10.1007/978-1-0716-1084-8_6 (2021). [DOI] [PubMed] [Google Scholar]
- 17.Lee SW, Oh YM, Lu YL, Kim WK & Yoo AS MicroRNAs Overcome Cell Fate Barrier by Reducing EZH2-Controlled REST Stability during Neuronal Conversion of Human Adult Fibroblasts. Dev Cell 46, 73–84 e77, doi: 10.1016/j.devcel.2018.06.007 (2018). [DOI] [PMC free article] [PubMed] [Google Scholar]
- 18.Horvath S DNA methylation age of human tissues and cell types. Genome Biol 14, R115, doi: 10.1186/gb-2013-14-10-r115 (2013). [DOI] [PMC free article] [PubMed] [Google Scholar]
- 19.Huh CJ et al. Maintenance of age in human neurons generated by microRNA-based neuronal conversion of fibroblasts. Elife 5, doi: 10.7554/eLife.18648 (2016). [DOI] [PMC free article] [PubMed] [Google Scholar]
- 20.Mertens J et al. Directly Reprogrammed Human Neurons Retain Aging-Associated Transcriptomic Signatures and Reveal Age-Related Nucleocytoplasmic Defects. Cell Stem Cell 17, 705–718, doi: 10.1016/j.stem.2015.09.001 (2015). [DOI] [PMC free article] [PubMed] [Google Scholar]
- 21.Patterson M et al. Defining the nature of human pluripotent stem cell progeny. Cell Res 22, 178–193, doi: 10.1038/cr.2011.133 (2012). [DOI] [PMC free article] [PubMed] [Google Scholar]
- 22.Miller JD et al. Human iPSC-based modeling of late-onset disease via progerin-induced aging. Cell Stem Cell 13, 691–705, doi: 10.1016/j.stem.2013.11.006 (2013). [DOI] [PMC free article] [PubMed] [Google Scholar]
- 23.McCoy MJ & Fire AZ Intron and gene size expansion during nervous system evolution. BMC Genomics 21, 360, doi: 10.1186/s12864-020-6760-4 (2020). [DOI] [PMC free article] [PubMed] [Google Scholar]
- 24.McCoy MJ et al. LONGO: an R package for interactive gene length dependent analysis for neuronal identity. Bioinformatics 34, i422–i428, doi: 10.1093/bioinformatics/bty243 (2018). [DOI] [PMC free article] [PubMed] [Google Scholar]
- 25.Gabel HW et al. Disruption of DNA-methylation-dependent long gene repression in Rett syndrome. Nature 522, 89–93, doi: 10.1038/nature14319 (2015). [DOI] [PMC free article] [PubMed] [Google Scholar]
- 26.Lu YL, Liu Y, McCoy MJ & Yoo AS MiR-124 synergism with ELAVL3 enhances target gene expression to promote neuronal maturity. Proc Natl Acad Sci U S A 118, doi: 10.1073/pnas.2015454118 (2021). [DOI] [PMC free article] [PubMed] [Google Scholar]
- 27.Langfelder P & Horvath S WGCNA: an R package for weighted correlation network analysis. BMC Bioinformatics 9, 559, doi: 10.1186/1471-2105-9-559 (2008). [DOI] [PMC free article] [PubMed] [Google Scholar]
- 28.Langfelder P, Luo R, Oldham MC & Horvath S Is my network module preserved and reproducible? PLoS Comput Biol 7, e1001057, doi: 10.1371/journal.pcbi.1001057 (2011). [DOI] [PMC free article] [PubMed] [Google Scholar]
- 29.You L et al. The role of STAT3 in autophagy. Autophagy 11, 729–739, doi: 10.1080/15548627.2015.1017192 (2015). [DOI] [PMC free article] [PubMed] [Google Scholar]
- 30.Pensa S et al. Signal transducer and activator of transcription 3 and the phosphatidylinositol 3-kinase regulatory subunits p55alpha and p50alpha regulate autophagy in vivo. FEBS J 281, 4557–4567, doi: 10.1111/febs.13035 (2014). [DOI] [PMC free article] [PubMed] [Google Scholar]
- 31.Jung JE et al. STAT3 is a potential modulator of HIF-1-mediated VEGF expression in human renal carcinoma cells. FASEB J 19, 1296–1298, doi: 10.1096/fj.04-3099fje (2005). [DOI] [PubMed] [Google Scholar]
- 32.Chen PH et al. The Inhibition of microRNA-128 on IGF-1-Activating mTOR Signaling Involves in Temozolomide-Induced Glioma Cell Apoptotic Death. PLoS One 11, e0167096, doi: 10.1371/journal.pone.0167096 (2016). [DOI] [PMC free article] [PubMed] [Google Scholar]
- 33.Byun JY et al. The Rac1/MKK7/JNK pathway signals upregulation of Atg5 and subsequent autophagic cell death in response to oncogenic Ras. Carcinogenesis 30, 1880–1888, doi: 10.1093/carcin/bgp235 (2009). [DOI] [PubMed] [Google Scholar]
- 34.Ao X, Zou L & Wu Y Regulation of autophagy by the Rab GTPase network. Cell Death Differ 21, 348–358, doi: 10.1038/cdd.2013.187 (2014). [DOI] [PMC free article] [PubMed] [Google Scholar]
- 35.Wang F, Chen X, Yu X & Lin Q Degradation of CCNB1 mediated by APC11 through UBA52 ubiquitination promotes cell cycle progression and proliferation of non-small cell lung cancer cells. Am J Transl Res 11, 7166–7185 (2019). [PMC free article] [PubMed] [Google Scholar]
- 36.Ocker M & Schneider-Stock R Histone deacetylase inhibitors: signalling towards p21cip1/waf1. Int J Biochem Cell Biol 39, 1367–1374, doi: 10.1016/j.biocel.2007.03.001 (2007). [DOI] [PubMed] [Google Scholar]
- 37.Leeman DS et al. Lysosome activation clears aggregates and enhances quiescent neural stem cell activation during aging. Science 359, 1277–1283, doi: 10.1126/science.aag3048 (2018). [DOI] [PMC free article] [PubMed] [Google Scholar]
- 38.Yoshii SR & Mizushima N Monitoring and Measuring Autophagy. Int J Mol Sci 18, doi: 10.3390/ijms18091865 (2017). [DOI] [PMC free article] [PubMed] [Google Scholar]
- 39.Khan S et al. Implication of Caspase-3 as a Common Therapeutic Target for Multineurodegenerative Disorders and Its Inhibition Using Nonpeptidyl Natural Compounds. Biomed Res Int 2015, 379817, doi: 10.1155/2015/379817 (2015). [DOI] [PMC free article] [PubMed] [Google Scholar]
- 40.Ona VO et al. Inhibition of caspase-1 slows disease progression in a mouse model of Huntington’s disease. Nature 399, 263–267, doi: 10.1038/20446 (1999). [DOI] [PubMed] [Google Scholar]
- 41.Portera-Cailliau C, Hedreen JC, Price DL & Koliatsos VE Evidence for apoptotic cell death in Huntington disease and excitotoxic animal models. J Neurosci 15, 3775–3787 (1995). [DOI] [PMC free article] [PubMed] [Google Scholar]
- 42.Soles-Tarres I et al. Pituitary Adenylate Cyclase-Activating Polypeptide (PACAP) Protects Striatal Cells and Improves Motor Function in Huntington’s Disease Models: Role of PAC1 Receptor. Front Pharmacol 12, 797541, doi: 10.3389/fphar.2021.797541 (2021). [DOI] [PMC free article] [PubMed] [Google Scholar]
- 43.Ganz J et al. A novel specific PERK activator reduces toxicity and extends survival in Huntington’s disease models. Sci Rep 10, 6875, doi: 10.1038/s41598-020-63899-4 (2020). [DOI] [PMC free article] [PubMed] [Google Scholar]
- 44.Leitman J et al. ER stress-induced eIF2-alpha phosphorylation underlies sensitivity of striatal neurons to pathogenic huntingtin. PLoS One 9, e90803, doi: 10.1371/journal.pone.0090803 (2014). [DOI] [PMC free article] [PubMed] [Google Scholar]
- 45.Ryabaya OO et al. Autophagy inhibitors chloroquine and LY294002 enhance temozolomide cytotoxicity on cutaneous melanoma cell lines in vitro. Anticancer Drugs 28, 307–315, doi: 10.1097/CAD.0000000000000463 (2017). [DOI] [PubMed] [Google Scholar]
- 46.Hidvegi T et al. An autophagy-enhancing drug promotes degradation of mutant alpha1-antitrypsin Z and reduces hepatic fibrosis. Science 329, 229–232, doi: 10.1126/science.1190354 (2010). [DOI] [PubMed] [Google Scholar]
- 47.Wang Y et al. An analog of glibenclamide selectively enhances autophagic degradation of misfolded alpha1-antitrypsin Z. PLoS One 14, e0209748, doi: 10.1371/journal.pone.0209748 (2019). [DOI] [PMC free article] [PubMed] [Google Scholar]
- 48.Martinez-Vicente M et al. Cargo recognition failure is responsible for inefficient autophagy in Huntington’s disease. Nat Neurosci 13, 567–576, doi: 10.1038/nn.2528 (2010). [DOI] [PMC free article] [PubMed] [Google Scholar]
- 49.Corces MR et al. An improved ATAC-seq protocol reduces background and enables interrogation of frozen tissues. Nat Methods 14, 959–962, doi: 10.1038/nmeth.4396 (2017). [DOI] [PMC free article] [PubMed] [Google Scholar]
- 50.Marti E et al. A myriad of miRNA variants in control and Huntington’s disease brain regions detected by massively parallel sequencing. Nucleic Acids Res 38, 7219–7235, doi: 10.1093/nar/gkq575 (2010). [DOI] [PMC free article] [PubMed] [Google Scholar]
- 51.Fox LM et al. Huntington’s Disease Pathogenesis Is Modified In Vivo by Alfy/Wdfy3 and Selective Macroautophagy. Neuron 105, 813–821 e816, doi: 10.1016/j.neuron.2019.12.003 (2020). [DOI] [PMC free article] [PubMed] [Google Scholar]
- 52.Xue Y, Fan X, Yang R, Jiao Y & Li Y miR-29b-3p inhibits post-infarct cardiac fibrosis by targeting FOS. Biosci Rep 40, doi: 10.1042/BSR20201227 (2020). [DOI] [PMC free article] [PubMed] [Google Scholar]
- 53.Zeng Y, Cui Z, Liu J, Chen J & Tang S MicroRNA-29b-3p Promotes Human Retinal Microvascular Endothelial Cell Apoptosis via Blocking SIRT1 in Diabetic Retinopathy. Front Physiol 10, 1621, doi: 10.3389/fphys.2019.01621 (2019). [DOI] [PMC free article] [PubMed] [Google Scholar]
- 54.Ashkenazi A et al. Polyglutamine tracts regulate beclin 1-dependent autophagy. Nature 545, 108–111, doi: 10.1038/nature22078 (2017). [DOI] [PMC free article] [PubMed] [Google Scholar]
- 55.Hanna J, Hossain GS & Kocerha J The Potential for microRNA Therapeutics and Clinical Research. Front Genet 10, 478, doi: 10.3389/fgene.2019.00478 (2019). [DOI] [PMC free article] [PubMed] [Google Scholar]
- 56.Baumann V & Winkler J miRNA-based therapies: strategies and delivery platforms for oligonucleotide and non-oligonucleotide agents. Future Med Chem 6, 1967–1984, doi: 10.4155/fmc.14.116 (2014). [DOI] [PMC free article] [PubMed] [Google Scholar]
- 57.Liu S et al. AIAP: A Quality Control and Integrative Analysis Package to Improve ATAC-seq Data Analysis. Genomics Proteomics Bioinformatics, doi: 10.1016/j.gpb.2020.06.025 (2021). [DOI] [PMC free article] [PubMed] [Google Scholar]
- 58.Chen EY et al. Enrichr: interactive and collaborative HTML5 gene list enrichment analysis tool. BMC Bioinformatics 14, 128, doi: 10.1186/1471-2105-14-128 (2013). [DOI] [PMC free article] [PubMed] [Google Scholar]
- 59.Kuleshov MV et al. Enrichr: a comprehensive gene set enrichment analysis web server 2016 update. Nucleic Acids Res 44, W90–97, doi: 10.1093/nar/gkw377 (2016). [DOI] [PMC free article] [PubMed] [Google Scholar]
Associated Data
This section collects any data citations, data availability statements, or supplementary materials included in this article.
Supplementary Materials
Data Availability Statement
All the deep-sequencing data (RNA-seq and ATAC-seq) has been uploaded to the Gene Expression Omnibus (GEO) repository: GSE194243. Source data that support all findings in the study are available as supplementary data. The data that support this study are available from the corresponding author upon reasonable request. Source data are provided with this paper.


