Background and Aims:
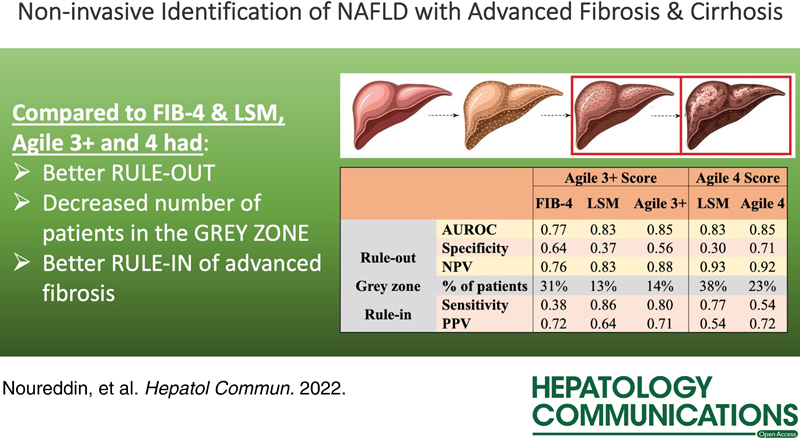
We explored 2 novel scores, Agile 3+ and 4, to identify advanced fibrosis (≥F3) and cirrhosis (F4), respectively, in NAFLD and compared their diagnostic performances to liver stiffness measurement (LSM) by vibration-controlled transient elastography and fibrosis-4 index (FIB-4) (for Agile 3+).
Approach and Results:
This multicenter study included 548 NAFLD patients with laboratory testing, liver biopsy, and vibration-controlled transient elastography within 6 months. Agile 3+ and 4 were applied and compared with FIB-4 or LSM alone. Goodness of fit was evaluated using a calibration plot and discrimination using area under the receiver operating curve. Area under the receiver operating curves was compared using the Delong test. Dual cutoff approaches were applied to rule out and rule in ≥F3 and F4. Median (interquartile range) age was 58 (15) years. Median body mass index was 33.3 (8.5) kg/m2. Fifty-three percent had type 2 diabetes, 20% had F3, and 26% had F4. Agile 3+ demonstrated an area under the receiver operating curve of 0.85 (0.81; 0.88) similar to that of LSM [0.83 (0.79; 0.86), p=0.142] but significantly higher than that of FIB-4 [0.77 (0.73; 0.81), p<0.0001). Agile 4’s area under the receiver operating curve [0.85 (0.81; 0.88)] was similar to that of LSM [0.85 (0.81; 0.88), p=0.065). However, the percentage of patients with indeterminate results was significantly lower with Agile scores compared with FIB-4 and LSM (Agile 3+: 14% vs. FIB-4: 31% vs. LSM: 13%, p<0.001; Agile 4: 23% vs. LSM: 38%, p<0.001).
Conclusions:
Agile 3+ and 4 are novel vibration-controlled transient elastography–based noninvasive scores that increase accuracy in the identification of advanced fibrosis and cirrhosis respectively and are ideal for clinical use due to a lower percentage of indeterminant outputs compared with FIB-4 or LSM alone.
NAFLD is the most common cause of chronic liver disease worldwide, affecting 25%–35% of the global adult population and up to 70% of those with type 2 diabetes and obesity.1 Because NASH is associated with fibrosis, cirrhosis, and even HCC, NAFLD is one of the leading indicators for liver transplantation in Europe and the US.1,2 As NAFLD is often clinically silent, a key challenge is identifying those with advanced fibrosis (fibrosis stage of ≥F3) and cirrhosis (F4) who are at significantly higher risk of liver-related mortality.3
Currently, risk stratification of liver fibrosis ranges from noninvasive assessment scores to percutaneous liver biopsy. Although the reference method to assess liver fibrosis, liver biopsy is invasive and limited by cost, sampling variability, and intrareader/interreader variability.4 Noninvasive modalities to risk stratify fibrosis include serum biomarkers, imaging, and algorithms combining both. Among the serum biomarkers, fibrosis-4 index (FIB-4) and NAFLD fibrosis score have demonstrated high accuracy in excluding advanced fibrosis with negative predictive values >90%.5 In regard to imaging modalities, liver stiffness measurement (LSM) by vibration-controlled transient elastography (VCTE) is accurate in excluding advanced fibrosis and cirrhosis with negative predictive values of ~90%.6 However, FIB-4, NAFLD fibrosis score, and LSM by VCTE are inadequate for ruling in advanced fibrosis or cirrhosis and often necessitate additional testing in the case of positive results.7 The novel Fibroscan-based Agile 3+ and 4 scores combining LSM by VCTE with constitutive demographic data (age, sex, and presence of type 2 diabetes) and serum biomarkers (aspartate aminotransferase, alanine transaminase, and platelets) were recently introduced to better rule in advanced fibrosis and cirrhosis, respectively, in NAFLD.8,9
We aimed to perform an independent validation of the Agile 3+ and 4 scores performance for diagnosing advanced fibrosis and cirrhosis, respectively, in a mulicenter real-world cohort of NAFLD patients in the US. We further compared the Agile 3+ and 4 score performances to FIB-4 and LSM using previously published cutoff values.
PATIENTS AND METHODS
Participants
This analysis included adults with biopsy-proven NAFLD from 1 outpatient clinic and 3 tertiary care centers from Arizona (Arizona Liver Health), California (Cedars Sinai Medical Center, California Liver Institute), and Indiana (Indiana University) in the US.
Data were collected between 2014 and 2021 from patients with NAFLD who underwent liver biopsy, VCTE, and laboratory tests within 6 months. Subjects were excluded for the following: (1) missing data necessary for calculating the Agile 3+ and 4 scores, (2) missing fibrosis stage on liver biopsy, or (3) history of chronic liver disease other than NAFLD including autoimmune hepatitis, α1-antitrypsin deficiency, chronic hepatitis B or C, primary sclerosing cholangitis, primary biliary cholangitis, hemochromatosis, Wilson disease, or medications that can drive hepatic steatosis. Patients completed in-depth medical history, physical examination, and laboratory assessment before undergoing LSM. Liver biopsy was performed in the presence of abnormalities that raised concern for clinically significant NAFLD such as high LSM or diabetes, with or without elevated liver biochemistries. This study was exempt from institutional review board.
Vibration-controlled transient elastography
For LSM by VCTE (Fibroscan 502 Touch, Echosens, Paris, France), the speed of a mechanically generated 50 Hz shear wave across the liver was measured and then converted into LSM in kilo Pascals (kPa). VCTE was performed on patients after fasting for at least 3 hours before the examination by certified physicians, nurses, or technicians who were blinded to clinical data. The M or XL probe was selected based on the automatic probe selection tool provided by the software. After patients were placed supine with the fully abducted right arm, the right liver lobe was scanned through an intercostal space to obtain a minimum of 10 valid measurements. The final results consisted of the median of all valid measurements and was considered adequate for statistical analysis if the interquartile range over the median ratio was inferior or equal to 30%.10
Liver histology
The histological assessments at the local institutions were performed by hepatopathologists according to the NASH Clinical Research Network scoring system.11 Fibrosis stage (F0-F4) was defined as no fibrosis (F0), either mild-moderate perisinusoidal or periportal fibrosis (F1), both perisinusoidal and portal/periportal fibrosis (F2), bridging fibrosis (F3), and cirrhosis (F4).
Outcomes
The main outcomes were the performance of Agile 3+ and 4 for the diagnosis of advanced fibrosis (≥F3) and cirrhosis (F4), respectively.
Statistical analysis
Patient characteristics were reported as median (interquartile range) and the number of available data for numerical variables and frequency and percentage for categorical variables.
For each patient, Agile 3+ and Agile 4 were calculated as:
Considering diabetes status: yes =1, no =0 and sex: male =1, female =0,
with logit (p F = 4) = 7.50139−15.42498 × − 0.01378 × PLT − 1.41149 × AAR−1 − 0.53281 × Sex + 0.41741 × Diabetes status
with logit (p F≥3) = −3.92368 + 2.29714 × ln(LSM) − 0.00902 × PLT − 0.398633 × AAR−1 + 1.08636 × Diabetes status − 0.38581 × Sex + 0.03018 × Age
Both scores’ performances were assessed using fibrosis stage by histology as the reference by the goodness of fit and discrimination and compared with LSM alone and FIB-4 used as predictors of advanced fibrosis and cirrhosis. The goodness of fit (the agreement between observed outcome and prediction) was evaluated using calibration plots and discrimination using the area under the receiver operating curve (AUROC).12 AUROC comparisons were performed using the Delong test (at a 2-sided 5% significance level).13 Dual cutoff approach with cutoffs of high sensitivity and high specificity already published for the different noninvasive tests was applied to rule out and rule in advanced fibrosis and cirrhosis.8,9 When appraising performance at a given cutoff, sensitivity, specificity, positive predictive value, negative predictive value, positive likelihood ratio and negative likelihood ratio were computed. Proportion of patients with indeterminate results with each noninvasive method were compared using z-test. Statistical analyses were computed using the R software (https://www.r-project.org/)
RESULTS
Baseline characteristics
In total, 548 of 745 subjects were included for statistical analysis (Supplemental Figure 1). Table 1 illustrates baseline characteristics of study participants overall, with obesity, and with diabetes. Median (interquartile range) age was 58 (15) years, and median body mass index was 33.3 kg/m2 (8.5). Fifty-three percent had diabetes, 52% had hypertension, 72% were obese, and 20% were morbidly obese. The prevalence of NASH was 50%. The median FIB-4 score was 1.67 (1.61), whereas the median LSM by VCTE was 12 kPa (10). Of these 548, 75 (14%) had F0, 114 (21%) had F1, 104 (19%) had F2, 111 (20%) had F3, and 144 (26%) had F4. The score boxplots of noninvasive values by fibrosis stage through Agile 3+, Agile 4, FIB-4, and LSM are shown in Figure 1.
TABLE 1.
Demographic characteristics of study cohort overall, with obesity, and with diabetes
| Median (IQR) | Overall | Patients with obesity | Patients with diabetes |
|---|---|---|---|
| Demographics | |||
| Age (y) | n=548 | n=359 | n=292 |
| 58 (15) | 57 (15) | 59 (14) | |
| Male sex, N/n (%) | 190/548 (35) | 124/359 (35) | 100/292 (34) |
| BMI (kg/m²) | n=501 | n=359 | n=267 |
| 33.3 (8.5) | 35.7 (7.5) | 33.3 (8.1) | |
| Comorbidities, N/n (%) | |||
| Diabetes | 292/548 (53) | 199/359 (55) | 292/292 (100) |
| Hypertension | 283/547 (52) | 193/359 (54) | 176/292 (60) |
| Obesity | 359/501 (72) | 359/359 (100) | 199/267 (75) |
| Morbid obesity | 99/501 (20) | 99/359 (28) | 53/267 (20) |
| Blood | |||
| AST (IU/L) | n=548 | n=359 | n=292 |
| 36 (30) | 40 (31) | 35 (28) | |
| ALT (IU/L) | n=548 | n=359 | n=292 |
| 44 (42) | 45 (46.5) | 41 (39) | |
| AST/ALT | n=548 | n=359 | n=292 |
| 0.9 (0.4) | 0.8 (0.4) | 0.9 (0.4) | |
| Platelets (1000/uL) | n=548 | n=359 | n=292 |
| 208 (111) | 214 (112) | 204 (102) | |
| HDL (mmol/L) | n=413 | n=264 | n=292 |
| 1.2 (0.4) | 1.2 (0.4) | 1.1 (0.4) | |
| LDL (mmol/L) | n=401 | n=255 | n=209 |
| 2.5 (1.2) | 2.5 (1.2) | 2.4 (1.2) | |
| Albumin (g/L) | n=534 | n=353 | n=287 |
| 44 (4) | 43 (4) | 44 (5) | |
| Bilirubin (µmol/L) | n=547 | n=358 | n=292 |
| 10.3 (6.8) | 9.3 (5.1) | 10.3 (6.8) | |
| Alkaline phosphatase (IU/L) | n=405 | n=272 | n=223 |
| 81 (36) | 82 (37) | 81 (38) | |
| Noninvasive tests | |||
| FIB-4 | n=548 | n=359 | n=292 |
| 1.67 (1.61) | 1.7 (1.5) | 1.7 (1.5) | |
| LSM by VCTE (kPa) | n=548 | n=359 | n=292 |
| 12 (10) | 13 (10) | 12 (10) | |
| Fibrosis, N/n (%) | |||
| NASH | 239/477 (50) | 167/310 (54) | 133/252 (53) |
| Fibrosis stage by Kleiner, N/n (%) | |||
| F0 | 75/548 (14) | 46/359 (13) | 35/292 (12) |
| F1 | 114/548 (21) | 73/359 (20) | 49/292 (17) |
| F2 | 104/548 (19) | 75/359 (21) | 61/292 (21) |
| F3 | 111/548 (20) | 70/359 (20) | 72/292 (25) |
| F4 | 144/548 (26) | 95/359 (27) | 75/292 (26) |
Note: Obesity is defined as BMI ≥30. Morbid obesity is defined as BMI ≥35.
Abbreviations: ALT, alanine aminotransferase; AST, aspartate aminotransferase; BMI, body mass index; F0, fibrosis stage 0; F1, fibrosis stage 1; F2, fibrosis stage 2; F3, fibrosis stage 3; F4, fibrosis stage 4; FIB-4, fibrosis-4 index; IQR, interquartile range; LSM, liver stiffness measurement; VCTE, vibration-controlled transient elastography.
FIGURE 1.
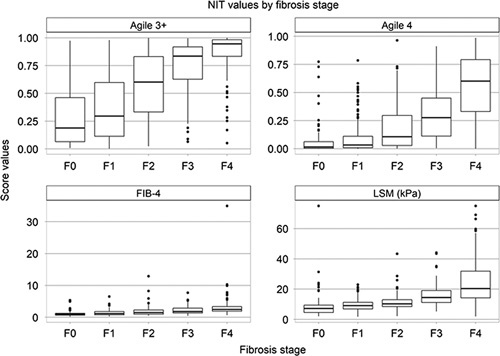
Noninvasive test values by fibrosis stage assessed by liver biopsy. Abbreviations: F0, fibrosis stage 0; F1, fibrosis stage 1; F2, fibrosis stage 2; F3, fibrosis stage 3; F4, fibrosis stage 4; FIB-4, fibrosis-4 index; LSM, liver stiffness measurement; NIT, noninvasive test.
Agile 3+ in comparison with FIB-4 and LSM for the identification of advanced fibrosis
Figure 2A illustrates the goodness of Agile 3+. The performance of the Agile 3+ in identifying those with advanced fibrosis (≥F3) was compared with those of FIB-4 and LSM by VCTE (Table 2, Figure 2B). For the rule-out and rule-in cutoffs, we, respectively, applied the following previously published cutoffs values of <0.451 and ≥0.679 for Agile 3+, <1.3 (<65 y)/<2.0 (≥65 y) and >2.67 for FIB-4, and <8 and >9.6 for LSM.8,14,15
FIGURE 2.
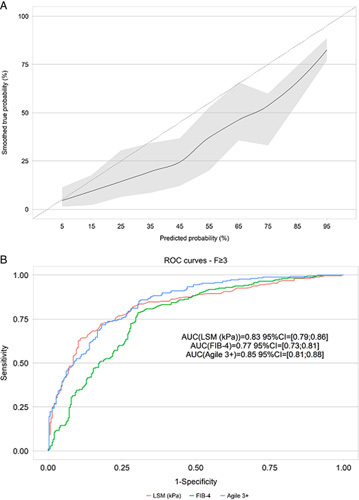
Goodness of fit of Agile 3+ (A) and ROC curves of Agile 3+, FIB-4, and LSM for the identification of advanced fibrosis (≥fibrosis stage 3) using liver biopsy as the reference. Abbreviations: FIB-4, fibrosis-4 index; LSM, liver stiffness measurement; ROC, receiver operator curve.
TABLE 2.
Performance of Agile 3+ versus FIB-4 and LSM by VCTE in identifying advanced fibrosis
| FIB-4 | LSM | Agile 3+ | |
|---|---|---|---|
| AUROC (95% CI) | 0.77 (0.73; 0.81) | 0.83 (0.79; 0.86) | 0.85 (0.81; 0.88) |
| Delong test p (vs. Agile 3+) | <0.0001 | 0.142 | NA |
| Rule out cutoff | <1.3 (<65 y) | <8.0 | <0.451 |
| <2.0 (≥65 y) | — | — | |
| Percentage of patients | 45 | 24 | 34 |
| Se | 0.77 (0.718; 0.822) | 0.91 (0.875; 0.945) | 0.91 (0.875; 0.945) |
| Sp | 0.64 (0.695; 0.858) | 0.37 (0.315; 0.425) | 0.56 (0.503; 0.617) |
| NPV | 0.76 (0.707; 0.813) | 0.83 (0.766; 0.894) | 0.88 (0.834; 0.926) |
| LR− | 0.36 | 0.23 | 0.16 |
| Gray zone | |||
| Percentage of patients (p-value vs. Agile 3+) | 31 (p<0.001) | 13 (p<0.001) | 14 |
| Rule in cutoff | ≥2.67 | >9.6 | ≥0.679 |
| Percentage of patients | 24 | 63 | 52 |
| Se | 0.38 (0.320; 0.440) | 0.86 (0.817; 0.903) | 0.80 (0.751; 0.849) |
| Sp | 0.87 (0.831; 0.909) | 0.58 (0.523; 0.637) | 0.72 (0.669; 0.771) |
| PPV | 0.72 (0.644; 0.796) | 0.64 (0.589; 0.691) | 0.71 (0.657; 0.763) |
| LR+ | 2.93 | 2.04 | 2.86 |
Advanced fibrosis defined as ≥F3.
Abbreviations: AUROC, area under the receiver operator curve; F3, fibrosis stage 3; FIB-4, fibrosis-4 index; LR+, positive likelihood ratio; LR−, negative likelihood ratio; LSM, liver stiffness measurement; NPV, negative predictive value; PPV, positive predictive value; Se, sensitivity; Sp, specificity; VCTE, vibration-controlled transient elastography.
Overall, AUROC of Agile 3+ was significantly higher than that of FIB-4 [Agile 3+: 0.85 (0.81; 0.88), FIB-4: 0.77 (0.73; 0.81), p<0.0001], but similar to the AUROC of LSM [0.83 (0.79; 0.86), p=0.142]. Percentages of patients with indeterminate results was significantly lower for Agile 3+ and LSM compared with FIB-4 (Agile 3+: 14%, LSM: 13%, FIB-4: 31%, p<0.0001). At the rule-out cutoff, compared with FIB-4 and LSM, Agile 3+ exhibited similar sensitivity (within 0.10) to that of LSM but better sensitivity than that of FIB-4 (Agile 3+: 0.91, LSM: 0.91, FIB-4: 0.77), similar specificity to that of FIB-4 but better specificity than that of LSM (Agile 3+: 0.56, FIB-4: 0.64, LSM: 0.37), and overall highest negative predictive value (Agile 3+: 0.88, FIB-4: 0.76, LSM: 0.83), though overall lowest negative likelihood ratio (Agile 3+: 0.16, FIB-4: 0.36, LSM: 0.23). At the rule in cutoff, Agile 3+ demonstrated similar sensitivity to that of LSM but better sensitivity than that of FIB-4 (Agile 3+: 0.80, FIB-4: 0.38, LSM: 0.86), better specificity than that of LSM but lower specificity than that of FIB-4 (Agile 3+: 0.72, FIB-4: 0.87, LSM: 0.58), similar positive predictive value (Agile 3+: 0.71, FIB-4: 0.72, LSM: 0.64), and similar positive likelihood ratio to that of FIB-4 but better positive likelihood ratio than that of LSM (Agile 3+: 2.86, FIB-4: 2.93, LSM: 2.04).
The performances of the Agile 3+, FIB-4, and LSM by VCTE in identifying advanced fibrosis (≥F3) are graphed in Figure 3. Subgroup analyses in patients with obesity and diabetes are, respectively, shown in Supplemental Tables 1 and 2 (http://links.lww.com/HC9/A122, http://links.lww.com/HC9/A123).
FIGURE 3.
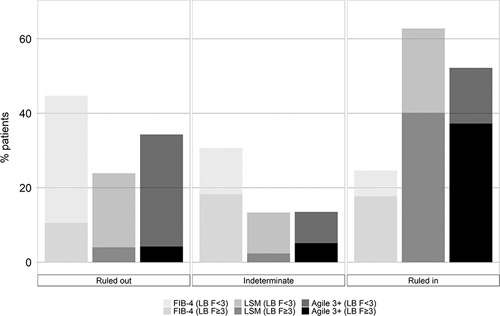
Performance of Agile 3+ versus FIB-4 and LSM by vibration-controlled transient elastography in identifying advanced fibrosis. In the rule-out zone, FIB-4 (LB F<3) represents the percentage of patients with a FIB-4 under the rule-out cutoff and with a fibrosis stage <3 (true negative). FIB-4 (LB F≥3) represents the percentage of patients with a FIB-4 under the rule-out cutoff and a fibrosis stage ≥3 (false negative). In the intermediate zone, FIB-4 (LB F<3) represents the percentage of patients with a FIB-4 between the rule-out and the rule-in cutoffs and a fibrosis stage <3. FIB-4 (LB F≥3) represents the percentage of patients with a FIB-4 between the rule-out and the rule-in cutoffs and a fibrosis stage ≥3. In the rule-in zone, FIB-4 (LB F<3) represents the percentage of patients with a FIB-4 above the rule-in cutoff and with a fibrosis stage <3 (false positive). FIB-4 (LB F≥3) represents the percentage of patients with a FIB-4 above the rule-in cutoff and a fibrosis stage ≥3 (true positive). As with FIB-4, the same interpretation applies with LSM (LB F<3), LSM (F≥3), Agile 4 (LB F<3), and Agile (LB F≥3). Advanced fibrosis is defined as ≥fibrosis stage 3. Abbreviations: FIB-4, fibrosis-4 index; LB, liver biopsy; LSM, liver stiffness measurement.
Agile 4 performance in comparison to LSM for the identification of cirrhosis
The performance of Agile 4 in identifying those with cirrhosis (F4) compared with LSM is shown in Figure 4 and Table 3. The AUROCs of Agile 4 and LSM were similar [Agile 4: 0.85 (0.81; 0.88) vs. LSM: 0.83 (0.78; 0.87), p=0.065]. For the rule-out and rule-in cutoffs, we, respectively, applied published cutoffs of <0.251 and ≥0.565 for Agile 4 and <8 and ≥14 for LSM.9,14 Agile 4 was not compared with FIB-4 using the dual cutoff approach because of the lack of published cutoffs for FIB-4 in identifying cirrhosis.
FIGURE 4.
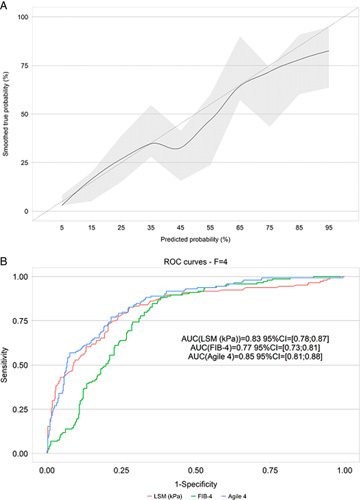
Goodness of fit of Agile 4 (A) and ROC curves of Agile 4, FIB-4, and LSM for the identification of cirrhosis (fibrosis stage 4) using liver biopsy as the reference. Abbreviations: FIB-4, fibrosis-4 index; LSM, liver stiffness measurement; ROC, receiver operator curve.
TABLE 3.
Performance of Agile 4 versus LSM in identifying cirrhosis
| LSM | Agile 4 | |
|---|---|---|
| AUROC (95% CI) | 0.83 (0.78; 0.87) | 0.85 (0.81; 0.88) |
| Delong test p (vs. Agile 4) | 0.065 | NA |
| Rule out cutoff (Sen 90%) | <8 | <0.251 |
| Percentage of patients | 24 | 57 |
| Se | 0.94 (0.901; 0.979) | 0.83 (0.769; 0.891) |
| Sp | 0.30 (0.255; 0.345) | 0.71 (0.666; 0.754) |
| NPV | 0.93 (0.886; 0.974) | 0.92 (0.890; 0.950) |
| LR− | 0.21 | 0.24 |
| Gray zone | ||
| Percentage of patients (p-value vs. Agile 4) | 38 (p<0.001) | 23 |
| Rule in cutoff (Spec 90%) | >14 | ≥0.565 |
| Percentage of patients | 38 | 20 |
| Se | 0.77 (0.701; 0.839) | 0.54 (0.459; 0.621) |
| Sp | 0.76 (0.718; 0.802) | 0.93 (0.905; 0.955) |
| PPV | 0.54 (0.472; 0.608) | 0.72 (0.635; 0.805) |
| LR+ | 3.24 | 7.29 |
Abbreviations: AUROC, area under the receiver operator curve; FIB-4, fibrosis-4 index; LR+, positive likelihood ratio; LR−, negative likelihood ratio; LSM, liver stiffness measurement; NPV, negative predictive value; PPV, positive predictive value; Se, sensitivity; Sp, specificity; VCTE, vibration-controlled transient elastography.
The percentages of patients within the indeterminate zone were significantly lower with Agile 4 (23%) versus LSM (38%) (p<0.0001). At the rule out cutoff, compared with LSM, Agile 4 exhibited higher specificity (Agile 4: 0.71 vs. LSM: 0.30) and negative likelihood ratio (Agile 4: 0.24 vs. LSM: 0.21) and similar sensitivity (Agile 4: 0.83 vs. LSM: 0.94) and NPV (Agile 4: 0.92 vs. LSM: 0.93). At the rule-in cutoff, Agile 4 demonstrated higher specificity (Agile 4: 0.93 vs. LSM: 0.76), positive predictive value (Agile 4: 0.72 vs. LSM: 0.52), and positive likelihood ratio (Agile 4: 7.29 vs. LSM: 3.24), but lower sensitivity (Agile 4: 0.54 vs. LSM: 0.77).
The performances of Agile 4 and LSM by VCTE in identifying cirrhosis (F4) are graphed in Figure 5. Subgroup analyses in patients with obesity and diabetes are, respectively, shown in Supplemental Tables 3 and 4 (http://links.lww.com/HC9/A124, http://links.lww.com/HC9/A125).
FIGURE 5.
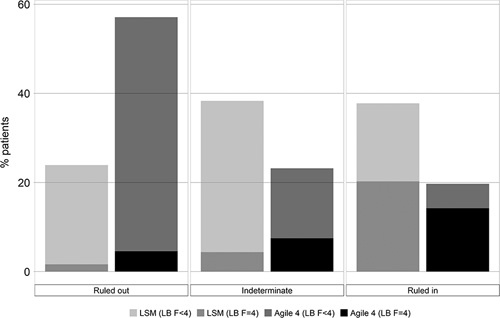
Performance of Agile 4 versus LSM by vibration-controlled transient elastography in identifying cirrhosis. In the rule-out zone, LSM (LB F<4) represents the percentage of patients with an LSM under the rule-out cutoff and with a fibrosis stage <4 (true negative). LSM (LB F=4) represents the percentage of patients with an LSM under the rule-out cutoff and a fibrosis stage = 4 (false negative). In the intermediate zone, LSM (LB F<4) represents the percentage of patients with an LSM between the rule-out and the rule-in cutoffs and a fibrosis stage <4. LSM (LB F=4) represents the percentage of patients with an LSM between the rule-out and the rule-in cutoffs and a fibrosis stage = 4. In the rule-in zone, LSM (LB F<4) represents the percentage of patients with an LSM above the rule-in cutoff and with a fibrosis stage <4 (false positive). LSM (LB F=4) represents the percentage of patients with an LSM above the rule-in cutoff and a fibrosis stage = 4 (true positive). As with LSM, the same interpretation applies with Agile 4 (LB F<4) and Agile (LB F=4). Cirrhosis is defined as fibrosis stage 4. Abbreviations: LB, liver biopsy; LSM, liver stiffness measurement.
DISCUSSION
Given the clinical silence of NAFLD disease progression, it is essential to identify those with advanced fibrosis and cirrhosis, as later stages of fibrosis are associated with higher risk of mortality and necessitate therapeutic intervention.3 This study independently validated the Agile 3+ and 4 scores for noninvasively identifying NAFLD patients with advanced fibrosis and cirrhosis, respectively, and compared the Agile 3+ and 4 scores’ performances to those of FIB-4 and LSM.
Both the Agile 3+ and 4 scores performed superiorly to FIB-4 and LSM by VCTE and maintained good accuracy for the diagnosis of advanced fibrosis and cirrhosis, respectively. Both the Agile 3+ and 4 scores demonstrated good calibration with the curve close to the ideal calibration line. Both Agile 3+ and 4 scores exhibited good accuracy, though their AUROCs were not significantly different but numerically higher from those of LSM. The Agile 3+ and 4 scores’ strengths lie in their 2-score cutoffs approach that significantly decreased the percentages of patients in the indeterminate zone compared with FIB-4 and LSM. The Agile scores demonstrated (1) improvement in the number of patients properly ruled out with higher specificity and negative predictive value in the rule-out zone for both Agile 3+ and 4 compared with FIB-4 and LSM except for similar specificity to that of FIB-4 for Agile 3+, (2) improvement in the identification of advanced fibrosis (Agile 3+) with higher sensitivity compared with FIB-4 and higher positive likelihood ratio compared with LSM in the rule in zone, and (3) overall better discrimination with the least number of patients in the indeterminate zone compared with both FIB-4 and LSM, except for Agile 3+ (14%) compared with LSM (13%).
The improvements associated with Agile 3+ and Agile 4 are particularly important, as patients with ≥F3 and F4 are at the highest risk of developing clinical liver events and outcomes; these 2 groups were previously not sufficiently well ruled in using LSM by VCTE of FIB-4.16 Adding these scores will increase the confidence of users that their patients have either ≥F3 or F4 and eventually identify patients candidates for therapies more accurately in clinical practice and trigger surveillance for the occurrence of complications such as esophageal varices and HCC.
Major strengths of Agile 3+ and 4 include their noninvasive combination of serum biomarkers and LSM by VCTE and performance accuracy. Through the noninvasive identification of, respectively, advanced fibrosis and cirrhosis, the Agile 3+ and 4 scores decrease the need for invasive liver biopsies. As FIB-4 and LSM by VCTE are insufficient for ruling-in advanced stages of fibrosis, the Agile 3+ and 4 scores also reduce additional healthcare testing that might have been warranted in the case of a positive FIB-4 or LSM.7 Furthermore, the Agile 3+ and 4 scores’ better discrimination with reduced number of patients in the indeterminate zone will inform next steps and aid clinical decision-making. Finally, the Agile 3+ and 4 scores use dual score cutoffs that may be applied to identify advanced fibrosis and cirrhosis, respectively, in the clinical trials and clinical setting with high utility and ease.
This study has several limitations. This study is a retrospective analysis. However, the overall study cohort consisted of 4 well-characterized study populations that not only originate from multiple tertiary care centers that follow standardized criteria for performing noninvasive testing and liver biopsy but also included the entire spectrum of NAFLD. Furthermore, the study cohort was large despite its adherence to stringent study inclusion requirements including laboratory tests liver biopsy, and LSM by VCTE within 6 months. Second, the prevalence rates for advanced fibrosis (46%) and cirrhosis (26%) are higher than those in the general community, but these high prevalence rates empower robust analysis of the performances of the Agile 3+ and 4 scores in comparison to FIB-4 and LSM. Third, although histological readings were not completed centrally, readings were performed by experienced hepatopathologists at each center. Fourth, clinical uptake of the Agile 3+ and 4 scores may be limited by availability of VCTE that requires investing in training personnel and device supply. Still, VCTE remains more cost-effective and risk free than similar imaging modalities such as CT or MRI.17–19 Indeed, VCTE has already been implemented by many experts and society guidelines as an important step for assessing disease severity in NAFLD patients.20,21 In addition, the constitutive demographic data (age, sex, and presence of type 2 diabetes) and serum biomarkers (aspartate aminotransferase, alanine transaminase, and platelets) used in Agile 3+ and 4 are incorporated in the standard examination of any liver disease. The Agile 3+ and 4 scores have been included into online calculators with high clinical utility.
In summary, introducing the noninvasive Agile 3+ and 4 scores is important given its improved discrimination with decreased indeterminate rate and increased accuracy in properly ruling in and ruling out patients with late stages of fibrosis. By successfully identifying advanced fibrosis and cirrhosis, respectively, the Agile 3+ and 4 scores will aid clinicians in targeting those who are at higher risk for liver-related mortality and may benefit from therapeutic intervention and surveillance for the development of end-stage liver disease complications.
AUTHOR CONTRIBUTIONS
Mazen Noureddin: participated in the design of the study, interpreted the data, and critically revised the manuscript for important intellectual content. Edward Mena, Raj Vuppalanchi, Niharika Samala, Micaela Wong, Fabiana Pacheco, Prido Polanco, Celine Sakkal, Ani Antaramian, Devon Chang, Nabil Noureddin, Anita Kohli, Stephen A. Harrison, Samer Gwarieh3, and Naim Alkhouri: interpreted the data and critically revised the manuscript for important intellectual content. Emily Truong: participated in the design of the study, interpreted the data, and drafted the manuscript.
FUNDING INFORMATION
EchoSens financially supported this project in the later stages.
CONFLICTS OF INTEREST
Mazen Noureddin has been on the advisory board for 89BIO, Gilead, Intercept, Pfizer, Novartis, Novo Nordisk, Allergan, Blade, EchoSens, Fractyl, Terns, OWL, Siemens, Roche diagnostic and Abbott; Mazen Noureddin has received research support from Allergan, BMS, Gilead, Galmed, Galectin, Genfit, Conatus, Enanta, Madrigal, Novartis, Shire, Viking, and Zydus; Mazen Noureddin is a minor shareholder or has stocks in Anaetos and Viking. Raj Vuppalanchi consulting agreements for data safety monitoring board for Labcorp, Medpace, Worldwide clinical trials, and Enyo. Raj Vuppalanchi has received institutional research funding from Gilead, Galectin, Eli Lilly, Zydus therapeutics, Arrowhead, Novo Nordisk, and Intercept and is a minor shareholder or has stocks in Viking and Lipocene. Samer Gwarieh has consulted for TransMedics and Pfizer and received research grant support from Cirius, Galmed, Viking, Zydus, and Sonic Incytes. Naim Alkhouri: advisory board/review panel member for 89 Bio, Echosens, Enyo, Fibronostics, Gilead, Intercept, LG Chem, NGM, Perspectum, Pfizer, Terns, and Zydus; grant/research support from 89Bio, Akero, Bristol-Myers Squibb, Enanta, Enyo, Genentech, Gilead, Intercept, Madrigal, NGM Bio, Novo Nordisk, Pfizer, Viking, and Zydus; speaker for Abbvie, Alexion, Echosens, Gilead, and Intercept. Stephen A. Harisson grant support for research (Akero Therapeutics, Altimmune, Axcella Health, Cirius Therapeutics, CiVi Biopharma, CymaBay Therapeutics, Enyo Pharma, Galectin Therapeutics, Galmed Research and Development, Genfit, Gilead Sciences, Hepion Pharmaceuticals, Corcept, DSM, Galectin, Genentech, Genfit, Gilead, Hepagene, Healio, Intercept, Inventiva, Ionis, Madrigal, Merck, NGM, Noom, NorthSea, Novo Nordisk, Perspectum, Pfizer, Poxel, Viking and Zydus), speaker bureau (AbbVie–Allergan, Alexion, Echosens, Eisai, Exelixis, Gilead, Intercept, Perspectum, Salix and Theratechnologies), consultant (AbbVie–Allergan, Echosens, Fibronostics, Gilead, Intercept, Madrigal, Novo Nordisk, Perspectum, Pfizer and Zydus). The remaining author have nothing to report.
Footnotes
Abbreviations: ALT, alanine transaminase; AST, aspartate aminotransferase; AUROC, area under the receiver operator curve; BMI, body mass index; F0, fibrosis stage 0; F1, fibrosis stage 1; F2, fibrosis stage 2; F3, fibrosis stage 3; ≥F3, advanced fibrosis; F4, fibrosis stage 4 or cirrhosis; FIB-4, fibrosis-4 index; LR−, negative likelihood ratio; LR+, positive likelihood ratio; LSM, liver stiffness measurement; NPV, negative predictive value; PPV, positive predictive value; Se, sensitivity; Sp, specificity; VCTE, vibration-controlled transient elastography.
Naim Alkhouri denotes coauthor.
Supplemental Digital Content is available for this article. Direct URL citations are provided in the HTML and PDF versions of this article on the journal’s website, www.hepcommjournal.com.
Contributor Information
Mazen Noureddin, Email: Mazen.Noureddin@cshs.org.
Edward Mena, Email: edward.mena@caliverresearch.org.
Raj Vuppalanchi, Email: rvuppala@iu.edu.
Niharika Samala, Email: nrsamala@iu.edu.
Micaela Wong, Email: micaelawg@gmail.com.
Fabiana Pacheco, Email: fabiana.pacheco@caliverresearch.org.
Prido Polanco, Email: polanco1105@gmail.com.
Celine Sakkal, Email: celinesakkal@gmail.com.
Ani Antaramian, Email: ani.antaramian@cshs.org.
Devon Chang, Email: devonychang@gmail.com.
Nabil Noureddin, Email: nabilnoureddin@gmail.com.
Anita Kohli, Email: AKohli@azliver.com.
Stephen A. Harrison, Email: stephenharrison87@gmail.com.
Samer Gwarieh, Email: sgawrieh@iu.edu.
Naim Alkhouri, Email: nalkhouri@azliver.com.
Emily Truong, Email: Emily.Truong@cshs.org.
REFERENCES
- 1.Younossi Z, Anstee QM, Marietti M, Hardy T, Henry L, Eslam M, et al. Global burden of NAFLD and NASH: Trends, predictions, risk factors and prevention. Nat Rev Gastroenterol Hepatol. 2018;15:11–20. [DOI] [PubMed] [Google Scholar]
- 2.Haldar D, Kern B, Hodson J, Armstrong MJ, Adam R, Berlakovich G, et al. Outcomes of liver transplantation for non-alcoholic steatohepatitis: a European Liver Transplant Registry study. J Hepatol. 2019;71:313–22. [DOI] [PMC free article] [PubMed] [Google Scholar]
- 3.Ekstedt M, Hagström H, Nasr P, Fredrikson M, Stål P, Kechagias S, et al. Fibrosis stage is the strongest predictor for disease-specific mortality in NAFLD after up to 33 years of follow-up. Hepatology. 2015;61:1547–54. [DOI] [PubMed] [Google Scholar]
- 4.Sumida Y. Limitations of liver biopsy and non-invasive diagnostic tests for the diagnosis of nonalcoholic fatty liver disease/nonalcoholic steatohepatitis. World J Gastroenterol. 2014;20:475–85. [DOI] [PMC free article] [PubMed] [Google Scholar]
- 5.Xiao G, Zhu S, Xiao X, Yan L, Yang J, Wu G. Comparison of laboratory tests, ultrasound, or magnetic resonance elastography to detect fibrosis in patients with nonalcoholic fatty liver disease: a meta‐analysis. Hepatology. 2017;66:1486–150 1. [DOI] [PubMed] [Google Scholar]
- 6.European Association for Study of Liver; Asociacion Latinoamericana para el Estudio del Higado. EASL-ALEH Clinical Practice Guidelines: non-invasive tests for evaluation of liver disease severity and prognosis. J Hepatol. 2015;63:237–64. [DOI] [PubMed] [Google Scholar]
- 7.Castera L, Friedrich-Rust M, Loomba R. Noninvasive assessment of liver disease in patients with nonalcoholic fatty liver disease. Gastroenterology. 2019;156:1264–81.e4. [DOI] [PMC free article] [PubMed] [Google Scholar]
- 8.Younossi Z, Harrison S, Newsome P. Development and validation of Agile 3+: novel FibroScan-based score for the diagnosis of advanced fibrosis in patients with non-alcoholic fatty liver disease. 2021.
- 9.Sanyal AJ, Foucquier J, Younossi ZM, Harrison SA, Newsome PN, Chan WK, et al. Enhanced diagnosis of advanced fibrosis and cirrhosis in individuals with NAFLD using FibroScan-based Agile scores. J Hepatol. 2023;78:247–259. [DOI] [PMC free article] [PubMed] [Google Scholar]
- 10.Boursier J, Zarski JP, de Ledinghen V, Rousselet MC, Sturm N, Lebail B, et al. Determination of reliability criteria for liver stiffness evaluation by transient elastography. Hepatology. 2013;57:1182–91. [DOI] [PubMed] [Google Scholar]
- 11.Kleiner DE, Brunt EM, van Natta M, Behling C, Contos MJ, Cummings OW, et al. Design and validation of a histological scoring system for nonalcoholic fatty liver disease. Hepatology. 2005;41:1313–21. [DOI] [PubMed] [Google Scholar]
- 12.Esarey J, Pierce A. Assessing fit quality and testing for misspecification in binary-dependent variable models. Polit Anal. 2012;20:480–500. [Google Scholar]
- 13.DeLong ER, DeLong DM, Clarke-Pearson DL. Comparing the areas under two or more correlated receiver operating characteristic curves: a nonparametric approach. Biometrics. 1988;44:837–45. [PubMed] [Google Scholar]
- 14.McPherson S, Hardy T, Dufour JF, Petta S, Romero-Gomez M, Allison M, et al. Age as a confounding factor for the accurate non-invasive diagnosis of advanced NAFLD fibrosis. Am J Gastroenterol. 2017;112:740–51. [DOI] [PMC free article] [PubMed] [Google Scholar]
- 15.Eddowes PJ, Sasso M, Allison M, Tsochatzis E, Anstee QM, Sheridan D, et al. Accuracy of FibroScan controlled attenuation parameter and liver stiffness measurement in assessing steatosis and fibrosis in patients with nonalcoholic fatty liver disease. Gastroenterology. 2019;156:1717–30. [DOI] [PubMed] [Google Scholar]
- 16.Sanyal AJ, van Natta ML, Clark J, Neuschwander-Tetri BA, Diehl A, Dasarathy S, et al. Prospective study of outcomes in adults with nonalcoholic fatty liver disease. N Engl J Med. 2021;385:1559–69. [DOI] [PMC free article] [PubMed] [Google Scholar]
- 17.Noureddin M, Mackenzie A, Zhao E, Howell SC, Tunkelrott M, Duncan I, et al. Population-based return on investment of deploying transient elastography. Am J Manag Care. 2021;27:376–81. [DOI] [PubMed] [Google Scholar]
- 18.Noureddin M, Jones C, Alkhouri N, Gomez EV, Dieterich DT, Rinella ME, et al. Screening for nonalcoholic fatty liver disease in persons with type 2 diabetes in the United States is cost-effective: a comprehensive cost-utility analysis. Gastroenterology. 2020;159:1985–7.e4. [DOI] [PubMed] [Google Scholar]
- 19.Noureddin M, Mackenzie A, Zhao E, Howell SC, Tunkelrott M, Duncan I. Population-based return on investment of deploying transient elastography. Am J Manag Care. 2021;27:376–81. [DOI] [PubMed] [Google Scholar]
- 20.Berzigotti A, Tsochatzis E, Boursier J, Castera L, Cazzagon N, Friedrich-Rust M, et al. EASL Clinical Practice Guidelines on non-invasive tests for evaluation of liver disease severity and prognosis—2021 update. J Hepatol. 2021;75:659–89. [DOI] [PubMed] [Google Scholar]
- 21.Younossi ZM, Noureddin M, Bernstein D, Kwo P, Russo M, Shiffman ML, et al. Role of noninvasive tests in clinical gastroenterology practices to identify patients with nonalcoholic steatohepatitis at high risk of adverse outcomes: expert panel recommendations. Am J Gastroenterol. 2021;116:254–62. [DOI] [PubMed] [Google Scholar]


