

Abstract
Aim
To evaluate the diagnostic performance of radiomics features of two-dimensional (2D) and three-dimensional (3D) ultrasound (US) in predicting extrathyroidal extension (ETE) status in papillary thyroid carcinoma (PTC).
Patients and Methods
2D and 3D thyroid ultrasound images of 72 PTC patients confirmed by pathology were retrospectively analyzed. The patients were assigned to ETE and non-ETE. The regions of interest (ROIs) were obtained manually. From these images, a larger number of radiomic features were automatically extracted. Lastly, the diagnostic abilities of the radiomics models and a radiologist were evaluated using receiver operating characteristic (ROC) analysis. We extracted 1693 texture features firstly.
Results
The area under the ROC curve (AUC) of the radiologist was 0.65. For 2D US, the mean AUC of the three classifiers separately were: 0.744 for logistic regression (LR), 0.694 for multilayer perceptron (MLP), 0.733 for support vector machines (SVM). For 3D US they were 0.876 for LR, 0.825 for MLP, 0.867 for SVM. The diagnostic efficiency of the radiomics was better than radiologist. The LR model had favorable discriminate performance with higher area under the curve.
Conclusion
Radiomics based on US image had the potential to preoperatively predict ETE. Radiomics based on 3D US images presented more advantages over radiomics based on 2D US images and radiologist.
Keywords: two-dimensional ultrasound, three-dimensional ultrasound, radiomics, papillary thyroid carcinoma, extrathyroidal extension
INTRODUCTION
The prevalence of thyroid carcinoma, the most common malignant endocrine tumor, has rapidly increased worldwide over the past few years. Papillary thyroid carcinoma (PTC) is the most common pathological type, constituting around 80% ~ 90% of thyroid cancer cases (1, 2). Patients with PTC have a good prognosis, and more than 90% survive for more than 10 years after treatment (3). Although most PTC patients have low malignancy and better prognosis, nearly 10% experience recurrence and metastasis, highlighting their strong invasiveness (4).
Extrathyroidal extension (ETE) is an important factor associated with disease recurrence and metastasis in patients with PTC and impacts staging and the choice of operation (5). Growing evidence suggests that PTC patients with extrathyroidal extension have a significantly inferior 15-year survival rate than those without ETE (6, 7). Total/subtotal thyroidectomy is often indicated for patients with ETE, while patients without ETE only need resection of the affected thyroid lobe and isthmus, which preserves the function of the thyroid and parathyroid glands to a certain extent and reduce the contralateral recurrent laryngeal nerve injury (8). Therefore, predicting ETE preoperatively is critical for clinicians to choose the optimal surgical approaches.
Although many methods are currently used for ETE diagnosis, including magnetic resonance imaging (MRI), computed tomography (CT), and ultrasonic imaging examination, pathological biopsy remains the gold standards. Though fine needle aspiration (FNA) is widely acknowledged as the most accurate method to diagnose thyroid nodules before the operation, it provides less information on ETE (9, 10). MRI has the advantages of unlimited penetration depth and high spatial resolution, but it has limitations, including the presence of respiratory motion artifacts, high costs, is time-consuming, and is not suitable for patients with claustrophobia. CT enables a good evaluation of the tumor extension to surrounding tissue. Research by Seo et al. (11) showed that contrast-enhanced CT exhibited good accuracy (83.2–98.8%) and specificity (89.8–99.4%) in detecting whether the tumor had invaded neighboring structures. However, its sensitivity is reportedly low, ranging from 28.6% to 78.2%. It should also be borne in mind that a CT examination requires ionizing radiation. US is the most common imaging modality for the clinical examination of thyroid nodules since it is cheap, convenient, repeatable and radiation-less. Moreover, ultrasound examination can comprehensively evaluate the interface between the thyroid tumor and the surrounding capsule (12). Shudong et al. indicated that the accuracy of MRI in predicting the minimum ETE was lower than 2D US (73.4% vs. 79.7%) (13). In a study of 181 patients with PTC, Kwak et al. found that the sensitivity of ultrasound examination was 65.2%, and the specificity was 81.8% when more than 25% of thyroid nodules were in contact with the adjacent capsule (14).
Indeed, the diagnostic process is based on the subjective interpretation of radiological images. Due to the limitations of human visions, important information cannot be recognized. Over the past decades, quantitative imaging has emerged following the establishment of large databases and computer science, medical imaging and innovations in its post-processing methods (15). Radiomics is a new field based on machine learning in medical research, especially in oncology (16), such as cervical cancer, breast cancer, prostate cancer, lung cancer, rectum cancer, and musculoskeletal tumors (16-21). A radiomics workflow comprises several components, image acquisition and reconstruction, tumour segmentation, feature delineation, and model development (22). By extracting and analyzing many quantitative features from medical images, radiomics can improve disease diagnosis and prediction ability (23, 24). In recent years, radiomics analysis has been applied to differentiate benign and malignant thyroid nodules and predict lymph node metastasis before surgery (25, 26).Wang X et al. considered that 2D US radiomics could effectively evaluate whether ETE occurs in papillary thyroid carcinoma, yielding an AUC value of 0.824 (8). With the development of ultrasound technology, the emergence of 3D US provides more possibilities in choosing the imaging method for thyroid disease. Kim et al. reported that compared to 2D thyroid ultrasound, 3D had higher sensitivity for predicting ETE (66.7% vs. 46.4 %, P=0.03) (27). But at present, no reports on the application of 2D and 3D ultrasound radiomics to compare the diagnostic performance to evaluate extrathyroidal extension in PTC have been reported.
Therefore, this study aimed to compare the diagnostic performance of evaluation between 2D and 3D ultrasound radiomics in predicting ETE in PTC patients to help clinicians select the optimal treatment strategy.
MATERIALS AND METHODS
Patient data
This retrospective study has been approved by the Institutional Review Board of our institution. According to national laws and institutional requirements, the patients were informed of the study details and provided informed consent before the examination. 72 patients who underwent thyroid ultrasonography in our institution between November 2020 and May 2021 were included in this study. All patients underwent subtotal or total thyroidectomy within one week after the US examination. PTC was confirmed by pathology postoperatively. Exclusion criteria were as follows: (1) Thyroid nodule was too large to be completely displayed on ultrasonography (2) The maximum diameter of the largest section of the lesion in the 3D image or the largest diameter in the 2D image was < 5 mm (to avoid inaccurate segmentation) (3) Poor quality image (4) The patients had incomplete clinical information. The study workflow is displayed in Figure 1.
Figure 1.

The patients workflow in this study. PTC papillary thyroid carcinoma.
Ultrasound examination
The ultrasound device used in this study was the Phillips IU elite ultrasound system with a 12.5 MHz linear array transducer for 2D US examination and a 13.5 MHz dedicated volume transducer for 3D US examination. All participants underwent 2D and 3D US examinations performed by an experienced radiologist. The patients were placed in a supine position with a pillow underneath the neck to expose the neck fully. The radiologist assessed the US images and established a final diagnosis. The 3D images were obtained after collecting 2D US images. All images were acquired at identical instrument settings for depths, focus positions, and gain settings. During the inspection, the patient’s age, sex, the largest diameter of the lesion, nodule location (upper pole, middle pole, or lower pole), nodule position (left lobe, right lobe, or isthmus), nodule border (clear or fuzzy), internal echo pattern (nonuniform or uniform), tumor vascularization (rare or abundant) were recorded (Fig. 2). Based on the AJCC guidelines, ETE was diagnosed when one of the following criteria was present: (1)>25% of the primary tumor perimeter is in contact with the thyroid capsule; (2) the glands between the lesions and thyroid are not visible; (3) the primary tumor invades beyond the thyroid capsule and invades the surrounding structures, such as larynx, oesophagus, recurrent laryngeal nerve, trachea, vasculature, the strap muscles or esophagus.
Figure 2.

Radiomics workflow in this study, including tumor delineation from two-dimensional thyroid ultrasound, radiomics feature extraction from delineated tumor regions, feature selection for building an optimal signature, radiomics model construction, and statistical analysis for radiomics model assessment.
Histopathological analysis
Two experienced pathologists with 9 and 12 years of experience, respectively, evaluated the histopathology of tumor specimens. PTC specimens of paraffin-embedded slices were conducted by hematoxylin and eosin (H&E) staining. According to the guidelines published by the American Thyroid Association (ATA), the pathologists evaluated the extrathyroidal extension features and patients were divided into two groups: ETE and non-ETE groups.
Drawing the region of interest (ROI)
The ROIs of 2D and 3D images were drawn manually by two experienced radiologists (8 and 10 years of relevant experience, respectively) using ITK-SNAP 3.8 software (Cognitica, Philadelphia, PA, USA) (https://www.itksnap.org). The 3D images were drawn layer by layer to represent the volume of the whole tumor. All tumor regions were defined by the overlapping region of two ROIs independently drawn by two radiologists. In case of disagreement, additional reading sessions were conducted until a consensus was reached.
Radiomics feature extraction
Texture analysis was performed on the acquired ultrasound images of 72 patients. Radiomic features were extracted by the PyRadiomics package, which was imported from the Python programming language. Subsequently, a total of 1693 features were extracted for each patient, including First Order Statistics (19 features), Shape-based (3D) (16 features), Shape-based (2D) (10 features), Gray Level Cooccurrence Matrix (24 features), Gray Level Run Length Matrix (16 features), Gray Level Size Zone Matrix (16 features), Neighboring Gray Tone Difference Matrix (5 features), and Gray Level Features Matrix (14 features).
Feature selection and model construction
First, Levene tests were performed to verify variance homogeneity. For two groups with continuous variables, the Student’s t-test was used when each data set satisfied the homogeneity of variance; otherwise, the Mann-Whitney U test was performed. Then, the LASSO regression analysis was adopted to remove inappropriate features and further select the most significant radiomic features. Given the small sample size in this study, the performance of each classifier was evaluated using 3*3 nested cross-validation, without retaining a single set as the independent test sets. During nested cross-validation, the inner cross-validation loop was used to tune the parameters, and the outer loop was used to optimize the parameters (28). The external loop contains a 3-fold CV, and the internal loop contains a 3-fold CV using the training samples of the outer loop. All the obtained texture feature datasets were divided into three non-overlapping subsets, one of which was used as the testing fold and the other two subsets were used as the training fold to train the model that adopted another 3-fold CV to adjust parameters (internal loop). The performance of the constructed model was evaluated by using the testing set. For the external loop, this process was repeated three times, and each time a different subset was selected to train the model, another different testing set was selected to test the obtained model. As shown in Figure 3, three different models were generated to develop a prediction model (LR, MLP, SVM). Finally, the AUC value was used to assess their performance. For each 3-fold CV, the AUC could assess the performances of different radiomics methods according to all texture feature datasets and be an important performance indicator to find the optimal hyperparameter of each classifier in the internal loop. The schematic presentation of the steps for 2D US radiomics analysis is shown in Figure 2.
Figure 3.
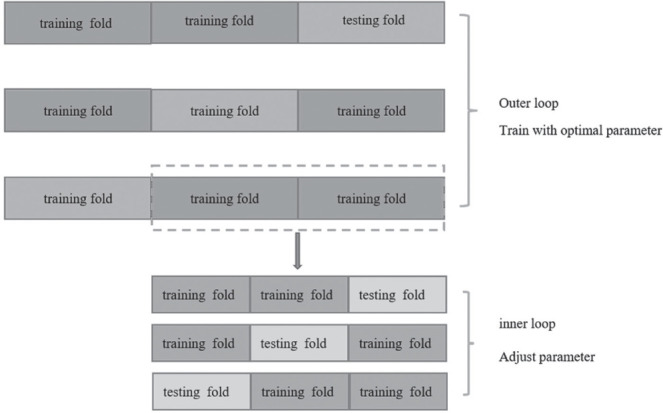
Scheme of 3*3 nested cross-validation method used to evaluate the performance of each classifier. The inner loop was used to adjust parameters, and the outer loop was used to train with optimal parameters.
Statistical analysis
We used the Python programming language (version 3.8, Python Software Foundation) (https://www.python.org/) to extract and select the radiomic features and build the prediction models. The software packages “Scikitlearn” (https://scikit-learn.org/) and “Matplotlib” (https://matplotlib.org/) were used in this research. In this study, tests of normality were conducted using the Shapiro-Wilk test. Measurement data that satisfied a normal distribution were expressed using mean ± standard deviation (SD). Other values were reported as the median and interquartile range (IQR). The independent Sample t-test was adopted for normally distributed measurement data, otherwise,the Mann-Whitney U test was used for non-normally distributed measurement data. Count data were expressed as frequency (percentage), and compared by the Chi-square test or Fisher exact test. A P-value < 0.05 was statistically significant.
RESULTS
Patient characteristics
Seventy-two PTC patients with a mean age of 41.50±11.27 (range, 20-71years) were enrolled in this research and classified into the ETE (n=38, 42.87 ± 9.26 (23-62 years)) and non-ETE (n=34, 39.97±13.13, (20-71 years)) groups according to the pathological results. The basic clinical characteristics of the included patients are represented in Table 1. No significant difference was found between the ETE and non-ETE groups(P>0.05).
Table 1.
Basic clinical data for our research group
| Characteristic | Non-ETE group (n=34) | ETE group (n=38) | P |
|---|---|---|---|
| Age(years) | 39.97 ± 13.13 | 42.87 ± 9.26 | 0.279 |
| Largest diameter(mm) | 10.85 ± 5.6 | 10.10 ± 3.12 | 0.142 |
| Sex | |||
| Female | 20(58.82%) | 28(73.68%) | 0.182 |
| Male | 14(41.17%) | 10(26.32%) | |
| Tumor position | |||
| Upper pole | 5(14.70%) | 8(21.05%) | 0.705 |
| Middle pole | 20(58.82%) | 19(50.00%) | |
| Inferior pole | 9(26.47%) | 11(28.95%) | |
| Tumor location | |||
| Left lobe | 14(41.18%) | 15(39.47%) | 0.882 |
| Right lobe | 19(55.88%) | 21(55.26%) | |
| Isthmus | 1(2.94%) | 2(5.26%) | |
| Tumor border | |||
| Clear | 14(41.18%) | 16(42.16%) | 0.936 |
| Fuzzy | 20(58.82%) | 22(57.89%) | |
| Internal echo pattern | |||
| Uniform | 13(38.24%) | 15(39.47%) | 0.914 |
| nonuniform | 21(61.76%) | 23(60.53%) | |
| Tumor vascularization | |||
| rare | 17(50%) | 12(31.58) | 0.921 |
| abundant | 17(50%) | 26(68.42) |
ETE, extrathyroidal extension; Non-ETE,without extrathyroidal extension.
Radiomic feature extraction/selection
Based on the 2D or 3D thyroid ultrasound images, 8 categories and 1693 radiomic features were extracted. After the t-test, the results indicated that 217 radiomic features closely related to ETE were acquired from 2D images (p<0.05) and 125 radiomic features were obtained from 3D US images. In this study, LASSO regression with L1 regularization was further used to select the optimal radiomics features. The complexity depends on the lambda (λ). According to 10-old cross-validation, the results indicated that when extracting 2D image features, the models had the lowest mean squared error (MSE) when λ was 0.038. When the λ was 0.017, the MSE of the models used to extract 3D image features was the lowest. After performing the LASSO regression, 11 and 16 best radiomic features were screened for 2D and 3D US. It is widely acknowledged that LASSO is a machine learning regression analysis technique that can reduce model over-fitting and improved prediction performance. It is also regarded as a promising method for selecting significant features through regularization selection (29).
The 11 best radiomic features in 2D US image were gradient_glszm_zone percentage, logarithm_glcm_Idn, logarithm_glrlm_long run emphasis, logarithm_glrlm_long run high gray level emphasis, squareroot_glcm_cluster prominence, squareroot_gldm_large dependence high gray level emphasis, squareroot_glszm_small area emphasis, wavelet-LHH_glszm_gray level non uniformity normalized, wavelet-LHH_glszm_high gray level zone emphasis, wavelet-LHH_glszm_low gray level zone emphasis, wavelet-LLL_glszm_size zone non uniformity normalized.
The 16 best radiomic features in 3D US image were original_glszm_size zone non uniformity normalized, exponential_glcm_Idmn, lbp-3D-m2_firstorder_maximum,lbp-3D-k_glcm_Imc1, logarithm_first order_Kurtosis, logarithm_first order_Skewness,square_first order_minimum, squareroot_glrlm_long run high gray level emphasis, wavelet-LLH_first order_Kurtosis,wavelet-LHL_glcm_correlation, wavelet-LHH_first order_maximum, wavelet-HLL_first order_median, wavelet-HLH_glszm_small area low gray level emphasis, wavelet-HHL_glcm_sum entropy, wavelet-HHH_first order_median and wavelet-HHH_glszm_small area high gray level emphasis (Table 2, 3).
Table 2.
The 11 radiomic features from 2D images
| Feature variable | Coefficient |
|---|---|
| gradient_glszm_ZonePercentage | -0.061170906 |
| logarithm_glcm_Idn | -0.017170469 |
| logarithm_glrlm_LongRunEmphasis | -0.068052136 |
| logarithm_glrlm_LongRunHighGrayLevelEmphasis | -0.055757102 |
| squareroot_glcm_ClusterProminence | -0.0182738 |
| squareroot_gldm_LargeDependenceHighGrayLevelEmphasis | -0.018482692 |
| squareroot_glszm_SmallAreaEmphasis | 0.026298401 |
| wavelet-LHH_glszm_GrayLevelNonUniformityNormalized | -0.08461716 |
| wavelet-LHH_glszm_HighGrayLevelZoneEmphasis | 0.034212287 |
| wavelet-LHH_glszm_LowGrayLevelZoneEmphasis | -1.66686E-15 |
| wavelet-LLL_glszm_SizeZoneNonUniformityNormalized | -0.045541489 |
2D, two-dimensional ultrasound.
Table 3.
The 16 radiomic features from 3D images
| Feature variable | Coefficient |
|---|---|
| original_glszm_SizeZoneNonUniformityNormalized | 0.050189505 |
| exponential_glcm_Idmn | 0.00956291 |
| lbp-3D-m2_firstorder_Maximum | -0.02454261 |
| lbp-3D-k_glcm_Imc1 | 0.009770999 |
| logarithm_firstorder_Kurtosis | -0.213473329 |
| logarithm_firstorder_Skewness | 0.011900934 |
| square_firstorder_Minimum | -0.076861664 |
| squareroot_glrlm_LongRunHighGrayLevelEmphasis | 0.060849978 |
| wavelet-LLH_firstorder_Kurtosis | -0.019104844 |
| wavelet-LHL_glcm_Correlation | -0.009440222 |
| wavelet-LHH_firstorder_Maximum | 0.195095696 |
| wavelet-HLL_firstorder_Median | 0.07726559 |
| wavelet-HLH_glszm_SmallAreaLowGrayLevelEmphasis | 0.017818287 |
| wavelet-HHL_glcm_SumEntropy | -0.119020429 |
| wavelet-HHH_firstorder_Median | 0.072067993 |
| wavelet-HHH_glszm_SmallAreaHighGrayLevelEmphasis | -0.097617483 |
3D, three-dimensional ultrasound.
Diagnostic performance of radiomics and radiologists
In this study, the predictive performance of the radiologist was satisfactory, with an AUC value of 0.65. In contrast, the average AUC values of the three models LR, MLP, and SVM for 2D US were 0.744, 0.694 and 0.733, respectively. Corresponding values for 3D US were 0.876, 0.825 and 0.867. These findings suggested that the radiomics models yielded better performance than the radiologist. The AUC values of each loop in the three models are shown in Table 4. Among them, LR yielded the best diagnostic efficiency. However, irrespective of the prediction model adopted, the average AUC value of 3D US was higher than 2D US and traditional ultrasound examination, which indicated that the diagnostic performance of radiomics based on 3D thyroid images was better. Accordingly, radiomics based on 3D thyroid images has huge prospects for predicting ETE, especially when using the LR model. Figure 4 shows the average ROC curves of different models.
Table 4.
The AUC values of each loop in the three models
| LR | SVM | MLP | LR | SVM | MLP | ||
|---|---|---|---|---|---|---|---|
| 2D | 3D | ||||||
| Test set | Loop 1 | 0.695 | 0.760 | 0.695 | 0.972 | 0.958 | 0.923 |
| Loop 2 | 0.776 | 0.762 | 0.615 | 0.727 | 0.755 | 0.706 | |
| Loop 3 | 0.762 | 0.678 | 0.773 | 0.930 | 0.889 | 0.846 | |
| Training set | Loop 1 | 0.867 | 0.862 | 1.000 | 0.969 | 0.990 | 1.000 |
| Loop 2 | 0.854 | 0.865 | 0.820 | 0.991 | 0.983 | 1.000 | |
| Loop 3 | 0.838 | 0.910 | 0.804 | 1.000 | 0.963 | 0.966 | |
LR, logistic regression; SVM, support vector machines; MLP, multilayer perceptron; 2D, two-dimensional ultrasound; 3D, three-dimensional ultrasound; AUC, area under the receiver operating characteristic curve.
Figure 4.

The average ROC curves and AUC values of three classifiers and the radiologist. (A) The average ROC curves of 2D ultrasound. (B) The average ROC curves of 3D ultrasound. LR, logistic regression; SVM, support vector machines; MLP, multilayer perceptron; ROC, receiver operating characteristic; AUC, area under the receiver operating characteristic curve; 2D, two-dimensional ultrasound; 3D, three-dimensional ultrasound.
DISCUSSION
The PTC is associated with a higher incidence, but the mortality rate is considered lower. A study showed that the popularization of routine physical examinations and the increased resolution of high-frequency ultrasound could increase the detection rate of PTC (30). Though PTC progresses slowly and has a good prognosis, its mortality is below 10%. However, almost 80% of PTC patients develop lymph node metastases (31). In some cases, aggressive phenotypes can be observed, such as capsule invasion (32). Patients with ETE had poorer outcomes and higher recurrence rates. Indeed, it is well-established that if ETE is not diagnosed before the operation, resurgery is often required, which increases the pain and economic burden of patients (33). Therefore, an accurate preoperatively diagnosis of ETE can help surgeons choose the optimal surgical treatment modality and reduce the risk of secondary operation.
Since Woolner et al. first described ETE in 1961 (34), many studies have been performed to evaluated the ability of different imaging methods to predict ETE. Importantly, multiplanar section MRI can visualize the stereoscopic thyroid anatomy. MRI has been suggested as a complementary means of assessing large tumors or extensive ETE, especially the invasion of adjacent structures (35). In a study involving 132 PTC patients, Ran et al. reported that the radiomics based on a multiparametric MRI prediction model achieved AUC values of 0.96 and 0.87 in the training and testing sets, respectively (36). Another study by Jun Lin et al. showed that in 60 patients with PTC diagnosed by preoperative MRI, the radiomics model could achieve AUC values of 0.845, 0.928 and 0.913 for T2WI, T2WI-FS and T2WI-combined after feature selection (37). It is widely thought that US is the most reliable method for screening thyroid nodules for clinical diagnosis. Gweon et al. reported that the accuracy of 2D US in predicting ETE was 60.8%, while the accuracy of 3D US was 66.2% [13]. Lee et al. reported that if more than 50% of the PTC perimeter was in contact with the neighboring thyroid envelope, the AUC values of ultrasound and CT examinations were 0.674 and 0.638, respectively (38). The accuracy was the highest when CT imaging and routine thyroid ultrasound examination were combined, yielding an AUC value of 0.744. However, imaging assessments are subjective, and the results may depend on the experience of radiologists. Compared with traditional imaging, radiomics converts medical images into mineable data through high-throughput extraction of quantitative features. It also allows the recognition of different features that humans cannot see and distinguish during conventional medical imaging analysis, thereby improving the accuracy of the diagnosis of ETE (39). These findings account for the fact that routine thyroid ultrasound examination yielded a lower diagnostic yield than radiomics for ETE in our study.
To our knowledge, 3D US radiomics has rarely been applied to research PTC patients with ETE. We also sought to compare the diagnostic performance of the radiomics features based on 2D and 3D US images and found a more favorable method to predict ETE before surgery. We found that the average AUC values of three models, LR, MLP and SVM, for 2D US were: 0.744, 0.694, and 0.733, respectively. For the 3D US, the corresponding values were 0.876, 0.825 and 0.867, respectively. The average AUC values of each model were significantly higher for 3D US than 2D US for predicting ETE. Indeed, it is widely acknowledged that 2D US can only obtain image information of a single section, while 3D US can offer a comprehensive assessment of the entire tissue. In addition, the traditional 2D US image acquisition is not fixed, which leads to the low repeatability of the extracted image texture feature parameters, which can be solved using 3D US technology. Indeed, better prediction efficiency is obtained with more valid data extracted from 3D images compared to 2D imaging. In this study, LR yielded optimal results, which showed that this model has huge prospects for predicting ETE.
In this research, a 3 × 3-fold nested cross-validation (nCV) scheme was used for reliable evaluation of the classification performance. It is well-established that nCV is an effective method to obtain an optimal prediction model by combining feature selection with machine learning parameters (40). A grid search was carried out in the internal part loop to acquire the optimal hyper-parameters for each training data set in the external loop. An outer loop was performed to evaluate the classification performance and obtain the performance measures within the validation fold (41). An increasing body of evidence suggests that nCV can avoid over-fitting and data dependency, accounting for its extensive use in the machine-learning analysis of neuro-imaging (42-44). This method can harness the available data and prevent circular analysis.
Nevertheless, the present research has certain limitations. First, the sample size was limited. However, it should be borne in mind that the nested cross-validation method can minimize the impact of small sample sizes and over-fitting. Moreover, only data from patients from a single center were analyzed, which limits the generalizability of our findings to all patients with PCT preoperatively. Multicenter studies are warranted to further validate the results. Finally, the ROI was obtained manually, which might be affected by the radiologist’s subjective bias. Further studies should focus on improving ROI delineation by automatic or semi-automatic ROI segmentation.
In recent years, radiomics has rapidly developed to convert medical images into quantitative information that can be analyzed (45). Radiomic features capture tissue and lesion features, such as heterogeneity and shape, and can be used for clinical problem-solving alone or in combination with demographic, histological, genomic or proteomic data (46). Based on our findings, a comprehensive predictive nomogram model was established to better guide clinical diagnosis. Wang X et al. developed a radiomic nomogram model with high accuracy to predict ETE in patients with PTC (8). In the future, more useful information could be extracted by radiomics by establishing multi-parametric models and using multiple imaging (US, CT, MRI) radiomic features, which could be useful in guiding clinical decision-making.
In conclusion, radiomics yielded better diagnostic performance than humans, and radiomics models based on 3D thyroid US images were superior to 2D thyroid US images. The 3D US radiomics approach has the potential to predict ETE before surgery, and can assist clinicians in choosing the optimal surgical approach.
Conflict of interest
The authors declare that they have no conflict of interest.
References
- 1.Bergdorf K, Ferguson DC, Mehrad M, Ely K, Stricker T, Weiss VL. Papillary thyroid carcinoma behavior: clues in the tumor microenvironment. Endocr Relat Cancer. 2019;26(6):601–614. doi: 10.1530/ERC-19-0074. [DOI] [PMC free article] [PubMed] [Google Scholar]
- 2.Lim H, Devesa SS, Sosa JA, Check D, Kitahara CM. Trends in Thyroid Cancer Incidence and Mortality in the United States, 1974-2013. JAMA. 2017;317(13):1338–1348. doi: 10.1001/jama.2017.2719. [DOI] [PMC free article] [PubMed] [Google Scholar]
- 3.Liu Y, Liu H, Qian CL, Lin MS, Li FH. Utility of quantitative contrast-enhanced ultrasound for the prediction of extracapsular extension in papillary thyroid carcinoma. Sci Rep. 2017;7(1):1472. doi: 10.1038/s41598-017-01650-2. [DOI] [PMC free article] [PubMed] [Google Scholar]
- 4.Nasirden A, Saito T, Fukumura Y, Hara K, Akaike K, Kurisaki-Arakawa A, Asahina M, Yamashita A, Tomomasa R, Hayashi T, Arakawa A, Yao T. In Japanese patients with papillary thyroid carcinoma, TERT promoter mutation is associated with poor prognosis, in contrast to BRAF (V600E) mutation. Virchows Arch. 2016;469(6):687–696. doi: 10.1007/s00428-016-2027-5. [DOI] [PubMed] [Google Scholar]
- 5.Kamaya A, Tahvildari AM, Patel BN, Willmann JK, Jeffrey RB, Desser TS. Sonographic Detection of Extracapsular Extension in Papillary Thyroid Cancer. J Ultrasound Med. 2015;34(12):2225–2230. doi: 10.7863/ultra.15.02006. [DOI] [PubMed] [Google Scholar]
- 6.Aydin H, Ferahman S, Abdullayev S, Sahbaz NA, Dural AC, Guzey D, Akarsu C, Karabulut M. Technological Advances Have Improved Surgical Outcome in Thyroid Surgery: Myth Or Reality? Acta Endocrinologica-Bucharest. 2021;17(1):1–6. doi: 10.4183/aeb.2021.1. [DOI] [PMC free article] [PubMed] [Google Scholar]
- 7.Sundram F, Robinson BG, Kung A, Lim-Abrahan MA, Bay NQ, Chuan LK, Chung JH, Huang SM, Hsu LC, Kamaruddin N, Cheah WK, Kim WB, Koong SS, Lin HD, Mangklabruks A, Paz-Pacheco E, Rauff A, Ladenson PW. Well-differentiated epithelial thyroid cancer management in the Asia Pacific region: a report and clinical practice guideline. Thyroid. 2006;16(5):461–469. doi: 10.1089/thy.2006.16.461. [DOI] [PubMed] [Google Scholar]
- 8.Wang X, Agyekum EA, Ren Y, Zhang J, Zhang Q, Sun H, Zhang G, Xu F, Bo X, Lv W, Hu S, Qian X. A Radiomic Nomogram for the Ultrasound-Based Evaluation of Extrathyroidal Extension in Papillary Thyroid Carcinoma. Front Oncol. 2021;11:625646. doi: 10.3389/fonc.2021.625646. [DOI] [PMC free article] [PubMed] [Google Scholar]
- 9.Haugen BR. 2015 American Thyroid Association Management Guidelines for Adult Patients with Thyroid Nodules and Differentiated Thyroid Cancer: What is new and what has changed? Cancer. 2017;123(3):372–381. doi: 10.1002/cncr.30360. [DOI] [PubMed] [Google Scholar]
- 10.Baloch ZW, LiVolsi VA, Asa SL, Rosai J, Merino MJ, Randolph G, Vielh P, DeMay RM, Sidawy MK, Frable WJ. Diagnostic terminology and morphologic criteria for cytologic diagnosis of thyroid lesions: a synopsis of the National Cancer Institute Thyroid Fine-Needle Aspiration State of the Science Conference. Diagn Cytopathol. 2008;36(6):425–437. doi: 10.1002/dc.20830. [DOI] [PubMed] [Google Scholar]
- 11.Seo YL, Yoon DY, Lim KJ, Cha JH, Yun EJ, Choi CS, Bae SH. Locally advanced thyroid cancer: can CT help in prediction of extrathyroidal invasion to adjacent structures? AJR Am J Roentgenol. 2010;195(3):W240–244. doi: 10.2214/AJR.09.3965. [DOI] [PubMed] [Google Scholar]
- 12.Chen B, Zhong L, Dong D, Zheng J, Fang M, Yu C, Dai Q, Zhang L, Tian J, Lu W, Jin Y. Computed Tomography Radiomic Nomogram for Preoperative Prediction of Extrathyroidal Extension in Papillary Thyroid Carcinoma. Front Oncol. 2019;9:829. doi: 10.3389/fonc.2019.00829. [DOI] [PMC free article] [PubMed] [Google Scholar]
- 13.Gweon HM, Son EJ, Youk JH, Kim JA, Park CS. Preoperative assessment of extrathyroidal extension of papillary thyroid carcinoma: comparison of 2-and 3-dimensional sonography. J Ultrasound Med. 2014;33(5):819–825. doi: 10.7863/ultra.33.5.819. [DOI] [PubMed] [Google Scholar]
- 14.Kwak JY, Kim EK, Youk JH, Kim MJ, Son EJ, Choi SH, Oh KK. Extrathyroid extension of well-differentiated papillary thyroid microcarcinoma on US. Thyroid. 2008;18(6):609–614. doi: 10.1089/thy.2007.0345. [DOI] [PubMed] [Google Scholar]
- 15.Lambin P, Rios-Velazquez E, Leijenaar R, Carvalho S, van Stiphout RG, Granton P, Zegers CM, Gillies R, Boellard R, Dekker A, Aerts HJ. Radiomics: extracting more information from medical images using advanced feature analysis. Eur J Cancer. 2012;48(4):441–446. doi: 10.1016/j.ejca.2011.11.036. [DOI] [PMC free article] [PubMed] [Google Scholar]
- 16.Park SH, Lim H, Bae BK, Hahm MH, Chong GO, Jeong SY, Kim JC. Robustness of magnetic resonance radiomic features to pixel size resampling and interpolation in patients with cervical cancer. Cancer Imaging. 2021;21(1):19. doi: 10.1186/s40644-021-00388-5. [DOI] [PMC free article] [PubMed] [Google Scholar]
- 17.Conti A, Duggento A, Indovina I, Guerrisi M, Toschi N. Radiomics in breast cancer classification and prediction. Semin Cancer Biol. 2021;72:238–250. doi: 10.1016/j.semcancer.2020.04.002. [DOI] [PubMed] [Google Scholar]
- 18.Woźnicki P, Westhoff N, Huber T, Riffel P, Froelich MF, Gresser E, von Hardenberg J, Mühlberg A, Michel MS, Schoenberg SO, Nörenberg D. Multiparametric MRI for Prostate Cancer Characterization: Combined Use of Radiomics Model with PI-RADS and Clinical Parameters. Cancers (Basel) 2020;12(7):1767. doi: 10.3390/cancers12071767. [DOI] [PMC free article] [PubMed] [Google Scholar]
- 19.Avanzo M, Stancanello J, Pirrone G, Sartor G. Radiomics and deep learning in lung cancer. Strahlenther Onkol. 2020;196(10):879–887. doi: 10.1007/s00066-020-01625-9. [DOI] [PubMed] [Google Scholar]
- 20.Huang YQ, Liang CH, He L, Tian J, Liang CS, Chen X, Ma ZL, Liu ZY. Development and Validation of a Radiomics Nomogram for Preoperative Prediction of Lymph Node Metastasis in Colorectal Cancer. J Clin Oncol. 2016;34(18):2157–2164. doi: 10.1200/JCO.2015.65.9128. [DOI] [PubMed] [Google Scholar]
- 21.Chianca V, Albano D, Messina C, Vincenzo G, Rizzo S, Del Grande F, Sconfienza LM. An update in musculoskeletal tumors: from quantitative imaging to radiomics. Radiol Med. 2021;126(8):1095–1105. doi: 10.1007/s11547-021-01368-2. [DOI] [PubMed] [Google Scholar]
- 22.Kumar V, Gu Y, Basu S, Berglund A, Eschrich SA, Schabath MB, Forster K, Aerts HJ, Dekker A, Fenstermacher D, Goldgof DB, Hall LO, Lambin P, Balagurunathan Y, Gatenby RA, Gillies RJ. Radiomics: the process and the challenges. Magn Reson Imaging. 2012;30(9):1234–1248. doi: 10.1016/j.mri.2012.06.010. [DOI] [PMC free article] [PubMed] [Google Scholar]
- 23.Gillies RJ, Kinahan PE, Hricak H. Radiomics: Images Are More than Pictures, They Are Data. Radiology. 2016;278(2):563–577. doi: 10.1148/radiol.2015151169. [DOI] [PMC free article] [PubMed] [Google Scholar]
- 24.Yip SS, Aerts HJ. Applications and limitations of radiomics. Phys Med Biol. 2016;61(13):R150–166. doi: 10.1088/0031-9155/61/13/R150. [DOI] [PMC free article] [PubMed] [Google Scholar]
- 25.Zhou H, Jin Y, Dai L, Zhang M, Qiu Y, Wang K, Tian J, Zheng J. Differential Diagnosis of Benign and Malignant Thyroid Nodules Using Deep Learning Radiomics of Thyroid Ultrasound Images. Eur J Radiol. 2020;127:108992. doi: 10.1016/j.ejrad.2020.108992. [DOI] [PubMed] [Google Scholar]
- 26.Li F, Pan D, He Y, Wu Y, Peng J, Li J, Wang Y, Yang H, Chen J. Using ultrasound features and radiomics analysis to predict lymph node metastasis in patients with thyroid cancer. BMC Surg. 2020;20(1):315. doi: 10.1186/s12893-020-00974-7. [DOI] [PMC free article] [PubMed] [Google Scholar]
- 27.Kim SC, Kim JH, Choi SH, Yun TJ, Wi JY, Kim SA, Sun HY, Ryoo I, Park SW, Sohn CH. Off-site evaluation of three-dimensional ultrasound for the diagnosis of thyroid nodules: comparison with two-dimensional ultrasound. Eur Radiol. 2016;26(10):3353–3360. doi: 10.1007/s00330-015-4193-2. [DOI] [PubMed] [Google Scholar]
- 28.Zhang H, Hu S, Wang X, He J, Liu W, Yu C, Sun Z, Ge Y, Duan S. Prediction of Cervical Lymph Node Metastasis Using MRI Radiomics Approach in Papillary Thyroid Carcinoma: A Feasibility Study. Technol Cancer Res Treat. 2020;19:1533033820969451. doi: 10.1177/1533033820969451. [DOI] [PMC free article] [PubMed] [Google Scholar]
- 29.Bien J, Taylor J, Tibshirani R. A lasso for hierarchical interactions. Ann Stat. 2013;41(3):1111–1141. doi: 10.1214/13-AOS1096. [DOI] [PMC free article] [PubMed] [Google Scholar]
- 30.Yu J, Deng Y, Liu T, Zhou J, Jia X, Xiao T, Zhou S, Li J, Guo Y, Wang Y, Zhou J, Chang C. Lymph node metastasis prediction of papillary thyroid carcinoma based on transfer learning radiomics. Nat Commun. 2020;11(1):4807. doi: 10.1038/s41467-020-18497-3. [DOI] [PMC free article] [PubMed] [Google Scholar]
- 31.Kaliszewski K, Diakowska D, Wojtczak B, Forkasiewicz Z, Pupka D, Nowak Ł, Rudnicki J. Which papillary thyroid microcarcinoma should be treated as “true cancer” and which as “precancer”? World J Surg Oncol. 2019;17(1):91. doi: 10.1186/s12957-019-1638-0. [DOI] [PMC free article] [PubMed] [Google Scholar]
- 32.Nam-Goong IS, Kim HY, Gong G, Lee HK, Hong SJ, Kim WB, Shong YK. Ultrasonography-guided fine-needle aspiration of thyroid incidentaloma: correlation with pathological findings. Clin Endocrinol (Oxf) 2004;60(1):21–28. doi: 10.1046/j.1365-2265.2003.01912.x. [DOI] [PubMed] [Google Scholar]
- 33.Chéreau N, Buffet C, Trésallet C, Tissier F, Golmard JL, Leenhardt L, Menegaux F. Does extracapsular extension impact the prognosis of papillary thyroid microcarcinoma? Ann Surg Oncol. 2014;21(5):1659–1664. doi: 10.1245/s10434-013-3447-y. [DOI] [PubMed] [Google Scholar]
- 34.Woolner LB, Beahrs OH, Black BM, Mcconahey WM, Keating FJ. Classification and prognosis of thyroid carcinoma. A study of 885 cases observed in a thirty year period. Am J Surg. 1961;102:354–387. doi: 10.1016/0002-9610(61)90527-x. [DOI] [PubMed] [Google Scholar]
- 35.Hu S, Zhang H, Zhong Y, Agyekum EA, Sun Z, Ge Y, Li J, Dou W, He J, Xiang H, Wang Y, Qian X, Wang X. Assessing Diagnostic Value of Combining Ultrasound and MRI in Extrathyroidal Extension of Papillary Thyroid Carcinoma. Cancer Manag Res. 2022;14:1285–1292. doi: 10.2147/CMAR.S350032. [DOI] [PMC free article] [PubMed] [Google Scholar]
- 36.Wei R, Wang H, Wang L, Hu W, Sun X, Dai Z, Zhu J, Li H, Ge Y, Song B. Radiomics based on multiparametric MRI for extrathyroidal extension feature prediction in papillary thyroid cancer. BMC Med Imaging. 2021;21(1):20. doi: 10.1186/s12880-021-00553-z. [DOI] [PMC free article] [PubMed] [Google Scholar]
- 37.He J, Zhang H, Wang X, Sun Z, Ge Y, Wang K, Yu C, Deng Z, Feng J, Xu X, Hu S. A pilot study of radiomics signature based on biparametric MRI for preoperative prediction of extrathyroidal extension in papillary thyroid carcinoma. J Xray Sci Technol. 2021;29(1):171–183. doi: 10.3233/XST-200760. [DOI] [PubMed] [Google Scholar]
- 38.Lee DY, Kwon TK, Sung MW, Kim KH, Hah JH. Prediction of extrathyroidal extension using ultrasonography and computed tomography. Int J Endocrinol. 2014;2014:351058. doi: 10.1155/2014/351058. [DOI] [PMC free article] [PubMed] [Google Scholar]
- 39.Liu Z, Wang S, Dong D, Wei J, Fang C, Zhou X, Sun K, Li L, Li B, Wang M, Tian J. The Applications of Radiomics in Precision Diagnosis and Treatment of Oncology: Opportunities and Challenges. Theranostics. 2019;9(5):1303–1322. doi: 10.7150/thno.30309. [DOI] [PMC free article] [PubMed] [Google Scholar]
- 40.Parvandeh S, Yeh HW, Paulus MP, McKinney BA. Consensus features nested cross-validation. Bioinformatics. 2020;36(10):3093–3098. doi: 10.1093/bioinformatics/btaa046. [DOI] [PMC free article] [PubMed] [Google Scholar]
- 41.Zhang Y, Cheng C, Liu Z, Wang L, Pan G, Sun G, Chang Y, Zuo C, Yang X. Radiomics analysis for the differentiation of autoimmune pancreatitis and pancreatic ductal adenocarcinoma in 18 F-FDG PET/CT. Med Phys. 2019;46(10):4520–4530. doi: 10.1002/mp.13733. [DOI] [PubMed] [Google Scholar]
- 42.Varoquaux G, Raamana PR, Engemann DA, Hoyos-Idrobo A, Schwartz Y, Thirion B. Assessing and tuning brain decoders: Cross-validation, caveats, and guidelines. Neuroimage. 2017;145(Pt B):166–179. doi: 10.1016/j.neuroimage.2016.10.038. [DOI] [PubMed] [Google Scholar]
- 43.Fang S, Fan Z, Sun Z, Li Y, Liu X, Liang Y, Liu Y, Zhou C, Zhu Q, Zhang H, Li T, Li S, Jiang T, Wang Y, Wang L. Radiomics Features Predict Telomerase Reverse Transcriptase Promoter Mutations in World Health Organization Grade II Gliomas via a Machine-Learning Approach. Front Oncol. 2020;10:606741. doi: 10.3389/fonc.2020.606741. [DOI] [PMC free article] [PubMed] [Google Scholar]
- 44.Cawley GC, Talbot N. On Over-fitting in Model Selection and Subsequent Selection Bias in Performance Evaluation. Journal of Machine Learning Research. 2010;11(1):2079–2107. [Google Scholar]
- 45.Veeraraghavan H, Friedman CF, DeLair DF, Ninčević J, Himoto Y, Bruni SG, Cappello G, Petkovska I, Nougaret S, Nikolovski I, Zehir A, Abu-Rustum NR, Aghajanian C, Zamarin D, Cadoo KA, Diaz LA, Jr, Leitao MM, Jr, Makker V, Soslow RA, Mueller JJ, Weigelt B, Lakhman Y. Machine learning-based prediction of microsatellite instability and high tumor mutation burden from contrast-enhanced computed tomography in endometrial cancers. Sci Rep. 2020;10(1):17769. doi: 10.1038/s41598-020-72475-9. [DOI] [PMC free article] [PubMed] [Google Scholar]
- 46.Mayerhoefer ME, Materka A, Langs G, Häggström I, Szczypiński P, Gibbs P, Cook G. Introduction to Radiomics. J Nucl Med. 2020;61(4):488–495. doi: 10.2967/jnumed.118.222893. [DOI] [PMC free article] [PubMed] [Google Scholar]