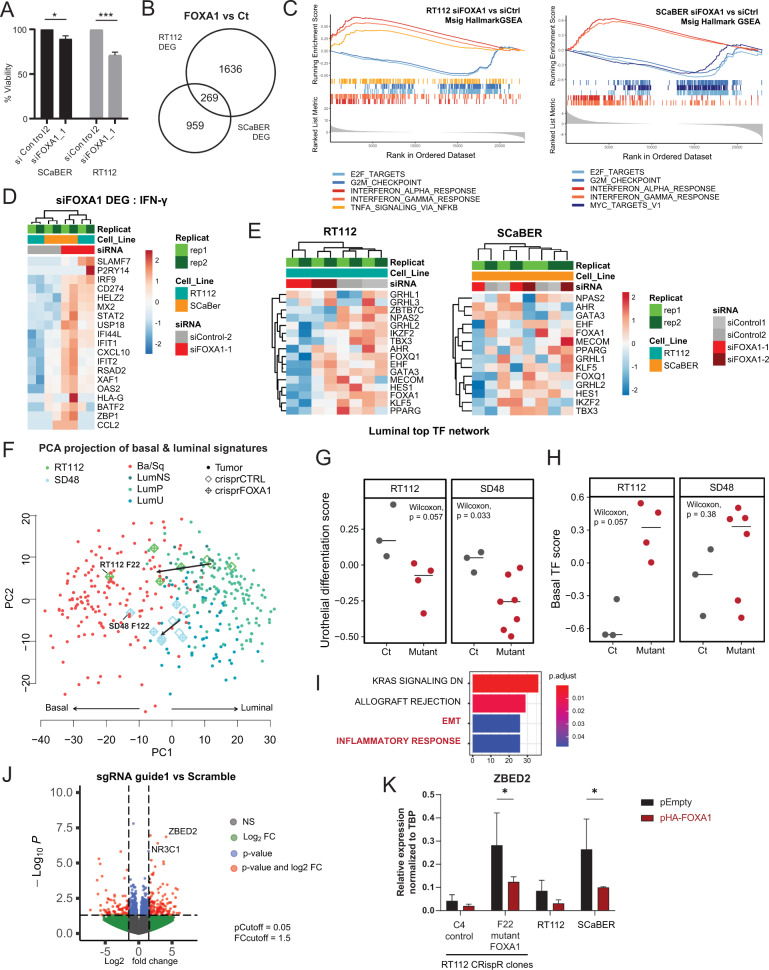
Fig. 6. FOXA1 regulates inflammation and cellular identity.
A Cell viability in RT112 and SCaBER under siRNA treatment against FOXA1. B Venn diagram comparing differentially expressed genes in RT112 and SCaBER FOXA1 KD. C GSEA plot of Msig Hallmark GSEA Analysis of genes differentially regulated in RT112 and SCaBER cell lines upon FOXA1 siRNA (2 independent siRNA, 2 replicates). D Heatmap of genes in Hallmark interferon gamma response genes that are differentially regulated in FOXA1 KD vs Ct (min Fold Change = 1,5). E Heatmap of Top Luminal TFs expression in RT112 and SCaBER cell lines upon FOXA1 KD. F PCA projection of TCGA Tumours and CRispR mutant clones on the Basal/Luminal signatures. G GSVA analysis of FOXA1 CRispR mutant clones on Urothelial differentiation signature from Eriksson et al. H GSVA analysis of FOXA1 CRispR mutant clones on Basal TFs identified in Fig. 4F.I Overrepresentation analysis of DEG in FOXA1 mutant vs Controls. J Volcano plot of Deseq2 RNA-seq analysis comparing pooled CRispR mutant FOXA1 clones in SD48 and RT112 versus controls. K Transient overexpression of HA-FOXA1 in mutant FOXA1 CRispR clones, wildtype RT112 and SCaBER. qPCR expression of ZBED2 after transfection of HA-FOXA1 relative to control plasmid, 4 days post transfection including 24 h of Puromycin selection (n = 3 for CrispR clones, n = 2 for WT RT112 and SCaBER). Significance was calculated using 2way ANOVA test (p-value < 0.05 = *).

