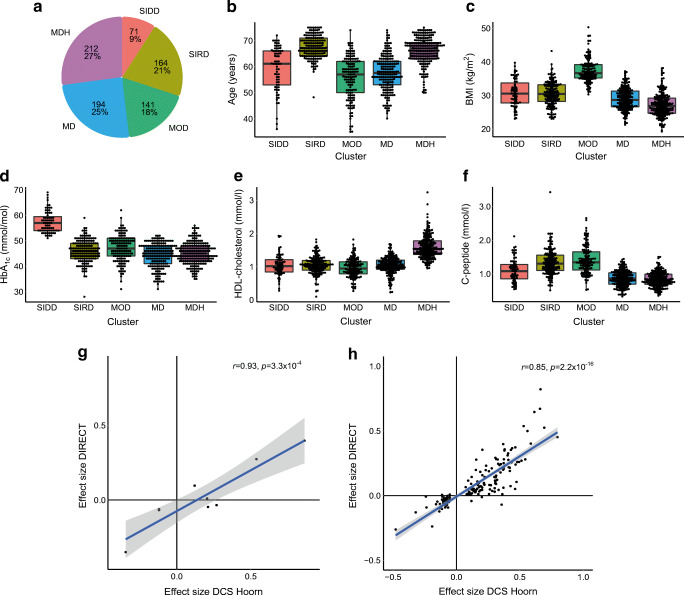
Fig. 3.
Validation in the IMI DIRECT study. (a) Pie diagram of five clusters in the IMI DIRECT study (n=782). (b–f) Characteristics of the five type 2 diabetes clusters in the IMI DIRECT study: age, BMI, HbA1c, HDL-cholesterol and C-peptide. Boxplot shows median, 25th percentile and 75th percentile. (g) Effect size plot of differentially expressed lncRNAs from the current study (DCS Hoorn) and the IMI DIRECT study. (h) Effect size plot of differentially expressed mRNAs from the current study (DCS Hoorn) and the IMI DIRECT study

