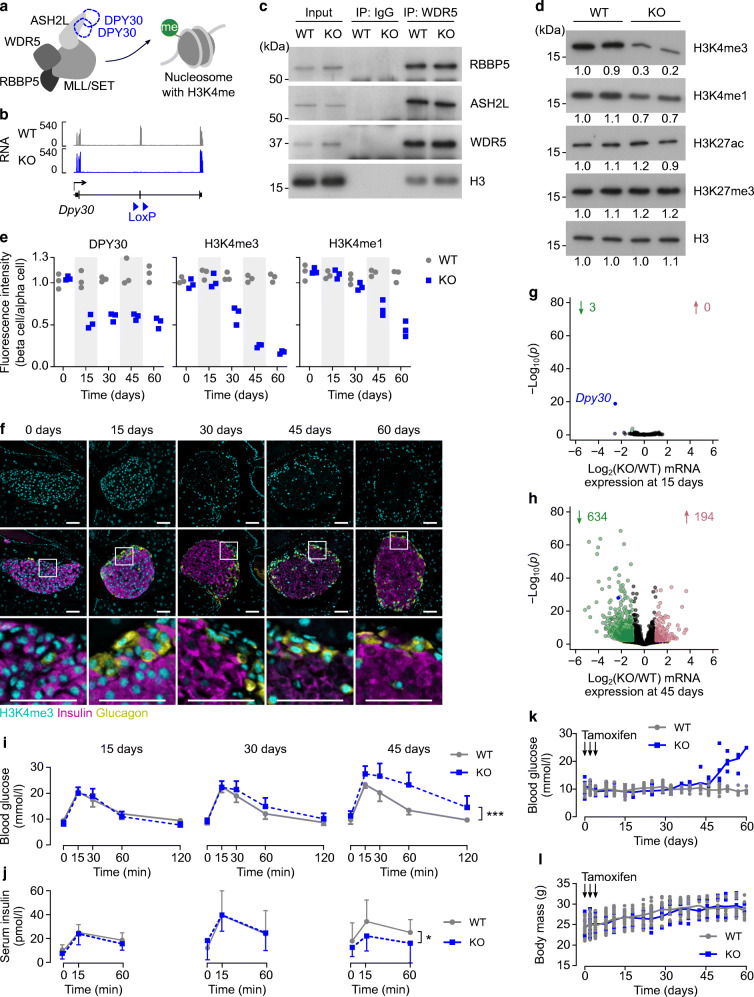
Fig. 1.
Reduction of H3K4 methylation in beta cells of adult mice leads to glucose intolerance and hyperglycaemia. (a) Schematic showing the core COMPASS subunits and a nucleosome methylated on H3K4. (b) Genome-aligned RNA-seq reads at the Dpy30 gene locus in Dpy30-WT and Dpy30-KO beta cells 15 days post tamoxifen. Note that the floxed exon 4 is efficiently deleted in the KO cells. (c) Immunoblots showing the COMPASS subunits RBBP5, ASH2L and WDR5 and the nucleosome protein histone H3, co-immunoprecipitated with WDR5 or an IgG control from Dpy30-WT and Dpy30-KO islet cell nuclei 45 days post tamoxifen administration. Representative immunoblots of three independent co-immunoprecipitations are shown. IP, immunoprecipitation. (d) Immunoblots showing H3K4me3, H3K4me1, histone H3 lysine 27 acetylation (H3K27ac), histone H3 lysine 27 trimethylation (H3K27me3) and total histone H3 in islets from Dpy30-WT and Dpy30-KO mice 45 days post tamoxifen administration. Numbers beneath each band indicate the band intensity normalised to the left-most sample. (e) Mean immunofluorescent intensity of DPY30, H3K4me3 and H3K4me1 in Dpy30-WT and Dpy30-KO beta cell nuclei at the indicated days after tamoxifen administration. Data are normalised to the fluorescence intensity of alpha cell nuclei (n=3). (f) Example immunohistochemical images of Dpy30-KO islets used for measurements in (e) showing H3K4me3 (cyan), insulin (magenta) and glucagon (yellow). Scale bars: 100 μm. (g, h) Scatterplots showing log2(fold change) and –log10(p) of gene expression in Dpy30-KO vs Dpy30-WT beta cells 15 days (g) and 45 days (h) post tamoxifen administration. Genes showing a twofold or greater increase or decrease in expression at p≤0.01 (calculated using Wald tests with Benjamini–Hochberg correction) are coloured red and green, respectively, and enumerated above. The full-length transcript of Dpy30 is blue. (i, j) Blood glucose (i) and serum insulin (j) levels during an IPGTT in Dpy30-WT and Dpy30-KO mice 15, 30 and 45 days after tamoxifen administration. Data are means ± SD (n=8–15). P values were calculated from AUCs using multiple two-tailed t tests with Welch’s and Benjamini–Hochberg corrections. (k, l) Unfasted blood glucose levels (k) and body mass (l) of Dpy30-WT and Dpy30-KO mice up to 60 days after tamoxifen administration. Data are individual measurements with means (n=8; however, tracking was stopped after a blood glucose reading ≥20 mmol/l). *p<0.05, ***p<0.001

