

Abstract
Purpose
The purpose of this study was to investigate the applicability of the adsorption process of a persistent organophosphorus pesticide (malathion) from aqueous solutions by using titanium dioxide- polypropylene nanocomposite (Nano-PP/TiO2).
Methods
The structure of Nano-PP/TiO2 was specified by field emission scanning electron microscopes (FE-SEM), fourier-transform infrared spectroscopy (FTIR), brunauer-emmett-teller (BET), and transmission electron microscope (TEM) technologies. Response surface methodology (RSM) was applied to optimize the adsorption of malathion onto Nano-PP/TiO2 and investigates the effects of various experimental parameters including contact time (5-60 min), adsorbent dose (0.5-4 g/l) and initial malathion concentration (5-20000 mg/l). Extraction and analysis of malathion were performed by dispersive liquid-liquid microextraction (DLLME) coupled with a gas chromatography, coupled with flame ionization detector (GC/FID).
Results
The isotherms obtained for Nano-PP/TiO2 revealed that it was a mesoporous material with a total pore volume of 2.06 cm3/g, average pore diameters of 2.48 nm and a surface area of 51.52 m2/g. The obtained results showed that the Langmuir type 2 was the best-fitted model for delegating the equilibrium data of isotherm studies with adsorption capacity of 7.43 mg/g, and pseudo-second-order type 1 for kinetic model. The optimized conditions to achieve the maximum removal (96%) were at a malathion concentration of 7.13 mg/L, contact time of 52 min and adsorbent dose of 0.5 g/L.
Conclusion
Due to its efficient and appropriate function in adsorbing malathion from aqueous solutions, it was revealed that Nano-PP/TiO2 can be used as an effective adsorbent as well as in further studies.
Keywords: Malathion, Nano-composite, Water, Wastewater, Adsorption, Polypropylene, Titanium dioxide
Highlights
• Novel application of polypropylene and titanium dioxide nanocomposite, Nano-PP/TiO2.
• Removal of organophosphorus malathion using Nano-PP/TiO2.
• Optimizing the process conditions for adsorption of malathion from aqueous based on the response surface model
•Identifying monolayer adsorption of malathion onto Nano-PP/Tio2 surfaces
Introduction
Malathion is an organic phosphorous compound belonging to the family of organophosphates which is used widely in agricultural activities and malaria eradication programs [1, 2]. Malathion is soluble in water; so, it is hazardous for aquatic organisms, amphibians, and vertebrates [3-5]. In addition, there are many pieces of evidence for adverse health effects of malathion on humans, including oxidative DNA damage [6] and CNS toxicity [7]. Also, malathion toxic effects on the liver, kidney, lung, and blood were reported [7]. Malathion was classified as a probable carcinogen to humans by the international agency for research on cancer. The results of in vitro and in vivo studies showed that mainly, there are genetic and chromosomal damages caused by malathion. Besides, epidemiological studies evidenced significant positive associations for different cancers, including thyroid and breast, in humans [8, 9].
Water pollution related to malathion is reported in numerous studies. Karyab et al. reported malathion concentration in water resources including wells, springs, and river water in Iran [10]. In other studies, malathion was detected as the most frequently observed pesticide in water resources and drinking water [11-13]. In addition, detection of malathion is reported from wastewater and agricultural effluents [14, 15].
Traditional methods of pesticides removal are characterized by high costs, more energy usage, and the generation of toxic by-products [16]. So, the introduction of new procedures that are lower cost, fast, reliable, and safe for the environment is necessary. Hence in recent decades, the adsorption processes, especially nano-sorbents, have acquired great technological relevance due to their implementation for the removal of malathion from aqueous solutions. In many studies, the removal of malathion has been investigated by different nanocomposites including multi-walled carbon nanotubes [17], Sodium Alginate/Biosilicate/Magnetite Nanocomposite [18], Copper chitosan nanocomposite [19], NF membranes [20], magnetic graphene oxide nanocomposite [21], and R2S3-Bi2O3 nanocomposite [22].
Hence, this study was conducted for removing malathion from aqueous solutions, including water resources and wastewater, using a new composite consists of nano titanium dioxide and polypropylene fibers (Nano-PP/TiO2). Polypropylene (PP) is a semi-crystalline polymer of the thermoplastic polyolefin polymer family. According to the good processing capability and chemical properties of PP, it is used as one of the most important polymers in technical applications in water treatment [23, 24]. Also, titanium dioxide is an inexpensive photocatalyst with high reactivity that kills the Bactria and improves the performance of PP properties. So recently, titanium dioxide (TiO2) in a mixture with PP has attracted the attention of many scholars. However, this depends on the mixing patterns, particle size, and carbon content of the TiO2 nano-powders [25].
Karyab et al. showed polypropylene and titanium dioxide nanocomposite can be used effectively to remove total organic carbon (TOC) from water. Also, in another study, they examined and reported its efficiency in removing lightweight Petroleum Hydrocarbons from contaminated water resources [26].
As mentioned, the potential of Nano-PP/TiO2 had been proved in the adsorption of total organic carbon (TOC) from water resources. However, we could not find any evidence related to the removal of malathion by using Nano-PP/TiO2. Thus, the purpose of this study was the evaluation of the adsorption potential of malathion organophosphate pesticides by Nano-PP/TiO2, as an inexpensive and affordable adsorbent.
Material and methods
The study was run in a reference laboratory of the school of health sciences at Qazvin University of Medical Sciences, Iran, on a bench scale. All materials including solvents and standards were purchased from Sigma-Aldrich with a certain percentage of purity. The PP fibers were gathered from Razi Institute, Tehran, Iran. The diameter, length, and density of PP fibers were 330 nm, 0.01 m, and 0.91 g/cm3 respectively. Methanol and malathion were mixed to prepare a 1000 mg/L stock solution. Nano-TiO2 which had more than 99% of purity, 0.4 mg/L specific density, 20 nm diameter, and 10 to 45 m2/g surface area, 80% of which contained Anatase volume, and 20% by Rutile volume, was purchased from NANOSANY, Iran.
The analysis of nano titanium particle weight content in the nanocomposite and distribution of them were performed with a Mira 3-XMU device equipped with an EDS micro-analyzer (TESCAN Corporation) image analysis. The examination of the morphology of the fractured surfaces was done by the use of field emission scanning electron microscopes (FE-SEM). Identifying the fiber-forming substances was done via EQUINOX55 FT-IR spectroscopy (Bruker Optics, Ettlingen, Germany). The distribution of pore size and PP/TiO2 nanocomposite pore volume was applied by a surface area analyzer (Belsorp Mini II, Japan) multiple point nitrogen gas adsorption Brunauer-Emmett-Teller (BET). Concentrations of malathion were measured via a GC device (Agilent 7890 FID, TCD capillary column of HP5 and FID detector).
Synthesis, extraction and analysis
Processing and synthesis of the nanocomposite were done in a knowledge-based company in the incubator center of Qazvin University of medical sciences, named Atlas Ab-Gostare Sarina. The polypropylene fibers activation, coating with nano titanium dioxide, and drying were the three main stages of synthetizing Nano-PP/TiO2. The first stage, meaning activation, was done through a wet heating process in a chamber made of stainless steel, at 65 °C degrees for 90 min. To prevent fiber deformation, temperature and contact time increasing in PP activation were limited. Furthermore, in a sonication chamber which contained nano-TiO2 with the concentrations of 0.5, 1, and 2 mg/l, at 100 W, 26 kHz, and 40 °C, the coating process of activated fibers was completed. The possibility of the mentioned method has been reported already in previous studies [26, 27].
Extraction of malathion was performed by dispersive liquid-liquid microextraction (DLLME) method. The extraction was done by applying toluene solvent. 50 µL of toluene was injected into the 12 ml of sample. The vial was specially designed for the purpose of this study. After toluene was added into the sample, the door of the vial was covered with a parafilm layer. Afterward, for almost 10 min the vial was put in an ultrasonic chamber and then centrifuged for 3 min at 3200 rpm [10, 28]. Eventually, the vial supernatant was removed by the GC syringe before being injected into a gas chromatograph. The initial concentration of malathion in samples was determined by gas chromatography (GC). The injector temperature was 250 0C and the Helium gas flow was 1 ml/min. The injector was performed with split 1-4. For about 2 min, the primary initial column temperature was maintained at 70 0C. However, the temperature was not the same during the experiment and was increased in the three main steps. In the two first steps, 25 0C/min and 15 0C/min, the temperature was kept at 150 0C and 220 0C, respectively, for 2 min, and at the final step which was 8 0 C/min the temperature was set at 280 0C for about 7 min.
The calibration curve was drawn by 5 different concentrations including 100, 1000, 5000, 10,000, and 1,000,000 μg/L of stoke solution. R2 value extracted from trend lines was 0.99. The limit of detection (LOD) of malathion was measured by using twenty-one spike samples at 5, 10,000, and 20,000 μg/L concentration of the solution, and was ranged from 0.5 to 2 μg/L. The analyses were done with 3 repetitions to evaluate the quantification and quality control of analyzing the samples.
Malathion adsorption was appraised by synthesized Nano PP/TiO2 at pH ~ 7.5, adsorbent dose of 0.5-4 g/L, and constant temperature of 5 to 60 min in a batch reactor. The experiments were carried out by using a rotary shaker in 250 mL shaking flasks at 100 rpm/min. Working solutions were prepared by diluting the stock solution of malathion with distilled water at pH ~ 7.5 and a room temperature of 23-25 °C. Under the similar condition, batch equilibrium and kinetic experiments were operated. Equations 1, 2 and 3 demonstrate the values of equilibrium adsorption qe (mg/g), qt (mg/g) and the percent adsorption (%). Respectively, Ci, Ce, and Ctshow the initial concentration of malathion, equilibrium concentrations of malathion, and concentration at time t for malathion, all in mg/L. W shows Nano-PP/TiO2 dried mass (g) and finally, V is the volume of the solution (L).
| 1 |
| 2 |
| 3 |
Isotherm and kinetic studies
Adsorption isotherms are essential for the description of how adsorbate will interact with the adsorbent to optimize the use of adsorbents for the removal of pollutants from aqueous solutions. In this study, the four isotherms including Langmuir and Freundlich, as two-parameter isotherms, and Temkin and Redrish Peterson, as three-parameter isotherms, were employed to describe the equilibrium adsorption of malathion on Nano-PP/TiO2. R2 values had been chosen to describe the process of adsorption. The equations, plats, parameters, and linearized expressions of isotherm models are given in Table 1.
Table 1.
Isotherm models and their linearized expressions in the adsorption of malathion by Nano-PP/TiO2
| Isotherms | Equations | Linear expression | Plot | Parameters |
|---|---|---|---|---|
| Freundlich | qe = KF(Ce)1/n | ln qe = lnKF + n−1 ln Ce | ln qe vs. ln Ce |
KF = exp(intercept), n = (slope)−1 |
| Langmuir | qe = (qmKLCe)/(1 + KLCe) | Type(I) Ce/qe = (1/KLqm) + (Ce/qm) | (Ce/qe) vs. Ce |
qm = (slope)−1 KL = slope/intercept |
| Type(II) 1/qe = (1/KLqmCe) + (1/qm) | 1/qe vs. 1/Ce |
qm = (intercept)−1 KL = intercept/slope |
||
| Type(III) qe = qm − (1/KL)qe/Ce | qe vs. qe/Ce |
qm = intercept KL = − (slope)−1 |
||
| Type(IV) qe/Ce = KLqm − KLqe | qe/Ce vs. qe |
qm = − (intercept/slope), KL = − slope |
||
| Temkin | qe = qm ln(KTCe) | qe = qm ln KT + qm ln Ce | qe vs. ln Ce |
qm = slope KT = exp(intercept/slope |
| Redrish Peterson | qe = (ARPCe)/(1 + BRPCge) | ln[(ARPCe/qe) − 1] = g ln Ce + lnBRP | ln[(ARPCe/qe) − 1] vs. ln Ce |
g = slope, BRP = exp(intercept) |
The Freundlich, a two-parameter isotherm model, was used to assess the multilayer adsorption of malathion on the Nano-PP/TiO2 surface by assuming a heterogeneous surface of the adsorbent. In the linear equation, Freundlich constants are including Ce, qe, KF, and n which is the initial concentration of malathion (mg/L), adsorbed malathion (mg/g), the adsorption capacity (mg/g), and adsorption intensity, respectively [18, 29].
The Langmuir, a two-parameter isotherm model, was employed to investigate the adsorption of malathion by assuming that the distribution of solute molecules onto the Nano-PP/TiO2 surface has a monolayer pattern. In the linear form, Langmuir constants are including Ce, qe, qm, and Ka which are attributed to the equilibrium concentration of malathion in solution (mg/L), adsorbed malathion (mg/g), maximum monolayer adsorption capacity (mg/L), and energy of adsorption (L/mg), respectively [18, 30, 31].
The Temkin, a three-parameter isotherm model, was employed to evaluate the adsorption energy and interactions between malathion and Nano-PP/TiO2 by assuming that the adsorption heat of all molecules decreases linearly with the increase in coverage of the adsorbent surface, and that adsorption is characterized by a uniform distribution of binding energies, up to maximum binding energy [18, 32].
The Redlich Peterson, another three-parameter isotherm model, is a mix of the Langmuir and Freundlich isotherms which was used for representing adsorption equilibrium over a wide concentration range of malathion from 0.005-20 mg/L. It can be applied in either homogeneous or heterogeneous systems due to its versatility, which in linear Equation App is the Redlich Peterson constant (L/g), BRP is the Redlich Peterson constant (L/mg) and β is the exponent which lies between 1 and 0 [33, 34].
In addition, as prepared in Eqs. 4 and 5, the MPSD (Marquardt’s percent standard deviation) and HYBRID (hybrid fractional error function) were used to assess properly fit the isotherms; whereas and are experimental and calculated adsorbed malathion by Nano-PP/TiO2, P is the number of parameters in the regression model and N is the number of observations in the experimental isotherm [35, 36].
| 4 |
| 5 |
In this study, the second-order, pseudo-first-order, and pseudo-second-order kinetic models were used to assess the mechanism of adsorption of malathion by Nano-PP/TiO2. Kinetic modeling not only allows the estimation of adsorption rates of malathion by Nano-PP/TiO2 but also leads to suitable rate expressions characteristic of possible reaction mechanisms. The equations, plats, and linearized expressions of kinetic models are given in Table 2.
Table 2.
Kinetic models and their linearized expressions in the adsorption of malathion by Nano-PP/TiO2
| Kinetic models | Linear expression | Plot | Parameters |
|---|---|---|---|
| Pseudo-first order | ln(qe − qt) = lnqe − k1pt | ln(qe − qt) vs.t |
qe = exp(intercept), k1p = − (slope) |
| Second order | qt−1 = qe−1 + k2t | qt −1 vs. t |
qe = (intercept)−1, k2 = slope |
|
Pseudo-second order |
Type(I) t/qt = 1/k2pqe2 + t/qe |
t/qt vs. t |
qe = slope−1, k2p = (slope2)/intercept |
|
Type(II) 1/qt = (1/k2pqe2 )(1/t) + (1/qe) |
1/qt vs. 1/t |
qe = intercept−1, k2p = (intercept2)/slope |
|
| Type(III) qt = qe − (1/k2pqe)qt/t | qt vs. qt/t |
qe = intercept, k2p = − 1/(slope × intercept) |
|
|
Type(IV) qt /t = k2pqe2 − k2pqeqt |
q/t vs. qt |
qe = − intercept/slope, k2p = (slope2)/intercept |
The pseudo-first-order kinetic is used when the reaction between adsorbent and adsorbate is second-order overall but is first-order with respect to two reactants. The parameters of this model are introduced in Table 2, where qe and qt are the adsorption capacities (mg/g) and constant of adsorption, respectively. In the pseudo-second-order model, k2 is the adsorption constant (1/g.min) and qe and qt are the adsorption capacities at equilibrium, at time t [37]. In addition, the NSD (normalized standard deviation) and ARE (average relative error) were predicted to confirm the usage of kinetic models in Eqs. 6 and 7 [36].
| 6 |
| 7 |
Results and discussion
Characterization of the Nano-composite
Field-emission scanning electron microscopy (FE-SEM) was accomplished to identify the size and morphology of fibers during the treatment process of the synthesized Nano-PP/TiO2. Figure 1 shows the micrographs of the scanning electron microscope which includes the pictures of the surface of PP fibers after treatment. It can be observed that the crude PP fiber surface changed gradually during the process. Before synthetizing, the surface had no protrusions which made the surface smooth. But after synthetizing, it seemed that the surface had some bumps and appeared to be moldy. The dispersion of nanoparticles was rational without significant aggregations. Also, MAP analyses using scanning electron microscopy were applied to analyze the scratch surface and position of Nano-TiO2 in the adsorbent. It reveals a change of appearance with the presence of Nano-TiO2 particles (red points) adsorbed onto the surface after the treatment process, as presented in Fig. 1.
Fig. 1.

Micrographs of scanning electron microscope
FT-IR prepares qualitative information about existing level functional groups of surfaces and was used to determine the structure of molecules. Its pictures illustrate that at the vibration peak of 1570 to 700 cm − 1, the presence of grafted on PP/TiO2 nanocomposite can be certified. BET analysis was applied using the amount of N2 gas adsorbed at different partial pressures (p/p0) and a single condensation point (p/p0 = 0.98). This analysis presents the amount of the gas adsorbed at equilibrium as a function of the partial pressure (p/po). The maximum amount of the nitrogen adsorbed increased with the partial pressure due to the direct relationship between increasing the volume of the pores with increasing the partial pressure, as a result of which more volume of nitrogen gas is absorbed. The isotherms obtained for Nano-PP/Tio2 were type IV indicating that they are mesoporous materials. It showed that the total pore volume of synthesized Nano-PP/Tio2 was 2.06 cm3/g (p/p0 = 0.98) with average pore diameters of 2.48 nm. In addition, results demonstrated that the prepared Nano-PP/Tio2 has a high surface area (51.52 m2/g).
Also, the energy-dispersive x-ray spectroscopy (EDX test) illustrates the presence of titanium on the fiber surface. The peaks revealed in the spectrum are related to oxygen, carbon, nitrogen, and titanium. Details of EDX, FTIR, BET, and FESEM are presented in the previous studies [26, 38].
Optimization of adsorption
Response surface methodology (RSM) was used to optimize the adsorption of malathion by PP/TiO2 nanocomposite. The RSM is often utilized in six steps including the choice of independent variables, the selection of the experimental design, the mathematic and statistical assessment of the experimental data, the assessment of the model’s fitness, the confirmation of the possibility of performing, and taking the optimum values for each studied variable. Central Composite Design (CCD) is a standard, effective, and the most commonly used design of RSM. The efficiency of the application of CCD to establish the optimization of flocculation, coagulation, adsorption, and degradation of pollutants from water and wastewater has been previously noted [39, 40]. In accordance with the above-mentioned, the interaction of the three independent variables including initial malathion concentration (0.005-20 mg/L), adsorbent dose (0.5-4 g/L), and contact time (5-60 min) was investigated with RSM based on the CCD using Design Expert software (version 7). Also, the importance and the impact of selected variables on the two responses including malathion removal (%) and adsorption rate (mg/g) were determined based on their p-value, F-value, and the determination coefficients [41].
Table 3 shows the analysis of variance and statistical analysis for RSM. ANOVA results confirm the accuracy of the model. The significance of each coefficient was determined by F-values and P-values. The F-value is a measure of the deviation of the data from the mean, and in general, for a model that successfully predicts test results, it is usually a large number. Also, a P-value less than 0.05 means that the model is significant. In this study, the F-value for the removal percentage and adsorption rate was 7.23 and 35.88, respectively. So, the p-value for both variables was less than 0.005, which shows that the model is generally significant [42]. Adjusted R-Squared for adsorption rate was 0.93, which was relatively close to the predicted R-Squared, indicating the accuracy of the model. However, adjusted R-Squared for adsorption rate showed less correlation with predicted R-Squared. The closer R-Squared to 1, the better the relationship between the laboratory and the calculated results [42].
Table 3.
Analysis of variance and statistical analysis for response surface model
| Source | Sum of Squares | Mean Squares | F value | p-value | ||||
|---|---|---|---|---|---|---|---|---|
| Removal % | Adsorption mg/g | Removal % | Adsorption mg/g | Removal % | Adsorption mg/g | Removal % | Adsorption mg/g | |
| Model | 10,594.6 | 9.16 | 1177.18 | 1.31 | 7.23 | 35.88 | 0.002 | < 0.0001 |
| A- initial malathion | 12.88 | 1.47 | 12.88 | 1.47 | 0.08 | 40.36 | 0.78 | < 0.0001 |
| B- adsorbent dose | 69.2 | 3.18 | 69.15 | 3.18 | 0.42 | 87.17 | 0.53 | < 0.0001 |
| C- time | 55.7 | 0.45 | 55.67 | 0.45 | 0.34 | 12.35 | 0.57 | 0.0043 |
| AB | 152.1 | 1.69 | 152.12 | 1.69 | 0.93 | 46.21 | 0.35 | < 0.0001 |
| AC | 742.8 | 0.38 | 742.84 | 0.38 | 4.56 | 10.31 | 0.06 | 0.0075 |
| BC | 16.9 | -- | 16.97 | -- | 0.1 | -- | 0.75 | -- |
| A2 | 2385.91 | 1.01 | 2385.91 | 1.01 | 14.66 | 27.79 | 0.0033 | 0.0002 |
| B2 | 2185.24 | 1.37 | 2185.24 | 1.37 | 13.42 | 37.46 | 0.0044 | < 0.0001 |
| C2 | 282.98 | -- | 282.98 | -- | 1.72 | -- | 0.2168 | -- |
| C.V., % | 20.0 | 31.99 | ||||||
| PRESS | 6077.8 | 2.51 | ||||||
| R-Squared | 0.87 | 0.95 | ||||||
| Adjusted R-Squared | 0.75 | 0.93 | ||||||
| Predicted R-Squared | 0.51 | 0.74 | ||||||
| Pure error | 1467.9 | 0.15 | ||||||
In this study, five factors including initial malathion concentration (A), adsorbent dose (B), contact time (C), the interaction between malathion concentration and adsorbent dose (AB), and interaction between malathion concentration and contact time (AC) were significantly influenced to the responses. Among these variables, adsorbent dose (F-value = 87.17) and interaction between malathion concentration and contact time (F-value = 4.56) had the highest effect on adsorption rate (mg/m) and removal percentage (%), respectively.
By investigating the model, it was found that the optimal conditions for the removal of malathion by the adsorbent are obtained in the initial concentration of 7.13 mg/l, the contact time of 50 min, and the adsorbent dose of 0.5 g/L. Under these conditions, the removal rate of malathion, the absorption rate, and the desirability were 96%, 2.2 mg/g and 0.92, respectively.
The obtained results were used to estimate an optimized model that predicts the removal percentage and adsorption rate which are given by Eqs. 8 and 9. In Eq. 8, the linear parameters A, B, and C along with the interaction between independent variables including AB and BC have a high F-value and a p-value less than 0.005. In the assessment of malathion adsorption by synthesized Nano-PP/TiO2, the model F-value of 35.88 implies that the model is significant. Under model anticipation, there is only a 0.01% chance that a "Model F-Value" could occur due to noise. As prepared in Table 3, analysis of variance revealed that in malathion removal percentages A2 and B2 are significant. The model F-value of 7.23 implies the model is significant and there is only a 0.24% chance that a "Model F-Value" could occur due to noise.
The validity of these equations was supported by the residual point which illustrated statistically that the residual point followed the normal distribution, as presented in Fig. 2. The obtained model can be developed due to the P-value of the lack of fit attained for this model was valid (P-value > 0.05). From Eq. 8, it can be concluded that among the main variables, factor A (initial concentration of malathion) with a coefficient of 0.47 has the highest impact on the adsorption of malathion from aqueous. This is followed by factor B (concentrations of adsorbent) with a coefficient of 0.33. However, in removal percentages, from Eq. 9, it can be seen that factor C (contact time) with a coefficient of 3.67 has the highest impact on the removal of malathion, which is followed by factor B (concentrations of adsorbent) with a coefficient of -3.61.
Fig. 2.

Diagnostic plot-normal probability of the chosen model; removal (a) and adsorption (b)
| 8 |
| 9 |
The RSM models for malathion removal and adsorbent rate were significant (P < 0.005). In optimization of malathion adsorption, it was found that effects of all variables, interactions, and square effect, except BC and C2, were significant (P-value < 0.005, F-value = 10.31-87.17). However, in the case of malathion removal only A2, B2 were significant (P-value < 0.005, F-value = 13.42-14.66).
Figures 3 and 4 illustrate the 3D surface plots between variables for removal and adsorption of malathion by Nano-PP/TiO2. As presented in Fig. 3, the removal percentage of malathion by Nano-PP/TiO2 was increased to 100% by increasing the initial concentration of malathion from 0.5 to 10 mg/l and then a decrease was observed at the higher concentrations. At lower concentrations of malathion, the specific surface areas are high and more available to the malathion molecules, but at concentrations higher than 10 mg/l a decrease in the mass transfer occurred. So, there is a lack of available unoccupied sites of Nano-PP/TiO2. Same results were reported by Dehghani et al. (2017) who demonstrated that the removal of malathion from water by multi-walled carbon nanotubes depends on initial concentration and contact time of adsorption [17].
Fig. 3.

Response surface graph for the removal of malathion (%) by Nano-PP/TiO2 with interactions between contact time and initial concentration of malathion
Fig. 4.
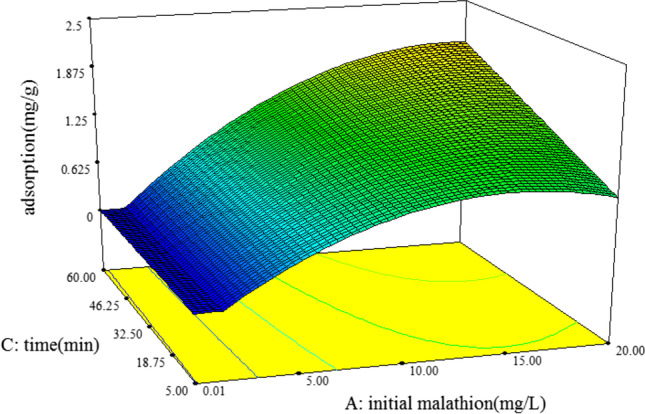
Response surface graph for the adsorption of malathion (mg/g) by Nano-PP/TiO2 with interactions between contact time and initial concentration of malathion
Figure 4 shows the impact of contact time and initial malathion concentrations on the adsorption of malathion by Nano-PP/TiO2. By examining the slope of this graph, it appears that the rate of adsorption increases with the increasing initial concentration of malathion. So, the adsorption rate of malathion was strongly related to the initial concentration of malathion. The maximum adsorption rate was 2.25 mg/g in an initial concentration of 20 mg/l. This is because abundant target molecules are available in a high concentration of malathion on the surface center of Nano-PP/TiO2 which results in the increased mass transfer. It is proved that mass transfer is enhanced when the target molecules are accumulated at the interface of two phases of aqueous-adsorbent. In addition, Fig. 4 shows that the rate of adsorption increases with increasing contact time from 5 to 60 min.
The optimal values of the variables for the removal of malathion by Nano-PP/TiO2 were found 7.13 mg/l, 50 min, and 0.5 g/l for initial malathion concentration, contact time and adsorbent dose, respectively. Nasseri et al. (2018) reported the values of the above variables in order 177.59 mg/L, 81 min and 0.99 g/L using Zn2+-doped TiO2 nanoparticle [42] which were discordant with the findings of the present study.
Although already Karyab et al. had assessed RSM for optimization of total organic carbon (TOC) removal from drinking water with PP/TiO2 nano-composite and other researchers had used RSM for optimization of malathion removal by using different adsorbents, there was no study in the prestigious databases which reports Nano-PP/TiO2 efficiency in the removal of malathion from water and wastewater. For example, Dehghani et al. (2017) used multi-walled carbon nanotubes in the adsorption of malathion from water [17]. In another study, Younis et al. (2017) evaluated the effect of glycidyl methacrylate nano-sorbent for removal of malathion from contaminated wastewater [41] which was not similar to the present study and demonstrate the innovation of this study.
Isotherm of malathion adsorption
As presents in Table 4, obtained results demonstrated the adsorption of malathion was fitted with Langmuir type 2, Freundlich, Temkin, Redlish-Peterson, Langmuir type 1, Langmuir type 3, and Langmuir type 4 isotherms, respectively. The above order revealed that the equilibrium data are better fitted by the two-parameter models rather than the three-parameter models. Also, the Langmuir type 2 isotherm was found to be linear over the entire concentration range of studies with a good linear correlation coefficient (R2 = 0.9999), confirming the monolayer coverage of malathion onto Nano-PP/TiO2, and also, the homogeneous distribution of active sites on the adsorbent. Moreover, it suggests that there is a negligible interaction between malathion and Nano-PP/Tio2 fibers. It means that as a malathion molecule attaches to the active site placed on the Nano-PP/TiO2 surface, no further adsorption can occur at that site [18, 31].
Table 4.
Isotherms parameters by linear regression method for the adsorption of malathion by nano-polypropylene-titanium dioxide composite
| Isotherms | R2 | MPSD | HYBRID | Parameters |
|---|---|---|---|---|
| Freundlich | 0.999 | 2.31 | 0.04 | n = 1.02; KF = 0.55 mg g−1 |
| Langmuir type 1 | 0.784 | 1.64 | 0.01 | KL = 0.02 L mg−1; qm = 4.1 mgg−1 |
| Langmuir type 2 | 0.999 | 2.15 | 0.04 | KL = 0.008 L mg−1; qm = 7.43 mgg−1 |
| Langmuir type 3 | 0.652 | 2.05 | 0.01 | KL = 0.02 L mg−1; qm = 49.23 mgg−1 |
| Langmuir type 4 | 0.652 | 1.64 | 0.02 | KL = 0.013 L mg−1; qm = 4.69 mgg−1 |
| Temkin | 0.919 | 677.19 | 1.53 | KT = 177.7 L mg−1; qm = 0.09 mgg−1 |
| Redlish-Peterson | 0.791 | 172.29 | 174.76 | BRP = 6.71 (L mg−1)g; ARP = 2.77 mg g−1(Lmg−1) |
Based on the Langmuir type 2, the maximum malathion adsorption capacity of Nano-PP/TiO2 was estimated to be 7.43 mg/g which had similarities and differences with the findings of previous studies. Habila et al. (2015) showed malathion adsorption onto activated carbon with an adsorption capacity of 32.1 mg/g [43] which has a higher adsorption capacity than Nano-PP/TiO2 in the present study. However, the capacity of the removal of malathion by using De-Acidite FFIP resin was reported equal to 3.5 mg/g which was lower than the Nano-PP/TiO2 in the present study [31]. Also, under the optimized conditions, the experimental values of degradation of malathion by Zn2+-doped TiO2 nanoparticle were reported 98% [42], 95% using De-Acidite FF-IP resin [31], and 94.8 using sodium alginate/biosilicate/magnetite nanocomposite [18] which those finding were similar to the present study.
The MPSD and HYBRID were developed in this study to ensure the fitting of the isotherm. They got 2.15 and 0.04 respectively, indicating a logical and significant error in anticipating malathion removal on Nano-PP/Tio2 by Langmuir type 2 model.
As presented in Eq. 10, the essential feature of the Langmuir isotherm can be expressed by a dimensionless separation factor (RL); In which KL and C0 are Langmuir isotherm constant (L/mg) and initial malathion concentrations, respectively. The value of the RL’s number divides the isotherm’s type into: unfavorable (RL > 1), linear (RL = 1), irreversible (RL = 0) and favorable (0 < RL < 1); RL was ranged from 0.861 to 0.999 in different initial malathion concentration, indicating favorable condition to optimize the design of malathion adsorption system [21].
| 10 |
Kinetic of malathion adsorption
The second-order, pseudo-first-order, and pseudo-second-order models were used to test adsorption kinetics data in order to investigate the mechanism of the adsorption of malathion by Nano- PP/TiO2. As presented in Table 5, the resulted data from the kinetic study using different nonlinear models indicating that the pseudo-second-order type I was the most suitable model describes the adsorption process of malathion by Nano- PP/TiO2 with R2 value of 0.91.
Table 5.
Kinetic models parameters by linear regression method for the sorption of malathion by nano-polypropylene-titanium dioxide composite
| Kinetic models | R2 | NSD | ARE | Parameters |
|---|---|---|---|---|
| Pseudo-first order | 0.46 | 201.68 | 49.55 | K1p = -0.0025 h−1; qm = 1.53 mg g−1 |
| Second order | 0.69 | 61.61 | 17.21 | K2 = 0.08 mg g−1 h−1; qm = 0.71 mg g−1 |
| Pseudo-second order (type I) | 0.88 | 25.47 | 5.78 | K2p = 0.79 mg g−1 h−1; qm = 0.13 mg g−1 |
| Pseudo-second order (type II) | 0.22 | 60.00 | 16.72 | K2p = 2.03 mg g−1 h−1; qm = 0.2 mg g−1 |
| Pseudo-second order (type III) | 0.13 | 18.43 | 4.25 | K2p = -2.21 mg g−1 h−1; qm = 0.28 mg g−1 |
| Pseudo-second order (type IV) | 0.13 | 35.49 | 9.91 | K2p = -1.52 mg g−1 h−1; qm = 0.05 mg g−1 |
Similar results were obtained in previous studies in the assessment of adsorption of malathion from aqueous solutions by various adsorbents including multi-walled carbon nanotubes [17], magnetic graphene oxide nanocomposite [21], De-Acidite FF-IP resin [31]. In addition, the low to moderate values of NSD and ARE suggested the consistency of the pseudo-second-order type I model to the experimental data.
Conclusion
In this study, the Nano-PP/TiO2 composite has been used as a new adsorbent for removing malathion from aqueous samples. The investigation on FE-SEM, FT-IR, BET, and EDX tests showed the properties and characteristics of the adsorbent. The FE-SEM micrographs showed that the dispersion of the nano-TiO2 particles was relatively good without significant aggregations. MAP reveals a change of appearance with the presence of Nano-TiO2 particles (red points) adsorbed onto the surface after the treatment process. FT-IR pictures revealed the presence of acceptable graft on PP/TiO2 nanocomposite. BET analysis indicated that Nano-PP/TiO2 composite was mesoporous material with a total pore volume of 2.06 cm3/g (p/p0 = 0.98), average pore diameters of 2.48 nm, and surface area of 51.52 m2/g. Also, the EDX test illustrated the presence of titanium on the fiber surface. The optimal condition was 7.13 mg/l for the initial concentration of malathion, 52 min for contact time and 0.5 g/L for the adsorbent dose. The total removal percentage of malathion by Nano-PP/TiO2 was 96%, the absorption rate was 2.2 mg/g and the desirability was 0.92, which revealed that the Nano-PP/TiO2 can be used to remove water and wastewater containing malathion as an effective adsorbent. Batch studies confirmed that the Langmuir type 2 was a suitable fitting model in order to investigate the equilibrium adsorption data onto nanoparticles of titanium dioxide composite. In addition, pseudo-second-order type 1 was the best-fitted model for the kinetic studies. Of course, it is suggested that the applicability of synthesized Nano-PP/TiO2 be determined in continuous flow conditions to ensure its ability to remove malathion from water and wastewater.
Acknowledgements
Authors would like to thank Qazvin University of Medical Sciences for providing the technical and financial support.
Declarations
Conflict of interest
The authors declare that they have no conflict of interest.
Footnotes
Publisher’s note
Springer Nature remains neutral with regard to jurisdictional claims in published maps and institutional affiliations.
Contributor Information
Mehrnoosh Gholami, Email: mehrnooshgholami@gmail.com.
Zohre Mosakhani, Email: zoh.mohammad@gmail.com.
Asma Barazandeh, Email: asmabarazandeh94@gmail.com.
Hamid Karyab, Email: hkaryab@qums.ac.ir.
References
- 1.Alp H, Aytekin I, Esen H, Alp A, Buyukbas S, Basarali K, Hatipoglu NK, Kul S, et al. Protective effects of caffeic acid phenethyl ester, ellagic acid, sulforaphan and curcuma on malathion induced damage in lungs, liver and kidneys in an acute toxicity rat model. Revue Méd Vét. 2011;162(7):333–340. [Google Scholar]
- 2.Joko T, Anggoro S, Sunoko HR, Rachmawati S. Pesticides usage in the soil quality degradation potential in wanasari subdistrict, Brebes, Indonesia. Appl Environ Soil Sci. 2017;2017:5896191. doi: 10.1155/2017/5896191. [DOI] [Google Scholar]
- 3.Aker AWG, Hu X, Wang P, Hwang HM. Comparing the relative toxicity of malathion and malaoxon in blue catfish Ictalurus furcatus. Environ Toxicol. 2008;23(4):548–54. doi: 10.1002/tox.20371. [DOI] [PubMed] [Google Scholar]
- 4.Islam A, Malik MF. Impact of pesticides on amphibians: a review. J Anal Toxicol. 2018;1(2):3. [Google Scholar]
- 5.Zahirnia A, Boroomand M, Nasirian H, Soleimani-Asl S, Salehzadeh A, Dastan D. The cytotoxicity of malathion and essential oil of Nepeta crispa (lamiales: lamiaceae) against vertebrate and invertebrate cell lines. Pan Afr Med J. 2019;33:285. doi: 10.11604/pamj.2019.33.285.18776. [DOI] [PMC free article] [PubMed] [Google Scholar]
- 6.Olakkaran S, Purayil AK, Antony A, Mallikarjunaiah S, Puttaswamygowda GH. Oxidative stress-mediated genotoxicity of malathion in human lymphocytes. Mutat Res Genet Toxicol Environ Mutagen. 2020;849:503138. doi: 10.1016/j.mrgentox.2020.503138. [DOI] [PubMed] [Google Scholar]
- 7.Badr AM. Organophosphate toxicity: updates of malathion potential toxic effects in mammals and potential treatments. Environ Sci Pollut Res. 2020;27:26036–26057. doi: 10.1007/s11356-020-08937-4. [DOI] [PubMed] [Google Scholar]
- 8.Calaf GM, Bleak TC, Roy D. Signs of carcinogenicity induced by parathion, malathion, and estrogen in human breast epithelial cells. Oncol. 2021;45(4):1. doi: 10.3892/or.2021.7975. [DOI] [PMC free article] [PubMed] [Google Scholar]
- 9.Bastos PL, Bastos AF, Gurgel AD, Gurgel IG. Carcinogenicidade e mutagenicidade do malathion e seus dois análogos: uma revisão sistemática. Cien Saude Colet. 2020;25:3273–3298. doi: 10.1590/1413-81232020258.10672018. [DOI] [PubMed] [Google Scholar]
- 10.Karyab H, Mahvi AH, Nazmara S, Bahojb A. Determination of water sources contamination to diazinon and malathion and spatial pollution patterns in Qazvin. Iran Arch Environ Contam Toxicol. 2013;90(1):126–131. doi: 10.1007/s00128-012-0880-8. [DOI] [PubMed] [Google Scholar]
- 11.Shakerkhatibi M, Mosaferi M, Jafarabadi MA, Lotfi E, Belvasi M. Pesticides residue in drinking groundwater resources of rural areas in the northwest of Iran. Health Promot Perspect. 2014;4(2):195. doi: 10.5681/hpp.2014.026. [DOI] [PMC free article] [PubMed] [Google Scholar]
- 12.Silva-Madera RJ, Salazar-Flores J, Peregrina-Lucano AA, Mendoza-Michel J, Ceja-Gálvez HR, Rojas-Bravo D, Reyna-Villela MZ, Torres-Sánchez ED. Pesticide Contamination in Drinking and Surface Water in the Cienega, Jalisco. Mexico Water Air Soil Pollut. 2021;232(2):1–3. [Google Scholar]
- 13.Syafrudin M, Kristanti RA, Yuniarto A, Hadibarata T, Rhee J, Al-Onazi WA, Algarni TS, Almarri AH, Al-Mohaimeed AM. Pesticides in Drinking Water—A Review. Int J Environ Res Public Health. 2021;18(2):468. doi: 10.3390/ijerph18020468. [DOI] [PMC free article] [PubMed] [Google Scholar]
- 14.Köck-Schulmeyer M, Villagrasa M, de Alda ML, Céspedes-Sánchez R, Ventura F, Barceló D. Occurrence and behavior of pesticides in wastewater treatment plants and their environmental impact. Sci Total Environ. 2013;458:466–476. doi: 10.1016/j.scitotenv.2013.04.010. [DOI] [PubMed] [Google Scholar]
- 15.Barbieri MV. Pesticides in the environment: analysis, occurrence, impact and recommendations for their attenuation. University of Barcelona; 2021. http://hdl.handle.net/10261/268888.
- 16.Gacem MA, Telli A, Khelil AO. Nanomaterials for detection, degradation, and adsorption of pesticides from water and wastewater. In: Aquananotechnology. 2021. pp. 315–36. 10.1016/B978-0-12-821141-0.00003-3.
- 17.Dehghani MH, Niasar ZS, Mehrnia MR, Shayeghi M, Al-Ghouti MA, Heibati B, McKay G, Yetilmezsoy K. Optimizing the removal of organophosphorus pesticide malathion from water using multi-walled carbon nanotubes. Chem Eng J. 2017;310:22–32. doi: 10.1016/j.cej.2016.10.057. [DOI] [Google Scholar]
- 18.Hosseini M, Kamani H, Esrafili A, Yegane Badi M, Gholami M. Removal of malathion by sodium alginate/biosilicate/magnetite nanocomposite as a novel adsorbent: kinetics, isotherms, and thermodynamic study. Health Scope. 2019;8(4):e88454. doi: 10.5812/jhealthscope.88454. [DOI] [Google Scholar]
- 19.Jaiswal M, Chauhan D, Sankararamakrishnan N. Copper chitosan nanocomposite: synthesis, characterization, and application in removal of organophosphorous pesticide from agricultural runoff. Environ Sci Pollut Res. 2012;19(6):2055–2062. doi: 10.1007/s11356-011-0699-6. [DOI] [PubMed] [Google Scholar]
- 20.Zhang Y, Pagilla K. Treatment of malathion pesticide wastewater with nanofiltration and photo-Fenton oxidation. Desalination. 2010;263(1-3):36–44. doi: 10.1016/j.desal.2010.06.031. [DOI] [Google Scholar]
- 21.Kalantary RR, Azari A, Esrafili A, Yaghmaeian K, Moradi M, Sharafi K. The survey of Malathion removal using magnetic graphene oxide nanocomposite as a novel adsorbent: thermodynamics, isotherms, and kinetic study. Desalin Water Treat. 2016;57(58):28460–28473. doi: 10.1080/19443994.2016.1178605. [DOI] [Google Scholar]
- 22.Chen L, Hosseini M, Fakhri A, Fazelian N, Nasr SM, Nobakht N. Synthesis and characterization of Cr 2 S 3-Bi 2 O 3 nanocomposites: photocatalytic, quenching, repeatability, and antibacterial performances. J Mater Sci Mater Electron. 2019;30(14):13067–13075. doi: 10.1007/s10854-019-01668-4. [DOI] [Google Scholar]
- 23.Chaudhari S, Shaikh T, Pandey P. A review on polymer TiO2 nanocomposites. Int J Eng Res. 2013;3(5):1386–1391. [Google Scholar]
- 24.Kamrannejad MM, Hasanzadeh A, Nosoudi N, Mai L, Babaluo AA. Photocatalytic degradation of polypropylene/TiO2 nano-composites. Mater Res. 2014;17(4):1039–1046. doi: 10.1590/1516-1439.267214. [DOI] [Google Scholar]
- 25.Masoudifar M, Nosrati B, Mohebbi GR. Effect of surface treatment and titanium dioxide nanoparticles on the mechanical and morphological properties of wood flour/polypropylene nanocomposites. Int Wood Prod J. 2018;9(4):176–185. doi: 10.1080/20426445.2018.1552398. [DOI] [Google Scholar]
- 26.Karyab H, Karyab F, Haji-Mirmohammad AR. Optimization of adsorption conditions for removal of total organic carbon from drinking water using polypropylene and titanium dioxide nano-composite by response surface methodology. Desalin Water Treat. 2017;98:144–151. doi: 10.5004/dwt.2017.21670. [DOI] [Google Scholar]
- 27.Szabová R, Černáková Ľ, Wolfová M, Černák M. Coating of TiO2 nanoparticles on the plasma activated polypropylene fibers. Acta Chimica Slovaca. 2009;2(1):70–76. [Google Scholar]
- 28.Saleh A, Yamini Y, Faraji M, Rezaee M, Ghambarian M. Ultrasound-assisted emulsification microextraction method based on applying low density organic solvents followed by gas chromatography analysis for the determination of polycyclic aromatic hydrocarbons in water samples. J Chromatogr A. 2009;1216(39):6673–6679. doi: 10.1016/j.chroma.2009.08.001. [DOI] [PubMed] [Google Scholar]
- 29.Mahmoud AS, Ismail A, Mostafa MK, Mahmoud MS, Ali W, Shawky AM. Isotherm and kinetic studies for heptachlor removal from aqueous solution using Fe/Cu nanoparticles, artificial intelligence, and regression analysis. Sep Sci Technol. 2020;55(4):684–696. doi: 10.1080/01496395.2019.1574832. [DOI] [Google Scholar]
- 30.Hermosillo-Nevárez JJ, Bustos-Terrones V, Bustos-Terrones YA, Uriarte-Aceves PM, Rangel-Peraza JG. Feasibility study on the use of recycled polymers for malathion adsorption: Isotherms and kinetic modeling. Materials. 2020;13(8):1824. doi: 10.3390/ma13081824. [DOI] [PMC free article] [PubMed] [Google Scholar]
- 31.Naushad M, Alothman ZA, Khan MR. Removal of malathion from aqueous solution using De-Acidite FF-IP resin and determination by UPLC-MS/MS: equilibrium, kinetics and thermodynamics studies. Talanta. 2013;115:15–23. doi: 10.1016/j.talanta.2013.04.015. [DOI] [PubMed] [Google Scholar]
- 32.Singh SN. Sugarcane trash ash: A low cost adsorbent for atrazine and fipronil removal from water. Indian J Chem Technol. 2020;27(4):319–25. [Google Scholar]
- 33.Ayawei N, Ebelegi AN, Wankasi D. Modelling and interpretation of adsorption isotherms. J Chem. 2017;2017:3039817. doi: 10.1155/2017/3039817. [DOI] [Google Scholar]
- 34.Piccin JS, Dotto GL, Pinto LA. Adsorption isotherms and thermochemical data of FD&C Red n 40 binding by chitosan. Braz J Chem Eng. 2011;28(2):295–304. doi: 10.1590/S0104-66322011000200014. [DOI] [Google Scholar]
- 35.El Khomri M, El Messaoudi N, Dbik A, Bentahar S, Lacherai A. Efficient adsorbent derived from Argania Spinosa for the adsorption of cationic dye: Kinetics, mechanism, isotherm and thermodynamic study. Surf Interfaces. 2020;20:100601. doi: 10.1016/j.surfin.2020.100601. [DOI] [Google Scholar]
- 36.Behnamfard A, Salarirad MM. Equilibrium and kinetic studies on free cyanide adsorption from aqueous solution by activated carbon. J Hazard Mater. 2009;170(1):127–133. doi: 10.1016/j.jhazmat.2009.04.124. [DOI] [PubMed] [Google Scholar]
- 37.Villabona-Ortíz A, Tejada-Tovar CN, Ortega-Toro R. Modelling of the adsorption kinetics of chromium (VI) using waste biomaterials. Rev Mex Ing Quim. 2020;19(1):401–408. doi: 10.24275/rmiq/IA650. [DOI] [Google Scholar]
- 38.Barazandeh A, Jamali HA, Karyab H. Equilibrium and kinetic study of adsorption of diazinon from aqueous solutions by nano-polypropylene-titanium dioxide: Optimization of adsorption based on response surface methodology (RSM) and central composite design (CCD) Korean J Chem Eng. 2021;38(12):2436–2445. doi: 10.1007/s11814-021-0863-8. [DOI] [Google Scholar]
- 39.Bezerra MA, Santelli RE, Oliveira EP, Villar LS, Escaleira LA. Response surface methodology (RSM) as a tool for optimization in analytical chemistry. Talanta. 2008;76(5):965–977. doi: 10.1016/j.talanta.2008.05.019. [DOI] [PubMed] [Google Scholar]
- 40.Doosti F, Ghanbari R, Jamali HA, Karyab H. Optimizing fenton process for olive mill wastewater treatment using response surface methodology. Fresen Environ Bull. 2017;26(10):5942–5953. [Google Scholar]
- 41.Younis SA, Ghobashy MM, Samy M. Development of aminated poly (glycidyl methacrylate) nanosorbent by green gamma radiation for phenol and malathion contaminated wastewater treatment. J Environ Chem Eng. 2017;5(3):2325–2336. doi: 10.1016/j.jece.2017.04.024. [DOI] [Google Scholar]
- 42.Nasseri S, Borna MO, Esrafili A, Kalantary RR, Kakavandi B, Sillanpää M, Asadi A. Photocatalytic degradation of malathion using Zn 2+-doped TiO 2 nanoparticles: statistical analysis and optimization of operating parameters. Appl Phys A. 2018;124(2):1–1. doi: 10.1007/s00339-018-1599-0. [DOI] [Google Scholar]
- 43.Habila MA, Alothman ZA, Al-Tamrah SA, Ghafar AA, Soylak M. Activated carbon from waste as an efficient adsorbent for malathion for detection and removal purposes. J Ind Eng Chem. 2015;32:336–44. doi: 10.1016/j.jiec.2015.09.009. [DOI] [Google Scholar]