Abstract
The influence solvents from different polarity and hydrogen bonding ability on electronic absorption spectrum of Methylene blue was investigated. The visible absorption spectra were recorded in eleven neat solvents in the range 400–700 nm. Methylene blue has two absorption maxima, the first band assigned to n-π* from amino groups and the second band assigned to weakly forbidden n-π* transition with charge transfer. The charge transfer band of Methylene blue showed red shift with increasing the relative permittivity of neat solvents. The red shift in wavelength(λmax) for the charge transfer band of Methylene blue was observed when proceeding from dioxane (λmax = 650 nm) into methanol (λmax = 655 nm) into cyclohexanone (λmax = 660 nm) into dimethylsulfoxide (λmax = 665 nm) as well as water (λmax = 665 nm), this shift not agree with the polarity of solvents but due to combination of several parameters. The absorption of charge transfer band in methanol and ethanol as hydrogen bonding donating solvents (HBD) showed the highest intensity than the absorption band in dimethylsulfoxide and dimethylformamide as hydrogen bonding accepting solvents (HBA) due to non-electrostatic interaction between the amino groups and solvents. The charge transfer band in neat solvents were correlated with several parameters using linear solvation energy relationships. The results showed that electrostatic interactions of the solvents play an important role in the shift of absorption maxima of Methylene blue in neat solvents. The acidity constants (pKa) of Methylene blue were estimated by using absorbance measurements in different media. The acidity constants (pKa) values of Methylene blue were affected by cosolvent, which the pKa values increasing in the order propanol < methanol < dioxane, this order not agreement with increasing the relative permittivity of the medium.
Supplementary Information
The online version contains supplementary material available at 10.1007/s10895-023-03234-y.
Keywords: Visible spectra, Solvatochromism, Neat solvents, Polarizability, The acidity constants
Introduction
Solvatochromic dyes exhibit absorption bands in the visible region. In recent years, these dyes used as probes to measure of the polarity of the medium [1-5]. Their visible absorption spectra can be influenced by non-specific interactions such as ion–dipole, dipole–dipole, induced dipole-permanent dipole interactions or by specific interaction such as hydrogen bonding with solvents [8, 9]. Thus, solvents play an important role in physical and chemical processes and can determine change in the position, intensity, and shape of absorption bands upon varying the solvent polarity which tend to modify the energy difference between ground and excited state of the chromophore. Solvatochromism is effective tool to investigate the physical and chemical properties of molecules [6, 7]. Therefore, the quantitative measurement of these interactions are set by different scientists to understand the extent of contribution of these interactions towards the solvation phenomena [9, 10].
The acidity constants (pKa) is an important parameter that indicates the degree of ionization of molecules in solution at different pH values. Many chemical, physical and biological properties of natural and synthetic compounds are governed by the basic and acidic properties. Thus, the pKa parameter is a significant interest in biology, pharmaceutics, medicine and many scientific fields [11, 12]. There are various methods used to estimate the pKa of compounds including the potentiometric technique, conductivity technique and spectrophotometric technique [13-15]. Moreover, the examination of organic solvents on the acidity constants play very important role in the acid–base equilibria and controlled in the pKa values related to different properties of solvents [16-18].
Methylene blue (MB), is an organic thiazine cationic dye and is defined as [Methylthioninum chloride, basic blue 9, tetramethyl thionine chloride]. Methylene blue is used as redox indicator in analytical chemistry [19, 20]. It has numerous application in industrial and in medical that including textiles, wood and papers [20, 21] as well as used to treatment of anemia and covid-19 [22].
This work reveals, the study influence of non-specific and specific solute–solvent interactions on the visible absorption spectrum of Methylene blue in various neat solvents at room temperature was investigated. Solvents were selected to show a wide variety of solvent parameters and hydrogen bonding capacity, to permit a good understanding of the solvent-induced spectral shifts. In addition, the visible absorption spectra of Methylene blue were measured in aqueous buffer solutions of different pH values at room temperature and used for computing the dissociation constants (pKa). Therefore, the effect of cosolvent on the acidity constants magnitudes was examined.
Experimental
Materials
Methylene blue 99.9% used in this work was purchased from Merck company as analytical reagent grad and used without further purification. The structure of Methylene blue is shown in Scheme. 1. The solvents used ethanol (EtOH) 96%, methanol (MeOH) 99.9% 1-propanol (PrOH) 99.9%, 99.8% 1,4-dioxane, 99% acetic acid(ACA), 99.9% dimethylsulfoxide (DMSO), 99.9% dimethylformamide(DMF),99% diethylether (DEtR), 99% ethylacetate (EtOAC) and 99% cyclohexanone (CHN) all spectroscopic grade and were used without further purification. These solvents have special polarity parameters mainly related to the refractive index (n) and relative permittivity (ε) of each solvent [10]. The physical parameters of the solvents at ~25 °C were reported in, Tables 1 and 2.
Scheme 1.

Structure of Methylene blue (MB)
Table 1.
The physical properties and parameters of solvents used in this work at room temperature 25 °C
| Solvents | N | M | K | J | H | αa | β a | π* a | SAb | SBb | SPb | Sdb |
|---|---|---|---|---|---|---|---|---|---|---|---|---|
| DEtR | 0.31 | 0.18 | 0.31 | 0.52 | 0.22 | 0.00 | 0.47 | 0.27 | 0.00 | 0.562 | 0.617 | 0.385 |
| DiX | 0.04 | 0.2 | 0.19 | 0.29 | 0.25 | 0.00 | 0.37 | 0.55 | 0.00 | 0.444 | 0.737 | 0.312 |
| EtOAC | 0.40 | 0.19 | 0.36 | 0.63 | 0.23 | 0.00 | 0.45 | 0.55 | 0.00 | 0.542 | 0.656 | 0.603 |
| CHN | 0.58 | 0.21 | 0.45 | 0.85 | 0.27 | 0.00 | 0.53 | 0.76 | 0.00 | 0.482 | 0.766 | 0.745 |
| DMF | 0.67 | 0.21 | 0.48 | 0.93 | 0.26 | 0.00 | 0.69 | 0.88 | 0.031 | 0.613 | 0.759 | 0.977 |
| DMSO | 0.66 | 0.22 | 0.48 | 0.94 | 0.28 | 0.00 | 0.76 | 1.00 | 0.072 | 0.647 | 0.830 | 1.000 |
| PrOH | 0.63 | 0.19 | 0.45 | 0.87 | 0.23 | 0.84 | 0.85 | 0.52 | 0.367 | 0.782 | 0.658 | 0.748 |
| ACA | 0.41 | 0.19 | 0.36 | 0.63 | 0.23 | 1.12 | 0.45 | 0.64 | 0.689 | 0.390 | 0.651 | 0.676 |
| EtOH | 0.67 | 0.18 | 0.46 | 0.86 | 0.22 | 0.83 | 0.77 | 0.54 | 0.400 | 0.658 | 0.633 | 0.783 |
| MeOH | 0.71 | 0.17 | 0.47 | 0.92 | 0.20 | 0.93 | 0.62 | 0.60 | 0.605 | 0.545 | 0.608 | 0.904 |
| H2O | 0.76 | 0.17 | 0.487 | 0.96 | 0.21 | 1.17 | 0.18 | 1.09 | 1.062 | 0.025 | 0.681 | 0.997 |
Table 2.
Electronic absorption spectra of MB in presence of 11 neat solvents (λmax, nm), molar absorptivity(ɛm, M−1.cm−1) and wavenumber(cm−1) at room temperature 25 °C
| Solvents | na | εa | ET(30)a | λ(max)1 | ν(max)1 | λ(max)2 | ν(max)2 | εmax |
|---|---|---|---|---|---|---|---|---|
| EtR | 1.353 | 04.27 | 34.6 | 560(sh) | 17857.14 | - | - | - |
| DiX | 1.422 | 02.22 | 36.0 | 505(sh) | 19801.98 | 650 | 15384.62 | 13482.43 |
| EtOAC | 1.372 | 06.08 | 38.1 | 505(sh) | 19801.98 | 650(w) | 15384.62 | 6070.29 |
| CHN | 1.452 | 18.30 | 39.8 | 610 | 16393.44 | 660(s) | 15151.52 | 67252.4 |
| DMF | 1.431 | 38.25 | 43.2 | 610(b) | 16393.44 | 665 | 15037.59 | 51054.31 |
| DMSO | 1.478 | 47.24 | 45.1 | 615 | 16260.16 | 665 | 15037.59 | 47859.42 |
| PrOH | 1.386 | 20.80 | 50.5 | 605 | 16528.92 | 655(b) | 15267.18 | 37444.09 |
| ACA | 1.372 | 06.17 | 51.7 | - | - | 655(s) | 15267.18 | 69329.07 |
| EtOH | 1.361 | 24.30 | 51.9 | 610 | 16393.44 | 655 | 15267.18 | 59361.02 |
| MeOH | 1.329 | 33.70 | 55.5 | 605 | 16528.92 | 655 | 15267.18 | 60766.77 |
| H2O | 1.333 | 78.50 | 63.1 | 615 | 16260.16 | 665 | 15037.59 | 37060.7 |
Where: sh shift, b broad, w weak, s strong
aThe values are obtained from Ref. [10]
Preparation of the Solutions
A 25 mg quantity of Methylene blue was weighed separately and dissolved in some quantity of 96% ethanol before making up to 25 mL volumetric flask with the ethanol to give 3.13 × 10⁻³ mol.dm−3 stock solution of Methylene blue. In eleven 10 mL volumetric flask, 0.1 mL of stock solution was transferred to 10 mL volumetric flask and diluted up to the volume with diethyl ether, dioxane, ethyl acetate, cyclohexanone, DMF, DMSO, propanol, acetic acid, ethanol, methanol and deionized water to give the concentration 3.13 × 10⁻⁵ mol.dm−3. These solutions equilibrated and stored in the dark before spectra measurements at room temperature. The universal buffer in this study was prepared by mixing 0.04 mol.dm−3 of H3BO3, H3PO4 and glacial CH3OOH acids and including the desired volume of 0.2 mol.dm−3 NaOH (CO2free) to grant the specified pH. The ionic strength of the considered solution was balanced by including 0.5 mol.dm−3 solution of KCl. All solutions were prepared with de-ionized and CO2-free water. The working solutions with concentration 3.13 × 10⁻⁵ mol.dm−3in all buffered solutions.
Instrumentation
The visible absorption spectra were carried out on CECIL-CE 7400 (S.n.146368, England) UV–Visible Spectrophotometer model cell, covering the wavelength extend 400 -750 nm with a 1-cm path length quartz cell at room temperature 25 °C. All measurements were performed at 25 °C with solutions concentration are 3.13 × 10⁻⁵ mol.dm−3. The pH measurements were carried out using Precise pH-benchmeter Model PHS-3C accurate to ± 0.01 pH unit where the pH meter was standardized with standard buffer solutions (pH = 7 and 10) at ~25 °C. The distilled water was obtained by using Gambro distilled water (AK95 S, Sweden).
Results and Discussion
The Influence of Neat Solvent on the Electronic Absorption Spectra
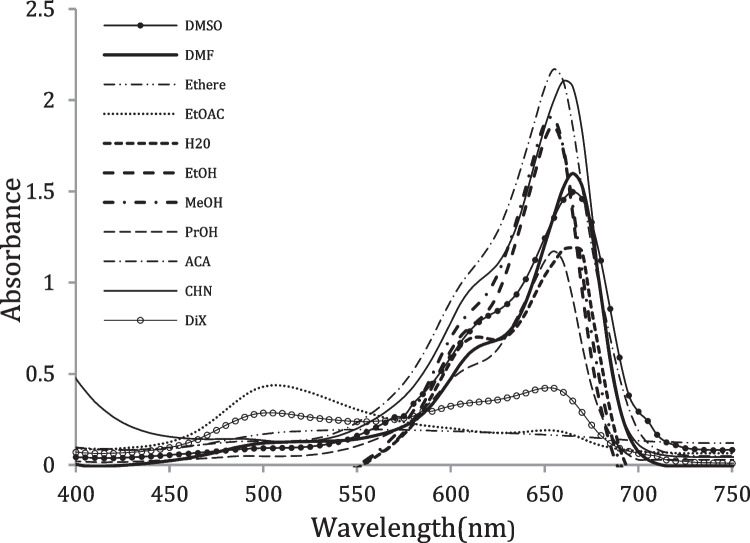
In order to study of solvent effects on spectral features of Methylene blue. The absorption spectra of Methylene blue are measured in eleven distinctive solvents with different polarity at a concentration of 3.13 × 10− 5 mol.dm−3 in the range of 400–750 nm at room temperature ~25 °C. The solvents utilized in the work are chosen in arrange to represent of all sorts of solute–solvent interactions (non-electrostatic and electrostatic solvent effects), Table 1. The values of λmax of the MB in different solvents are summarized in Table 2. The visible absorption spectra of Methylene blue in selected solvents are shown in Fig. 1.
Fig. 1.
The electronic absorption spectrum of 3.13 × 10− 5 mol.dm−3 solution of MB in different solvents at room temperature ~25 °C
The visible absorption spectra of Methylene blue showed two absorption bands, Fig. 1. The first absorption band (λmax) in the range from λmax = 560 into λmax = 615 nm is assigned to a n-π* transition. The Methylene blue has two lone pairs of electrons of NMe2 and -S- groups. Hence, n-π* transitions are participated from these non-bonding orbitals to different π*orbitals. Therefore, the second band in range from λmax = 650 nm into λmax = 665 nm, is attributed to the partly forbidden transition (n-π*) with considerable charge transfer character (CT transition). The charge-transfer nature of this band is deduced from its broadness as from the sensitivity of its λmax to intermolecular hydrogen bonding interactions between solvent and the lone-pairs in molecule [18, 23].
Among the HBD solvents studies, the red shift band observed in HBD solvents (∆λmax = 10 nm) when passing from propanol (λmax = 655, εmax = 37.445 × 10³ M−1.cm−1) into water (λmax = 665 nm, εmax = 37.380 × 10³ M−1.cm−1)with increasing the relative permittivity and polarity of solvents. Since in protic media the n-electrons are involved in intermolecular hydrogen bonding and consequently their excitation is difficult due to their blocking by protic solvent molecules [24]. The shifting of the band occurred due to difference in the stabilization of ground and excited states and thus causes a change in energy gap between electronic states and causes the higher stabilization of the LUMO compared with the HOMO [10], this result in agreed with the reported by Moreira et al. [25]. Hence, the shape and intensity of the absorption spectra of MB depend on the solvent–solute interactions and solvent nature.
Among the HBA solvents, Fig. 1, the charge transfer band shifted toward the red (∆λ = 15 nm) on going from ethyl acetate (λmax = 650 nm) into cyclohexanone (λmax = 660 nm) into DMSO (λmax = 665 nm) which this shift agrees with increasing the polarity and hydrogen accepting ability; when proceeding from ethyl acetate (π* = 0.55) to cyclohexanone (π* = 0.76) to DMSO (π* = 1.00) which confirmed by the solute–solvent interactions from the type dipole–dipole and/or ion–dipole interactions [26]. Accordingly, one observes that the intense dim violet colour in ethyl acetate changes to green colour in CHN and to navy blue colour in DMSO.
As shown in Fig. 1, The absorption intensity of Methylene blue was found to be highest in polar protic solvents such as methanol (εmax = 60.767 × 10³ M−1.cm−1) and ethanol (εmax = 59.361 × 10³ M−1.cm−1) while lowest in polar aprotic solvents such as DMSO (εmax = 47.859 × 10³ M−1.cm−1) and DMF (εmax = 51.054 × 10³ M−1.cm−1) because the existence of solvent–solute interactions like non-electrostatic interactions [27]. The doublet structure in the absorption band of Methylene blue in neat solvents this suggest that the free cation degeneracy is dependent on the type of solvent. In a non-polar solvent such as dioxane, MB salt likely exists as ion pairs in solutions whereas the ions are solvated in polar solution such as methanol. In polar solvents the magnitude of the splitting between the overlapped absorption band of MB dependent on the solvatochromic properties of the media, this suggest that the existence of non-electrostatic interactions, which amino groups are play important role in the solvation of dye [18].
In general, it is seen from Table 2, the most bands of Methylene blue in HBD and HBA solvents that located in the spectral range from λmax = 650 into λmax = 665 nm, exhibits a lucid shift towards longer wavelengths in neat solvents in step with the sequence: EtOAC ≈ dioxane < MeOH ≈ EtOH < CHN < H2O ≈ DMSO. This shift doesn’t consider with the change in the polarity of the organic solvents and, therefore, it may be considered as a results of combination of several solvent characteristics like polarity, basicity, and H-bond-accepting ability.
The Analysis of Data in Neat Solvents by Multiple Linear Regressions
Several solvents parameters are used in multiple linear regression equations include one-, two- three and four-parameter using suitable combinations between the solvent polarity parameters E, K, J, H, M and N as reported before [28, 29]. The empirical solvent polarity, E is sensitive to both solvent–solute hydrogen bonding and dipolar interactions [28, 29]. The Kirkwood function, K is represents the dipolar dielectric interactions and is a measure of the polarity of the solvent that depends on the dielectric constant of the solvent, ε: [30]. The dispersion function J is measure of non-specific solute–solvent interactions [28, 29] and the dipolar effect function H is measure non-specific solute–solvent interactions and is related to the refractive index of the solvent, n: [28, 29]
The function M is representing the solute permanent dipole-solvent induced dipole [9, 31] and the function N is measure of the solute permanent dipole -solvent permanent dipole interactions: [9, 31]
The maximum wavelength of absorption band, Y in a given solvent has been expressed as a linear function of different solvent polarity parameters, xn as follows:
| 1 |
The Eq. (1) is able to solution for the intercept, ao and the coefficients, a1, a2, …, an by multiple regression technique. The regression intercept, ao has been considered as the peak position in the gas phase spectra [9, 28-30]. A program of statistical package of social sciences (SPSS) has been used to determine these coefficients by multiple regression technique [9, 28, 29]. A value of MCC near to unity and / or a small value (near zero) of the significance parameter (P) mean the correlation is good. Also, the higher value of F-number indicates the best fit model.
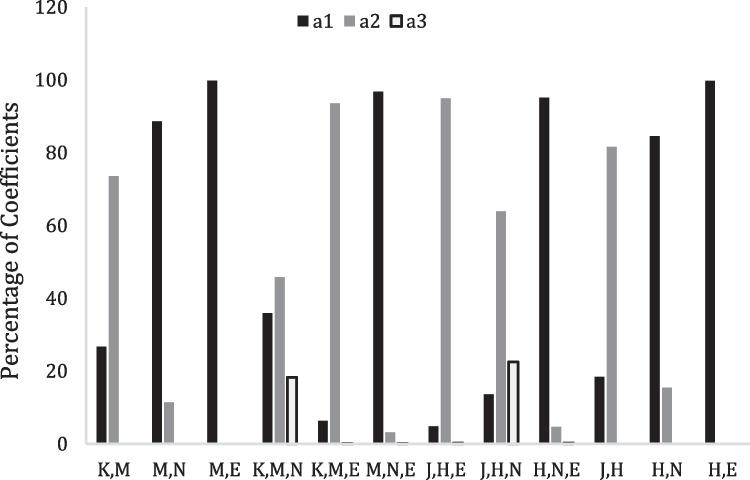
The spectral data are good evidence for the presence of solute–solvent interactions between the active solvents and amino groups with the prediction of the presence of some sort of H-bonding. The regression analysis data for Y2 bands (Y2: λmax ~ 650 to 665 nm) of the investigated compound is given in Tables 3 and 4. On scrutiny the results from Tables 3 and 4 the data show strong dependence of the shift in λmax of MB on (solute permanent dipole-solvent induced dipole function, M) and (Kirkwood function, K) with MCC = 0.305, 0.711 as well as (dipolar function H) and (dispersion function J) with MCC = 0.360, 0.734. The strong fit of (M and H) functions indicating the refractive index of the solvent is the predominant parameter to explain the spectral shifts. In contrast, (the dipolar function, N) show moderate impact on the spectral shift with MCC = 0.679. Thus, the dipolar interactions are responsible to determining the spectral shifts in the medium because the inductive-dispersive forces are stronger than the orientation interactions. This indicates the atomic and electronic polarization are part of the intermolecular interaction. This result confirm the non-electrostatic interactions are responsible to solvatochromism of MB [31]. From Table 3 and Fig. 2, the parameters M or H when combined with another parameter in two-parameter equations or with two parameters in three-parameter equations give high positive values of MCC.
Table 3.
Regression analysis for methylene blue using K, M, N and E parameters
| Parameters | ao | a1 | a2 | a3 | a4 | MCC | P | F |
|---|---|---|---|---|---|---|---|---|
| K | 638.6 | 45.09 | - | - | - | 0.711 | 0.021 | 8.175 |
| M | 637.2 | 105.4 | - | - | - | 0.305 | 0.392 | 0.818 |
| N | 647.3 | 18.51 | - | - | - | 0.679 | 0.031 | 6.830 |
| E | 646.3 | 0.236 | - | - | - | 0.342 | 0.333 | 1.063 |
| K,M | 612.4 | 47.45 | 130.8 | - | - | 0.804 | 0.026 | 6.415 |
| K,N | 625.4 | 118.96 | -32.10 | - | - | 0.731 | 0.069 | 4.019 |
| K,E | 640.2 | 48.20 | -0.060 | - | - | 0.714 | 0.082 | 3.650 |
| M.N | 613.4 | 167.0 | 21.49 | - | - | 0.826 | 0.019 | 7.495 |
| M.E | 543.1 | 395.4 | 0.803 | - | - | 0.864 | 0.008 | 10.33 |
| N,E | 651.6 | 21.94 | -0.131 | - | - | 0.693 | 0.101 | 3.242 |
| K,M,N | 624.5 | -300.7 | 383.9 | 153.3 | - | 0.884 | 0.021 | 7.163 |
| K,M,E | 560.0 | 21.69 | 319.9 | 0.562 | - | 0.896 | 0.015 | 8.181 |
| K,N,E | 599.3 | 217.0 | -80.32 | 0.248 | - | 0.746 | 0.155 | 2.516 |
| M,N,E | 563.6 | 326.4 | 10.49 | 0.529 | - | 0.900 | 0.014 | 8.569 |
| K,M,N,E | 582.6 | -177.9 | 414.9 | 91.21 | 0.397 | 0.915 | 0.033 | 6.454 |
Table 4.
Regression analysis for Methylene blue using J, H, N and E parameters
| Parameters | ao | a1 | a2 | a3 | a4 | MCC | P | F |
|---|---|---|---|---|---|---|---|---|
| J | 641.4 | 20.42 | - | - | - | 0.734 | 0.016 | 9.360 |
| H | 638.2 | 81.17 | - | - | - | 0.360 | 0.306 | 1.160 |
| J,H | 618.3 | 21.29 | 94.10 | - | - | 0.844 | 0.013 | 8.680 |
| J.N | 625.0 | 88.61 | -67.54 | - | - | 0.812 | 0.023 | 6.765 |
| J,E | 643.8 | 22.37 | -0.084 | - | - | 0.741 | 0.062 | 4.260 |
| H,N | 617.8 | 117.1 | 21.39 | - | - | 0.848 | 0.012 | 8.982 |
| H,E | 560.5 | 253.9 | 0.770 | - | - | 0.888 | 0.004 | 13.07 |
| J,H,E | 576.5 | 10.29 | 203.3 | 0.516 | - | 0.924 | 0.006 | 11.65 |
| J,N,E | 594.9 | 154.9 | -142.5 | 0.407 | - | 0.863 | 0.033 | 5.823 |
| J,H,N | 617.2 | -32.14 | 151.4 | 53.45 | - | 0.851 | 0.041 | 5.233 |
| H,N,E | 576.8 | 213.1 | 10.40 | 0.510 | - | 0.924 | 0.007 | 11.61 |
| J,H,N,E | 576.5 | 11.15 | 202.5 | -0.874 | 0.517 | 0.924 | 0.026 | 7.280 |
Fig. 2.
The percentage contribution of solvatochromic parameters in LSERs for MB in various neat solvents in case combination of M or H with other parameters
In general, the four parameters regression equation gives the best fit to the observed spectral shifts. the value of MCC ~ 1.000 which reflects strong fit. This may indicate that non-electrostatic and electrostatic solute–solvent interactions provide a reasonable model for describing solvent induced spectral shifts.
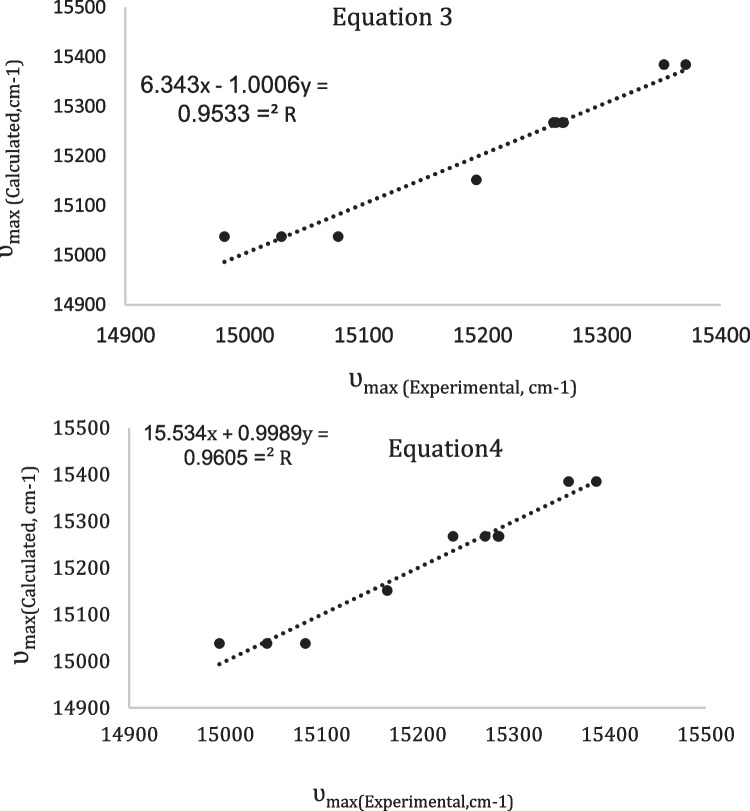
In order to demonstrate the quality of the multilinear regression analysis between four parameters (K, M, N and E) and (J, H, N, and E) techniques. The linear correlations between calculated and experimental λ (MB) values are attempted. The linearity of the curves is directly correlated to the multilinear regression quality (see the R2 values from Fig. 3 and Tables 3 and 4). The higher values of R2 indicate better fitting of the technique to the experimental data. Also, the “F” number is used to compare between two techniques describing the same experimental data. The results indicate that the linear regression of four parameters (J, H, N, and E) gave higher F-number value (7.28) represents a better determination of non-electrostatic interactions than that the linear regression of four parameters (K, M, N, and E).
Fig. 3.
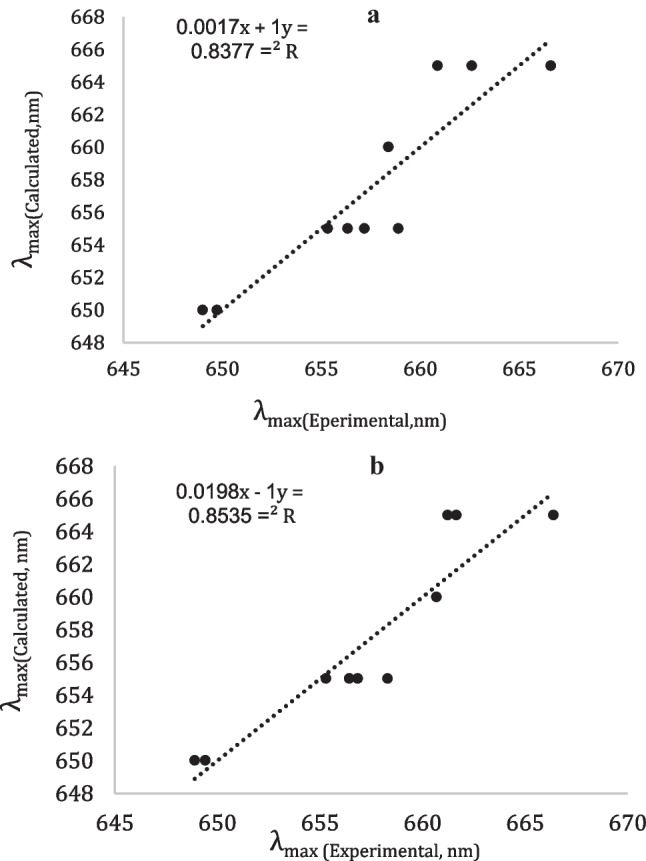
Linear correlations between experimental and calculated λmax(MB) values (in nm) using LSERs for methylene blue in various neat solvents by using Eq. (1) with a K, M, N and E parameters and b J, H, N and E parameters
Solvent Induced Spectral Data Analysis by Two-Parameter Equation
The solvent induced spectral data were further treated using a two-parameter equation as follows: [32]
| 2 |
where vsolution is the frequency of the peak maximum in the presence of solvent, ɛ is the solvent dielectric constant, n is the solvent refractive index and vvapour is the frequency of the peak maximum in the absence of solvent. Multiple regression technique was used to evaluate vvapour, K1, K2 and the correlation coefficients.
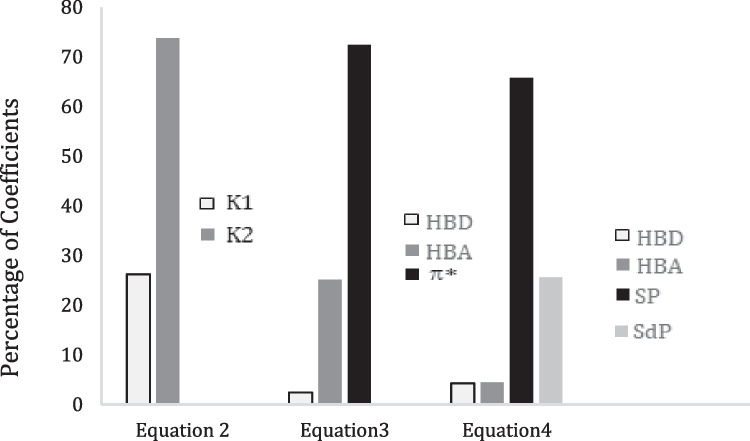
From the analysis of data according to the Eq. (2), Table 5, it observed that the K1 and K2 values are negative for MB. This indicates that strong solutesolvent interaction is taking place, and causing decrease in energy of electronic transition from LUMO to HOMO compared with the vapor state, those results agreed with the results reported in ref. [33]. On the other hand, the parameter K2 is considerably higher than the parameter K1, Fig. 4, this interpreted as the non-electrostatic interaction are participated to bathochromic spectral shift of Methylene blue. The correlation data between (ʋ, n) is poor with value (r = 0.169), in contrast the correlation data between (ʋ, ɛ) with value (r = 0.677).
Table 5.
Correlation coefficients obtained from multiparametric analysis through the treatment of ʋ (max) values with solvent parameters
| Equations/coefficients | Equation (2) | Equation (3) | Equation (4) |
|---|---|---|---|
| Constant × 103 | 16.26 ± 0.38 | 15.82 ± 0.065 | 16.31 ± 0.221 |
| a × 103 | - | -0.022 ± 0.023 | -0.072 ± 0.076 |
| b × 103 | - | -0.230 ± 0.060 | 0.075 ± 0.095 |
| c × 103 | - | - | -1.115 ± 0.291 |
| d × 103 | - | - | -0.434 ± 0.080 |
| s × 103 | - | -0.662 ± 0.060 | - |
| K1 × 103 | -0.549 ± 0.17 | - | - |
| K2 × 103 | -1.545 ± 0.88 | - | - |
| R | 0.806 | 0.976 | 0.980 |
| F | 6.483 | 40.847 | 30.377 |
| p | 0.026 | 0.0002 | 0.001 |
| OSD | 0.091 | 0.036 | 0.036 |
Where a, b, c, d and s: coefficients, R correlation coefficients, F Fisher number, P the probability of variation, OSD overall standard deviation
Fig. 4.
The percentage contribution of solvatochromic parameters in LSERs for MB in various neat solvents
Kamlet-Taft and Catalan Polarity Scales
To understand the behavior of a solute–solvent interaction involved in solvent process. The effects of the electrostatic and non-electrostatic interactions on the electronic absorption spectra are interpreted using the linear solvation energy relationship(LSER) model. In recent decades, Kamlet-Taft (Eq. 3) [34] and Catalan Equation’s (Eq. 4) [35], have been applied to separate the influence of non-electrostatic interactions from electrostatic interactions. Non-electrostatic solute–solvent interactions (hydrogen bonding) are expressed by the solvent acidity, α or SA, and the solvent basicity, β or SB which can be evaluated by multilinear regression analysis. The electrostatic interactions are expressed by Catalan’s SP and SdP parameters as well as by the π* parameter.
| 3 |
| 4 |
where π*, β, and α indicates dipolarity/polarizability [36], hydrogen bond acceptor (HBA) basicity [37], and hydrogen bond donor (HBD) acidity [38], respectively. In Eq. (3), the acidity of solvents as (SA) [39], and basicity of solvents as (SB) [40]. In Eq. (4), The partition of nonspecific solvent effects, term π* in Eq. (3), into two terms: dipolarity and polarizability (SdP and SP) [35]. In both Kamlet-Taft and Catalan solvatochromic models, v° is the regression value of the solute property in the reference solvent. The remaining parameters (a, b, s c and d coefficients) are obtained by using multilinear regression analysis and estimate the relative contribution of solvent molecules in photophysical behavior of solute molecules.
To clarify the results in Table 5, one notices that the magnitudes of the correlation coefficients (in Catalan LSER) vary in the order: c > d > b > a. It emerges that the polarizability of solvent parameter (c coefficient) contributes the most to the ʋ(MB) value in Catalan relation. This indicate that the Methylene blue undergo bathochromic shift with increasing the polarizability of solvents. In contrast, the contribution of the dipolarity parameter (c coefficient) is significantly lower than the polarizability parameter. The both polarizability with dipolarity of solvents (c = 1.115, d = 0.434) for Catalan model are play a more decisive role in the spectral shift this result in an accordance with the result obtained by Kamlet-Taft relation, which the π term is more responsible to the spectral shift with value (s = 0.662), see Fig. 4. This is suggesting the stabilization of the molecule within the first excited state relative to that within the ground state with expanding solvent polarity, will lead to positive solvatochromism. In contrast, the hydrogen accepting ability for both models has small influence on the spectral shift in comparison with the polarizability and dipolarity of solvents. Therefore, the contribution of the HBD acidity parameter (a coefficient) is significantly lower than the HBA basicity parameter for both Catalan (0.072) and Kamlet-Taft (0.022) relations and can be neglected, Fig. 4. This suggests that the hydrogen bond accepting ability of the solvent have greater effects on the transition energy than its hydrogen bond donor ability, this is often, in good agreement with results reported by literature [18]. Consequently, the Methylene blue molecule undergo stabilization via hydrogen bonding with solvent molecules. Finally, Fig. 4 is representing the percentage contribution of solvatochromic parameters of KAT relation Eq. (3) and Catalan relation, Eq. (4). MB showed that solvent polarizability and solvent dipolarity are the most vital parameters which influence the absorption frequency shifts for both models.
From the analysis of absorption frequencies according to Kamlet-Taft Eq. (3) and Catalan Eq. (4), it is found that the positive sign of b coefficient for Catalan model, Table 5, indicates a hypsochromic shift with increasing solvent hydrogen-bond basicity [41]. This means stabilization of the ground state relative to the electronic excited state. Otherwise, the positive sign of b coefficient suggests the formation of solute–solvent hydrogen bonds for both electronic states, which stabilizes them in solvents with high hydrogen bond accepting abilities. The negative signs of (s, c and d) coefficients, indicates a bathochromic shift with increasing solvent dipolarity/polarizability for both models, which suggests stabilization of the electronic excited state relative to the ground state. this is agreed with the results reported in ref. [33]. Hence, the very small negative value of a coefficient for both models is attributed to Methylene blue undergoes slightly a bathochromic shift with increasing hydrogen ability of solvents.
In order to demonstrate the quality of the multilinear regression analysis between Catalan and Kamlet-Taft strategies. The linear correlations between calculated and experimental ʋ(MB) values are attempted. The linearity of the curves is directly correlated to the multilinear regression quality (see the R values from Fig. 5 and Table 5). The higher values of R indicate better fitting of the model to the experimental data. Also, the “F” number could be also used to compare between two models describing the same experimental data. The results in Table 5 indicates that the solvent Kamlet-Taft scale with higher F-number value (40.847) represents a better determination of non-electrostatic interactions than the Catalan scale.
Fig. 5.
Linear correlations between experimental and calculated ʋmax(MB) values (in cm−1) using LSERs for Methylene blue in various neat solvents by using Eqs. (3) and (4)
The Effect of Buffer Solutions on the Electronic Absorption Spectra of Methylene Blue
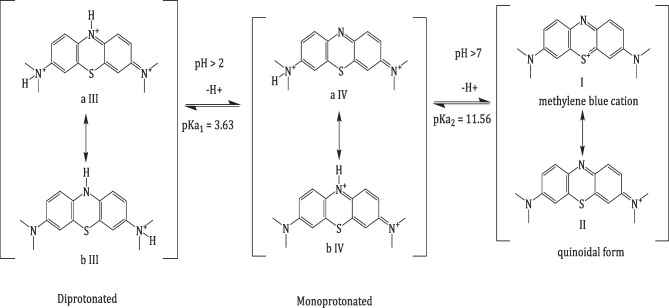
Methylene blue is dye with content 99%, which sky blue colored at pH 2–4 and changed to blue at pH 5–7 and it changed to navy blue in pH ≥ 8. The change from the navy blue to sky blue with decreasing the pH due to delocalization of π system. The proton dissociation scheme can be represented as below:
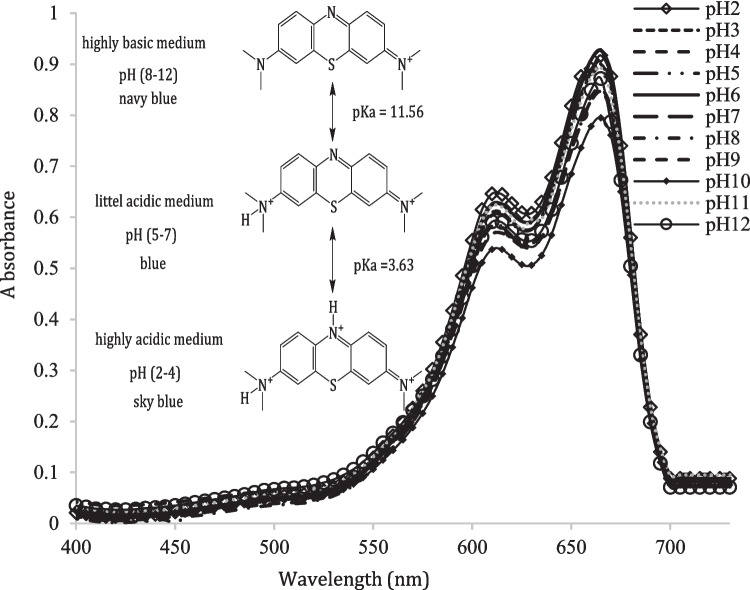
The visible absorption spectrum of Methylene blue is investigated at different pH’s solutions from Fig. 6, the band position stays the same position with no identical change in the intensity which pH-dependence due to the rearrangement of the molecule as results as the protonation. The visible electronic absorption spectra of 3.13 × 10⁻⁵ M solution of Methylene blue in 50% (v/v) dioxane-water solution in the pH range 2–12 as for example, show in Fig. 6, exhibited two well-defined bands, the first band centered at 615 nm is assigned to n-π* transitions from amino groups. Therefore, the second band centered at 665 nm is assigned to n-π* with as possible formation of CT nature through the conjugation between the aromatic rings systems via the N and S atoms link). For acidic solutions (pH ≤ 4), the first absorption bands are lowest in intensity with no change in position while the second band are highest in intensity with no change in position suggesting that the unstable form (H2In+3) is deprotonated giving the species (HIn+2), Scheme 2. However, for basic solutions (pH ≥ 5) with increasing the pHs which the first absorption bands remain at the identical position with no identical shift in intensity. Figure 6. as well as the same change is observed for the second bands. Finally, the absences of an isosbestic point indicate the presence of acid–base equilibria between more than two species.
Fig. 6.
The electronic absorption spectra of 3.13 × 10− 5 M solution of Methylene blue in dioxane at different pH's
Scheme 2.
The dissociation mechanism of Methylene blue: (I) Methylene blue cation, (II) Quinoidal form, (III) Diprotonated form of quinoidal form, (IV) Mono protonated form of quinoidal form
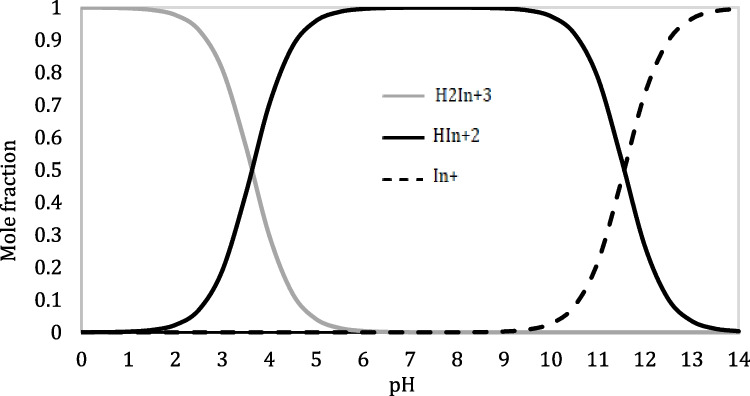
Herein, the protonation in MB may occur either in two NMe2 groups or at the central nitrogen atom of MB or both in tandem [42]. Figure 6, MB+ is also present that which a tautomeric and pH dependent equilibrium exists between Methylene blue cation (I) and its quinoidal form (II) [43], Scheme 2. Under protonation, the quinoidal form winds up in formed mono and dicationic forms by protonation on the nitrogen atoms (III and IV), Scheme 2. In solution, its colour ranges from sky blue in strong acidic solutions through blue in weakly acidic to neutral and navy blue in strong alkaline medium. The change in color with decreasing pHs is associated to the modification of the π system delocalization pattern [44]. The sample of distribution diagrams for Methylene blue species in several water-dioxane mixtures are shown in, Fig. 7. The variation of the species is due to the acid dissociation shifting as pH changes [9].
Fig. 7.
Distribution diagram of the acid species of Methylene blue in % 50 (v/v) water-dioxane at various pH’s
The Effect of Cosolvents on the Acidity Constants of Methylene Blue
The acidity constants of Methylene blue in this study are determined using three different spectrophotometric methods including the half- curve height, the modified limiting absorption and Colleter methods [47]. Table 6, in the half-curve height method: the pKa values were evaluated at a constant wavelength from the half height of the AS versus pH curves, Fig. 8, the pKa values are calculated from the half height of the curve where pKa = pH.
Table 6.
Acidity constants of Methylene blue at λmax = 665 nm in numerous solutions of 50% cosolvents at room temperature ~25 °C,ionic strength 0.5 MKCl
| 50%Cosolvent | Method 1 | Method 2 | Method 3 | Average pKa | ||||||
|---|---|---|---|---|---|---|---|---|---|---|
| pka1 | pka2 | pKa1 | pKa2 | pKa1 | pKa2 | pKa1 | pKa2 | ε | Ref. | |
| H2O | - | - | - | - | - | - | 3.80 | - | - | [45] |
| - | - | - | - | - | - | - | 2.61 | 11.2 | - | [46] |
| DiX | 3.60 | 11.7 | 3.71 | 11.41 | 3.57 | - | 3.63 ± 0.07 | 11.56 ± 0.21 | 40.36 | This work |
| PrOH | 2.50 | 10.7 | 2.55 | 10.84 | - | - | 2.52 ± 0.03 | 10.78 ± 0.11 | 47.40 | - |
| MeOH | 2.45 | 11.5 | 2.72 | 11.53 | - | - | 2.58 ± 0.19 | 11.52 ± 0.09 | 60.80 | - |
Where: Method 1: half-curve height method, Method 2: limiting absorption modified method and Method 3: Colleter method, ε: relative permittivity
Fig. 8.
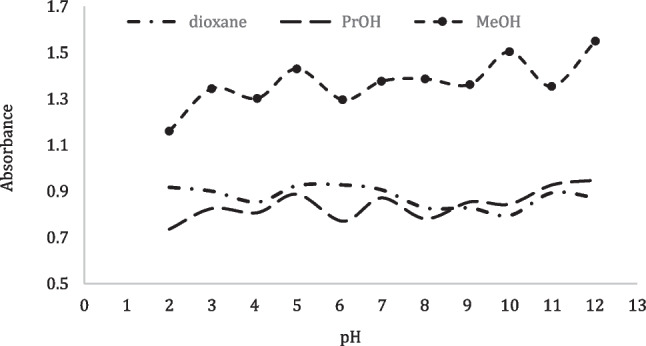
The half-height method; Absorbance versus pH curve of MB at λmax = 665 nm in three different solutions
In the modified absorbance method: the pKa values are evaluated by applying the subsequent equation:
where Amax is the maximum absorbance, Amin is the minimum absorbance, A is the absorbance at any pH, and γ is the activity coefficient term. 0.5 M-KCl is added as a supporting electrolyte to control the activity coefficient term. By plotting the log absorbance ratio versus pH, when the log ratio term equals zero, pH equals pKa.
Finally, in the Colleter method: the pKa values were evaluated, where three different concentrations of hydrogen ions were selected and their absorbance values got, [H +]1 > [H +]2 > [H +]3 and As1 > As2 > As3. The acid dissociation constant is calculated:
The calculated pKa values of Methylene blue in some aqueous solvents are listed in, Table 6. With change of cosolvent no shift occurs in wavelength but that is affected on the intensity of optical density. Calculations at λmax 665 nm using the three mentioned spectrophotometric methods reveal two pKa's. The pKa1 value is attributed to the dissociation of proton from NMe2 group the H2In+3 form. However, the other pKa2 value is attributed to the ionization of proton from central nitrogen in the HIn+2 form to formation neutral form, (HIn+2 ↔ In+). So, MB-IV is more stable compared to MB-III, which indicates the greater protonation tendency at the central nitrogen compared to the other two NMe2 [43]. Under extreme acidic conditions at pH < 2 occurs protonation for three amino groups and produced protonated lecuo Methylene blue H2LMB with colorless solutions [48]. Our calculations thank to Marvin Sketch 22.2 software give pKa values -0.21, -1.3 and 2.44, respectively, Fig. 9, The data and speciation diagram are present in SI. The experimental pKa values are different from the calculated pKa values this result suggest the Methylene blue molecules are dissociated in a cationic form for at higher pH values [49].
Fig. 9.
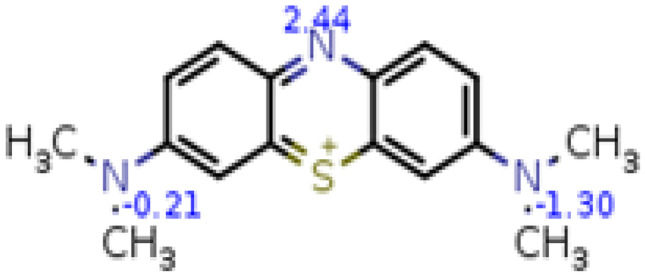
Calculated pKa values of MB (ChemSketch)
The pKa values of the Methylene blue are investigated in some media. It is clear from the data in, Table 6, that the pKa values of MB is largely dependent on the properties of the cosolvent. From Table 6, the acidity constant (pKa) is approximately in methanol more than the propanol although propanol have lowest relative permittivity (24.28, at ~25 °C) than methanol (33.7 at ~25 °C) this is not attributed to only relative permittivity control the magnitude of acidity constant as results as other parameters of solvents affecting on the acidity constants pKa [18]. Otherwise, the relative strength of hydrogen bonding as reflect the difference in pKa values [50]. Therefore, as compared despite dioxane have approximately the low relative permittivity constant (2.22 at ~25 °C), the Methylene blue more basic in (50%v/v) water + dioxane instead of all solutions as well as MB is solvated by different degree based on the type of solvents. In general, the pKa values of MB in water + organic solvent are arranged in line with the subsequent sequence: PrOH < MeOH < dioxane. This order not consider with decreasing the relative permittivity.
The effects of hydrogen bonding, solvent basicity, dispersive forces, and proton-solvent interactions play vital roles in the ionization process of acids in presence of organic solvents [17]. Thus, the observed increase in the pKa values of MB as result change of the organic cosolvent in the medium is increased due to the electrostatic effect in addition to the non-electrostatic interaction between the conjugated base (A−) and solvent molecules. Since water molecules have the tendency to donate hydrogen-bonds than other solvent molecules [18]. It indicates also that the difference in the stabilization of the ionic forms by hydrogen-bond donor solvent molecules plays a very important role in an increase of the pKa values.
On scrutiny the results in, Table 6, reveals that the pKa values in the presence propanol are less than those obtained in the presence of corresponding amounts of the other solvents. This behavior interpreted by the high basic character of propanol (β = 0.85), which reflects itself in the construction of a powerful hydrogen-bond acceptor from the N+H(CH3)2 group of the non-ionized dye molecule and consequently promotes the ionization process to give low pKa [18].
Conclusions
Herein, the solvation characteristics of the Methylene blue molecules were investigated in neat solvents of various physical–chemical properties. The absorption spectral shifts were analyzed using multiple statistical regression model proposed by different techniques. Thus, correlations (MLR analysis) between the maximum of absorption band of Methylene blue and therefore the solvent parameters (K, M, N, J, H and ET(30)), (π*, α and β) or (SA, SB, SP and SdP). It shown that the electronic absorption spectra were mainly affected by non-specific interaction as well as specific solute–solvent interactions play role in solvatochromism of molecule. The results showed that the absorption maxima Methylene blue was dependent on the solvent polarizability/dipolarity and hydrogen bond accepting ability of solvents by Kamlet-Taft model.
The effect of buffer solutions on the absorption band of Methylene blue with different constituents were discussed and therefore the mechanism of ionization was explained. The acidity constants of the investigated compound were resolve by the methods described during this work. The results showed the dissociation constant of Methylene blue that dependent on the relative permittivity of the medium and hydrogen bonding formed between conjugate base and solvent molecule.
Supplementary Information
Below is the link to the electronic supplementary material.
Acknowledgements
The author is grateful to Dr. Radwan Alnajjar for his scientific and help in this investigation.
Author Contributions
Sokaina Saad Hemdan: Investigation, visualization, writing- original draft, writing-review and editing.
Availability of Data and Material
All the data appear in the research as well as material.
Declarations
Ethics Approval
Not applicable.
Consent to Participate
Not applicable.
Consent for Publication
Applicable.
Competing Interest
The author declares that they no known competing financial interests or personal relationships that could have appeared to influence the work reported in this paper.
Footnotes
Publisher's Note
Springer Nature remains neutral with regard to jurisdictional claims in published maps and institutional affiliations.
References
- 1.Airinei A, Homocianu M, Dorohoi DO. Changes induced by solvent polarity in electronic absorption spectra of some azo disperse dyes. J Mol Liq. 2010;157:13–17. doi: 10.1016/j.molliq.2010.07.011. [DOI] [Google Scholar]
- 2.Al-Jebaly AM, Hemdan SS, Ali FK. Solvatochromic effect studies on the absorption spectra of 4-[(E)-(3-formayl-4-hydroxyphenyl) diazneyl] benzene sulphonic acid and 2-hydroxy -5-[(E)-(2-nitrophenyl) diazneyl] benzaldehyde azo compounds. J Sci Hum Stu. 2017;39:1–15. [Google Scholar]
- 3.Sidir YG, Sidir I, Taal E, Ermi E. Studies on the electronic absorption spectra of some monoazo derivatives. Spectrochim Acta A. 2011;78:640–647. doi: 10.1016/j.saa.2010.11.040. [DOI] [PubMed] [Google Scholar]
- 4.Elmsheeti N, Hemdan H, Sammour A, Alnajjar A. Negative solvatochromic behavior and theoretical investigation on 2-amino-4-(4-(dimethyl amino) phenyl) buta-1,3-diene-1,1,3-tricarbonitrile. Chem Data Collect. 2020;28:100465. doi: 10.1016/j.cdc.2020.100465. [DOI] [Google Scholar]
- 5.Baughman BM, Stennett E, Lipner RE, Rudawsky AC, Schmidtke SJ. Structural and spectroscopic studies of the photophysical properties of benzophenone derivatives. J Phys Chem A. 2009;113:8011–8019. doi: 10.1021/jp810256x. [DOI] [PubMed] [Google Scholar]
- 6.Sidir YG, Aslan C, Berber H, Sidir I. The electronic structure, solvatochromism, and electric dipole moments of new Schiff base derivatives using absorbance and fluorescence spectra. Struct Chem. 2018;30:835–851. doi: 10.1007/s11224-018-1228-8. [DOI] [Google Scholar]
- 7.Marcus Y. The properties of solvents. New York: John Wiley and Sons; 1998. [Google Scholar]
- 8.Han W, Liu T, Himo F, Toutchkine A, Bashford D, Hahn KM, Noodleman L. A theoretical study of the UV/Visible absorption and emission solvatochromic properties of solvent-sensitive dyes. Chem Phys Chem. 2003;4:1084–1094. doi: 10.1002/cphc.200300801. [DOI] [PubMed] [Google Scholar]
- 9.Masoud MS, Elsamra RIM, Hemdan SS. Solvents, substituent’s and pH’s effects towards the spectral shifts of some highly colored indicators. J Serb Chem Soc. 2017;82:856–866. doi: 10.2298/JSC170204032M. [DOI] [Google Scholar]
- 10.Reichardt C. Solvents and solvent effects in organic chemistry, 3rd ed. Weinheim: Wiley-VCH; 2010. [Google Scholar]
- 11.Meloun M, Bordovska S, Vrana A. The thermodynamic dissociation constants of the anticancer drugs camptothecine, 7-ethyl-10-hydroxycamptothecine, 10-hydroxycamptothecine and 7-ethylcamptothecine by the least-squares nonlinear regression of multiwavelength spectrophotometric pH-titration data. Am J Anal Chem. 2007;584:419–432. doi: 10.1016/j.aca.2006.11.049. [DOI] [PubMed] [Google Scholar]
- 12.Meloun M, Ferencikova Z, Vrana A. The thermodynamic dissociation constants of azathioprine by the nonlinear regression and factor analysis of multiwavelength spectrophotometric pH-titration data. Am J Anal Chem. 2010;1:14–24. doi: 10.4236/ajac.2010.11002. [DOI] [Google Scholar]
- 13.Vidal Salgado LE, Vargas-Hernández C. Spectrophotometric determination of the pKa, isosbestic point and equation of absorbance vs. pH for a universal pH indicator. Am J Anal Chem. 2014;5:1290–1301. doi: 10.4236/ajac.2014.517135. [DOI] [Google Scholar]
- 14.Bharavi K, Shyamala P, Rao GN. Determination of protonation constants of viral inhibitor, aurintricarboxylic acid in SDS and CTAB micellar media: a potentiometric study Asian. J Chem. 2021;33:2301–2305. [Google Scholar]
- 15.Meloun M, Havel J, Hogfeldt E. Computation of solution equilibria: A guide to methods in potentiometry extraction and spectrophotometry. New York: John Wiley; 1988. [Google Scholar]
- 16.Sanlı S, Altun Y, Alsancak G. Determination of the dissociation constants of some macrolide antibiotics in methanol-water binary mixtures by UV-spectroscopy and correlations with the Kamlet and Taft solvatochromic parameters. J Solution Chem. 2012;41:1352–1363. doi: 10.1007/s10953-012-9868-6. [DOI] [Google Scholar]
- 17.Gharib F, Farajtabar A, Farahani AM, Bahmani F. Solvent effects on protonation constants of tryptophan in some aqueous aliphatic alcohol solutions. J Chem Eng Data. 2010;55:327–332. doi: 10.1021/je900352f. [DOI] [Google Scholar]
- 18.Hemdan S, Al Jebaly A, Ali F. The impacts of various media on the electronic spectrum of aniline violet. J Arb Sci pub. 2021;2:28–54. [Google Scholar]
- 19.Murat OZ, Dietrich EL, Mohammed H, George AP. Cellular and molecular actions of methylene blue in the nervous system. Med Res Rev. 2011;31:93–117. doi: 10.1002/med.20177. [DOI] [PMC free article] [PubMed] [Google Scholar]
- 20.Hassan MF, Khan AS, Akbar N, Ibrahim TH, Khamis MI, Jumean FH, Siddiqui R, Khn NH, Yasir N. Efficient extraction of methylene blue from aqueous solution using phosphine-based deep eutectic solvents with carboxylic acid. Processes. 2022;10:2152. doi: 10.3390/pr10102152. [DOI] [Google Scholar]
- 21.Khan I, Saeed K, Zakker I, Zhang B, Hendi AH, Ahmad A, Ahmad S, Zada N, Ahmad H, Shah LA, Shah T, Khan I. Review in methylene blue: its properties, uses, toxicity, and photodegradation. Water. 2022;14:242. doi: 10.3390/w14020242. [DOI] [Google Scholar]
- 22.Scigliano G, Scigliano GA. Methylene blue in covid 19. Med Hypotheses. 2021;146:110455. doi: 10.1016/j.mehy.2020.110455. [DOI] [PMC free article] [PubMed] [Google Scholar]
- 23.Sıdır I, Sıdır YG, Berber H, Taşal E. A study on solvatochromism of some monoazo dye derivatives. J Mole Liq. 2013;178:127–136. doi: 10.1016/j.molliq.2012.11.011. [DOI] [Google Scholar]
- 24.Amrallah AH, Abdalla NA, El-Haty EY. Spectrophotometric studies on some arylazo barbituric acids and arylazo pyrimidine in organic solvents and in buffer solutions. J Chinese Chem Soc. 2007;54:1629–1637. doi: 10.1002/jccs.200700230. [DOI] [Google Scholar]
- 25.Moreiraa LM, Lyona JP, Limab A, Codognotoc L, Severinod D, Baptistad MS, Tessaroe AL, Gerolaf AP, Hiokag N, Rodriguesh MR, Bonacini JA, Santosj SC, Romanik AP, de Oliveiral HPM. The Methylene blue self-aggregation in water/organic solvent mixtures: Relationship between solvatochromic properties and singlet oxygen production. Electron J Chem. 2017;9:279–289. [Google Scholar]
- 26.Ashfaq M, Saeed R, Masood S, Khan S, Yasmin F. Solute-solvent interactions of methyl violet in different solvents on spectral data Russ. J Phys Chem A. 2018;92:730–733. [Google Scholar]
- 27.Lewis LM, Indig GL. Solvent effects on the spectroscopic properties of triarylmeythane dyes. Dye Pigm. 2000;46:145–154. doi: 10.1016/S0143-7208(00)00049-8. [DOI] [Google Scholar]
- 28.Masoud MS, Khalil EA, Enein AEL, SA, Kamel HM, Solvatochromism and potentiometric studies of some active nitroso- and nitroso-azo-compounds. Eur J Chem. 2011;2:420–432. doi: 10.5155/eurjchem.2.3.420-432.407. [DOI] [Google Scholar]
- 29.Masoud MS, Ali AE, Shaker MA, Abdul Ghani M. Solvatochromic behavior of the electronic absorption spectra of some azo derivatives of amino pyridine. Spectrochim Acta A. 2004;60:3155–3159. doi: 10.1016/j.saa.2004.02.030. [DOI] [PubMed] [Google Scholar]
- 30.Masoud MS, Hammud HH. Electronic spectral parameters of the azo indicators: methyl red, methyl orange, PAN, and fast black K-salt. Spectrochim Acta A. 2001;57:977–984. doi: 10.1016/S1386-1425(00)00416-9. [DOI] [PubMed] [Google Scholar]
- 31.Hemdan SS, Algebali AM, Ali FK. behavior of the electronic absorption spectrum of bromocresol purple toward neat solvents and binary aqueous solvents: revers solvatochromism, preferential solvation and multiparametric analysis. J Chem Techn Metall. 2023;58:125–142. [Google Scholar]
- 32.Hammud HH, El-Dakdouki MH, Sonji NM, Bouhadir KH. Solvatochromic absorption and fluorescence studies of adenine, thymine and uracil thio-derived acyclonucleosides. Eur J Chem. 2015;6:325–336. doi: 10.5155/eurjchem.6.3.325-336.1282. [DOI] [Google Scholar]
- 33.Al-Jebaly AM, Hemdan SS, Ali FK. Solvatochromism effect studies on electronic absorption spectra of some hydroxy tolyl azo benzaldehyde dyes. J Natur Sci Life Appl Sci. 2017;1:33–50. [Google Scholar]
- 34.Kamlet MJ, Abboud JLM, Abraham MH, Taft RW. Linear solvation energy relationships. 23. A comprehensive collection of the solvatochromic parameters, pi.*, alpha., and. beta., and some methods for simplifying the generalized solvatochromic equation. J Org Chem. 1983;48:2877–2887. doi: 10.1021/jo00165a018. [DOI] [Google Scholar]
- 35.Del Valle JC, Garcia Blanco F, Catalan J. Empirical parameters for solvent acidity, basicity, dipolarity and polarizability of ionic liquids [BMIM][BF4]and [BMIM][PF6] J Phys Chem B. 2015;119:4683–4692. doi: 10.1021/jp511154h. [DOI] [PubMed] [Google Scholar]
- 36.Kamlet MJ, Abboud JLM, Taft RW. The solvatochromic comparison method. 6. The. pi.* scale of solvent polarities. J Am Chem Soc. 1977;99:6027–6038. doi: 10.1021/ja00460a031. [DOI] [Google Scholar]
- 37.Taft RW, Kamlet MJ. The solvatochromic comparison method. I. The. beta.-scale of solvent hydrogen-bond acceptor (HBA) basicities. J Am chem Soc. 1976;98:377–383. doi: 10.1021/ja00426a036. [DOI] [Google Scholar]
- 38.Taft RW, Kamlet MJ. The solvatochromic comparison method. 2. The. alpha.-scale of solvent hydrogen-bond donor (HBD) acidities. J Am Chem Soc. 1976;98:2886–2894. doi: 10.1021/ja00426a036. [DOI] [Google Scholar]
- 39.Catalán J, Díaz C. A generalized solvent acidity scale: The solvatochromism of o-tert-butylstilbazolium betaine dye and its homomorph o, o′-di-tert-butylstilbazolium betaine dye. Liebigs Ann. 1997;9:1941–1949. doi: 10.1002/jlac.199719970921. [DOI] [Google Scholar]
- 40.Catalán J, Díaz C, Lopez V, Perez P, De-Paz JG, Rodriguez JG. A generalized solvent basicity scale: The solvatochromism of 5-nitroindoline and its homomorph 1-methyl-5-nitroindoline. Liebigs Ann. 1996;11:1785–1794. doi: 10.1002/jlac.199619961112. [DOI] [Google Scholar]
- 41.Alimmari A, Bozic B, Mijin D, Marinkovic A, Valentic N, Uscumlic G. Synthesis, structure and solvatochromic properties of some novel 5-arylazo-6-hydroxy-4- (4-methoxyphenyl)-3-cyano-2-pyridone dyes: hydrazone-azo tautomeric analysis. Arab J Chem. 2015;8:269–278. doi: 10.1016/j.arabjc.2013.10.001. [DOI] [Google Scholar]
- 42.Sarmah K, Pratihar S. Synthesis, characterization, and photocatalytic application of iron oxalate capped Fe, Fe-Cu, Fe-Co, and Fe-Mn oxide nanomaterial. ACS Sustainable Chem Eng. 2016;5:310–324. doi: 10.1021/acssuschemeng.6b01673. [DOI] [Google Scholar]
- 43.Ali SA, Yaagoob IY, Mazumder MAJ, Al-Muallem HA. Fast removal of methylene blue and Hg(II) from aqueous solution using a novel super-adsorbent containing residues of glycine and maleic acid. J Hazard Mater. 2019;369:642–654. doi: 10.1016/j.jhazmat.2019.02.082. [DOI] [PubMed] [Google Scholar]
- 44.Reeves RL. The protonation and indicators behavior of some ionic azobenzene in aqueous sulfuric acid. J Am Chem Soc. 1966;88:2240–2247. doi: 10.1021/ja00962a029. [DOI] [Google Scholar]
- 45.He X, Male KB, Nesterenko PN, Brabazon D, Pull B, Luong JHT. Adsorption and desorption of methylene blue on porous carbon monoliths and nanocrystalline cellulose. ACS Appl Mater Interfaces. 2013;5:8796–8804. doi: 10.1021/am403222u. [DOI] [PubMed] [Google Scholar]
- 46.Sabnis RW (2010) Handbook of biological dyes and stains: synthesis and industrial applications. NJ: John Wiley and Sons, 293
- 47.Masoud MS, Shaker MA, Ali AE, Elasal GS. Solvatochromaticity and pH dependence of the electronic absorption spectra of some purines and pyrimidines and their metal complexes. Spectrochim Acta A. 2011;79:538–547. doi: 10.1016/j.saa.2011.03.029. [DOI] [PubMed] [Google Scholar]
- 48.Snehalatha T, Rajanna C, Saiprakash PK. Methylene blue-ascorbic acid: an undergraduate experiment in kinetics. J Chem Educ. 1997;74:228. doi: 10.1021/ed074p228. [DOI] [Google Scholar]
- 49.Bolliger J, Tran HN, Lima EC (2022) Comments on removal of methylene blue dye from aqueous solution using citric acid modified apricot stone. Chem Eng Commun, Taylor and Francis, 1–6
- 50.Ebead YH, Salman HMA, Khodari M, Ahmed AA. Spectrophotometric investigations of the role of the organic solvent on the acid dissociation constants of some azo dyes derived from 2-aminobenzothiazole. J Mol Liq. 2010;154:52–57. doi: 10.1016/j.molliq.2010.04.002. [DOI] [Google Scholar]
Associated Data
This section collects any data citations, data availability statements, or supplementary materials included in this article.
Supplementary Materials
Data Availability Statement
All the data appear in the research as well as material.


