Abstract
Rheumatoid arthritis (RA) is a highly heritable complex disease with unknown etiology. Multi-ancestry genetic research of RA promises to improve power to detect genetic signals, fine-mapping resolution and performances of polygenic risk scores (PRS). Here, we present a large-scale genome-wide association study (GWAS) of RA, which includes 276,020 samples from five ancestral groups. We conducted a multi-ancestry meta-analysis and identified 124 loci (P < 5 × 10⁻⁸), of which 34 are novel. Candidate genes at the novel loci suggest essential roles of the immune system (for example, TNIP2 and TNFRSF11A) and joint tissues (for example, WISP1) in RA etiology. Multi-ancestry fine-mapping identified putatively causal variants with biological insights (for example, LEF1). Moreover, PRS based on multi-ancestry GWAS outperformed PRS based on single-ancestry GWAS and had comparable performance between populations of European and East Asian ancestries. Our study provides several insights into the etiology of RA and improves the genetic predictability of RA.
RA is an autoimmune disease in which the immune system attacks the synovium in the joints, leading to chronic tissue inflammation, joint destruction and disability. Although recent therapeutic developments now alter the course of disease, RA mechanisms have yet to be fully elucidated and a cure has yet to be identified. RA can be divided into two major subtypes (seropositive and seronegative RA) based on the presence or absence of RA-specific serum antibodies (rheumatoid factor or anti-citrullinated peptide antibodies)1. As RA is highly heritable2-4, genetic research has the potential to advance our understanding of its pathology. Indeed, previous studies successfully identified candidate causal alleles, genes, pathways and cell types2,5-7.
Multi-ancestry genetic research has several advantages over single-ancestry analysis. First, GWAS in a single ancestry can be underpowered to detect signals from a causal allele with low allele frequency in that ancestry. As notable examples, the causal alleles can be ancestry specific, as shown in studies for other complex diseases8-10. Second, single-ancestry GWAS are hampered by the specific linkage disequilibrium (LD) structure in that ancestry, which could obscure the ability to effectively fine-map an associated locus11,12. Multi-ancestry GWAS can improve fine-mapping resolution by leveraging the distinct LD structures in each ancestry12-14. Third, PRS generally has limited transferability across ancestries. For example, when the PRS model is developed based on GWAS in populations of European ancestry (EUR), PRS performs poorly in non-EUR populations15. PRS based on multi-ancestry GWAS can potentially improve its performance in several ancestries16,17; this is a clinically important topic, as PRS can benefit patients via precision medicine. Although many RA genetic studies were conducted in non-EUR populations2,3,14,18-21, they were relatively small in sample sizes, and much larger research efforts have focused on EUR populations6,22-29.
Here, we report a large-scale multi-ancestry GWAS of RA, including individuals of EUR, East Asian (EAS), African (AFR), South Asian (SAS) and Arab (ARB) ancestries. Although seropositive and seronegative RA are associated with phenotypic differences, they have shared heritability30, and their risk alleles appear to be similar outside of the major histocompatibility complex (MHC) locus31. Therefore, we initially focused on all RA, and then we restricted cases to seropositive patients. After identifying novel loci, we conducted fine-mapping to elucidate the potential molecular mechanism of risk alleles. We examined the extent to which genetic signals are shared across ancestries while also investigating ancestry-specific genetic signals. We developed PRS models using our GWAS results and compared their performances across all ancestries. Our study provides several insights into the etiology of RA and highlights the importance and further need of including participants of underrepresented ancestral backgrounds in GWAS.
Results
Multi-ancestry and single-ancestry GWAS
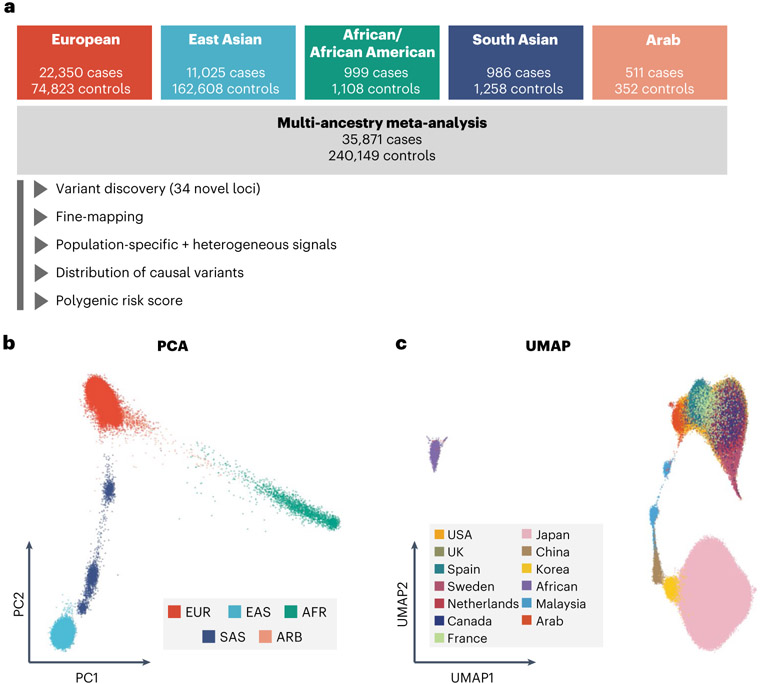
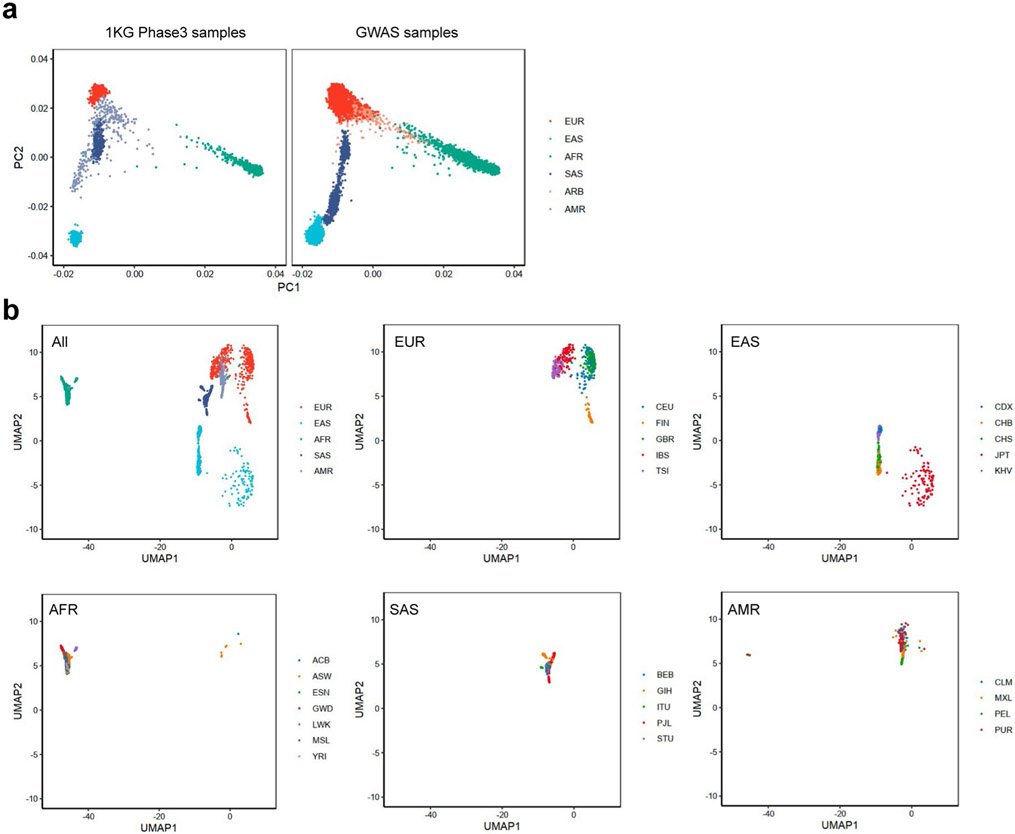
We included 37 cohorts comprising 35,871 patients with RA and 240,149 control individuals of EUR, EAS, AFR, SAS and ARB ancestries (Fig. 1a and Supplementary Tables 1 and 2); there were 22,350 cases of RA in 25 EUR cohorts, 11,025 cases in eight EAS cohorts, 999 cases in two AFR cohorts, 986 cases in one SAS cohort and 511 cases in one ARB cohort. RA-specific serum antibodies were measured in 31,963 (89%) cases; among them, 27,448 (86%) were seropositive and 4,515 (14%) were seronegative (Methods and Supplementary Table 1). To confirm the diversity of ancestral backgrounds, we projected each individual’s genotype into principal component (PC) and uniform manifold approximation and projection (UMAP) spaces and confirmed that our study included ancestral diversity (Fig. 1b,c and Extended Data Fig. 1).
Fig. 1 ∣. Diverse ancestral backgrounds of GWAS participants.
a, GWAS study design. The total numbers of cases and controls are provided. b, PCA plot of all GWAS samples. We projected each individual’s imputed genotype into a PC space, which was calculated using all individuals in 1KG Phase 3. The color of each sample corresponds to its ancestry group. c, UMAP plots of all GWAS samples. We conducted UMAP analysis using the top 20 PC scores. The color of the samples in a cohort corresponds to the country or region-level group of that cohort (Supplementary Table 1). When a cohort recruited participants from several countries, we did not plot its samples.
After quality control and imputation, we conducted GWAS in each cohort by logistic regression (Methods). We calculated genomic inflation using all variants outside of the MHC locus and observed little evidence of statistical inflation (mean of λ = 1.01; s.d. = 0.04; Supplementary Table 1). We then conducted a meta-analysis using all cohorts across five ancestries by the inverse-variance weighted fixed effect model (multi-ancestry GWAS; Supplementary Figs. 1 and 2, Supplementary Table 3 and Supplementary Note). For ancestries with multiple cohorts (EUR, EAS and AFR), we also conducted a meta-analysis within each ancestry using the same strategy (EUR-GWAS, EAS-GWAS and AFR-GWAS). We additionally conducted a meta-analysis restricting cases to seropositive RA. In total, we detected significant signals at 122 autosomal loci outside of the MHC locus and two loci on the X chromosome (P < 5 × 10⁻⁸; Manhattan and Q–Q plots in Supplementary Fig. 3; Supplementary Tables 4 and 5; regional association plots in Supplementary Data). Among these 124 loci, 34 autosomal loci are novel (Table 1).
Table 1 ∣.
Novel RA risk loci detected in this study
| Allele freq. in 1KG Phase 3 | ||||||||||||
|---|---|---|---|---|---|---|---|---|---|---|---|---|
| rs ID | Chr. | Position | Nearest gene | Predicted causal gene | OR | L95 | U95 | P value | EAS | EUR | AFR | SAS |
| rs41269479 | 1 | 42,166,782 | HIVEP3 | NA | 1.15 | 1.09 | 1.20 | 2.51 × 10⁻⁸ | 0.26 | 0.28 | 0.08 | 0.42 |
| rs41313373 | 1 | 92,940,411 | GFI1 | GFI1 (eQTL) | 1.12 | 1.08 | 1.16 | 1.08 × 10⁻⁸ | 0.01 | 0.14 | 0.01 | 0.10 |
| rs1188620266 | 1 | 235,800,357 | GNG4 | NA | 0.91 | 0.88 | 0.94 | 2.06 × 10⁻⁸ | 0.83 | 0.61 | 0.22 | 0.70 |
| rs143259280 | 2 | 70,209,168 | PCBP1-AS1 | C2orf42 (eQTL) | 1.09 | 1.06 | 1.12 | 2.13 × 10⁻⁸ | 0.46 | 0.32 | 0.89 | 0.32 |
| rs77574423 | 3 | 11,984,744 | TAMM41, SYN2 | SYN2 (eQTL) | 1.10 | 1.07 | 1.14 | 1.35 × 10⁻⁸ | 0.56 | 0.72 | 0.57 | 0.74 |
| rs62264113 | 3 | 127,292,333 | TPRA1 | NA | 0.92 | 0.89 | 0.95 | 4.66 × 10⁻⁸ | 0.27 | 0.08 | 0.01 | 0.21 |
| rs4687070 | 3 | 189,306,650 | TPRG1, TP63 | NA | 1.15 | 1.09 | 1.20 | 6.07 × 10⁻⁹ | 0.02 | 0.07 | 0.03 | 0.14 |
| rs4690029 | 4 | 2,722,815 | FAM193A | TNIP2 (p.A313V) | 0.94 | 0.92 | 0.96 | 2.83 × 10⁻⁹ | 0.40 | 0.41 | 0.59 | 0.47 |
| rs138066321 | 4 | 80,952,409 | ANTXR2 | ANTXR2 (eQTL) | 0.93 | 0.91 | 0.95 | 4.48 × 10⁻¹⁰ | 0.38 | 0.45 | 0.09 | 0.32 |
| rs58107865 | 4 | 109,061,618 | LEF1 | NA | 0.84 | 0.80 | 0.88 | 4.92 × 10⁻¹⁴ | 0.21 | 0.01 | 0.00 | 0.03 |
| rs56787183 | 5 | 40,499,290 | LINC00603, PTGER4 | NA | 0.85 | 0.80 | 0.90 | 2.15 × 10⁻⁹ | 0.09 | 0.00 | 0.04 | 0.02 |
| rs244468 | 5 | 142,604,421 | ARHGAP26 | NA | 1.07 | 1.05 | 1.10 | 8.19 × 10⁻⁹ | 0.79 | 0.51 | 0.41 | 0.60 |
| rs1422673 | 5 | 150,438,988 | TNIP1 | NA | 1.10 | 1.06 | 1.14 | 1.56 × 10⁻⁸ | 0.50 | 0.19 | 0.39 | 0.29 |
| rs113532504 | 6 | 15,195,682 | LINC01108, JARID2 | JARID2 (eQTL) | 1.10 | 1.07 | 1.14 | 3.42 × 10⁻⁸ | 0.06 | 0.10 | 0.36 | 0.10 |
| rs67318457 | 6 | 23,925,021 | LOC105374972, NRSN1 | NA | 1.08 | 1.05 | 1.11 | 1.10 × 10⁻⁸ | 0.14 | 0.27 | 0.37 | 0.05 |
| rs940825 | 7 | 17,207,164 | AGR3, AHR | NA | 1.11 | 1.07 | 1.16 | 3.39 × 10⁻⁸ | 0.18 | 0.12 | 0.05 | 0.06 |
| rs182199544 | 7 | 27,084,581 | SKAP2, HOXA1 | HOXA5 (eQTL) | 0.87 | 0.84 | 0.91 | 3.61 × 10⁻⁹ | 0.01 | 0.08 | 0.36 | 0.03 |
| rs6583441 | 7 | 50,361,874 | IKZF1 | NA | 0.95 | 0.93 | 0.97 | 4.69 × 10⁻⁸ | 0.53 | 0.47 | 0.33 | 0.41 |
| rs6979218 | 7 | 99,893,148 | CASTOR3, SPDYE3 | PILRA (p.R78G) PVRIG (p.N81D) | 1.09 | 1.06 | 1.12 | 2.24 × 10⁻¹¹ | 0.38 | 0.75 | 0.91 | 0.72 |
| rs11777380 | 8 | 134,211,965 | WISP1 | NA | 0.92 | 0.90 | 0.95 | 3.00 × 10⁻¹⁰ | 0.17 | 0.32 | 0.08 | 0.19 |
| rs911760 | 9 | 5,438,435 | PLGRKT | NA | 1.15 | 1.09 | 1.20 | 2.15 × 10⁻⁸ | 0.23 | 0.19 | 0.33 | 0.28 |
| rs734094 | 11 | 2,323,220 | C11orf21, TSPAN32 | NA | 1.08 | 1.05 | 1.10 | 3.40 × 10⁻⁸ | 0.19 | 0.40 | 0.43 | 0.45 |
| rs1427749 | 12 | 46,370,116 | SCAF11 | ARID2 (eQTL) | 0.93 | 0.90 | 0.95 | 1.17 × 10⁻⁸ | 0.89 | 0.80 | 0.91 | 0.95 |
| rs61944750 | 13 | 28,634,933 | FLT3 | NA | 0.91 | 0.88 | 0.94 | 1.69 × 10⁻⁸ | 0.05 | 0.21 | 0.09 | 0.09 |
| rs2147161 | 13 | 42,982,302 | AKAP11, LINC02341 | NA | 1.10 | 1.06 | 1.13 | 2.73 × 10⁻⁸ | 0.13 | 0.21 | 0.02 | 0.28 |
| rs175714 | 14 | 75,981,856 | JDP2, BATF | NA | 0.94 | 0.92 | 0.96 | 4.14 × 10⁻⁸ | 0.43 | 0.60 | 0.30 | 0.64 |
| rs115284761 | 15 | 77,326,836 | PSTPIP1 | NA | 0.91 | 0.89 | 0.94 | 1.71 × 10⁻¹¹ | 0.28 | 0.25 | 0.15 | 0.23 |
| rs11375064 | 17 | 25,904,074 | KSR1 | KSR1 (eQTL) | 1.08 | 1.05 | 1.11 | 3.92 × 10⁻⁸ | 0.44 | 0.60 | 0.53 | 0.47 |
| rs591549 | 18 | 3,542,247 | DLGAP1 | NA | 0.91 | 0.88 | 0.94 | 9.14 × 10⁻⁹ | 0.35 | 0.68 | 0.42 | 0.61 |
| rs371734407 | 18 | 60,009,634 | TNFRSF11A | NA | 1.10 | 1.06 | 1.14 | 4.14 × 10⁻⁸ | 0.44 | 0.59 | 0.50 | 0.52 |
| rs10415976 | 19 | 941,603 | ARID3A | NA | 0.92 | 0.90 | 0.95 | 2.90 × 10⁻⁸ | 0.47 | 0.08 | 0.35 | 0.25 |
| rs55762233 | 19 | 19,367,319 | HAPLN4 | CILP2 (eQTL), HAPLN4 (eQTL), SUGP1 (eQTL), TM6SF2 (eQTL), TSSK6 (eQTL), YJEFN3 (eQTL) | 1.10 | 1.07 | 1.14 | 1.43 × 10⁻⁹ | 0.02 | 0.17 | 0.32 | 0.14 |
| rs28373672 | 19 | 36,213,072 | KMT2B | IGFLR1 (eQTL), LIN37 (eQTL) | 0.93 | 0.91 | 0.96 | 3.33 × 10⁻⁸ | 0.24 | 0.23 | 0.62 | 0.29 |
| rs8106598 | 19 | 52,017,940 | SIGLEC12, SIGLEC6 | NA | 1.08 | 1.05 | 1.11 | 3.12 × 10⁻⁸ | 0.08 | 0.22 | 0.32 | 0.17 |
Statistics in the GWAS setting with the lowest P values are provided (see Supplementary Table 4 for details). GWAS statistics were calculated by a fixed effect meta-analysis of results from logistic regression tests in each cohort. The genomic coordinate is according to GRCh37. rs ID, reference single nucleotide polymorphism cluster identification number; Chr., chromosome; Predicted causal gene, predicted molecular consequences using eQTLs or non-synonymous variants (see Supplementary Tables 8-10 for details); NA, not applicable; OR, odds ratio (the effect allele is the alternative allele); L95, lower 95% confidence interval; U95, upper 95% confidence interval; Allele freq., allele frequency of the effect allele.
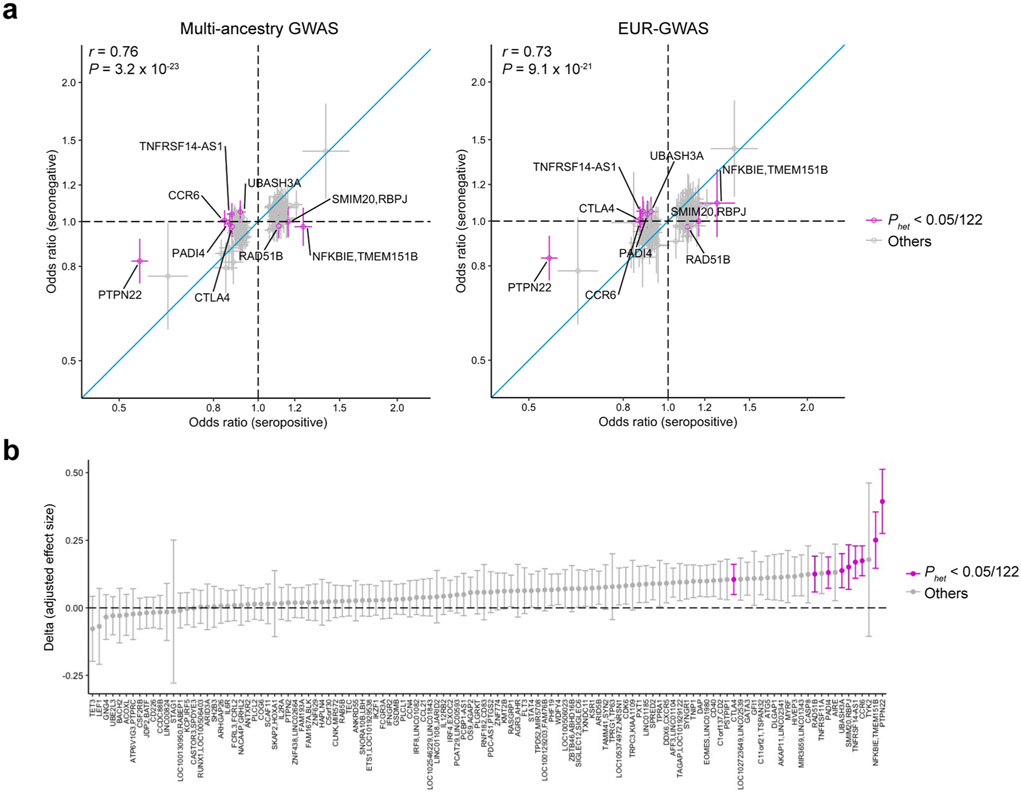
We tested the differences in genetic signals between GWAS of seropositive and seronegative RA at the 122 significant autosomal loci. Although their effect sizes were significantly correlated in general (Pearson’s r = 0.76; P = 3.2 × 10⁻²³), the effect sizes of seronegative RA were generally smaller than those of seropositive RA (one-sided sign test P value = 8.3 × 10⁻¹⁷; Extended Data Fig. 2 and Supplementary Note).
To quantify the heritability, we analyzed our GWAS results using stratified-linkage disequilibrium score regression (S-LDSC)32 (Supplementary Table 2). Since S-LDSC assumes that GWAS has samples from a single ancestral background and a sufficient sample size, we restricted this analysis to EUR-GWAS and EAS-GWAS. The heritability explained by non-MHC common variants was similar between EUR and EAS; the liability-scale heritability was 0.14 (s.e. = 0.01) for EUR and 0.13 (s.e. = 0.01) for EAS. LDSC also confirmed that the amount of potential bias in the GWAS results was minimal; LDSC’s intercept was 1.03 for EUR and 1.02 for EAS (Supplementary Table 2).
Fine-mapping analysis
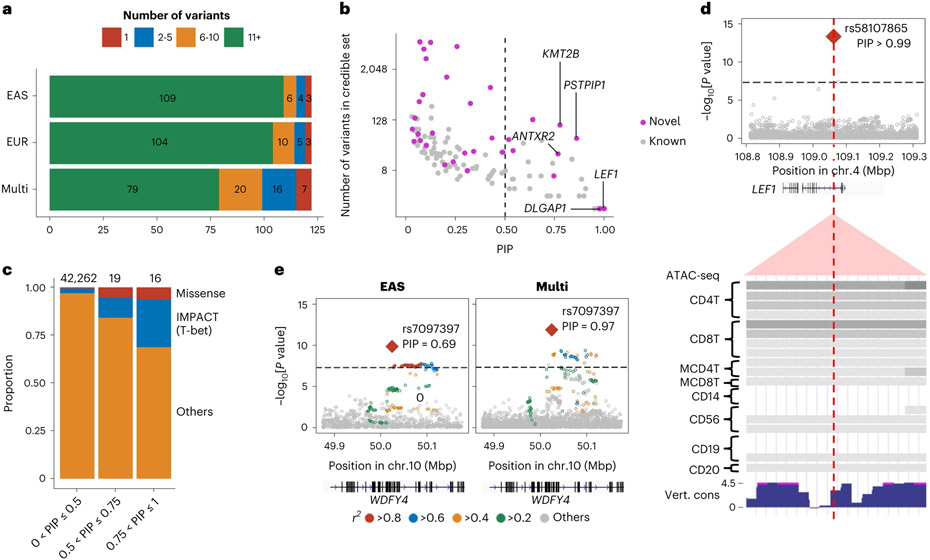
We fine-mapped these 122 autosomal loci using approximate Bayesian factor33 (Methods). The 95% credible sets included only one variant at seven loci and less than ten variants at 43 loci (Fig. 2a and Supplementary Table 6). We identified 35 fine-mapped variants with posterior inclusion probability (PIP) greater than 0.5, which agree with and largely subsume prior fine-mapping results6,14,34; in addition, nine novel loci are represented (Fig. 2b, Supplementary Fig. 4 and Supplementary Table 6). The proportion of non-synonymous variants was higher in the credible set variants with high PIP (PIP > 0.5) than those with low PIP (odds ratio (OR) = 9.3; one-sided Fisher exact test P = 0.02; Fig. 2c).
Fig. 2 ∣. Fine-mapping analysis identified candidate causal variants.
a, Among 122 autosomal loci analyzed, we counted the number of loci that had a 95% credible set size in a specified range. The results from EAS-GWAS, EUR-GWAS and multi-ancestry GWAS are provided. b, The PIP of the lead variant and the size of the 95% credible set at the 122 autosomal loci analyzed. The names of novel loci with a PIP greater than 0.75 are labeled. We used multi-ancestry GWAS results. c, In each range of PIP (the total numbers of variants are provided on top), we calculated the proportion of non-synonymous variants or variants with high IMPACT score (CD4+ T cell T-bet annotation > 0.5). d, A fine-mapped variant at the LEF1 locus within CD4+ T cell-specific open chromatin regions. P values of multi-ancestry GWAS are provided with a dense view of immune cell ATAC-seq data (density indicates the read coverage) and vertebrate conservation data from the UCSC Genome Browser (http://genome.ucsc.edu). e, P values in the WDFY4 locus in EAS-GWAS and multi-ancestry GWAS. r2 values between each variant and the lead variant (rs7097397) are shown using different colors. For multi-ancestry GWAS, we used intersection of LD variants in EUR and EAS ancestries. P values in the GWAS results (d and e) were calculated by a fixed effect meta-analysis of statistics from logistic regression tests in each cohort.
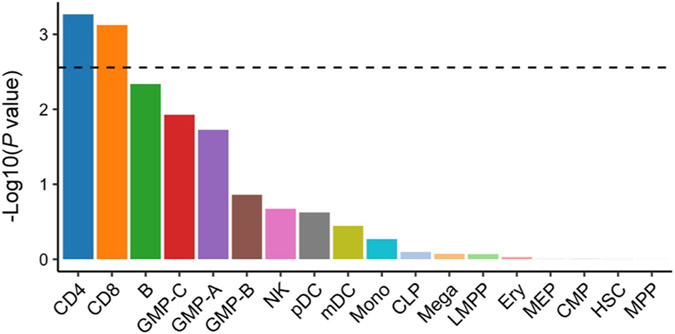
We quantified the 95% credible set variants within open chromatin regions in 18 hematopoietic populations using gchromVAR software35. Consistent with previous analyses, we observed the strongest enrichment in CD4+ T cells (P = 5.4 × 10⁻⁴; Extended Data Fig. 3). For example, rs58107865 at the LEF1 locus (PIP > 0.99), rs7731626 at the ANKRD55 locus (PIP > 0.99) and rs10556591 at the ETS1 locus (PIP = 0.84) are located within CD4+ T cell-specific open chromatin regions (Z score > 2; Methods and Supplementary Table 6). Among them, rs58107865 is a novel risk variant and suggested the importance of regulatory T (Treg) cells in RA biology (Fig. 2d); LEF1 synergizes with FOXP3 to reinforce the gene networks essential for Treg cells36. These results recapitulated a critical role of CD4+ T cells, especially Treg cells, in RA biology.
As expected, compared with single-ancestry GWAS, multi-ancestry GWAS produced smaller-sized credible sets and higher PIP (one-sided paired Wilcoxon test P < 3.1 × 10⁻¹¹ and P < 1.1 × 10⁻⁹, respectively) (Fig. 2a and Supplementary Fig. 4). For example, the WDFY4 locus included 6,391 variants in the EUR 95% credible set, 64 variants in the EAS set, but only one variant in the multi-ancestry set, a missense variant of WDFY4 (rs7097397, R1816Q; Fig. 2e). Using a downsampling experiment, we confirmed that this benefit was due to diversified LD structures and allele frequency spectrum, as well as the increased sample size (Supplementary Fig. 4 and Supplementary Note).
Conditional analysis
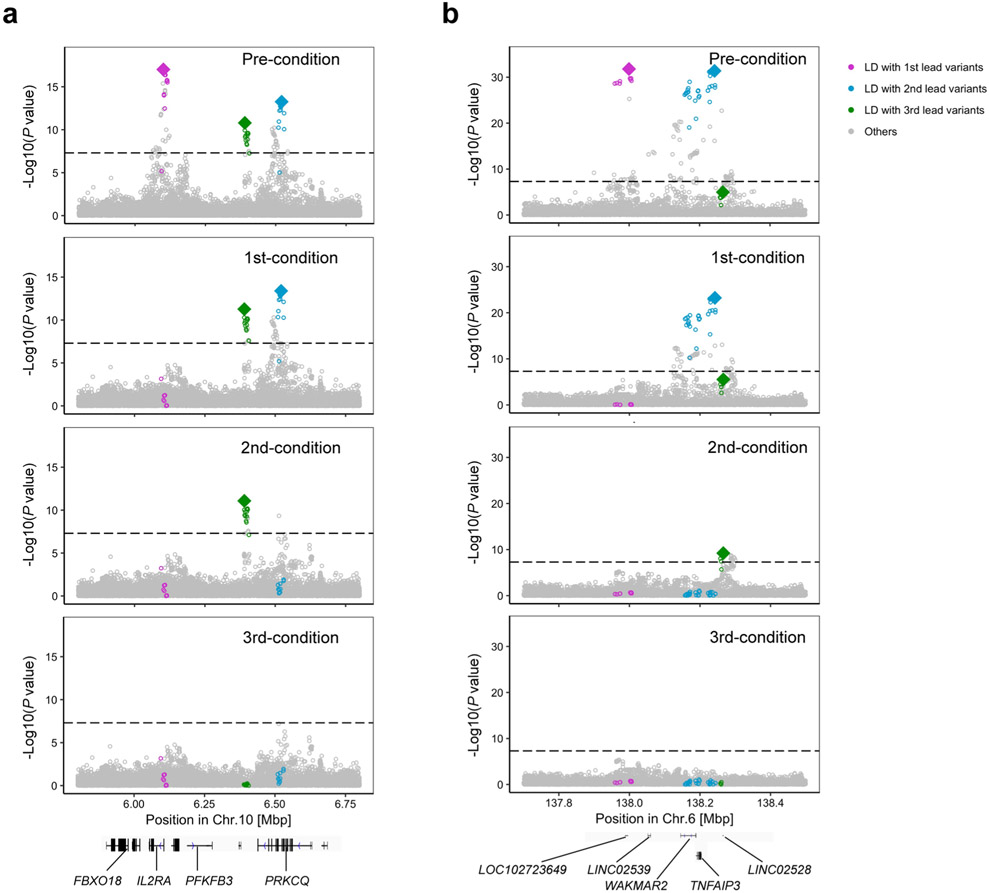
We conducted conditional analyses in each cohort to explore associations independent from the lead variants and meta-analyzed the results using the same strategy. We detected 24 independent signals at 21 loci (P < 5.0 × 10⁻⁸; Supplementary Table 7). Consistent with previous results6,28, we observed the largest number of independent associations at the IL2RA, TYK2 and TNFAIP3 loci, where we observed three independent alleles (Extended Data Fig. 4).
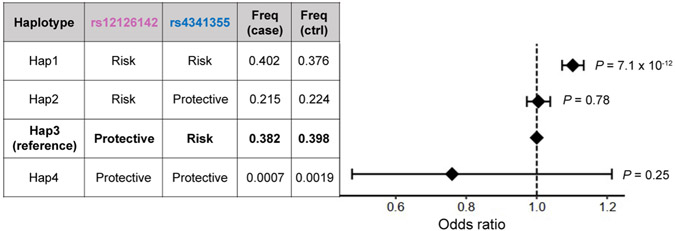
At the IL6R locus, the conditional analysis identified two variants, rs12126142 (the first lead variant) and rs4341355 (the second lead variant), that were weakly correlated with each other but independently associated with RA (r2 = 0.23 and 0.15 in EUR and EAS, respectively, of the 1000 Genomes Project Phase 3 (1KG Phase 3); Supplementary Table 7). Interestingly, their protective alleles (rs12126142-A and rs4341355-C) almost always create a haplotype with the risk allele of the other variant (Extended Data Fig. 5). Hence, the conditional analysis disentangled the independent yet mutually attenuating signals (Fig. 3a). By analyzing expression quantitative trait loci (eQTLs) and splicing quantitative trait loci (sQTLs) in three immune cell types from the Blueprint consortium (CD4+ T cells, monocytes and neutrophils)37, we found that rs12126142 and rs4341355 are likely to affect IL6R transcripts via different mechanisms. GWAS signals conditioned on rs4341355 colocalized with sQTL signals in monocytes (posterior probability of colocalization estimated by coloc software38 (PPcoloc) > 0.99; Fig. 3b); this sQTL signal corresponds to a previously reported splicing isoform of soluble IL6R39. On the other hand, GWAS signals conditioned on rs12126142 colocalized with eQTL signals in CD4+ T cells (PPcoloc = 0.97; Fig. 3b). Therefore, our results suggested that both splicing and total expression of IL6R independently influence RA genetic risk.
Fig. 3 ∣. Splicing and total expression of IL6R jointly contribute to RA risk.
a, The first lead variant (rs12126142; magenta) and the second lead variant (rs4341355; blue) mutually attenuate each other’s signals (controlling the effect of the other increased their signals). Conditional analysis was conducted in each cohort, and the results were meta-analyzed using the inverse-variance weighted fixed effect model. We used multi-ancestry GWAS results. b, P values of sQTL signals for IL6R (phenotype ID: ENSG00000160712.8.17_154422457 in the Blueprint dataset) and eQTL signals for IL6R (total expression of IL6R). Linear regression tests were used to calculate P values. Variants in LD with the lead variant are highlighted in magenta or blue (r2 > 0.6 in both EUR and EAS ancestries). These statistics are also provided in Supplementary Table 9.
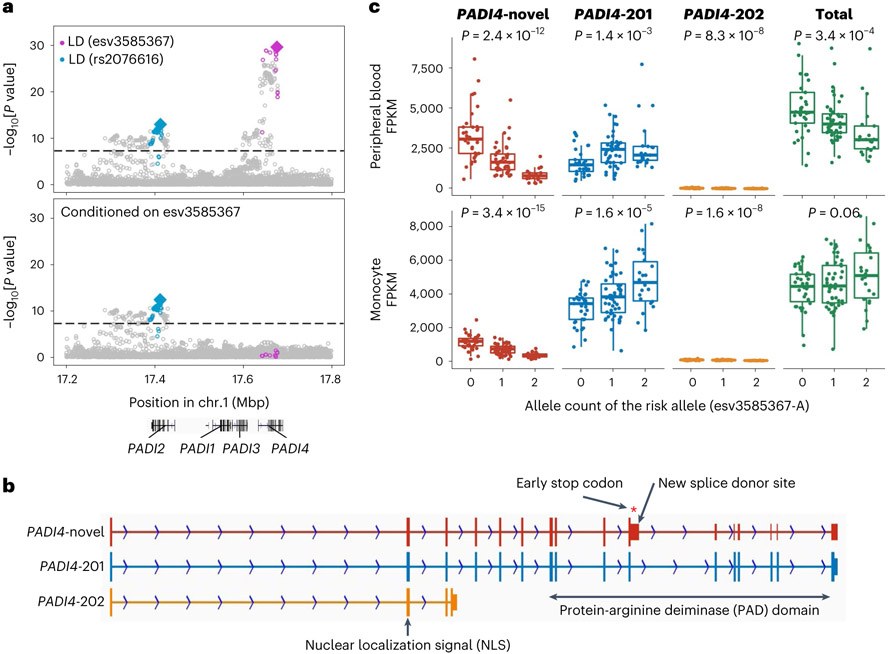
Our conditional analyses also suggested interesting biology at the PADI4-PADI2 locus. We found two independent associations at this locus: esv3585367 (the first lead variant at a PADI4 intron) and rs2076616 (the second lead variant at a PADI2 intron), consistent with previous studies14,40 (Fig. 4a and Supplementary Table 7). In sQTL results from the Blueprint consortium37, both PADI4 and PADI2 sQTL signals in neutrophils were colocalized with corresponding GWAS associations (PPcoloc = 0.98 and 0.79, respectively), suggesting that alternative splicing of PADI4 and PADI2 likely increases RA risk.
Fig. 4 ∣. Splicing of PADI4 contributes to RA risk.
a, Conditional analyses identified two independent associations at the PADI4 locus: esv3585367 (magenta) and rs2076616 (blue). We used multi-ancestry GWAS results. Variants in LD with the lead variant are highlighted in magenta or blue (r2 > 0.6 in both EUR and EAS ancestries). These statistics are also provided in Supplementary Table 9. b, A novel PADI4 splice isoform confirmed by long-read sequencing datasets. PADI4-novel, a novel isoform that we identified; PADI4-201, a functional isoform. PADI4-novel has an elongation of exon 10 that leads to an early stop codon and a truncated PAD domain at the carboxy terminus. The PAD domain is an essential catalytic domain44, and highly conserved across other PADI genes. c, The total expression and the expression of three isoforms of PADI4 were plotted with the imputed dosages of the risk allele (esv3585367-A). The isoform structures are shown in b. We analyzed RNA-seq data from 105 healthyJapanese individuals reported in a previous study5. We used peripheral blood leukocytes (neutrophils are its main component) and monocytes; both have high PADI4 expression levels. P values from linear regression are provided. Within each boxplot, the horizontal lines denote the median, the top and bottom of each box denote the interquartile range (IQR), and the whiskers denote the maximum and minimum values within each grouping no further than 1.5 × IQR from the hinge.
PADI4 is critical for RA because it encodes an enzyme that citrullinates proteins, the main target for autoantibodies in RA20,41-43. However, unlike IL6R with two functionally distinct isoforms39, the full picture of PADI4 splicing isoforms has not been extensively studied. To elucidate detailed molecular biology at the PADI4 locus, we generated long-read sequencing datasets and inspected full-length PADI4 transcripts. We identified a novel and probably non-functional splice isoform that produces a truncated protein-arginine deiminase (PAD) domain, an essential catalytic domain with two calcium-binding sites44 (Fig. 4b). Next, we differentially quantified PADI4 isoforms using RNA sequencing (RNA-seq) data from 105 Japanese donors5. We found that the risk allele (esv3585367-A) was associated with a decrease of the non-functional novel isoform and an increase of the functionally intact isoform (Fig. 4c). Notably, the allelic effect on total expression, which had been conventionally used for eQTL studies, was not predictive of that on the functional isoform (right panel in Fig. 4c). Together, our analysis provides a novel genetic mechanism of PADI4 and highlights the importance of thoroughly investigating splice isoforms at risk loci using long-read sequencing.
Candidate causal genes at the associated loci
Next, we inferred the possible molecular consequences of all 148 detected variants: 124 lead variants (including two variants on the X chromosome) and 24 secondary variants detected by the conditional analysis.
First, we focused on coding variants in LD with the lead variants in this GWAS (r2 > 0.6 in both EUR and EAS samples in 1KG Phase 3; Methods). We found missense variants that may drive genetic signals at two novel loci (Table 1 and Supplementary Table 8). An example is rs2269495 (A313V of TNIP2), in LD with a lead variant rs4690029 (r2 = 0.65 and 0.89 in EUR and EAS, respectively, of 1KG Phase 3). rs2269495 is predicted to have a damaging effect on TNIP2 protein function (SIFT score = 0.02; Supplementary Table 8). The protein product of TNIP2 interacts with A20 (encoded by TNFAIP3) and inhibits nuclear factor κB (NF-κB) activation induced by TNF. Mice with a defective mutant TNIP2 displayed intestinal inflammation and hypersensitivity to experimental colitis45. In addition, TNIP1, a homolog of TNIP2, was identified as one of the novel loci in this GWAS (Supplementary Table 4). Together, these results suggested that TNIP1 and TNIP2 are novel candidate causal genes of RA. Combined with the well-established TNFAIP3 locus46 (Supplementary Table 4), these findings further supported the importance of the TNFAIP3 axis in RA biology.
Next, we inferred possible molecular consequences using QTLs. We analyzed eQTLs and sQTLs in three immune cell types from the Blueprint consortium (CD4+ T cells, monocytes and neutrophils) and multiple tissues from the GTEx consortium37,47. We found colocalizing QTL signals at ten novel loci (PPcoloc > 0.7 and PHEIDI > 0.001 estimated by SMR software48; Table 1 and Supplementary Tables 9 and 10). Several novel loci with colocalizing QTL signals suggested the biology of non-immune systems, including joint tissues. For example, the risk allele of rs55762233 was associated with increased expression of CILP2 (PPcoloc = 0.86; PHEIDI = 0.39), which encodes a component of the cartilage extracellular matrix. Its homolog, CILP1, was recently reported as one of the candidate autoantigens of RA49. Therefore, the protein product of CILP2 might also have a critical role in RA biology.
We then searched for other biologically plausible genes that might explain novel signals and found several genes whose importance was supported by previous knowledge (Table 1 and Supplementary Table 4). First, TNFRSF11A encodes RANK, a key osteoclast regulator. Its ligand RANKL has been investigated as a potential therapeutic target50,51. TNFRSF11A is a causal gene for several bone-related Mendelian disorders52,53. Second, WISP1 encodes a protein essential for osteoblast differentiation and bone formation54,55. In addition, WISP1 is highly expressed in HLA-DRAhi inflammatory sublining fibroblasts, which are dramatically expanded and pathogenic in RA synovium56. Third, FLT3 encodes a tyrosine kinase that regulates hematopoiesis and knocking out of whose ligand suppressed arthritis in model mice57. A damaging variant of FLT3 was suggested to be associated with RA (P = 4.3 × 10⁻⁴) and other autoimmune diseases58.
Differences and similarities of genetic risk across ancestries
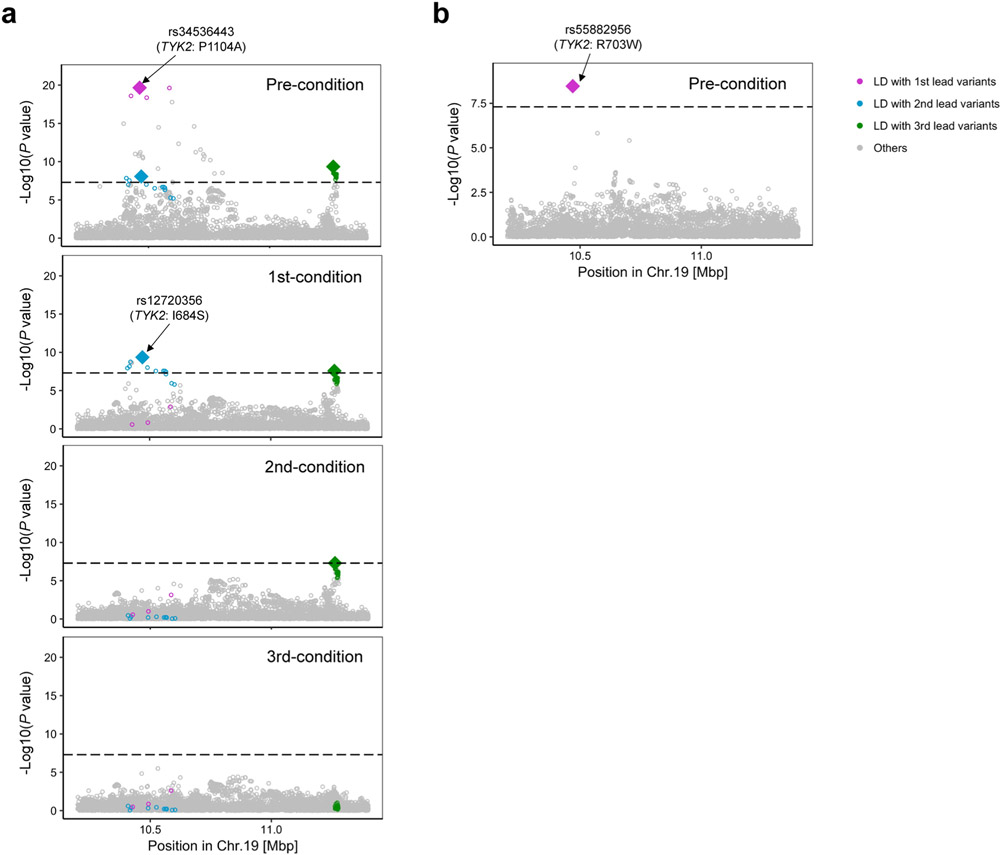
Next, we searched for ancestry-specific signals at 122 autosomal loci. We defined ancestry specificity when the lead variant in each locus was monomorphic in EUR or EAS samples of 1KG Phase 3. We found five EUR-specific signals: rs2476601 (a PTPN22 missense variant), rs9826420 (located in the STAG1 intronic region), rs7943728 (a FADS2 eQTL), and rs34536443 and rs12720356 (both TYK2 missense variants). EAS-GWAS also identified an EAS-specific signal at the TYK2 locus: rs55882956, another TYK2 missense variant. We therefore detected two EUR-specific signals and one EAS-specific signal at the TYK2 locus (Extended Data Fig. 6). All of these ancestry-specific signals were also reported by previous studies2,22,59. This study was underpowered to detect specific signals in non-EUR and non-EAS ancestries (Supplementary Fig. 5 and Supplementary Note). Although ancestry-specific signals are relatively few, they include predominantly large effect size variants, many of which are missense; hence, they are valuable resources to understand the etiology of RA.
Although we found these ancestry-specific signals, this study showed that genetic signals are generally shared across ancestries. We compared effect sizes between EUR-GWAS and non-EUR-GWAS at the 30 fine-mapped variants (PIP > 0.5; Methods). We found that the effect sizes were strongly correlated among five ancestries (Pearson’s r = 0.56–0.91; Supplementary Figs. 6-9 and Supplementary Note). In addition, we targeted genome-wide variants and tested the trans-ancestry genetic correlation between EUR-GWAS and EAS-GWAS using Popcorn software60. We again found a strong correlation (0.64 (s.e. = 0.08), P = 4.4 × 10⁻¹⁷; reported P value is for a test that the correlation is different from 0).
Genome-wide distributions of heritability
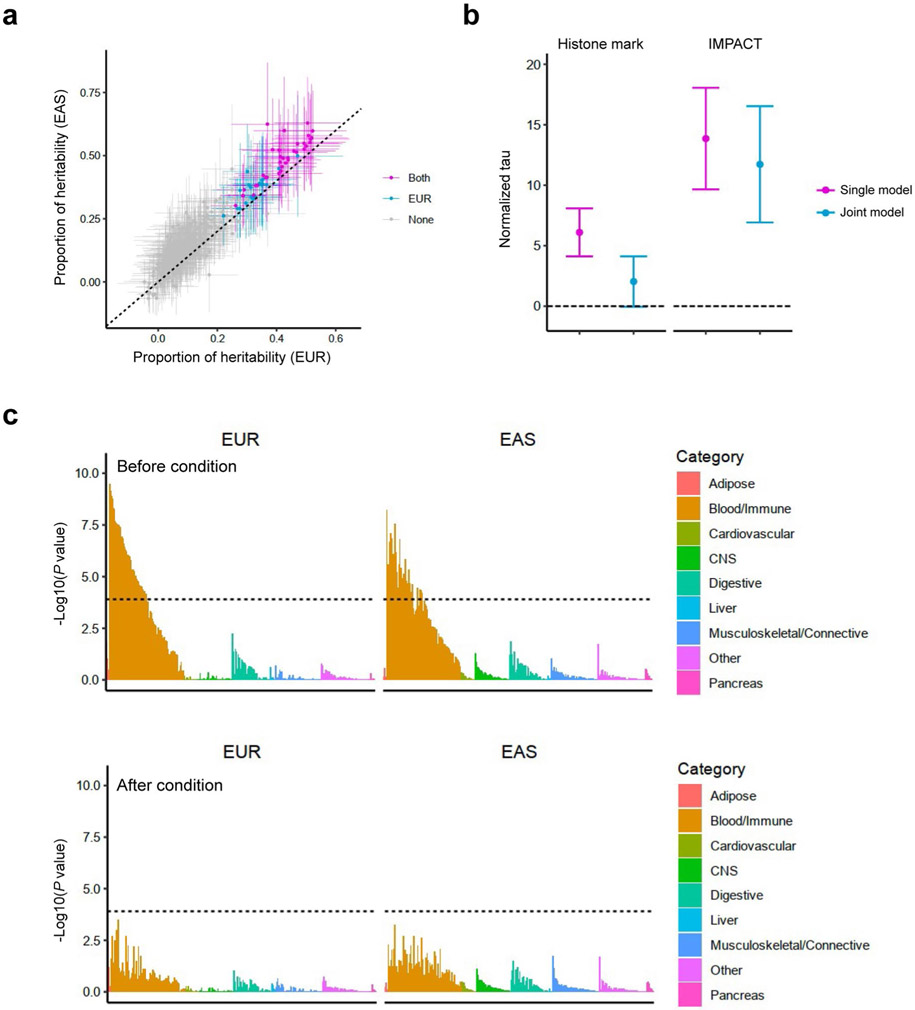
To acquire insights into RA biology, we estimated the heritability enrichments within gene regulatory regions using S-LDSC32, a method to infer the genome-wide distribution of all causal variants irrespective of their effect sizes. We used 707 IMPACT regulatory annotations, which reflect comprehensive cell-type-specific transcription factor activities61. In brief, IMPACT probabilistically annotates each nucleotide genome-wide on a scale from 0 to 1 reflecting cell-type-specific transcription factor activities, and we considered genomic regions scoring in the top 5% of each annotation. We detected significant enrichments in 114 annotations in either EUR or EAS (P < 0.05/707 = 7.1 × 10⁻⁵; Fig. 5a and Supplementary Table 11). The amount of heritability explained by each annotation was highly concordant between EUR and EAS (Pearson’s r = 0.92; P = 1.3 × 10−290; Fig. 5b), and we did not observe significant heterogeneities between EUR and EAS estimates (Phet > 0.05/707 = 7.1 × 10⁻⁵). Among annotations with significant enrichments, the one that explained the largest fraction of EUR heritability was CD4+ T cell T-bet annotation (90%; s.e. = 11%). This annotation explained 94% (s.e. = 12%) of EAS heritability, consistent with analyses on previous GWAS results62. Our conclusion that the CD4+ T cell is the primary driver of RA genetic risk is in line with several previous studies7,32,63,64. However, it is important to note that CD4+ T cells do not explain all heritability (Supplementary Note). We also analyzed 396 histone mark annotations, but they were less enriched in RA heritability than CD4+ T cell T-bet annotation (Extended Data Fig. 7, Supplementary Table 12 and Supplementary Note). In addition to identifying candidate critical transcription factors in RA pathology, these results also suggest that the distribution of causal variants is shared between EUR and EAS.
Fig. 5 ∣. S-LDSC analysis suggested similar causal variant distributions in EUR-GWAS and EAS-GWAS.
a, EUR-GWAS and EAS-GWAS results were analyzed by S-LDSC using 707 IMPACT annotations. P values were calculated by block-jackknife implemented in the LDSC software and indicate the significance of non-negative tau (per variant heritability) of each annotation (one-sided test). The color of each annotation indicates its cell-type category. The horizontal dashed line indicates the Bonferroni-corrected P value threshold (0.05/707 = 7.1 × 10⁻⁵). b, The estimate and its 95% confidence interval of the heritability proportion explained by the top 5% of IMPACT annotations. Confidence intervals and the P values indicating non-negative tau were estimated via block-jackknife implemented in the LDSC software (one-sided test). The color of each annotation indicates the type of GWAS when a heritability enrichment was significant (P < 0.05/707 = 7.1 × 10⁻⁵). ‘Both’ indicates that the annotation was significant in both EUR-GWAS and EAS-GWAS.
Next, we tested whether the findings in S-LDSC analysis could be recapitulated in fine-mapped variants from genome-wide significant loci. We analyzed credible set variants and found that high PIP variants (>0.5) were enriched in high IMPACT score variants for the CD4+ T cell T-bet annotation (>0.5), compared with low PIP variants (Fig. 2c; OR = 8.7; one-sided Fisher exact test P = 1.5 × 10⁻⁴). We found six variants that possess high PIP and high IMPACT score, and one of them is a novel association at the intronic region of LEF1 (rs58107865; Fig. 6 and Supplementary Table 6). Together, both polygenic and fine-mapped signals support the critical role of the T-bet activity of CD4+ T cells in RA pathology.
Fig. 6 ∣. Fine-mapped variants with high IMPACT scores.
Among six loci with lead variants that exhibited high PIP and high IMPACT scores (both >0.5), we show three example loci with PIP > 0.99. P values in multi-ancestry GWAS are shown in the top panels and were calculated by a fixed effect meta-analysis of statistics from logistic regression tests. The track of CD4+ T cell T-bet IMPACT annotation is shown in the bottom panels.
PRS performance across five ancestries
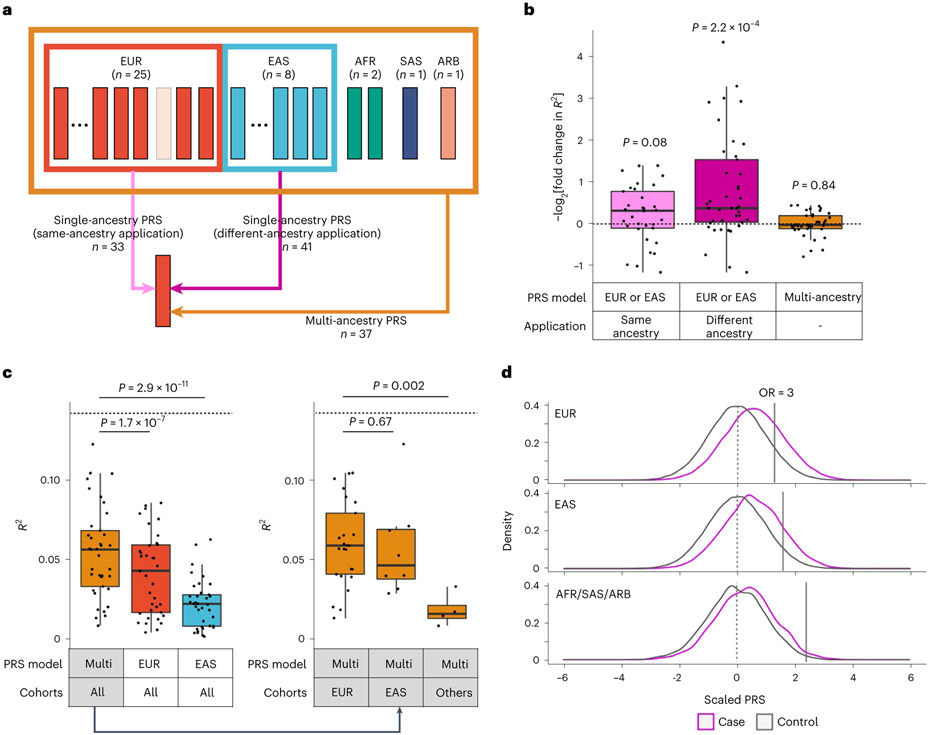
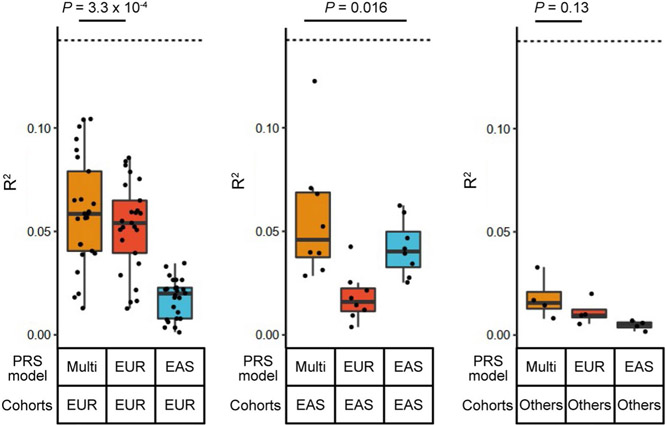
Our results showed that multi-ancestry GWAS can detect causal variants more efficiently than single-ancestry GWAS and that these causal variants are strongly enriched within the CD4+ T cell T-bet annotation. Therefore, we hypothesized that multi-ancestry GWAS and CD4+ T cell T-bet annotation can improve PRS performance in non-EUR populations. To test this, we developed PRS models with six different conditions using combinations of two components: (1) two variant selection settings (we used all variants or variants within the top 5% of the CD4+ T cell T-bet annotation, and refer to PRS based on each of them as standard PRS or functionally informed PRS, respectively) and (2) three GWAS settings (we used multi-ancestry, EUR-GWAS or EAS-GWAS, and refer to PRS based on each of them as multi-ancestry, EUR-PRS or EAS-PRS, respectively). We designed our study so that there were no overlapping samples: when we evaluated the PRS performance in a given cohort, we redid the meta-analysis to exclude the cohort to develop PRS models; we call this approach the leave-one-cohort-out (LOCO) approach (Fig. 7a and Methods).
Fig. 7. Functional annotation and multi-ancestry GWAS improved PRS performances.
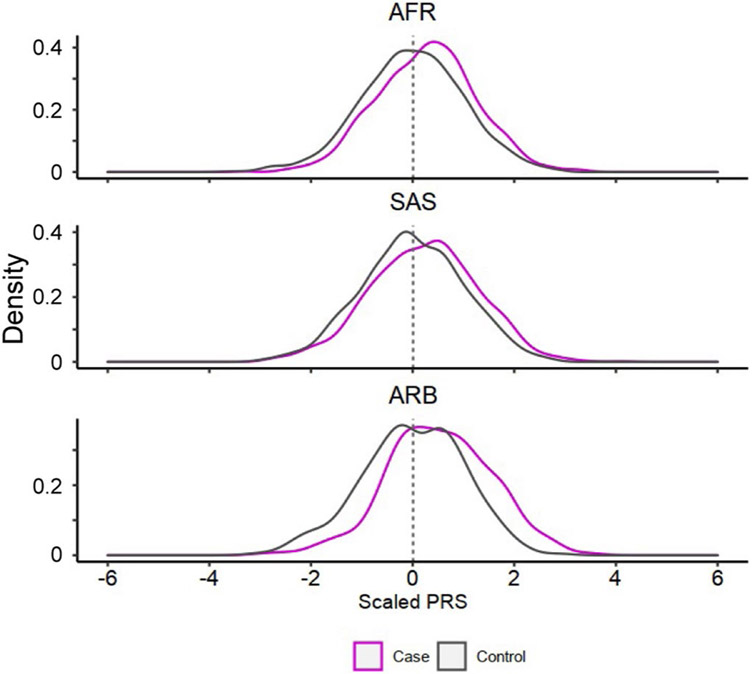
a, The strategy of our PRS analysis. We used PRS based on three GWAS settings: two single-ancestry PRS (EUR-PRS and EAS-PRS) and a multi-ancestry PRS. Single-ancestry PRS had two types of applications: same-ancestry application of PRS (EUR-PRS applied to EUR cohorts, or EAS-PRS applied to EAS cohorts) and different-ancestry application of PRS (EUR-PRS applied to non-EUR cohorts, or EAS-PRS applied to non-EAS cohorts). When we applied a PRS model to a cohort included in a GWAS setting, we reconducted the meta-analysis excluding that cohort to avoid overlapped samples (the LOCO approach). The numbers of each application are shown. b, The improvements in PRS performance (liability-scale R2) by CD4+ T cell T-bet IMPACT annotation. Fold change indicates R2 in functionally informed PRS divided by R2 in standard PRS. We compared three conditions: same-ancestry application of single-ancestry PRS (n = 33), different-ancestry application of single-ancestry PRS (n = 41), and multi-ancestry PRS (n = 37). One-sided sign test P values are shown. We used the LOCO approach where applicable. c, The performance (liability-scale R2) of three different PRS models. The results of three PRS models in all cohorts are shown in the left panel (n = 37). The results of multi-ancestry PRS in three cohort groups are shown in the right panel (n = 25, 8 and 4, respectively, from left to right). The differences in R2 were assessed by two-sided Wilcoxon test. In all conditions, CD4+ T cell T-bet IMPACT annotation was used to select variants. We used the LOCO approach where applicable. d, PRS distribution differences between case and control. Multi-ancestry PRS with CD4+ T cell T-bet IMPACT annotation was used. We used the LOCO approach. In each cohort, PRS was scaled using mean and s.d. of the control samples, and individual level data were merged across cohorts in an ancestral group. For a given PRS value at the right tail of PRS distribution, we compared the case–control ratios between individuals whose PRS was higher than that value and individuals whose PRS was lower than that value, and calculated the OR. The PRS values with OR = 3 are shown with solid vertical lines. Within each boxplot (b and c), the horizontal lines indicate the median, the top and bottom of each box indicate the IQR, and the whiskers indicate the maximum and minimum values within each grouping no further than 1.5 × IQR from the hinge.
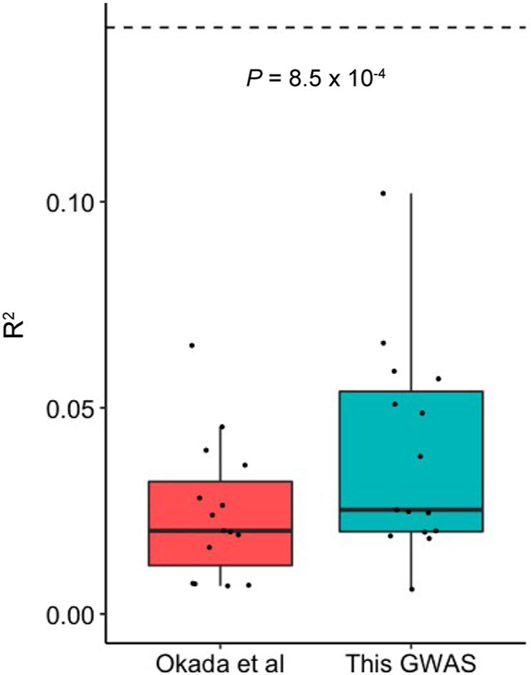
We defined the performance of PRS by the phenotypic variance (Nagelkerke’s R2) explained by PRS and the area under the receiver operating characteristic curve (AUC), and selected the P value threshold with the best performance (Methods). We confirmed that our multi-ancestry PRS outperformed that of the previous study2 (Extended Data Fig. 8). We also validated the performance of our multi-ancestry PRS model using an external dataset (Supplementary Fig. 10 and Supplementary Note).
First, we evaluated the variant selection settings used for PRS (standard and functionally informed PRS). Consistent with our recent study61, functionally informed PRS improved the application of PRS constructed from different ancestries (EUR-PRS applied to non-EUR cohorts, or EAS-PRS applied to non-EAS cohorts). Functionally informed PRS increased R2 by 2.7 fold on average (Fig. 7b and Supplementary Table 13). On the other hand, also consistent with our recent study61, this improvement was relatively small in the application of PRS constructed from the same ancestry (EUR-PRS applied to EUR cohorts, or EAS-PRS applied to EAS cohorts). Functionally informed PRS increased R2 by 1.3 fold on average (Fig. 7b). PRS based on single-ancestry GWAS is affected by LD structures of the GWAS participants’ ancestral backgrounds; this can reduce performance in prediction when we apply this PRS to ancestries with different LD structures. These results confirmed that functionally informed PRS can mitigate this problem. Expectedly, for multi-ancestry PRS, which prioritizes causal variants over variants solely associated through linkage, the benefit of functionally informed PRS was very subtle; functionally informed PRS increased R2 by only 1.02 fold on average (Fig. 7b). As CD4+ T cell T-bet annotation always had beneficial or neutral effects on PRS performance, we used functionally informed PRS for the following analyses.
Next, we evaluated the GWAS settings used for PRS (multi-ancestry, EUR-PRS and EAS-PRS). Consistent with a recent study11, multi-ancestry PRS outperformed EUR-PRS and EAS-PRS; mean R2 values across 37 cohorts were 0.054, 0.041 and 0.022 in multi-ancestry, EUR-PRS and EAS-PRS, respectively (Fig. 7c). Even for EUR cohorts for which the largest same-ancestry GWAS was available, multi-ancestry PRS outperformed EUR-PRS (one-sided paired Wilcoxon test P = 3.3 × 10⁻⁴; Extended Data Fig. 9).
Finally, we compared the performance of multi-ancestry PRS in each population. The best performance was found in the EUR cohorts (mean R2 = 0.059; mean AUC = 0.66; Fig. 7c,d, Extended Data Fig. 10, Supplementary Fig. 11 and Supplementary Table 13). The PRS explained around half of the heritability by the non-MHC common variants, which is the theoretical upper limit (Supplementary Table 2). Strikingly, the performance in the EAS cohorts was comparable with that of the EUR cohorts; the mean R2 was 0.057 (Wilcoxon test P = 0.67 compared with EUR cohorts) and the mean AUC was 0.66 (Wilcoxon test P = 0.69 compared with EUR cohorts). However, we observed poor PRS performances in the AFR, SAS and ARB cohorts; the mean R2 was 0.018 (Wilcoxon test P = 0.002 compared with EUR cohorts) and the mean AUC was 0.59 (Wilcoxon test P = 0.0015 compared with EUR cohorts). Together, multi-ancestry PRS exhibited the best performance in all ancestries in this study. However, the PRS performance in each ancestry was substantially affected by its sample size in this multi-ancestry GWAS, which firmly shows that it is imperative to increase the sample sizes of underrepresented ancestries to equalize genetic predictability of disease status.
Discussion
This study identified 34 novel genetic signals and 95% credible sets with fewer than ten variants at 43 loci. By using multiple functional annotations and prior immunological knowledge, we explored their potential molecular consequences. In addition to the novel loci, our comprehensive analyses provided novel biological interpretations at known loci (for example, IL6R and PADI4). We conducted detailed analyses on ancestry specificity; although most genetic signals are shared across ancestries, we observed some ancestry-specific signals. We also found several candidates of critical transcription factors contributing to RA biology. This multi-ancestry study thus substantially advances our understanding of RA biology.
We used molecular QTL databases to infer gene regulatory functions of risk alelles. This approach is standard but has a limited ability to explore the allelic role comprehensively, as reported in a previous study65. Owing to limited tissue availability, eQTL signals in the critical tissues (such as cartilage and synovium) may not be captured by current eQTL databases. As gene regulation is highly cell-type or cell-state specific, we need to extend QTL experimental conditions to overcome this limitation. Single-cell QTL analysis may also represent a promising strategy66. Another promising approach is introducing risk alleles in target cell populations using gene-editing techniques; previous studies have reported the feasibility of this approach67-69. Future advances in functional genomics could improve the biological insights from our GWAS.
Poor PRS performance in non-EUR ancestries is becoming one of the major challenges in human genetics. Conducting a multi-ancestry GWAS on a large scale is a promising strategy to mitigate this issue. Indeed, multi-ancestry PRS performance in EAS cohorts was comparable to those in EUR cohorts, demonstrating that this study mitigated inequality of genetic benefit at least partially (Fig. 7c). However, this study was underpowered to detect specific signals in non-EUR and non-EAS ancestries, resulting in poor PRS performance in these ancestries. To overcome these limitations, we need further efforts to diversify GWAS and increase sample sizes of underrepresented ancestries as in other common complex diseases.
Methods
Study participants
We included 35,871 RA cases and 240,149 control individuals of EUR, EAS, AFR, SAS and ARB ancestry from 37 cohorts (Supplementary Table 1). All RA cases fulfilled the 1987 American College of Rheumatology (ACR) criteria70 or the 2010 ACR/European League Against Rheumatism criteria71, or were diagnosed with RA by a professional rheumatologist. Among the 35,871 cases, seropositivity status was available for 31,963; 27,448 were seropositive and 4,515 were seronegative (Supplementary Table 1). We defined seropositivity as the presence of rheumatoid factor or anti-citrullinated peptide antibodies. When a seropositive and seronegative GWAS had fewer than 50 cases, we excluded it from this study, as GWAS with too few samples produces unstable statistics. All cohorts obtained informed consent from all participants by following the protocols approved by their institutional ethical committees. We provide a list of institutional review boards that approved each study in the Supplementary Note. We have complied with all relevant ethical regulations.
Genotyping and imputation
We conducted genotype quality control (QC), imputation, and case–control association tests separately for each cohort. Genotyping platforms and all QC parameters of each cohort are provided in Supplementary Table 1. We used PLINK v1.9 software (https://www.cog-genomics.org/plink/1.9) for QC processes. For QC of samples, we excluded those with (1) low sample call rate, (2) closely related individuals and (3) outliers in terms of ancestries identified by principal component analysis (PCA) using the genotyped samples and all 1KG Phase 3 samples. As 1KG Phase 3 does not include ARB samples, we did not exclude individuals in the ARB cohort based on ancestral outliers. For QC of genotypes, we excluded variants meeting any of the following criteria: (1) low call rate, (2) low minor allele frequency (MAF) and (3) low P value for Hardy–Weinberg equilibrium. Post-QC genotype data of each cohort were pre-phased using Shapeit2 (v2.r727, v2.r837 or v2.r904; https://mathgen.stats.ox.ac.uk/genetics_software/shapeit/shapeit.html) or Eagle v2 software (https://alkesgroup.broadinstitute.org/Eagle). We used Minimac3 (v2.0.1; https://genome.sph.umich.edu/wiki/Minimac3) or Minimac4 (v1.0.0; https://genome.sph.umich.edu/wiki/Minimac4) for imputation. For EUR, AFR and ARB cohorts, we conducted imputation using the 1KG Phase 3 reference panel. For EAS and SAS cohorts, we conducted imputation using reference panels that were generated by merging the 1KG Phase 3 panel and whole-genome sequencing (WGS) data of each population (Supplementary Table 1); we used WGS data of 1,037 Japanese72, 89 Korean73, 7 Chinese74 or 96 Malaysian individuals75. For ChrX analyses, we restricted our analyses to the non-pseudo-autosomal region of ChrX, as very few variants were genotyped in the pseudo-autosomal region in some cohorts. First, we split the genotype data into male and female samples and conducted phasing and imputation separately. For QC of imputed genotype data, we excluded variants with low imputation quality (imputation r2 < 0.3) from each cohort, excluded variants with minor allele count less than ten in the reference panel, and then included variants that passed QC in at least five cohorts; overall, we included 20,990,826 autosomal variants and 736,614 X chromosome variants. The genomic coordinate is according to Genome Reference Consortium human build 37 (GRCh37) in all analyses.
PCA and UMAP using all GWAS participants
To assess the ancestral background diversity of all GWAS participants, we projected them into the same PC space based on their imputed genotype data. From variants that passed QC criteria in all 37 cohorts (imputation r2 ≥ 0.3), we first identified 12,196 independent imputed variants (r2 < 0.2 in EUR samples of 1KG Phase 3). Owing to data access restrictions, we were not able to transfer raw imputed genotype data across different institutes; hence, we were not able to conduct one PCA using all individuals. Therefore, we first conducted PCA using these variants and all samples in 1KG Phase 3, and calculated the loadings of each variant for the top 20 PCs. We then calculated each individual’s PC scores using these loadings and imputed dosage of our GWAS samples. We further conducted UMAP using the umap package (v0.2.0.0) in R with these top 20 PC scores (n_neighbors = 30 and min_dist = 0.8).
Genome-wide association analysis
We conducted GWAS in each cohort by a logistic regression model using PLINK v2 software (https://www.cog-genomics.org/plink/2.0). For ChrX analyses, we first split the genotype data into male and female samples and conducted association tests separately. We treated the allele count of female as {0,1,2} and that of male as {0,2} in association tests, assuming dosage compensation in females. We included sex and genotype PCs within each cohort as covariates. We used the age covariate (age at recruitment) only in the ARB cohort. Details of covariates are provided in Supplementary Table 1. We then conducted meta-analysis using all cohorts by the inverse-variance weighted fixed effect model as implemented in METAL (multi-ancestry GWAS). For ancestries with multiple cohorts, we similarly conducted meta-analysis within each ancestry (EUR-GWAS, EAS-GWAS and AFR-GWAS). Although we adopted different versions of Minimac (Minimac3 or Minimac4) dependent on the cohorts, this does not affect meta-analysis results, as we conducted case–control association tests separately for each cohort. When the seropositivity status was available, we also conducted GWAS only using seropositive RA samples and controls. We defined a locus as a genomic region within ±1 megabase (Mb) from the lead variant, and we considered a locus as novel when it did not include any variants previously reported for RA. For non-RA autoimmune diseases (systemic lupus erythematosus, systemic sclerosis, Sjögren’s syndrome, dermatomyositis, juvenile dermatomyositis, and polymyositis), we used a ±0.5 Mb window from the lead variant. We defined reported variants as significant variants (P < 5 × 10⁻⁸) reported in the GWAS Catalog (https://www.ebi.ac.uk/gwas; e104_r2021-10-06) and those reported in previous literature that we searched manually. As we need a unique analytical strategy for the MHC locus, we excluded the MHC region (chr6:25Mb-35Mb) from this study, which will be reported in an accompanying project. To compare the outputs of the fixed effect meta-analysis with those of the random effect meta-analysis, we applied MR-MEGA (v0.1.5; https://genomics.ut.ee/en/tools) to the same sets of cohorts and conducted a multi-ancestry meta-analysis (Supplementary Note).
We performed stepwise conditional analysis within ±1 Mb from the lead variant. We conducted the same logistic regression model but including the dosages of the lead variants (index variants in the first round of conditional analysis) as covariates in each cohort; when the lead variants did not exist in the post-QC imputed genotype data of a cohort (imputation r2 ≥ 0.3), we excluded that cohort from the analysis. We then conducted meta-analysis using the same strategy and identified the second lead variant. We repeated these processes by sequentially adding the identified lead variants as covariates until we did not detect any significant associations (P < 5 × 10⁻⁸).
Estimation of heritability and bias in GWAS results
We estimated heritability and confounding bias in EUR-GWAS and EAS-GWAS results with S-LDSC using the baselineLD model (v2.1) and LDSC software (v1.0.0). As S-LDSC assumes that GWAS has samples from a single ancestral background and a sufficient sample size, we restricted this analysis to EUR-GWAS and EAS-GWAS. For EUR-GWAS, we used LD scores calculated in EUR samples in 1KG Phase 3. For EAS-GWAS, we used LD scores calculated in EAS samples in 1KG Phase 3. As LDSC required a large sample size in GWAS (typically >5,000 individuals), we restricted this analysis to EUR-GWAS and EAS-GWAS. We estimated that the prevalence of RA was 0.5% in both ancestries.
Fine-mapping analysis
We conducted fine-mapping analysis using approximate Bayesian factor (ABF) and constructed 95% credible set for each significant locus33. We used multi-ancestry GWAS results. We included all 122 autosomal loci (P < 5.0 × 10⁻⁸). We calculated ABF of each variant according to equation (1):
where and SE are the variant’s effect size and standard error, respectively; denotes the prior variance in allelic effects (we empirically set this value to be 0.04)76. For each locus, we calculated PIP of variant k according to equation (2):
where j denotes all of the variants included in the locus. We sorted all variants in order of decreasing PIP and constructed 95% credible set including variants from the top PIP until the cumulative PIP reached 0.95. When we compared the fine-mapping resolution across different GWAS settings, we also applied this fine-mapping strategy to EUR-GWAS and EAS-GWAS for all 122 autosomal loci.
Functional interpretation of fine-mapped variants
We quantified the enrichment of the 95% credible set variants at the 113 autosomal loci within ATAC-seq (assay for transposable-accessible chromatin using sequencing) peaks in 18 hematopoietic populations using gchromVAR software (v0.3.2)35. We used the default parameters and ATAC-seq data processed by the developers. To access the specificity of a given ATAC-seq peak, we first normalized the read count of that peak in all 18 hematopoietic populations (each peak’s read count was divided by the total number of read counts, scaled by 1,000,000, added 1 as an offset value, and log2-transformed), and transformed these 18 normalized counts into Z scores.
Functional interpretation of associated variants
We inferred the possible molecular consequences of all 148 variants detected in this study. First, we focused on coding variants in LD with the lead variants in this GWAS (r2 > 0.6 in both EUR and EAS samples in 1KG Phase 3; when the lead variant was monomorphic in one ancestry, we used the other ancestry). To annotate coding variants, we used ANNOVAR (v2018-04-16) and assessed their potential impacts on protein function; we reported SIFT and PolyPhen-2 (HDIV) scores. To interpret their effects on gene regulation, we tested colocalization of our GWAS signals and eQTL or sQTL signals using coloc software (v2.3.1)38 and SMR software (v1.03)48. SMR outputs PHEIDI, which indicates heterogeneity between eQTL and GWAS signals (larger PHEIDI supports colocalization). We used the intersection of high posterior probability (>0.7 estimated by coloc) and non-significant PHEIDI (PHEIDI > 0.001) as evidence of colocalized signals. We analyzed eQTL and sQTL results from the Blueprint consortium database (CD4+ T cells, monocytes and neutrophils) and eQTL results from the GTEx project v8 database (49 tissues)37,47. As coloc and SMR assume GWAS and QTL signals are obtained from the same ancestry group, we used only EUR-GWAS results for this analysis. We used EUR samples of 1KG as the reference set for LD data in SMR analysis.
Capture RNA-seq of PADI4 isoforms
We obtained total RNAs from THP-1 cells after stimulation with phorbol myristate acetate (PMA) for 72 h, which induces the expression of PADI477. We reverse-transcribed the RNA (10 ng) into complementary DNAs with Smart-seq2 primers78 (Oligo-dT-smartseq2:/5Me-isodC/AAGCAGTGGTATCAACGCAGAGTACTTTTTTTTTTTTTTTTTTTTTTTTTTTTTTVN; 5Me-isodC-TSO:/5Me-isodC/AAGCAGTGGTATCAACGCAGAGTACATrGrG+G), and then amplified them using ten cycles of PCR. We hybridized PADI4 isoforms with xGen Lockdown Probes (5′-biotinylated 120-mer DNA probes synthesized by Integrated DNA Technologies; Supplementary Table 14) designed for all exons of the PADI4 main isoform. We captured the hybridized cDNAs with streptavidin-conjugated magnetic beads and then sequenced them with a MinION sequencer using a Ligation Sequencing Kit (Oxford Nanopore Technologies, LSK-SQK109). We analyzed the sequenced reads using FLAIR (https://github.com/BrooksLabUCSC/flair).
We then performed sQTL analysis targeting PADI4 using the eQTL data of peripheral blood subsets5. We reassembled and quantified the RNA-seq reads for PADI4 isoforms, including the newly discovered isoform, using Cufflinks (v2.2.1; http://cole-trapnell-lab.github.io/cufflinks). We calculated the isoform ratio by dividing each isoform expression (FPKM, fragments per kilobase of transcript per million mapped fragments) over total isoform expression.
Distribution of causal variants
We conducted S-LDSC to partition heritability using LDSC software (v1.0.0). As S-LDSC assumes that GWAS has samples from a single ancestral background and a sufficient sample size, we restricted this analysis to EUR-GWAS and EAS-GWAS. For this analysis, we used 707 cell-type-specific IMPACT annotations and 396 histone mark annotations61,64. IMPACT regulatory annotations were created by aggregating 5,345 epigenetic datasets to predict binding patterns of 142 transcription factors across 245 cell types. We computed annotation-specific LD scores using the EUR samples in 1KG Phase 3 to analyze EUR-GWAS results. Similarly, we used EAS samples in 1KG Phase 3 to analyze EAS-GWAS results. We estimated heritability enrichment of each annotation, while controlling for the 53 categories of the full baseline model. When we controlled the effect of an annotation, we conducted the same S-LDSC analysis but also included that annotation in a single model. We excluded variants in the MHC region (chr6:25Mb-35Mb).
Trans-ancestry comparison of genetic signals
First, we sought to compare the effect size estimates among GWAS results from each ancestry at the lead variants. However, the lead variants are not always the causal variants; hence, we restricted our targets to fine-mapped lead variants (PIP > 0.5). In addition, we excluded rare variants from this analysis because the effect sizes could not be accurately estimated for rare variants (MAF < 0.01 in either of the major ancestries in 1KG Phase 3). Overall, we included 30 fine-mapped variants for this analysis. The P value for heterogeneity was calculated using Cochran’s Q test.
Next, we obtained multi-ancestry genetic-effect correlation using Popcorn software (v1.0)60. We restricted this analysis to EUR-GWAS and EAS-GWAS to avoid a biased correlation estimate caused by the small sample size. We used summary statistics of EUR-GWAS and EAS-GWAS, and selected association statistics from variants with at least non-missing genotype from 5,000 individuals. We also excluded the MHC region from the analysis because of its complex LD structure. Using these post-QC summary statistics, we calculated the multi-ancestry genetic-effect correlation between EUR and EAS with pre-computed cross-ancestry scores for EUR and EAS 1KG ancestries provided by the authors.
Polygenic risk score
We used the pruning and thresholding method to calculate PRS in this study. We developed PRS models with six different conditions using combinations of two components: (1) two variant selection settings and (2) three GWAS settings, as described above. We designed our study so that the samples used in constructing PRS would be independent from the samples in validation. When we evaluated the PRS performance in a given cohort, we reconducted GWAS meta-analysis excluding that cohort to develop PRS models (Fig. 7a). Before pruning, we removed rare variants from three GWAS results to reduce unstable effect estimates in PRS (MAF < 0.01 in EUR samples of 1KG Phase 3 for EUR-GWAS and multi-ancestry GWAS, and MAF < 0.01 in EAS samples of 1KG Phase 3 for EAS-GWAS). We also restricted this analysis to the variants that exist in both the GWAS results and post-QC imputed genotype of a cohort for which we apply PRS, and then we selected variants based on IMPACT annotation or used all variants (as described above). To LD-prune variants (r2 < 0.2), we used haplotype information in EUR samples of 1KG Phase 3 for EUR-GWAS and multi-ancestry GWAS, and EAS samples of 1KG Phase 3 for EAS-GWAS. For each of six conditions, we used ten different P value thresholds: 0.1, 0.03, 0.01, 0.003, 0.001, 3.0 × 10⁻⁴, 1.0 × 10⁻⁴, 3.0 × 10⁻⁵, 1.0 × 10⁻⁵ and 5.0 × 10⁻⁸; thus, we ended up having 60 different PRS models (6 conditions × 10 P value thresholds). We applied these 60 PRS models to 37 cohorts and applied a logistic regression model using per-individual PRS including the same covariates as used in GWAS; we evaluated PRS performances by Nagelkerke’s R2 and the AUC. All R2 values were reported in a liability scale. AUC was calculated using pROC (v1.18.0). In each of the six PRS conditions, we selected the P value threshold with the largest average Nagelkerke’s R2 and used this P value threshold for the following analyses.
To discuss the PRS distribution in an ancestry, we first calculated PRS in each cohort using a specified condition; next, we scaled those PRS values using the mean and the standard deviation of the PRS of only the control samples in that cohort, and we then merged PRS values across cohorts in an ancestry. We approximated the PRS distribution in a general population by using that in control samples. For a given PRS value (at the right tail of PRS distribution), we compared the case–control ratios between individuals whose PRS is higher than that value and individuals whose PRS is lower than (or equal to) that value, and calculated the OR. We then identified the minimum PRS value that showed OR > 3.
Extended Data
Extended Data Fig. 1 ∣. PCA and UMAP plot of 1KG Phase 3.
a, We projected each individual’s imputed genotype into a PC space, which was calculated using all individuals in 1KG Phase 3. b, We further conducted UMAP analysis using the top 20 PC scores of all GWAS samples and all individuals in 1KG Phase 3. We plotted all samples in 1KG Phase 3 or plotted samples in each ancestry separately. UMAP plot of all GWAS samples is provided in Fig. 1c.
Extended Data Fig. 2 ∣. Effect size heterogeneity between seropositive and seronegative RA.
a, Odds ratio and its 95% confidence interval of seropositive and seronegative RA are plotted. Among the lead variants at 122 significant autosomal loci, we plotted 118 variants common in EUR of 1KG Phase 3 (MAF > 0.01). We present the results from multi-ancestry GWAS and EUR-GWAS. Effect size heterogeneity was assessed in the multi-ancestry GWAS results by Cochran’s Q test (Phet). Pearson’s correlation data are provided. b, Differences (delta) of effect size magnitude between seropositive and seronegative RA. A positive delta indicates a larger magnitude of effect size in seropositive RA than seronegative RA. We defined the standard error (s.e.) of delta by the following formula: . We provided 2 × s.e. of delta as error bars. In seropositive RA GWAS, we had 27,448 cases and 240,149 controls; in seronegative RA GWAS, we had 4,515 cases and 240,149 controls.
Extended Data Fig. 3 ∣. Enrichment of high PIP variants within open chromatin regions of 18 blood cell populations.
Enrichment of high PIP variants within open chromatin regions of 18 blood cell populations was analyzed by gchromVAR software. The horizontal dashed line indicates Bonferroni corrected P value threshold (0.05/18 = 0.0027). P values were estimated by the enrichment test implemented in gchromVAR.
Extended Data Fig. 4 ∣. Conditional analysis results at the IL2RA and TNFAIP3 loci.
a,b, Conditional analysis was conducted in each cohort, and the results were meta-analyzed using the inverse-variance weighted fixed effect model (a, IL2RA locus; b, TNFAIP3 locus). We used multi-ancestry GWAS results. Results at the TYK2 locus are provided in Extended Data Fig. 6. Variants in LD with the lead variant (r2 > 0.6 both in EUR and EAS ancestries) in each round of conditional analysis are highlighted by different colors.
Extended Data Fig. 5 ∣. Haplotype-level association test at the IL6R locus.
Haplotype-level association results at the IL6R locus. We defined haplotypes as shown in the table, and we estimated the dosage of four haplotypes using phased imputed genotype data. We conducted multivariate logistic regression tests in each of EUR cohorts (n = 97,173 in total), and the results were meta-analyzed using the inverse-variance weighted fixed effect model. The effect size estimate and 2 x s.e. are shown in the right panel.
Extended Data Fig. 6 ∣. Three ancestry-specific signals at the TYK2 locus.
a,b, Conditional analysis was conducted in each cohort, and the results were meta-analyzed using the inverse-variance weighted fixed effect model (a, EUR-GWAS; b, EAS-GWAS). Variants in LD with the lead variant (r2 > 0.6 in EUR or EAS ancestries) in each round of conditional analysis are highlighted by different colors.
Extended Data Fig. 7 ∣. S-LDSC analysis using histone mark annotations.
a, The estimate and its 95% confidence interval of the heritability proportion explained by 396 histone mark annotations are provided. Confidence intervals and the P values indicating non-negative tau were estimated via block-jackknife implemented in the LDSC software (one-sided test). When a heritability enrichment is significant (P < 0.05/396 = 1.3 × 10⁻⁴), that annotation is colored by the type of GWAS. b, The best histone mark annotation (H3K4me1 in PMA-I stimulated primary CD4+ T cells) and the best IMPACT annotation (CD4+ T cell T-bet) were jointly modeled in S-LDSC analysis. Tau estimate (per variant heritability in each annotation) normalized by total per variant heritability are provided as the centre, and its 95% confidence interval are provided as error bars. EUR-GWAS results were used. c, P values were calculated by block-jackknife implemented in the LDSC software and indicate the significance of non-negative tau (per variant heritability) of each annotation (one-sided test). Each histone mark annotation is colored by its cell type category. Horizontal dashed line indicates Bonferroni-corrected P-value threshold (0.05/396 = 1.3 × 10⁻⁴). Top panel shows the results without controlling the effect of the best IMPACT annotation (CD4+ T cell T-bet), and the bottom panel shows the results with controlling for this effect.
Extended Data Fig. 8 ∣. PRS performance comparison between the previous RA GWAS and this GWAS.
The liability scale R2 in the 15 cohorts not included in the previous RA GWAS. We used the multi-ancestry GWAS results reported in Okada et al. and this GWAS to develop PRS models. We used the LOCO approach to evaluate the PRS model based on this GWAS. The differences were assessed by two-sided paired Wilcoxon text (n = 15). Within each boxplot, the horizontal lines reflect the median, the top and bottom of each box reflect the interquartile range (IQR), and the whiskers reflect the maximum and minimum values within each grouping no further than 1.5 × IQR from the hinge.
Extended Data Fig. 9 ∣. PRS performances in different ancestral groups.
PRS performances (liability scale R2) are shown for each combination of PRS models and cohort groups for which the PRS was applied (n = 25, 8, and 4, respectively, from the left). The differences between the group with the best performance and the second best were analyzed by two-sided paired Wilcoxon test. Within each boxplot, the horizontal lines reflect the median, the top and bottom of each box reflect the interquartile range (IQR), and the whiskers reflect the maximum and minimum values within each grouping no further than 1.5 × IQR from the hinge. We used the LOCO approach where applicable.
Extended Data Fig. 10 ∣. PRS distribution differences between cases and controls.
PRS distribution differences between cases and controls. Multi-ancestry PRS with CD4+ T cell T-bet IMPACT annotation was used. We used the LOCO approach. In each cohort, PRS was scaled using mean and s.d. of the control samples, and individual level data were merged across cohorts in an ancestry group.
Supplementary Material
Acknowledgements
We thank the Director of Health Malaysia for supporting the work described in the South Asian (SAS) population: the Malaysian Epidemiological Investigation of Rheumatoid Arthritis (MyEIRA) study. The MyEIRA study was funded by grants from Ministry of Health Malaysia (NMRR-08-820-1975) and the Swedish National Research Council (DNR-348-2009-6468). The GENRA study and the CARDERA genetics cohort genotyping were funded by Versus Arthritis (grant reference 19739 to I.C.S.). The Nurses’ Health Study (NHS cohort) is funded by the National Institutes of Health (NIH) (R01 AR049880, UM1 CA186107, R01 CA49449, U01 CA176726 and R01 CA67262). The Swedish EIRA study was supported by the Swedish Research Council (to L.K., L.P. and L.A.). S.S. was in part supported by the Mochida Memorial Foundation for Medical and Pharmaceutical Research, Kanae Foundation for the Promotion of Medical Science, Astellas Foundation for Research on Metabolic Disorders, JCR Grant for Promoting Basic Rheumatology, and Manabe Scholarship Grant for Allergic and Rheumatic Diseases. I.C.S. is funded by the National Institute for Health and Care Research (NIHR) Advanced Research Fellowship (grant reference NIHR300826). The views expressed are those of the authors and not necessarily those of the NIHR or the Department of Health and Social Care. K.A.S. is supported by the Sherman Family Chair in Genomic Medicine and by a Canadian Institutes for Health Research Foundation Grant (FDN 148457) and grants from the Ontario Research Fund (RE-09-090) and Canadian Foundation for Innovation (33374). S.-C.B. is supported by the Basic Science Research Program through the NRF funded by the Ministry of Education (NRF-2021R1A6A1A03038899). R.P.K. and J.C.E. are funded by NIH (UL1 TR003096). C.M.L. is partly funded by the NIHR Maudsley Biomedical Research Centre at South London and Maudsley NHS Foundation Trust and King’s College London. T. Arayssi was partially supported by the National Priorities Research Program (grant 4-344-3-105 from the Qatar National Research Fund, a member of Qatar Foundation). M. Kerick and J.M. are funded by Rheumatology Cooperative Research Thematic Network program RD16/0012/0013 from the Instituto de Salud Carlos III (Spanish Ministry of Science and Innovation). Y.O. is funded by JSPS KAKENHI (19H01021 and 20K21834), AMED (JP21km0405211, JP21ek0109413, JP21ek0410075, JP21gm4010006 and JP21km0405217), JST Moonshot R&D (JPMJMS2021 and JPMJMS2024), Takeda Science Foundation, and the Bioinformatics Initiative of Osaka University Graduate School of Medicine. Y. Kochi is funded by grants from Nanken-Kyoten, TMDU and Medical Research Center Initiative for High Depth Omics. S.R. is supported by UH2AR067677, U01HG009379, R01AR063759 and U01HG012009.
The BioBank Japan Project
Footnotes
A full list of consortium members appears in the Supplementary Note.
Reporting summary
Further information on research design is available in the Nature Research Reporting Summary linked to this article.
Online content
Any methods, additional references, Nature Research reporting summaries, source data, extended data, supplementary information, acknowledgements, peer review information; details of author contributions and competing interests; and statements of data and code availability are available at https://doi.org/10.1038/s41588-022-01213-w.
Competing interests
The authors declare no competing interests.
Extended data is available for this paper at https://doi.org/10.1038/s41588-022-01213-w.
Supplementary information The online version contains supplementary material available at https://doi.org/10.1038/s41588-022-01213-w.
Data availability
We deposited six sets of summary statistics (multi-ancestry, EUR-GWAS and EAS-GWAS for all RA and seropositive RA) to the GWAS Catalog under accession IDs GCST90132222, GCST90132223, GCST90132224, GCST90132225, GCST90132226 and GCST90132227. We deposited the PRS model (multi-ancestry PRS with CD4+ T cell T-bet IMPACT annotation) to the Polygenic Score (PGS) Catalog; the publication ID is PGP000357, and the score ID is PGS002745. Summary statistics and the PRS model are also available at https://data.cyverse.org/dav-anon/iplant/home/kazuyoshiishigaki/ra_gwas/ra_gwas-10-28-2021.tar. The UK Biobank analysis was conducted via application no. 47821.
Code availability
The codes are available at our website (https://github.com/immunogenomics/RA_GWAS) and archived in Zenodo (https://doi.org/10.5281/zenodo.6999289).
References
- 1.Ajeganova S & Huizinga TWJ Seronegative and seropositive RA: alike but different? Nat. Rev. Rheumatol 11, 8–9 (2015). [DOI] [PubMed] [Google Scholar]
- 2.Okada Y et al. Genetics of rheumatoid arthritis contributes to biology and drug discovery. Nature 506, 376–381 (2014). [DOI] [PMC free article] [PubMed] [Google Scholar]
- 3.Ishigaki K et al. Large-scale genome-wide association study in a Japanese population identifies novel susceptibility loci across different diseases. Nat. Genet 52, 669–679 (2020). [DOI] [PMC free article] [PubMed] [Google Scholar]
- 4.MacGregor AJ et al. Characterizing the quantitative genetic contribution to rheumatoid arthritis using data from twins. Arthritis Rheum. 43, 30–37 (2000). [DOI] [PubMed] [Google Scholar]
- 5.Ishigaki K et al. Polygenic burdens on cell-specific pathways underlie the risk of rheumatoid arthritis. Nat. Genet 49, 1120–1125 (2017). [DOI] [PubMed] [Google Scholar]
- 6.Westra H-J et al. Fine-mapping and functional studies highlight potential causal variants for rheumatoid arthritis and type 1 diabetes. Nat. Genet 50, 1366–1374 (2018). [DOI] [PMC free article] [PubMed] [Google Scholar]
- 7.Trynka G et al. Chromatin marks identify critical cell types for fine mapping complex trait variants. Nat. Genet 45, 124–130 (2013). [DOI] [PMC free article] [PubMed] [Google Scholar]
- 8.Asgari S et al. A positively selected FBN1 missense variant reduces height in Peruvian individuals. Nature 582, 234–239 (2020). [DOI] [PMC free article] [PubMed] [Google Scholar]
- 9.Type SIGMA 2 Diabetes Consortium. Association of a low-frequency variant in HNF1A with type 2 diabetes in a Latino population. JAMA 311, 2305–2314 (2014). [DOI] [PMC free article] [PubMed] [Google Scholar]
- 10.Moltke I et al. A common Greenlandic TBC1D4 variant confers muscle insulin resistance and type 2 diabetes. Nature 512, 190–193 (2014). [DOI] [PubMed] [Google Scholar]
- 11.Koyama S et al. Population-specific and trans-ancestry genome-wide analyses identify distinct and shared genetic risk loci for coronary artery disease. Nat. Genet 52, 1169–1177 (2020). [DOI] [PubMed] [Google Scholar]
- 12.Chen M-H et al. Trans-ethnic and ancestry-specific blood-cell genetics in 746,667 individuals from 5 global populations. Cell 182, 1198–1213.e14 (2020). [DOI] [PMC free article] [PubMed] [Google Scholar]
- 13.Huang H et al. Fine-mapping inflammatory bowel disease loci to single-variant resolution. Nature 547, 173–178 (2017). [DOI] [PMC free article] [PubMed] [Google Scholar]
- 14.Laufer VA et al. Genetic influences on susceptibility to rheumatoid arthritis in African-Americans. Hum. Mol. Genet 28, 858–874 (2019). [DOI] [PMC free article] [PubMed] [Google Scholar]
- 15.Martin AR et al. Clinical use of current polygenic risk scores may exacerbate health disparities. Nat. Genet 51, 584–591 (2019). [DOI] [PMC free article] [PubMed] [Google Scholar]
- 16.Ruan Y et al. Improving polygenic prediction in ancestrally diverse populations. Nat. Genet 54, 573–580 (2022). [DOI] [PMC free article] [PubMed] [Google Scholar]
- 17.Márquez-Luna C et al. Multiethnic polygenic risk scores improve risk prediction in diverse populations. Genet. Epidemiol 41, 811–823 (2017). [DOI] [PMC free article] [PubMed] [Google Scholar]
- 18.Leng R-X et al. Identification of new susceptibility loci associated with rheumatoid arthritis. Ann. Rheum. Dis 79, 1565–1571 (2020). [DOI] [PubMed] [Google Scholar]
- 19.Kochi Y et al. A functional variant in FCRL3, encoding Fc receptor-like 3, is associated with rheumatoid arthritis and several autoimmunities. Nat. Genet 37, 478–485 (2005). [DOI] [PMC free article] [PubMed] [Google Scholar]
- 20.Suzuki A et al. Functional haplotypes of PADI4, encoding citrullinating enzyme peptidylarginine deiminase 4, are associated with rheumatoid arthritis. Nat. Genet 34, 395–402 (2003). [DOI] [PubMed] [Google Scholar]
- 21.Okada Y et al. Meta-analysis identifies nine new loci associated with rheumatoid arthritis in the Japanese population. Nat. Genet 44, 511–516 (2012). [DOI] [PubMed] [Google Scholar]
- 22.Diogo D et al. TYK2 protein-coding variants protect against rheumatoid arthritis and autoimmunity, with no evidence of major pleiotropic effects on non-autoimmune complex traits. PLoS ONE 10, e0122271 (2015). [DOI] [PMC free article] [PubMed] [Google Scholar]
- 23.Traylor M et al. Genetic associations with radiological damage in rheumatoid arthritis: meta-analysis of seven genome-wide association studies of 2,775 cases. PLoS ONE 14, e0223246 (2019). [DOI] [PMC free article] [PubMed] [Google Scholar]
- 24.Márquez A et al. Meta-analysis of Immunochip data of four autoimmune diseases reveals novel single-disease and cross-phenotype associations. Genome Med. 10, 97 (2018). [DOI] [PMC free article] [PubMed] [Google Scholar]
- 25.Wei W-H, Viatte S, Merriman TR, Barton A & Worthington J Genotypic variability based association identifies novel non-additive loci DHCR7 and IRF4 in sero-negative rheumatoid arthritis. Sci. Rep 7, 5261 (2017). [DOI] [PMC free article] [PubMed] [Google Scholar]
- 26.Márquez A et al. A combined large-scale meta-analysis identifies COG6 as a novel shared risk locus for rheumatoid arthritis and systemic lupus erythematosus. Ann. Rheum. Dis 76, 286–294 (2017). [DOI] [PubMed] [Google Scholar]
- 27.Bossini-Castillo L et al. A genome-wide association study of rheumatoid arthritis without antibodies against citrullinated peptides. Ann. Rheum. Dis 74, e15 (2015). [DOI] [PubMed] [Google Scholar]
- 28.Eyre S et al. High-density genetic mapping identifies new susceptibility loci for rheumatoid arthritis. Nat. Genet 44, 1336–1340 (2012). [DOI] [PMC free article] [PubMed] [Google Scholar]
- 29.Acosta-Herrera M et al. Genome-wide meta-analysis reveals shared new loci in systemic seropositive rheumatic diseases. Ann. Rheum. Dis 78, 311–319 (2019). [DOI] [PMC free article] [PubMed] [Google Scholar]
- 30.Frisell T et al. Familial risks and heritability of rheumatoid arthritis: role of rheumatoid factor/anti-citrullinated protein antibody status, number and type of affected relatives, sex, and age. Arthritis Rheum. 65, 2773–2782 (2013). [DOI] [PubMed] [Google Scholar]
- 31.Padyukov L et al. A genome-wide association study suggests contrasting associations in ACPA-positive versus ACPA-negative rheumatoid arthritis. Ann. Rheum. Dis 70, 259–265 (2011). [DOI] [PMC free article] [PubMed] [Google Scholar]
- 32.Finucane HK et al. Partitioning heritability by functional annotation using genome-wide association summary statistics. Nat. Genet 47, 1228–1235 (2015). [DOI] [PMC free article] [PubMed] [Google Scholar]
- 33.Wellcome Trust Case Control Consortium. Bayesian refinement of association signals for 14 loci in 3 common diseases. Nat. Genet 44, 1294–1301 (2012). [DOI] [PMC free article] [PubMed] [Google Scholar]
- 34.Kichaev G & Pasaniuc B Leveraging functional-annotation data in trans-ethnic fine-mapping studies. Am. J. Hum. Genet 97, 260–271 (2015). [DOI] [PMC free article] [PubMed] [Google Scholar]
- 35.Ulirsch JC et al. Interrogation of human hematopoiesis at single-cell and single-variant resolution. Nat. Genet 51, 683–693 (2019). [DOI] [PMC free article] [PubMed] [Google Scholar]
- 36.Fu W et al. A multiply redundant genetic switch ‘locks in’ the transcriptional signature of regulatory T cells. Nat. Immunol 13, 972–980 (2012). [DOI] [PMC free article] [PubMed] [Google Scholar]
- 37.Chen L et al. Genetic drivers of epigenetic and transcriptional variation in human immune cells. Cell 167, 1398–1414.e24 (2016). [DOI] [PMC free article] [PubMed] [Google Scholar]
- 38.Giambartolomei C et al. Bayesian test for colocalisation between pairs of genetic association studies using summary statistics. PLoS Genet. 10, e1004383 (2014). [DOI] [PMC free article] [PubMed] [Google Scholar]
- 39.Ferreira RC et al. Functional IL6R 358Ala allele impairs classical IL-6 receptor signaling and influences risk of diverse inflammatory diseases. PLoS Genet. 9, e1003444 (2013). [DOI] [PMC free article] [PubMed] [Google Scholar]
- 40.Okada Y et al. Significant impact of miRNA–target gene networks on genetics of human complex traits. Sci. Rep 6, 22223 (2016). [DOI] [PMC free article] [PubMed] [Google Scholar]
- 41.Schellekens GA, de Jong BAW, van den Hoogen FHJ, van de Putte LBA & van Venrooij WJ Citrulline is an essential constituent of antigenic determinants recognized by rheumatoid arthritis–specific autoantibodies. J. Clin. Invest 101, 273–281 (1998). [DOI] [PMC free article] [PubMed] [Google Scholar]
- 42.Suzuki A et al. Decreased severity of experimental autoimmune arthritis in peptidylarginine deiminase type 4 knockout mice. BMC Musculoskelet. Disord 17, 205 (2016). [DOI] [PMC free article] [PubMed] [Google Scholar]
- 43.Seri Y et al. Peptidylarginine deiminase type 4 deficiency reduced arthritis severity in a glucose-6-phosphate isomerase-induced arthritis model. Sci. Rep 5, 13041 (2015). [DOI] [PMC free article] [PubMed] [Google Scholar]
- 44.Arita K et al. Structural basis for Ca2+-induced activation of human PAD4. Nat. Struct. Mol. Biol 11, 777–783 (2004). [DOI] [PubMed] [Google Scholar]
- 45.Nanda SK et al. ABIN2 function is required to suppress DSS-induced colitis by a Tpl2-independent mechanism. J. Immunol 201, 3373–3382 (2018). [DOI] [PMC free article] [PubMed] [Google Scholar]
- 46.Matmati M et al. A20 (TNFAIP3) deficiency in myeloid cells triggers erosive polyarthritis resembling rheumatoid arthritis. Nat. Genet 43, 908–912 (2011). [DOI] [PubMed] [Google Scholar]
- 47.Consortium GTEx. Genetic effects on gene expression across human tissues. Nature 550, 204–213 (2017). [DOI] [PMC free article] [PubMed] [Google Scholar]
- 48.Zhu Z et al. Integration of summary data from GWAS and eQTL studies predicts complex trait gene targets. Nat. Genet 48, 481–487 (2016). [DOI] [PubMed] [Google Scholar]
- 49.James EA et al. Citrulline-specific Th1 cells are increased in rheumatoid arthritis and their frequency is influenced by disease duration and therapy. Arthritis Rheumatol. 66, 1712–1722 (2014). [DOI] [PMC free article] [PubMed] [Google Scholar]
- 50.Takayanagi H et al. RANKL maintains bone homeostasis through c-Fos-dependent induction of interferon-β. Nature 416, 744–749 (2002). [DOI] [PubMed] [Google Scholar]
- 51.Takeuchi T et al. Effects of the anti-RANKL antibody denosumab on joint structural damage in patients with rheumatoid arthritis treated with conventional synthetic disease-modifying antirheumatic drugs (DESIRABLE study): a randomised, double-blind, placebo-controlled phase. Ann. Rheum. Dis 78, 899–907 (2019). [DOI] [PMC free article] [PubMed] [Google Scholar]
- 52.Nakatsuka K, Nishizawa Y & Ralston SH Phenotypic characterization of early onset Paget’s disease of bone caused by a 27-bp duplication in the TNFRSF11A gene. J. Bone Miner. Res 18, 1381–1385 (2003). [DOI] [PubMed] [Google Scholar]
- 53.Guerrini MM et al. Human osteoclast-poor osteopetrosis with hypogammaglobulinemia due to TNFRSF11A (RANK) mutations. Am. J. Hum. Genet 83, 64–76 (2008). [DOI] [PMC free article] [PubMed] [Google Scholar]
- 54.French DM et al. WISP-1 is an osteoblastic regulator expressed during skeletal development and fracture repair. Am. J. Pathol 165, 855–867 (2004). [DOI] [PMC free article] [PubMed] [Google Scholar]
- 55.Maeda A et al. WNT1-induced secreted protein-1 (WISP1), a novel regulator of bone turnover and Wnt signaling. J. Biol. Chem 290, 14004–14018 (2015). [DOI] [PMC free article] [PubMed] [Google Scholar]
- 56.Zhang F et al. Defining inflammatory cell states in rheumatoid arthritis joint synovial tissues by integrating single-cell transcriptomics and mass cytometry. Nat. Immunol 20, 928–942 (2019). [DOI] [PMC free article] [PubMed] [Google Scholar]
- 57.Ramos MIP et al. Absence of Fms-like tyrosine kinase 3 ligand (Flt3L) signalling protects against collagen-induced arthritis. Ann. Rheum. Dis 74, 211–219 (2015). [DOI] [PubMed] [Google Scholar]
- 58.Saevarsdottir S et al. FLT3 stop mutation increases FLT3 ligand level and risk of autoimmune thyroid disease. Nature 584, 619–623 (2020). [DOI] [PubMed] [Google Scholar]
- 59.Motegi T et al. Identification of rare coding variants in TYK2 protective for rheumatoid arthritis in the Japanese population and their effects on cytokine signalling. Ann. Rheum. Dis 78, 1062–1069 (2019). [DOI] [PubMed] [Google Scholar]
- 60.Brown BC, Asian Genetic Epidemiology Network Type 2 Diabetes Consortium, Ye, C. J., Price, A. L. & Zaitlen, N. Trans-ethnic genetic-correlation estimates from summary statistics. Am. J. Hum. Genet 99, 76–88 (2016). [DOI] [PMC free article] [PubMed] [Google Scholar]
- 61.Amariuta T et al. Improving the trans-ancestry portability of polygenic risk scores by prioritizing variants in predicted cell-type-specific regulatory elements. Nat. Genet 52, 1346–1354 (2020). [DOI] [PMC free article] [PubMed] [Google Scholar]
- 62.Amariuta T et al. IMPACT: genomic annotation of cell-state-specific regulatory elements inferred from the epigenome of bound transcription factors. Am. J. Hum. Genet 104, 879–895 (2019). [DOI] [PMC free article] [PubMed] [Google Scholar]
- 63.Roadmap Epigenomics Consortium. Integrative analysis of 111 reference human epigenomes. Nature 518, 317–330 (2015). [DOI] [PMC free article] [PubMed] [Google Scholar]
- 64.Finucane HK et al. Heritability enrichment of specifically expressed genes identifies disease-relevant tissues and cell types. Nat. Genet 50, 621–629 (2018). [DOI] [PMC free article] [PubMed] [Google Scholar]
- 65.Chun S et al. Limited statistical evidence for shared genetic effects of eQTLs and autoimmune-disease-associated loci in three major immune-cell types. Nat. Genet 49, 600–605 (2017). [DOI] [PMC free article] [PubMed] [Google Scholar]
- 66.van der Wijst MGP et al. Single-cell RNA sequencing identifies celltype-specific cis-eQTLs and co-expression QTLs. Nat. Genet 50, 493–497 (2018). [DOI] [PMC free article] [PubMed] [Google Scholar]
- 67.Kumasaka N, Knights AJ & Gaffney DJ High-resolution genetic mapping of putative causal interactions between regions of open chromatin. Nat. Genet 51, 128–137 (2019). [DOI] [PMC free article] [PubMed] [Google Scholar]
- 68.Gutierrez-Arcelus M et al. Allele-specific expression changes dynamically during T cell activation in HLA and other autoimmune loci. Nat. Genet 52, 247–253 (2020). [DOI] [PMC free article] [PubMed] [Google Scholar]
- 69.Baglaenko Y, Macfarlane D, Marson A, Nigrovic PA & Raychaudhuri S Genome editing to define the function of risk loci and variants in rheumatic disease. Nat. Rev. Rheumatol 17, 462–474 (2021). [DOI] [PMC free article] [PubMed] [Google Scholar]
- 70.Arnett FC et al. The American Rheumatism Association 1987 revised criteria for the classification of rheumatoid arthritis. Arthritis Rheum. 31, 315–324 (1988). [DOI] [PubMed] [Google Scholar]
- 71.Aletaha D et al. 2010 Rheumatoid arthritis classification criteria: an American College of Rheumatology/European League Against Rheumatism collaborative initiative. Arthritis Rheum. 62, 2569–2581 (2010). [DOI] [PubMed] [Google Scholar]
- 72.Akiyama M et al. Characterizing rare and low-frequency height-associated variants in the Japanese population. Nat. Commun 10, 4393 (2019). [DOI] [PMC free article] [PubMed] [Google Scholar]
- 73.Zhang W et al. Whole genome sequencing of 35 individuals provides insights into the genetic architecture of Korean population. BMC Bioinf. 15, S6 (2014). [DOI] [PMC free article] [PubMed] [Google Scholar]
- 74.Lan T et al. Deep whole-genome sequencing of 90 Han Chinese genomes. GigaScience 6, gix067 (2017). [DOI] [PMC free article] [PubMed] [Google Scholar]
- 75.Wong L-P et al. Deep whole-genome sequencing of 100 southeast Asian Malays. Am. J. Hum. Genet 92, 52–66 (2013). [DOI] [PMC free article] [PubMed] [Google Scholar]
- 76.Wakefield J A Bayesian measure of the probability of false discovery in genetic epidemiology studies. Am. J. Hum. Genet 81, 208–227 (2007). [DOI] [PMC free article] [PubMed] [Google Scholar]
- 77.Rumble JM, Fackelman EM & Mobley JL Comparative analyses of PAD expression and activity in myeloid cell lines. J. Immunol 198, 75.18 (2017). [Google Scholar]
- 78.Picelli S et al. Full-length RNA-seq from single cells using Smart-seq2. Nat. Protoc 9, 171–181 (2014). [DOI] [PubMed] [Google Scholar]
Associated Data
This section collects any data citations, data availability statements, or supplementary materials included in this article.
Supplementary Materials
Data Availability Statement
We deposited six sets of summary statistics (multi-ancestry, EUR-GWAS and EAS-GWAS for all RA and seropositive RA) to the GWAS Catalog under accession IDs GCST90132222, GCST90132223, GCST90132224, GCST90132225, GCST90132226 and GCST90132227. We deposited the PRS model (multi-ancestry PRS with CD4+ T cell T-bet IMPACT annotation) to the Polygenic Score (PGS) Catalog; the publication ID is PGP000357, and the score ID is PGS002745. Summary statistics and the PRS model are also available at https://data.cyverse.org/dav-anon/iplant/home/kazuyoshiishigaki/ra_gwas/ra_gwas-10-28-2021.tar. The UK Biobank analysis was conducted via application no. 47821.
The codes are available at our website (https://github.com/immunogenomics/RA_GWAS) and archived in Zenodo (https://doi.org/10.5281/zenodo.6999289).


