

Abstract
Natural killer (NK) cell kill infected, transformed and stressed cells when an activating NK cell receptor is triggered1. Most NK cells and some innate lymphoid cells express the activating receptor NKp46, encoded by NCR1, the most evolutionarily ancient NK cell receptor2,3. Blockage of NKp46 inhibits NK killing of many cancer targets4. Although a few infectious NKp46 ligands have been identified, the endogenous NKp46 cell surface ligand is unknown. Here we show that NKp46 recognizes externalized calreticulin (ecto-CRT), which translocates from the endoplasmic reticulum (ER) to the cell membrane during ER stress. ER stress and ecto-CRT are hallmarks of chemotherapy-induced immunogenic cell death5,6, flavivirus infection and senescence. NKp46 recognition of the P domain of ecto-CRT triggers NK cell signalling and NKp46 caps with ecto-CRT in NK immune synapses. NKp46-mediated killing is inhibited by knockout or knockdown of CALR, the gene encoding CRT, or CRT antibodies, and is enhanced by ectopic expression of glycosylphosphatidylinositol-anchored CRT. NCR1)-deficient human (and Nrc1-deficient mouse) NK cells are impaired in the killing of ZIKV-infected, ER-stressed and senescent cells and ecto-CRT-expressing cancer cells. Importantly, NKp46 recognition of ecto-CRT controls mouse B16 melanoma and RAS-driven lung cancers and enhances tumour-infiltrating NK cell degranulation and cytokine secretion. Thus, NKp46 recognition of ecto-CRT as a danger-associated molecular pattern eliminates ER-stressed cells.
Ncr1-deficient mice are impaired in tumour immunosurveillance and have more severe influenza A, metapneumovirus, reovirus, Candida glabrata, pneumococcus and fusobacterium infections and graft-versus-host disease3. The known NKp46 target cell ligands are pathogen products such as viral haemagglutinins and fungal adhesins. Although NK cells recognize stressed and senescent cells, the stress and senescence ligands of activating NK cell receptor (NKR) on NK cell targets are largely unknown1,3. Exceptions are the MIC/ULBP family ligands of NKG2D induced by some infections and genotoxic stress.
NK cells recognize ZIKV and ER stress
Human peripheral blood NK cells degranulated and killed ZIKV-infected, but not uninfected, human choriocarcinoma JEG-3 cells (Fig. 1a,b). Killing was cytotoxic granule mediated because Ca++ chelation inhibited it (data not shown). ZIKV replicates in the ER and causes ER stress7 like the ER stressor tunicamycin, which we verified by measurement of ER-stress messenger RNAs, BIP, CHOP and spliced XBP1 (Fig. 1c). NK cells do not degranulate or kill JEG-3 cells infected with cytomegalovirus8 or herpes simplex virus 2 (HSV-2), which do not cause ER stress9. Induction of ER stress and NK cell killing of ZIKV-infected and tunicamycin-treated JEG-3 cells were blocked by the eIF2α dephosphorylation and ER-stress inhibitor, salubrinal10 (Fig. 1c,d). NK cell killing of ZIKV-infected JEG-3 cells was inhibited to varying extents by ER stress inhibitors—strongly by the S1P inhibitor PF429242, which inhibits ATF6 activation, and weakly by the PERK inhibitor GSK2606414, but not significantly by the IRE1-α inhibitor 4μ8C or tauroursodeoxycholic acid (Extended Data Fig. 1a). Thus, human NK cells are triggered to kill by recognizing specific features of ER stress.
Fig. 1:

NK cells recognize ZIKV-infected and ER-stressed target cells.
a, Representative flow cytometry plots (leD) and percentage of degranulating NK cells isolated from the blood of ten healthy donors (right), as measured by surface CD107a, in response to uninfected and ZIKV-infected JEG-3 cells (8 h coculture, E:T ratio 1:3). b, NK cell-specific killing of uninfected and ZIKV-infected JEG-3 cells. c, ER stress, as assessed by XBP1 splicing (leD) and increases in BIP (middle) and CHOP (right) mRNA, in JEG-3 cells that were uninfected or infected with ZIKV, HSV-2 or human cytomegalovirus (HCMV) for 1–2 days or treated with tunicamycin (Tu) for 1 day. Indicated samples were pretreated with the ER stress inhibitor salubrinal (n = 3 samples). mRNA levels, as assayed by quantitative PCR with reverse transcription (RT–qPCR), were normalized to ACTB. d, Effect of salubrinal pretreatment of target cells on NK cell killing of ZIKV-infected (top) and tunicamycin-treated (bobom) JEG-3 cells (n = 6 samples). e, Effect of NKR-blocking antibodies (Ab) on NK cell killing of uninfected or ZIKV-infected JEG-3 cells (n = 3–7 samples). Ctrl, control. f, Specific killing of the classical NK cell target 722.221 cells, or of uninfected or ZIKV-infected JEG-3 cells by human NK cell line YT cells knocked out for NCR1 or NCR3 or treated with control single-guide RNAs (n = 3–6 samples). g, Representative flow cytometry histogram (leD) and mean fluorescence intensity (MFI) of NKR–Ig fusion protein (NKp46–Ig and NKG2D–Ig) binding to uninfected or ZIKV-infected JEG-3 cells (right) (n = 3 samples). b,d–f, Specific killing assessed by 8 h 51Cr release assay using an E:T ratio of 10:1 unless otherwise indicated. Data are mean ± s.e.m. of at least three independent experiments or technical replicates. Statistics were performed using two-tailed, nonparametric, unpaired t-test (a,b), one-way analysis of variance (ANOVA) (c), two-way ANOVA (e–g) or area under the curve followed by one-way ANOVA (d). *P < 0.05, **P < 0.01, ***P < 0.001, ****P < 0.0001.
NKp46 recognizes ZIKV-infected cells
To identify which activating NKRs are responsible for killing ZIKV-infected JEG-3 cells, the cytotoxicity of peripheral blood NK cells was assessed in the presence of blocking antibodies to NKp46, NKp30, NKp80, NKG2D, DNAM-1 and 2B4 (Fig. 1e). Blocking of NKp46 strongly and significantly inhibited NK killing, suggesting that NKp46 recognizes ZIKV infection. Blocking NKp80 had a weak, but significant, effect on killing, but blocking antibodies to other activating NKR had no significant effect. We therefore focused on NKp46. To confirm that NKp46 recognizes ZIKV, the human NK cell line YT was knocked out for NCR1 encoding NKp46, or for NCR3 encoding NKp30 (Extended Data Fig. 1b,c; two knockout clones gave similar results (not shown)). Although neither NCR1 nor NCR3 knockout significantly affected YT cell killing of the classical NK cell target 721.221, NCR1−/− YT cells killed around twofold fewer ZIKV-infected JEG-3 cells than control YT cells transfected with nontargeting sgRNAs (Fig. 1f). NCR3 knockout did not significantly change killing. When uninfected or ZIKV-infected JEG-3 cells were incubated with the extracellular domains of NKp46 or NKG2D fused to the Fc region of human IgG1 (NKp46–Ig, NKG2D–Ig), NKp46–Ig, but not NKG2D–Ig, selectively bound to ZIKV-infected JEG-3 cells (Fig. 1g and Extended Data Fig. 1d). Thus, NKp46 recognizes ZIKV-infected cells and activates NK cell killing.
NKp46 binds to ecto-CRT
To identify putative NKp46 ligands, NKp46–Ig and NKG2D–Ig were used to pull down crosslinked ligands on ZIKV-infected JEG-3 cell membranes (Fig. 2a and Extended Data Fig. 2a). NKp46–Ig pulled down a single, high-molecular-mass band that was absent in the NKG2D–Ig pulldown. Mass spectrometry identified the ER chaperones, CRT and protein disulfide isomerases (PDI, PDIA1 and PDIA3) in the NKp46–Ig band. (Two lower-molecular-mass bands in the NKp46–Ig pulldown did not contain NKp46–Ig but contained fragments of protein A and BSA, which were judged contaminants.) CRT and PDI selectively translocate and associate on the cell surface during ER stress through a poorly understood mechanism5. CRT and PDI cell surface staining increased with ZIKV infection or tunicamycin, but Hsp70 staining did not change (Fig. 2b). To test whether NKp46 senses ecto-CRT and/or PDI, we exploited the fact that untreated JEG-3 cells express little ecto-CRT but the immunogenic cell death (ICD)-causing chemotherapy drug oxaliplatin induces ER stress and CRT externalization (Fig. 2c). NKp46–Ig pulled down CRT from oxaliplatin-treated, but not from untreated, JEG-3 cells, but neither NKp44–Ig nor NKp30–Ig pulled down CRT from either (Fig. 2d). As a specificity control, HLA-G, expressed on the JEG-3 cell surface, was not pulled down by any fusion protein. Thus, NKp46 selectively binds to a complex that contains ecto-CRT.
Fig. 2:

NKp46 recognizes the P domain of ecto-CRT.
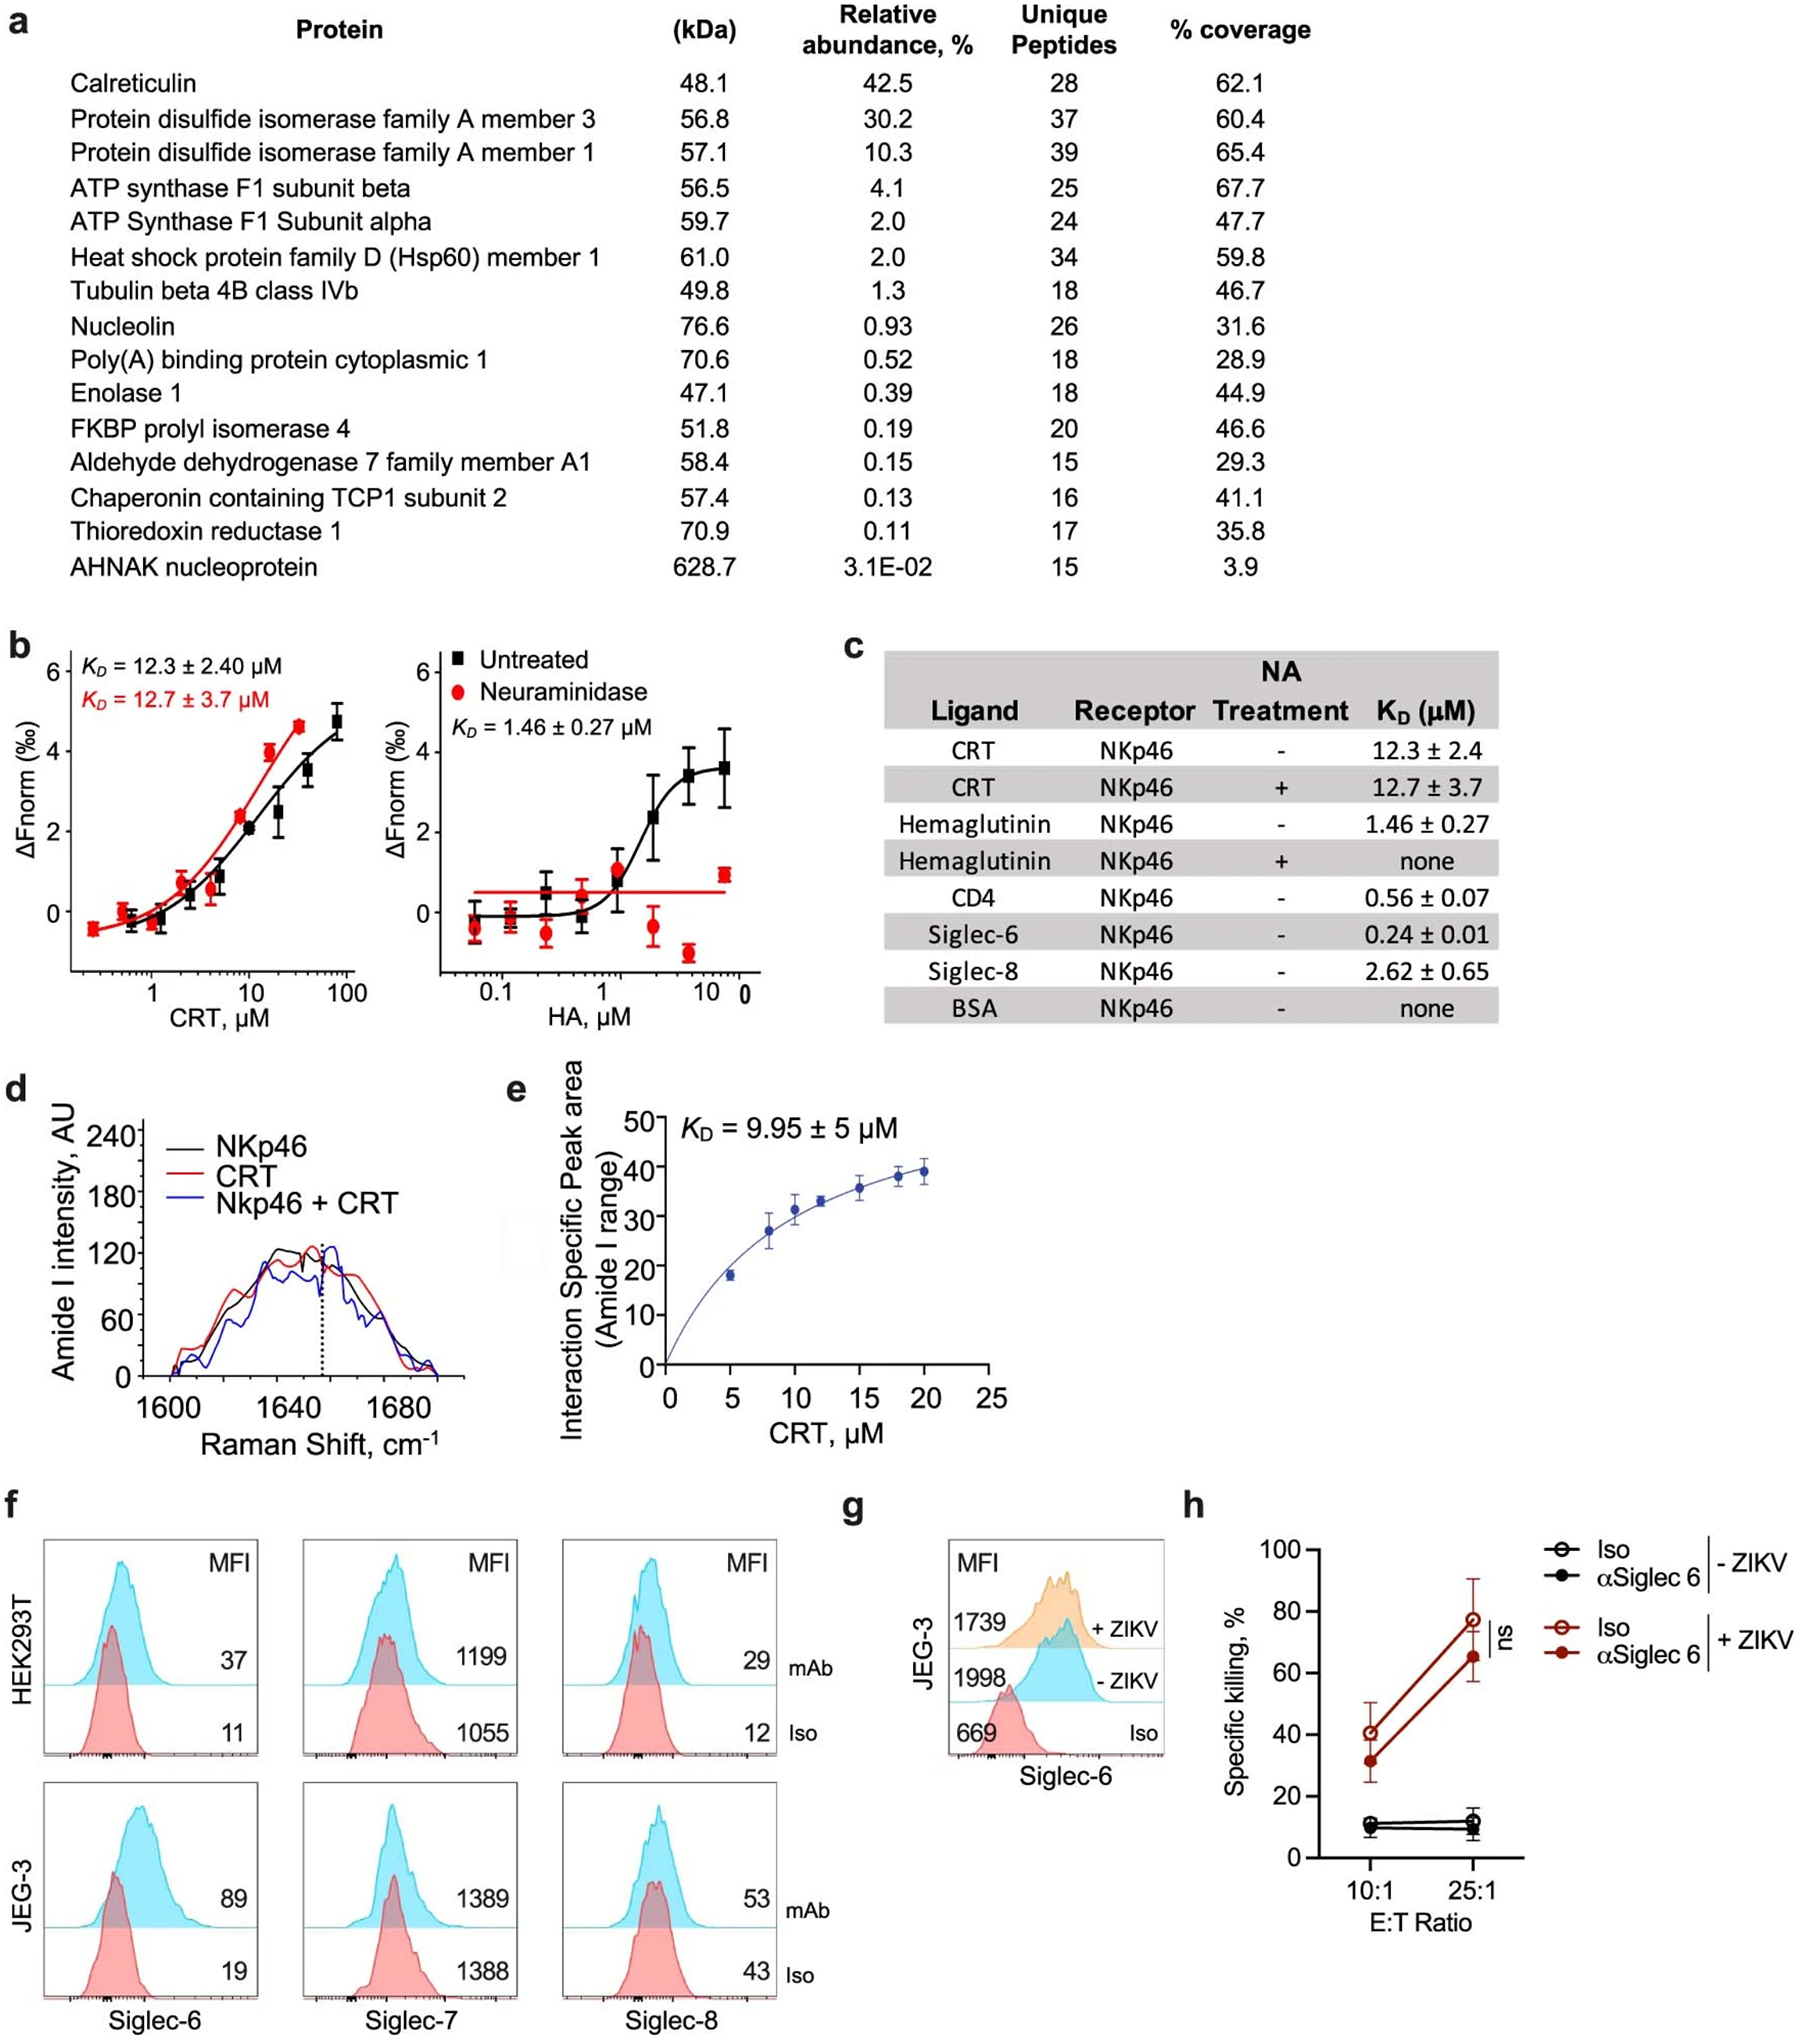
a, Immunoblot of proteins pulled down and chemically crosslinked with NKG2D–Ig or NKp46–Ig. The high-molecular-mass band in ZIKV-infected cells (red arrowhead) was analysed by mass spectrometry for candidate NKp46 ligands. Proteins with the highest peptide coverage are indicated. The ZIKV-specific NKp46–Ig pulldown low-molecular-mass bands contained contaminating BSA and protein A, but not NKp46–Ig, peptides. b, Representative flow cytometry histograms of surface CRT, PDI and HSP70 on untreated (UT), tunicamycin or ZIKV-infected JEG-3 cells (left) and percentage of cells staining in three independent samples (right). Iso, isotype control antibody staining. c, Flow cytometry histograms of ecto-CRT on untreated or oxaliplatin-treated JEG-3 cells (left) and percentage of ecto-CRT+ cells staining (right, n = 3 samples). d, CRT immunoblot of NKp46–Ig, NKp44–Ig or NKp30–Ig pulldown of the membrane-enriched fraction of untreated or oxaliplatin-treated JEG-3 cells. HLA-G was probed as control. e, Phosphoflow cytometry of CD56+ WT or NCR1−/− YT cells incubated for 15 min with untreated or oxaliplatin-treated JEG-3 cells in the presence of anti-CRT or control antibody stained for p-CD3ξ (left), p-Syk (middle) and p-Tyr (right). YT cells were preincubated with anti-NKG2D to reduce NKG2D signalling. n = 2 independent samples; statistics compare untreated or oxaliplatin-treated samples and those preincubated with anti-CRT or Iso. f, Schematic of CRT domains: signal peptide, black; N domain, red; P domain, white; C domain, grey. FL or CRT domains were fused with a C-terminal Fc-tag (green) (left). CRT-Fc proteins incubated with MYC tagged NKp46 were pulled down with anti-MYC and immunoblot was probed with anti-Fc. g, Alexa:647-labelled NKp46-MYC binding to Fc-tagged CRT domains analysed by MST; dissociation constants (Kd) of NKp46 binding to FL and P domain are shown. h, BLI kinetic binding of NKp46–Ig to His-tagged CRT. Binding of NKp46–Ig, captured on anti-human IgG-Fc biosensors, was recorded for three CRT concentrations. Mean Kd of three independent experiments, each with two replicates, is indicated. i–k, WT and CALR−/− HEK293T and CALR−/− HEK293T rescued with EV or CALR were untreated or tunicamycin- or oxaliplatin-treated and analysed by flow cytometry for ecto-CRT (n = 2 samples) (i), NKp46–Ig binding (n = 2 samples) (j) and human peripheral blood NK cell killing (n = 3 samples) (k). l, Representative flow cytometry histograms of ecto-CRT and NKp46–Ig binding (left) and MFI (right) of two individual samples of oxaliplatin-treated CALR−/− HEK293T cells transfected with EV or to express WT or mutated CALR. m, Human peripheral blood NK cell killing of untreated or oxaliplatin-treated CALR−/− HEK293T transfected as in l (n = 5 samples). k,m, Killing by 4 h 51Cr release assay. m, E:T ratio 10:1. a,d,f–h, Data representative of three independent experiment. Data are mean ± s.e.m. Statistics were performed using either one-way ANOVA (b,e,i,j,l,m), two-tailed parametric unpaired t-test (c) or two-way ANOVA (k). *P < 0.05, **P < 0.01, ***P < 0.001, ****P < 0.0001.
NKp46–CRT binding triggers NK cell signalling
To determine whether ecto-CRT binding activates NKp46, CD3ζ and Syk phosphorylation and overall p-Tyr were measured in wild-type (WT) and NCR1−/− YT cells incubated with untreated or oxaliplatin-treated JEG-3 cells in the presence of anti-NKG2D to block NKG2D signalling (Fig. 2e). CD3ζ, Syk and Tyr phosphorylation increased in WT, but not NCR1 knockout, YT cells exposed to oxaliplatin-treated JEG-3 cells and anti-CRT-inhibited phosphorylation. Thus, ecto-CRT binding activates downstream NKp46 signalling.
NKp46 binds to the CRT P domain
Calreticulin has three domains: an N-terminal globular chaperone domain, a proline-rich P domain responsible for most protein interactions and a C-terminal acidic Ca++-binding domain that has an ER retention signal11 (Fig. 2f). To determine which domain NKp46 recognizes, full-length (FL) CRT and its domains fused to the Fc region of human Ig were incubated with MYC-tagged NKp46 (Fig. 2f). Both FL and P domain CRT, but not the N or C domains, were pulled down with NKp46. Microscale thermophoresis (MST) quantified the strength of the NKp46–CRT interaction (Fig. 2g). MYC-tagged NKp46 bound to Fc-tagged FL and P domain CRT, but not N or C CRT, with respective dissociation constants, Kd, of 28.7 ± 8.3 and 41.2 ± 1.46 μM. Thus, NKp46 binds to the CRT P domain. Binding of NKp46–Ig to His-tagged CRT was around eightfold weaker than that to the known viral ligand, influenza haemagglutinin (CRT P domain, Kd 12.3 ± 2.4 μM; haemagglutinin, 1.46 ± 0.27 μM; Extended Data Fig. 2b,c). Although haemagglutinin (HA)-tagged NKp46 binding depends on NKp46 sialylation, neuraminidase treatment of NKp46 did not significantly affect CRT binding. Biolayer interferometry (BLI) of immobilized NKp46–Ig with His-tagged CRT recorded a lower Kd of 3.6 ± 0.2 μM (Kon = 2,239 ± 72 M−1 s−1, Koff = 8.0 ± 0.4 10−2 s−1; Fig. 2h).
Raman spectroscopy confirmed NKp46–CRT binding (Extended Data Fig. 2d,e). A unique peak at 1,658 cm−1 in the amide I region of the Raman spectrum was detected in CRT–NKp46 mixtures. Hyperbolic fitting of the peak area versus CRT concentration provided a Kd estimate of 9.95 ± 5 μM, similar to values obtained by MST and BLI. Thus NKp46 binding to CRT was confirmed using three biophysical methods with Kd in the low micromolar range, which is weaker than the binding constants of NKp46 to other ligands and of ligand-binding constants for other NKRs, but within the range of T cell receptor Kd12.
NKp46 binds to CD4 and Siglecs
A recent proteomics study suggested that NKp46 interacts with CD4 and Siglec-6–8, sialic acid-binding proteins13. MST experiments confirmed NKp46 binding to CD4, Siglec-6 and Siglec-8 with Kd of 0.56 ± 0.07, 0.24 ± 0.01 and 2.62 ± 0.65 μM, respectively (Extended Data Fig. 2c). To assess whether these ligands activate NKp46-mediated killing, we first analysed Siglec-6–8 expression in two cancer cell lines, JEG-3 and HEK293T cells (Extended Data Fig. 2f,g). Although HEK293T did not express these Siglecs, JEG-3 cells expressed Siglec-6 independently of ZIKV infection. NK cell killing of ZIKV-infected JEG-3 cells was unaltered by both anti-Siglec-6 and control antibody (Extended Data Fig. 2h), suggesting that although Siglec-6 binds more tightly to NKp46 than ecto-CRT, Siglec-6 may not be an important NK cell activator. Siglec expression is mostly limited to haematopoietic cells, including NK cells14. The biological significance of Siglec binding to NKp46 and whether it affects CRT binding and NK cell activation may be complex. Because NK cells generally recognize stressed, infected or transformed cells and CD4 and Siglec expression do not change with stress or cancer, it is unlikely that these ligands activate NKp46 and NK cell killing, which would risk killing normal cells. In addition, Siglecs have ITIM, rather than ITAM, motifs that inhibit rather than activate immune signalling. Siglec expression could inhibit NKp46-mediated killing of haematopoietic cells, and their coexpression with NKp46 on NK cells might suppress NK cell self-killing. Deciphering the role of NKp46–Siglec and NKp46–CD4 interactions will require further study.
CRT D237 and D258 promote NKp46 binding
The NKp46 ectodomain consists of two immunoglobulin domains connected by an interdomain hinge15 (Extended Data Fig. 3a). In homologous lectin receptors, ligand binding is mediated by charge interactions in the hinge region. The CRT P domain and other structurally related chaperones bind to a variety of proteins by charge interactions of the negatively charged tip of a hairpin formed by proline-rich modules (Extended Data Fig. 3b). Residue D258 at the tip of the CRT P domain plays an important role in P domain interactions11. Modelling of CRT interaction with NKp46 suggested that the CRT P domain inserts into an NKp46 hinge region channel bounded by conserved R160 and K170 residues and is grasped between the NKp46 Ig-like domains (Extended Data Fig. 3c–e). In the modelled complex, positively charged R160, K170, R166 and H197 in NKp46 form salt bridges with CRT P domain residues D258, S231, D237 and E270, respectively (Extended Data Fig. 3d,e). The predicted binding energy (ΔG = −10 kcal mol–1 at 298 K) and dissociation constant (Kd = 19.9 ± 3.4 μM), calculated from an ensemble of docked conformations, were consistent with the measured binding constants (Fig. 2g,h and Extended Data Fig. 2b–e).
To identify CRT residues that mediate binding, CALR was knocked out in HEK293T and CRT expression was rescued with WT CALR or CALR mutants encoding for Ala mutations of conserved acidic residues either in the P domain tip (D237, D244, D246, D258 or E270) (Extended Data Fig. 3f) or deleted of the P domain (ΔP) (Extended Data Fig. 4a,b). Ectopic WT or mutated CALR expression in CALR−/− HEK293T did not induce ecto-CRT or NKp46–Ig binding under basal conditions (Extended Data Fig. 4b). After tunicamycin or oxaliplatin treatment, ecto-CRT was not detected on CALR−/− or empty vector (EV)-complemented CALR−/− cells but was detected at comparable levels on WT and CALR-complemented CALR−/− HEK293T (Fig. 2i). Both tunicamycin and oxaliplatin also significantly increased NKp46–Ig binding and pNK killing of WT and CALR-complemented CALR−/− HEK293T cells, but not CALR−/− or EV-complemented CALR−/− cells (Fig. 2j,k). Oxaliplatin did not induce ecto-CRT on CALR−/− HEK293T, but ecto-CRT was detected at comparable levels for all rescued constructs (Fig. 2l). NKp46–Ig binding did not occur above background to oxaliplatin-treated CALR−/− HEK293T, but was rescued by WT, D244A, D246A or E279A CALR (Fig. 2l). Binding was not rescued by ΔP, D237A or D258A or D237AD258A CALR, confirming the P domain binding site and the importance of CRT D237 and D258 in NKp46 binding (Fig. 2l). Importantly, pNK did not significantly kill oxaliplatin-treated CALR−/− HEK293T but did significantly kill all knockout cells rescued with CRT mutants that retained NKp46–Ig binding, but none of the cells rescued with binding-deficient CRT mutants (Fig. 2m). Thus, D237 and D258 in the CRT P domain mediate NKp46 binding and NK killing.
CALR knockdown and anti-CRT inhibit NK cell killing
To confirm ecto-CRT–NKp46 binding, NKp46–Ig binding and NK cell killing of ZIKV-infected JEG-3 cells were compared in cells with knockdown of CALR and/or PDIA3 or treated with nontargeting small interfering RNA (Extended Data Fig. 4c–g). CALR and PDIA3 knockdown did not change surface major histocompatibility complex (MHC)-I on uninfected JEG-3 cells, but CALR KD reduced ecto-CRT on ZIKV-infected JEG-3 cells by about 65% and PDIA3 knockdown also modestly reduced ecto-CRT by about 20%, which were expected because PDI facilitates CRT exposure after ER stress16. CALR, but not PDIA3, knockdown modestly, but significantly, reduced NKp46–Ig binding to ZIKV-infected cells and NK cell killing (Extended Data Fig. 4f,g). The weaker inhibition of NK cell killing by CALR KD in ZIKV-infected JEG-3 cells compared with CALR knockout in HEK293T (Fig 2m and Extended Data Fig. 4g) is likely because knockdown is incomplete and lymphocyte receptors are sensitive to low ligand levels. Knockdown of both CALR and PDIA3 was not significantly different from knocking down only CALR.
The importance of ecto-CRT in NKp46 binding and killing of ZIKV-infected JEG-3 cells was also evaluated using blocking antibodies to CRT, NKp46, PDI or an isotype control antibody (Extended Data Fig. 4h,i). Anti-CRT, but not anti-PDI, significantly reduced both NKp46–Ig binding and NK cell killing. Anti-CRT and anti-NKp46 similarly inhibited killing, but combining them did not significantly increase inhibition, consistent with ecto-CRT–NKp46 binding. Thus, NKp46 binding to ecto-CRT triggers NK cell killing.
NKp46 binds to mouse ecto-CRT
NKp46 is the only natural cytotoxicity receptor expressed in mice. To determine whether mouse NKp46 also recognizes ER-stressed cells by binding to ecto-CRT, B16-F10 melanoma (referred to hereafter as B16) treated or not with oxaliplatin or cisplatin, which is not an ICD drug, was analysed for ecto-CRT by flow cytometry. Both untreated and cisplatin-treated B16 poorly expressed ecto-CRT whereas it was strongly induced by noncytotoxic oxaliplatin concentrations (Fig. 3a). Both drugs upregulate NKG2D stress ligands17. Mouse splenic NK cell killing of untreated, oxaliplatin- or cisplatin-treated B16 was assessed in the presence or absence of CRT or NKp46-blocking antibody (Fig. 3b). NK cell killing of oxaliplatin- and cisplatin-treated B16 was enhanced by around twofold compared with untreated cells. The low level of baseline killing of untreated B16 was similarly inhibited by CRT or NKp46 antibodies. Blocking of CRT or NKp46 strongly inhibited killing of oxaliplatin-treated B16 but did not significantly affect killing of cisplatin-treated B16, which did not expose ecto-CRT. Consistently, NK cell killing of untreated B16 was significantly reduced when Ncr1−/− splenic NK cells, but not Klrk1−/− NK cells (deficient in NKG2D), were substituted for WT NK cells. Killing of oxaliplatin-treated B16 by splenic NK cells from Ncr1−/− mice was strongly reduced compared with that by WT splenic NK cells, but killing of cisplatin-treated B16 was not significantly changed (Fig. 3c). By contrast, NKG2D-deficient splenic NK cells less effectively killed cisplatin-treated B16 but killed both oxaliplatin-treated B16 and WT NK cells. Thus, NKp46 recognition of ecto-CRT contributes to killing of B16 treated with an ICD, but not a non-ICD, drug (Fig. 3c).
Fig. 3:

NKp46 recognition of ecto-CRT enhances immune synapse formation and NK cell killing of tumour cell lines.
a, Representative flow cytometry histograms of ecto-CRT (left) and MFI (right) of UT, cisplatin (CP)- and oxaliplatin (OP)-treated B16 (n = 3 samples). Iso, isotype control antibody staining. b, Effect of anti-CRT, anti-NKp46 and control antibody (Iso) on mouse splenic NK cell killing of untreated, cisplatin- and oxaliplatin-treated B16 (n = 3 or 5 samples). c, Killing of B16 by splenic NK cells from WT, Ncr1−/− and Klrk1−/− mice that were either untreated or treated with cisplatin or oxaliplatin (n = 3 or 5 samples). d, Representative flow cytometry histograms of CRT surface expression (left) and ecto-CRT MFI of three samples (right) of a polyclonal B16 cell line stably transfected with EV or to express GPI-linked CRT. e, Effect of ectopic ecto-CRT on mouse NKp46–Ig binding to B16. f, WT or Ncr1−/− splenic NK cell killing of EV or GPI-CRT-B16 (n = 3 samples). b,c,f, Killing assessed by 4 h 51Cr release, E:T ratio 10:1. g,h, Imaging flow cytometry of conjugates of splenic WT or Ncr1−/− NK cells with B16 that were untreated or oxaliplatin-treated (g) or transfected with EV or GPI-CRT plasmid (h). Shown are representative images of conjugates (left) and the percentage of cells forming NK–target cell conjugates (right). Cells were stained with CellTracker Red CMTPX (blue), anti-NKp46 (red), anti-CD49b (violet) or anti-CRT (green). Data shown are representative of around 1,000 individual images and of at least three independent experiments. Data are mean ± s.e.m. Statistics by unpaired one-way ANOVA (a–c), two-tailed parametric unpaired t-test (d,e), two-way ANOVA (f) or two-sided Chi-squared test (g,h). *P < 0.05, **P < 0.01, ***P < 0.001, ****P < 0.0001.
Engineered ecto-CRT triggers NK cell killing
To confirm that mouse ecto-CRT triggers NKp46, B16 were transfected to stably express CRT with a C-terminal glycosylphosphatidylinositol (GPI) anchor to generate a B16-GPI-CRT line18. Cell surface CRT on engineered polyclonal B16-GPI-CRT increased dramatically compared with cells transfected with EV, but was only around twofold higher than oxaliplatin-induced endogenous levels (Fig. 3a,d). B16-GPI-CRT clones expressed ecto-CRT more highly and homogenously than the polyclonal cell line (Extended Data Fig. 5a). Even though CRT is involved in MHC class I folding and antigen presentation, ectopic ecto-CRT did not significantly affect surface MHC-I as assayed by H-2Kb staining (Extended Data Fig. 5b). Ectopic ecto-CRT also did not alter in vitro proliferation of B16-GPI-CRT clones but slightly, but significantly, increased colony formation (Extended Data Fig. 5c,d). B16-GPI-CRT also migrated significantly more and were more invasive in Transwell assays than WT or EV B16 (Extended Data Fig. 5e,f). These experiments suggest that ecto-CRT might increase B16 malignancy.
Ectopic ecto-CRT significantly increased mouse NKp46–Ig binding to engineered polyclonal B16-GPI-CRT (Fig. 3e). Consistently, WT splenic NKcells killed B16-GPI-CRT more than EV-transfected cells but Ncr1−/− NK cell killing was independent of ecto-CRT (Fig. 3f), indicating that NKp46 binding to ecto-CRT activates mouse NK cells.
The CRT P domain is highly conserved in both mouse and human (97.3% identity with perfect conservation of the NKp46-binding region; Extended Data Fig. 3f). To test whether the mouse CRT P domain interacts with mouse NKp46 as in humans, B16-expressing WT and mutant (D237A, D244A, D258A and ΔP) GPI-anchored mouse CRT were assayed for ecto-CRT, NKp46–Ig binding and splenic NK cell killing (Extended Data Fig. 3g,h). Although all mutants expressed CRT similarly, NKp46–Ig binding and NK cell killing increased only for cells expressing WT or D244A CRT, but not for cells expressing GPI-CRT mutated for residues that abrogated binding to human NKp46. Thus in mice, as in humans, conserved Asp residues in the CRT P domain control NKp46 binding.
NKp46 and CRT colocalize at the synapse
To confirm ecto-CRT as an NKp46 ligand, the number of splenic NK-B16 conjugates formed with oxaliplatin-treated B16 or B16-GPI-CRT was compared with untreated or EV-transfected B16 by imaging flow cytometry (Fig. 3g,h). Conjugates increased by around tenfold after oxaliplatin treatment or ectopic GPI-CRT expression. Moreover, conjugates with ecto-CRT+ B16 showed capping of NKp46 and the integrin CD49b on NK cells with CRT on the target. No capping was visualized in the few conjugates formed with ecto-CRT− B16. When Ncr1−/− splenic NK cells were substituted for WT NK cells, the number of conjugates dropped to baseline. These data confirm that NKp46 recognizes ecto-CRT.
NKp46–CRT binding inhibits B16 tumours
To probe whether NKp46 recognition of ecto-CRT provides tumour protection, B16-EV or B16-GPI-CRT clones were implanted subcutaneously in WT and Ncr1−/− mice (Fig. 4a–c and Extended Data Fig. 6a–c). Although B16-EV tumours grew similarly in WT and Ncr1−/− mice, B16-GPI-CRT growth was suppressed in WT, but not in Ncr1−/−, mice (Fig. 4a). The potent in vivo effect of ecto-CRT ectopic expression in controlling tumours in WT mice was similar to that achieved by expression of NKG2D ligands detailed in a classic paper that identified NKG2D ligands19. Three weeks after tumour implantation, the numbers of tumour-infiltrating NK cells, CD8 T lymphocytes and tumour-associated macrophages did not significantly differ in B16-EV or B16-GPI-CRT tumours in WT and Ncr1−/− mice, but there were twice as many tumour-associated dendritic cells in Ncr1−/− mice as in WT mice bearing B16-GPI-CRT tumours (Extended Data Fig. 6a). More tumour-infiltrating NK cells in WT mice bearing B16-GPI-CRT tumours stained for perforin (PFN) and secreted interferon-γ (IFNγ) and tumour necrosis factor (TNF) than in Ncr1−/− mice (Extended Data Fig. 6b, c). The only significant change in the CD8+ TIL phenotype in B16 tumour-bearing mice was reduced numbers of PFN+ CD8+ cells in Ncr1−/− mice bearing B16-EV tumours. CD8 T cell depletion of WT or Ncr1−/− mice before implantation of B16-EV or B16-GPI-CRT tumours had no significant effect on tumour growth (Fig. 4b and Extended Data Fig. 6d), suggesting that NKp46–ecto-CRT-mediated protection is CD8 T cell independent, which is not surprising because CD8 T cells do not express NKp46.
Fig. 4:

NKp46 recognition of ecto-CRT suppresses tumour growth and is activated during senescence.
a–c, Tumour growth monitored in WT (a), Iso (b) and Ncr1−/− mice (c) injected subcutaneously with EV or GPI-CRT-B16 clones. b, Mice were treated with Iso or anti-CD8a. c, Splenic WT NK cells were adoptively transferred weekly (magenta arrowheads) beginning 4 d after tumour inoculation. a,b, n = 6 mice per group; c, n = 5 mice per group. d, EV or GPI-CRT-B16 was injected intravenously into WT and Ncr1−/− mice (n = 4 mice per group) treated with either anti-NK1.1, anti-CSF1R or Iso before and during tumour growth to deplete NK cells or macrophages. Visible lung metastases were counted on day 20. e–g, Effect of in vitro trametinib and palbociclib (T + P) on senescence, ER stress and expression of NK-activating ligands on mouse KP. Shown are representative flow cytometry histograms of SA-βgal (left) and MFI of three cell samples (right) (e), RT–qPCR of Xbp1 splicing and Bip and Chop mRNA (f) and CRT and RAE1 expression (g) (n = 3 samples). h, In vitro killing by splenic WT, Ncr1−/− or Klrk1−/− NK cells of KP that were either untreated or treated with T + P (4 h 51Cr release, E:T ratio 20:1, n = 3 samples). i–k, Effect of oral T + P on KP scubcutaneous tumours implanted in WT, Ncr1−/− and Klrk1−/− mice (n = 5–7 mice per group). Shown are tumour growth (i) and NK cell TIL GzmB and PFN (j) and cytokine production (k) at euthanization. i, Statistical differences in growth of T + P-treated KP tumours in different mouse strains were: WT versus Ncr1−/−, P < 0.0001); WT versus Klrk1−/−, not significant (NS)) and Ncr1−/− versus Klrk1−/−, P = 0.005). Data are mean ± s.e.m. of at least three independent experiments. Statistics calculated by area under the curve followed by two-tailed nonparametric unpaired t-test (a–c,i), one-way ANOVA (d,j,k), two-tailed nonparametric unpaired t-test (e) or two-way ANOVA (f–h). *P < 0.05, **P < 0.01, ***P < 0.001, ****P < 0.0001.
To further assess NKp46-mediated antitumour activity, 106 splenic NK cells from WT mice, expanded in vitro with IL-15 for 7 days, were adoptively transferred into Ncr1−/− mice bearing B16-EV or B16-GPI-CRT subcutaneous tumours (Fig. 4c and Extended Data Fig. 6e). Adoptive transfer of WT NK cells did not affect B16-EV tumours but strongly suppressed B16-GPI-CRT tumours in Ncr1−/− mice, providing additional evidence that NKp46 potently suppresses ecto-CRT+ tumours.
NKp46–CRT binding reduces B16 metastasis
Ecto-CRT is an ‘eat me’ signal for myeloid cell phagocytosis, which can augment antigen presentation and tumour control20. To investigate whether NKp46–CRT binding controls metastasis and which immune cells are important, lung metastases were counted 3–4 weeks after intravenous injection of B16-EV and B16-GPI-CRT into WT or Ncr1−/− mice treated with NK- or myeloid cell-depleting or control antibodies (Fig. 4d and Extended Data Fig. 6f). In control antibody-treated WT mice, the number of B16-GPI-CRT metastases (1.0 ± 1.4) was significantly lower than B16-EV metastases (14.5 ± 3.8), but metastases increased greatly (99.8 ± 18.8) in NK cell-depleted mice and GPI-CRT expression no longer significantly conferred protection. By contrast, myeloid cell depletion did not significantly affect B16-EV or B16-GPI-CRT growth in WT mice. These data indicate that NK cells were responsible for suppression of ecto-CRT+ tumours in WT mice. Both B16-EV and B16-GPI-CRT metastases in control antibody-treated Ncr1−/− mice increased significantly compared with WT mice. In Ncr1−/− mice, B16-GPI-CRT metastasized more than B16-EV, perhaps reflecting the slight increase in colony formation, migration and invasivity of B16-GPI-CRT compared with B16-EV in vitro (Extended Data Fig. 5c–e). Myeloid cell depletion in Ncr1−/− mice increased B16-EV and B16-GPI-CRT metastases by around twofold. Thus, NKp46 on NK cells dominates protection from B16 metastases in WT mice, but myeloid cell protection is uncovered when NK cells lack NKp46.
NKp46 boosts NK cell immunity induced by doxorubicin
To evaluate whether NKp46–ecto-CRT interactions help clear drug-treated tumours, WT and Ncr1−/− mice bearing WT B16 tumours were treated with the ICD drug, doxorubicin (DOX)21 (Extended Data Fig. 7a). CRT externalization by DOX was secondary to ER stress—it was significantly inhibited by either GSK2606414 or 4μ8C (Extended Data Fig. 7b). DOX significantly reduced B16 growth in WT but not in Ncr1−/−, mice (Extended Data Fig. 7c). Although the numbers of tumour-infiltrating immune cells in untreated or DOX-treated WT and Ncr1−/− mice did not significantly change 3 weeks after tumour implantation, GzmB and PFN staining and degranulation of tumour-infiltrating NK cells increased in WT but not in Ncr1−/−, mice (Extended Data Fig. 7d–g). DOX did not significantly alter tumour-infiltrating NK cell cytokine production in either WT or Ncr1−/− mice. DOX also increased CD8+ TIL IFNγ secretion more strongly in WT than in Ncr1−/− mice but increased the number of TNF-producing CD8+ cells only in Ncr1−/− mice. Thus, NKp46 enhances the antitumour immunity of an ICD drug.
NKp46 binds ecto-CRT on senescent cells
Although NK cell recognition of senescence helps control tumour growth22, how NK cells recognize senescent cells is unknown. ER stress regulates senescence in RAS-driven tumours23. The MEK inhibitor trametinib and CDK4/6 inhibitor palbociclib (T + P) induce senescence and ER stress in the KRAS-mutant human lung cancer A549 (ref. 22, which we confirmed by measurement of senescence-associated beta-galactosidase (SA-βgal) activity (Extended Data Fig. 8a) and XBP1 splicing and BIP and CHOP mRNAs, respectively (Extended Data Fig. 8b). T + P also induced surface expression of CRT, the NKG2D ligands (MICA/B)24 and ICAM-1 (ref. 22) (Extended Data Fig. 8c), which suggested that both NKp46 and NKG2D might mediate NK cell killing of senescent A549. Untreated A549 were barely killed by WT or NCR1−/− YT cells (Extended Data Fig. 8d,e). T + P potently induced WT YT cell killing of A549 in the presence of control antibodies and blocking of NKp46, CRT or NKG2D, but not NKp30, significantly reduced killing (Extended Data Fig. 8d,e). Blocking both NKp46 and NKG2D reduced WT YT cell killing to background, indicating that NKp46 and NKG2D are the main activating receptors in NK cell killing of T + P-treated A549. By contrast, NCR1-deficient YT cells were much less potent than WT YT cells at eliminating T + P-treated A549 and anti-CRT did not affect their killing (Extended Data Fig. 8e). Thus, T + P-treated senescent A549 externalize both NKG2D and NKp46 ligands to activate NK cell killing.
To determine whether mouse NKp46 similarly recognizes ecto-CRT on T + P-treated senescent mouse tumours, mouse splenic NK cells were used to kill KP lung cancer lines from p53-deficient mice expressing mutant KRAS25. T + P induced senescence in KP as measured by SA-βgal (Fig. 4e), ER stress (Fig. 4f) and externalized CRT and RAE1, a mouse NKG2D ligand (Fig. 4g). Splenic NK cells from WT mice barely killed untreated KP but were highly cytolytic against T + P-treated KP (Fig. 4h). However, splenic NK cells from Ncr1−/− and Klrk1−/− mice, deficient in NKp46 and NKG2D, respectively, impaired killing compared with NK cells proficient in both activating NKR, indicating that both receptors recognized T + P-treated KP. T + P strongly suppressed KP tumours in WT mice but tumour growth was not significantly slowed in Ncr1−/− mice (Fig. 4i). NKp46 more effectively controlled T + P-treated tumour growth than NKG2D because T + P-treated KP tumours grew significantly more slowly in Klrk1−/− than in Ncr1−/− mice (P = 0.005). Thus, T + P-treated senescent human and mouse RAS-driven lung tumours are recognized by both NKp46 and NKG2D. Although the numbers of tumour-infiltrating immune cells did not significantly change in T + P-treated mice (Extended Data Fig. 9a), PFN, IFNγ and TNF were significantly increased in tumour-infiltrating NK cells in T + P-treated WT mice but only IFNγ significantly increased in Ncr1−/− mice. Staining of both IFNγ and TNF increased significantly in Klrk1−/− mice (Fig. 4j,k). T + P did not significantly change CD8+ TIL functional parameters (Extended Data Fig. 9b,c). Thus, recognition by NKp46 and NKG2D of T + P-treated senescent lung cancers enhances NK antitumour functions and tumour control, but NKp46 may be somewhat more important.
To determine whether NKp46 recognition of senescent cells depends on ER stress and ecto-CRT, KP were treated with two other senescence inducers, CuSO4 and 4-phenyl-3-butenoic acid (4-PBA); CuSO4, but not 4-PBA, reportedly induces ER stress26,27. Both compounds increased SA-βgal activity (Extended Data Fig. 10a) but only CuSO4 induced ER stress (Extended Data Fig. 10b). Ecto-CRT and surface RAE1 were strongly induced by CuSO4, whereas 4-PBA induction was much weaker (Extended Data Fig. 10c). CuSO4 significantly increased in vitro KP killing by splenic NK cells from WT mice but NK cells from Ncr1−/− or Klrk1−/− mice were significantly less active, indicating that both activating receptors contributed to killing (Extended Data Fig. 10d). 4-PBA treated KP cells were weakly killed by splenic NK cells. 4-PBA-induced killing was dependent only on NKG2D because killing by Ncr1−/−, but not by Klrk1−/−, NK cells increased. Thus, NK cells do not efficiently kill all senescent cells: NK cell killing of senescent tumour cells is enhanced by ER stress and NKp46 recognition of ecto-CRT in the tumour.
Discussion
Here we show that NKp46 directly recognizes ecto-CRT on cells undergoing ER stress triggered by multiple inducers (ZIKV, tunicamycin, ICD-inducing chemotherapy (oxaliplatin, DOX) and senescence). The identification of ER stress and its cell surface indicator ecto-CRT as the endogenous ligand of the evolutionarily most ancient NK-activating ligand NKp46 makes sense and fits the hypothesis that activation of NKR senses cellular stress28. NKG2D, which recognizes a variety of cellular stresses (including ER stress)29, also contributed to NK cell activation by senescent cells and other chemotherapy drugs (such as cisplatin). Identification of ecto-CRT as the endogenous NKp46 ligand by pulldown and mass spectrometry was confirmed by in vitro binding to recombinant proteins, by cellular experiments using CRT-blocking antibody, CALR knockout and knockdown, ectopic expression of GPI-CRT on target cells and by knocking out NCR1/Ncr1 in a human NK cell line and in mice. Ectopic ecto-CRT or induction of ecto-CRT by DOX treatment of a melanoma cell line, and T + P treatment of a RAS-driven lung cancer line, greatly reduced tumour growth in an Ncr1-dependent manner. The presence of NKp46 on NK cells and ecto-CRT on the tumour increased NK cell TIL functionality (cytotoxic protein expression and cytokine secretion).
Endoplasmic reticulum stress is caused by many disease processes30. Infection with both DNA and RNA viruses induces ER stress, and some viruses have developed strategies to counter this host response. Other ER-stress-inducing viruses, including other flaviviruses that replicate in the ER, such as DENV and hepatitis C, will undoubtedly expose ecto-CRT and be recognized by NKp46. In fact, high expression of NKp46 on liver NK cells has been linked to better hepatitis C outcome31. Stresses in tumours, including hypoxia and disruption of proteostasis in lymphomas and myelomas, also cause ER stress, which could recruit and activate NK cell immunosurveillance. Metabolic dysregulation in diabetes and obesity also causes ER stress32. Future studies of ecto-CRT and its recognition by NKp46 on NK cells and innate lymphoid cells in different disease settings will enhance understanding of how this innate immune response contributes to disease control and pathogenesis. Our experiments did not identify a specific ER stress pathway required for CRT externalization, suggesting that additional work is needed to understand how ER stress causes CRT exposure.
Irradiation and some anticancer drugs, such as oxaliplatin and anthracyclines, like DOX, induce ICD, which influences whether therapy is curative (at least in mice) by elimination of cancer cells that survive the treatment5. Tumour ER stress and ecto-CRT are hallmarks of ICD. The dominant immune protective mechanism in ICD was thought to be ecto-CRT promotion of tumour phagocytosis by antigen-presenting cells to activate antitumour CD8+ T cell cross-priming33. Our findings suggest that NKp46-mediated NK cell killing of ecto-CRT-expressing cancer cells is also important in ICD-related tumour immune control. In fact, in some situations NK recognition of ecto-CRT may be the most important immune mechanism behind ICD protection. For example, protection against B16 and KP was largely abrogated in Ncr1−/− mice, suggesting that NKp46-mediated NK killing dominates immune protection in those models.
Ecto-CRT is probably not the only endogenous NKp46-activating ligand—some of the other proteins identified in the NKp46–Ig pulldown could also be ligands. A proteomics identification of a ligand is only the first step in showing the physiological significance of a receptor–ligand interaction. The identification of ecto-CRT as an endogenous activating ligand here goes well beyond the initial proteomics. Although the Kd for NKp46–CRT binding was only in the low micromolar range, strong cellular, biophysical, genetic and in vivo data demonstrated that ecto-CRT is a physiologically relevant activating NKp46 ligand. Interactions of similar or even weaker strength, such as those involving TCR–peptide–MHC and CD40–CD40L interactions, mediate important immuno-logical responses12. Low-affinity interactions on cells can be overcome by the avidity of multiple interactions of the same receptor–ligand and/or by combining them with other receptor–ligand interactions.
Natural killer cells play an important role in tumour immunosurveillance34,35. NK cell immunity is compromised as tumours develop—generally a relatively small number of NK cells infiltrate tumours and become ‘exhausted’ as tumours progress. Nonetheless, harnessing NK cell immunity for cancer immunotherapy using adoptively transferred NK cells or chimeric antigen receptor NK cells has recently shown promise. Limited understanding of the endogenous ligands that activate NK cells impedes research and translational efforts to augment NK cell immunity. Our identification of ecto-CRT as an important trigger for NK recognition of infected and cancer cells should provide new therapeutic approaches for exploiting and enhancing NK cell immunity. The development of therapies to enhance NK immunity will be facilitated by understanding the molecular mechanisms responsible for ecto-CRT exposure.
Methods
Cell lines
JEG-3, A549, 721.221, HFF, Vero, HEK293T and B16 cells were provided by the American Type Culture Collection (ATCC). YT cells were a gift of Z. Brahmi. The KP cell line was obtained from T. Jacks25. Cell lines were recent passages and were periodically tested for mycoplasma; flow cytometry was used to confirm cellular identity by cell surface markers. Cell lines 721.221 and YT were cultured in RPMI 1640, and JEG-3, A549, HFF, Vero, 293T, B16 and KP cells were cultured in DMEM. All media were supplemented with 10% fetal calf serum (FCS), 1% penicillin/streptomycin and 1% l-glutamine.
Viruses
ZIKV PRVABC59 strain (Puerto Rico, 2015) was obtained from the Arbovirus Branch of the Centers for Disease Control and Prevention. HSV-2 was obtained from ATCC. HCMV AD169 (IE-1-GFP) was a gift of D. Coen, Harvard Medical School (HMS). ZIKV stocks were propagated in DMEM supplemented with 2% heat-inactivated fetal bovine serum (FBS) in Vero. ZIKV titres were determined by plaque assay on Vero incubated for 3 days using a 1.2% Avicel (no. RC-59INF, FMC Corp.) overlay. HCMV was propagated in HFF in DMEM supplemented with 3% FBS and supernatants were collected 8 days post infection. HCMV titres were determined by counting green fluorescent protein+ foci on HFF 2 days post infection using a 1.2% methylcellulose (Sigma) overlay. HSV-2 was grown in Vero and viral titres were determined by plaque assay in Vero.
Antibodies and reagents
Antibodies and reagents used were: donkey-anti-mouse Alexa Fluor 488, LIVE/DEAD Fixable Violet Dead Cell Stain, purified mouse anti-human HLA-A, B, C (clone W6/32), Alexa Fluor 647 anti-human CD54 Antibody (clone HCD54), APC anti-human CD337 (NKp30, clone P30–15), PerCP-Cy5.5 anti-human Siglec-8 (clone 7C9), PE anti-human Siglec-7 (clone 6–434), Alexa Fluor 488 anti-Hsp70 (clone W27), anti-human CD56 -PE and -Pacific Blue (clone HCD56), CD107a-PerCP-Cy5.5 (clone H4A3), purified mouse IgG1, IgG1-FITC, IgG1-PE, IgG1-APC, IgG1-PerCP-Cy5.5, IgG1-PE-Cy7, IgG1-APC-Cy7 (clone MOPC-21), purified mouse IgG2a, IgG2a-FITC, IgG2a-Alexa Fluor 700 (clone MOPC-173), anti-mouse B220-PE (clone RA3–6B2) and CD45-PE-Cy7 (clone 30-F11) (all BioLegend); MICA/B-Alexa Fluor 700 (no. 159207) (R&D Systems); anti-mouse CD3e-PerCP (clone 145–2C11), CD8-PerCP (clone 53–6.7) and IFNγ-APC (clone XMG1.2) (all BD); anti-mouse CD8-eFluor 710 (clone 53–6.7), CD62L-APC (clone MEL-14), CD44-PE (clone IM7), CD4-eFluor 450 (clone RM4–5) and NKp46-PE (clone 29A1.4) (all eBioscience); FITC-AffiniPure goat anti-human IgG (Jackson Immunoresearch); Alexa Fluor 647 anti-mouse RAE1-γ (clone CX1, BioLegend); FITC anti-mouse H-2Kb (clone AF6–88.5, BioLegend); Alexa Fluor 488 anti-phospho-Syk (clone pY348), Alexa Fluor 647 anti-phospho-CD3-zeta (clone pY142) and PE anti-phosphotyrosine (all BD Biosciences); goat anti-mouse IgG Fab recombinant secondary antibody (Invitrogen); anti-NKp46 (clone 9E2), APC anti-human Siglec-6 (clone REA852) (Miltenyi Biotec); anti-mouse CD8 mAb (clone 2.43), rabbit anti-mouse NK1.1 and anti-CSF1R, control antibody (no. LTF-2) (all BioXCell); rabbit anti-human CRT (no. ab2907, Abcam); mouse monoclonal anti-CRT (clone MAB38981, R&D Systems; FMC 75, Thermo); PDIA3 rabbit polyclonal Ab (no. A1085, Abclonal); polyclonal anti-NKp46 antibody (no. LS-C806753, LSBio); anti-human Siglec-6 (clone Mab239–90, Creative Biolabs); Alexa Fluor 488 mouse IgG1 isotype control (clone MOPC-21); PE mouse IgG1 isotype control (clone MOPC-21); Alexa Fluor 647 mouse IgG1 isotype control (clone MOPC-21), PerCP-Cy5.5 mouse IgG1 isotype control (clone MOPC-21), Alexa Fluor 488 mouse IgG2a isotype control (clone MOPC-173), Alexa Fluor 647 mouse IgG2b isotype control (BioLegend, clone MPC-11) and Pacific Blue mouse IgG2b isotype control (BioLegend, clone MPC-11). For antibody list, see Supplementary Table 1.
Fusion proteins NKp44–Ig (no. 2249-NK), NKG2D–Ig (no. 1299-NK) and mouse NKp46–Ig (no. 2225-NK) were obtained from R&D Systems. Also used were NKp30-Ig (ACROBiosystems), haemagglutinin His-tag (Sino Biological), human CD4-His-tag, Siglec-8-His-tag (ACROBiosystems), Siglec-6-His-tag (Creative Biolabs), 4μ8C, GSK2606414, PF429242 (MedChemExpress), trametinib (LC Laboratories), palbociclib (LC Laboratories), CuSO4 (Sigma), tunicamycin (Sigma), 4-PBA (Santa Cruz Biotechnology), cisplatin (Cayman Chemical), oxaliplatin (Cayman Chemical), doxorubicin (Sigma), salubrinal (Sigma), EGTA (Sigma), α2–3,6,8,9 neuraminidase A (NEB), LB Broth (BD Difco), LB Agar (BD Difco), ampicillin sodium salt (Sigma), CellEvent Senescence Green Flow Cytometry Assay Kit (Invitrogen) and Cytofix/Cytoperm (BD Biosciences). NKp46–Ig (from O. Mandelboim) and R&D Systems (no. 1850-NK) were used for flow cytometry. NKp46–Ig (ACROBiosystems) was used for MST and BLI experiments.
Isolation of primary human and mouse NK cells
Human NK cells were isolated from discarded Leukopaks from healthy volunteer blood donors using the RosetteSep human NK cell enrichment protocol (StemCell Technologies), followed by Ficoll (GE Health-care) density gradient centrifugation (20 min, 800g) and culture for 12–18 h in X-VIVO 10 TM medium (Lonza) supplemented with gentamicin, 5% human AB serum (Corning) and 2.5 ng ml–1 recombinant human IL-15 (R&D Systems). Mouse NK cells were isolated from splenocytes obtained after mechanical dissociation of spleens and passage through a 40 μm sieve (BD Labware), using a NK cell magnetic purification kit (Miltenyi Biotec). Mouse NK cells were cultured in RPMI 1640 supplemented with 10% FCS, 1% penicillin/streptomycin, 1% l-glutamine (Gibco), 2.5 ng ml–1 recombinant mouse IL-15 and 100 units of IL-2 (R&D Systems).
Infection and tunicamycin treatment of cell lines
JEG-3 cells were infected with ZIKV for 1 h in DMEM (Gibco) with 2% FCS at a multiplicity of infection (MOI) of 2.0. Virus was aspirated and fresh culture medium added. Infected cells were cultured for the indicated times before harvesting for assay. In some cases, JEG-3 cells were pretreated with 10 μM salubrinal (Sigma) for 1 h before infection, and salubrinal was retained in the culture medium post infection. JEG-3 cells were infected with MOI 0.5 HSV-2 for 1 h, then medium was aspirated and cells cultured in fresh medium for 1 or 2 days. For HCMV infection, cells were spinoculated (1 h, 2,800 rpm) with MOI 4.0 virus, which was maintained during 12 h of culture at 37 °C. Spinoculation and culture were repeated once or twice to enhance infection rates, and then medium was aspirated and cells cultured in fresh medium for 12 h before harvesting. In some experiments, cells were treated with 0.5 μg ml–1 tunicamycin for 24 h, with or without salubrinal pretreatment 1 h earlier. Salubrinal was retained in culture throughout tunicamycin treatment.
Flow cytometry
For surface staining, cells were stained for 30 min on ice in the dark with LIVE/DEAD-Violet stain (1:1,000) and then with primary antibodies for 15–30 min in PBS and 2% FCS (followed by secondary antibodies, when applicable, for 20 min). For protein–Ig staining, cells were incubated with 50 μg ml–1 fusion protein for 1 h at 4 °C and then stained with fluorescent-anti-human IgG for 1 h. Cells were fixed in 1% paraformaldehyde (Affymetrix) for 10 min before flow cytometry. Flow cytometry was assessed on gated live cells (Supplementary Fig. 1). For intracellular staining, cells were fixed and permeabilized using the CytoFix/CytoPerm kit. One of the treated samples was used for isotype staining, and MFI of staining with the isotype control antibody was subtracted from MFI of the specific antibody. Analysis was performed on a FACSCanto II (BD). BD FACSDiva 8.0 (BD) software was used for data collection, with analysis performed using FlowJo v.10.4.2 (TreeStar).
RT–qPCR
Total RNA was extracted using the RNeasy Mini kit (Qiagen), treated with DNase (Life Technologies) and reverse transcribed using 2 μg of total RNA, 50 ng of random hexamers, 400 nM dNTPs and 200 U of SuperScript II reverse transcriptase (Invitrogen). Primers and diluted complementary DNA samples were prepared with Power SYBR Green PCR Master Mix (Applied Biosystems). Amplification cycles using the iQ5 system (BioRad) were 95 °C for 10 min then 40 cycles at 95 °C for 10 s and 55 °C for 30 s. Results were normalized to ACTB, Actb or 18S RNA as indicated. Primer sequences are provided in Supplementary Table 2.
Generation of NCR1 (NKp46) and NCR3 (NKp30) knockout cell lines by CRISPR–Cas9
Single-guide RNAs targeting the fourth exon of NCR1 (conserved in the two longest isoforms of NCR1 with transcript ID: ENST00000594765) and the third exon of NCR3 (conserved in three of the four longest isoforms of NCR3 with transcript ID: ENST00000376073) were designed and cloned into the lentiCRISPR V2 vector (Addgene, no. 52961; sgRNA sequences shown in Supplementary Table 2). Lentiviruses were produced in HEK293T using standard protocols. To generate stable cell lines, YT cells (5 × 10⁵) were infected by spinoculation with viruses for each CRISPR sgRNA using either an empty lentiCRISPR V2 or a lentiCRISPR V2 containing a nonspecific sgRNA (random sgRNA) as control. Infected cells were selected (puromycin 2 μg ml–1, 3 weeks) and single clones were sorted into 96-well plates using an IMI5L cell sorter (BD Biosciences). Clones were grown under selection for 3–4 weeks and tested for gene knockout by DNA sequencing and immunostaining and flow cytometry. For both NCR1 and NCR3, two individual clones were generated from one or two independent sgRNAs for further experiments. One clone of the nonspecific sgRNA (random sgRNA) was randomly chosen as control cells. To determine allele-specific mutations, genomic DNA was extracted from each clone, amplified with specific primers to the target sgRNA, cloned into the CloneJET PCR cloning kit, transformed into bacteria and at least three single bacterial colonies were sequenced.
NK cell functional assays
Natural killer cell killing of 721.221 and JEG-3 cells—infected or not for 48 h or treated with Tu for 24 h with or without salubrinal pretreatment or with 100 μM oxaliplatin or 25 μM cisplatin for 12 h—was analysed by 8 h 51Cr release assay using the indicated E:T ratios, performed in the presence of 2.5 ng ml–1 IL-15 (R&D Systems). NK cell killing of CALR−/− HEK293T transfected with EV or WT or mutant CALR was analysed by 4 h 51Cr release assay using an E:T ratio of 10:1. Killing of JEG-3 cells, ZIKV-infected or not for 48 h, was analysed by 8 h 51Cr release assay using an E:T ratio of 25:1. Mouse splenic NK cell killing of B16-expressing EV or WT GPI-CRT or mutated GPI-CRT or treated with oxaliplatin or cisplatin was analysed by 4 h 51Cr release assay using an E:T ratio of 10:1. Mouse splenic NK cell killing of senescent KP (treated for 6 days with trametinib (25 nM) and palbociclib (500 nM), and either 250 μM CuSO4 for 1 day or 500 μM 4-PBA for 6 days) was measured by 8 h 51Cr release assay using an E:T ratio of 10:1.
To block NK cell receptors, NK cells were pretreated for 30 min at 37 °C with blocking or control antibodies that were maintained during coculture (20 μg ml–1 purified antibodies to NKp46 (clone 9E2), NKp30 (clone P30–15), 2B4 (clone C1.7), NKp80 (clone5D12, BioLegend), DNAM-1 (clone 102511, R&D), NKG2D (clone 1D11, BioLegend), anti-human Siglec-6 (clone Mab239–90, Creative Biolabs) or mouse IgG1 (clone MOPC-21, BioLegend) as control. To block ecto-CRT, polyclonal rabbit anti-human CRT (ab2907, Abcam) was used. To measure degranulation, NK cells were cocultured for 8 h with target cells in the presence of CD107a-PerCP-Cy5.5 antibody (clone H4A3, BioLegend, 250 ng ml–1) and 2.5 ng ml–1 IL-15 (R&D). To measure intracellular cytokine production, 2 μM monensin (BioLegend) and 3 μM brefeldin A (BD) were added after 1 h of coculture and cells harvested 7 h later. Cells were stained for surface markers, followed by permeabilization with Cytofix/Cytoperm (BD Biosciences) and intracellular cytokine staining.
Pulldown assay
Membrane proteins from ZIKV-infected or uninfected JEG-3 cells were isolated using the Mem-PER Plus Kit (ThermoFisher Scientific) according to the manufacturer’s protocol. The diluted membrane fraction (300 μl in PBS) was incubated with 20 μg of either NKp46–IgG1Fc or NKG2D–IgG1Fc fusion protein at 4 °C with rotary agitation for 16 h and then incubated with 2 mM of DTSSP crosslinker (ThermoFisher Scientific) for 2 h on ice. The reaction was stopped with 20 mM Tris pH 7.5. The reaction mixture was incubated with 100 μl of proteinA/G-coupled Sepharose beads at 4 °C with rotary agitation for 4 h. The beads were centrifuged and washed three times with wash buffer (10 mM Tris pH 7.4, 1 mM EDTA, 150 mM NaCl, 1% Triton X-100 and Protease inhibitor cocktail (Roche)). The beads were heated at 95 °C in 100 μl of 2× SDS loading buffer, samples were analysed by SDS–polyacrylamide gel electrophoresis and excised bands were analysed by mass spectrometry.
Membrane proteins from oxaliplatin-treated or untreated JEG-3 cells or purified Fc-tagged FL or truncated domains of CRT were incubated with 20 μg of NKp46-MYC fusion proteins at 4 °C with rotary agitation for 16 h, and then with 100 μl of anti-MYC-coupled magnetic beads (Genscript) at 4 °C with rotary agitation for 4 h. The beads were magnetically separated and washed three times with wash buffer, then heated at 95 °C in 100 μl of 2× SDS loading buffer and the samples analysed by SDS–PAGE electrophoresis and immunoblot. Full scan blots are shown in Supplementary Fig. 2.
Phosphoflow cytometry analysis of NKp46 signalling
JEG-3 cells (5 × 10⁶), pretreated with oxaliplatin for 4 h at 37 °C and with 10 μg ml–1 anti-CRT or isotype control antibody for 30 min, were incubated for 15 min at 37 °C with WT or NCR1−/− YT cells (106), pretreated for 30 min with 10 μg ml–1 anti-NKG2D. Cells were then fixed with Phosflow Fix Buffer I and permeabilized with Phosflow Perm Buffer III (BD Bioscience) and stained for CD56, p-CD3ζ, p-Syk and p-Tyr before flow cytometry analysis on gated CD56+ cells.
Protein expression and purification
The FL or truncated N, P and C domain coding sequences of human CRT were cloned into the pCMV vector (Addgene plasmid no. 59314) to generate recombinant constructs with C-terminal Human IgG1Fc (Fc) tags. The extracellular domain of NKp46 was cloned into either pcDNA MYC-His 3.1a vector (Invitrogen) or pCMV vector (Addgene plasmid no. 59314) to generate a recombinant construct with a C-terminal MYC or Fc tag. All plasmids were verified by DNA sequencing and transfected into HEK293T. Recombinant proteins were purified as previously described36. cDNA clones of human CALR and NCR1 were obtained from the DF/HCC DNA Resource Core at HMS, and the primers used are given in Supplementary Table 2.
MST
Purified human MYC- or Fc-tagged NKp46 was labelled with Alexa 647 using the microscale protein labelling kit (ThermoFisher Scientific). Alexa 647-labelled NKp46-MYC (50 nM) in MST buffer (50 mM HEPES, 150 mM NaCl, 0.05% Tween-20) was mixed with 0–100 μM Fc-tagged FL or N, P or C domains of CRT or other recombinant His-tagged ligands and incubated at room temperature for 30 min to achieve binding equilibrium. The reaction mixtures were taken up into MST capillaries and measurements were acquired using a Monolith NT.115 (NanoTemper Technologies). Data were fit using the Hill equation, and Kd values were determined using MO.Affinity Analysis software (NanoTemper Technologies). Sialic acid was removed from protein NKp46 by treatment with neuraminidase A for 1 h at 37 °C.
BLI
Biolayer interferometry measurements were performed on an Octet N1 (Sartorius) at room temperature. Kinetic measurements were performed in 50 mM HEPES pH 7.4, 150 mM NaCl and 0.05% (v/v) Tween-20. Before use, anti-hIgG Fc Capture (AHC) biosensors (Sartorius) were prehydrated in buffer for 10 min. Buffer was applied to AHC tips for 60 s before 0.1 μM NKp46–Ig was immobilized to them over 320 s. After immobilization, a baseline of 60 s was recorded followed by association of His-tagged CRT (Sino Biological) over 320 s. Dissociation followed association for 320 s. Following subtraction from reference experiments, curves were fit with GraphPad Prism v.9.1.2.
Raman spectroscopy
Raman spectroscopy was carried out using a Horiba XploRa confocal Raman microscope. Spectra were collected using a 785 nm laser (approximately 41 mW) at 1 cm−1 resolution. The spectrometer slit was set to 200 μm with 500 μm aperture; 20 μM NKp46 was mixed with 5–20 μM CRT in sodium phosphate buffer in 20 μl. Acquisition was carried out at room temperature in triplicate samples.
Spectral readouts were normalized to the sharp peak at 330 cm−1. The fluorescent baseline was fit using a polynomial fit and subtracted before peak deconvolution was performed in Labspec 6. The change in peak area at around 1,658 cm−1 (obtained after Lorentzian fitting in the AmideI deconvolution step for each acquisition) was plotted against CRT concentration. The peak at 1,658 cm−1 was chosen as the marker for interaction in the Raman spectrum of the amide I region because it was found to be a characteristic of NKp46–CRT interaction. A hyperbolic model was used to calculate a Kd value. The quality of the model used to fit the data was assessed by calculation of the R2 value, which was 0.907.
Molecular modelling and docking
Using NKp46 and CRT sequences, model structures were generated using the threading technique by the stand-alone version of I-TASSER. Energy minimization and other subsequent processing were carried out using GROMACS v.4.5 and Chiron before initiation of molecular docking. Molecular docking was performed using ClusPro v.2.0, which works on an ensemble pipeline involving fast Fourier transform-based global sampling and the PIPER algorithm, followed by a clustering technique to find highly populated clusters of minimal energy, and then by CHARM energy minimization to avoid steric clashes37. Docked complexes were further subjected to energy minimization to remove steric clashes with Chiron. The docked complex selected for subsequent analysis was screened using lowest cluster-energy principles. The interaction energy between two proteins in PIPER was calculated using the formula E = 0.40Erep + (−0.40Eatt) + 600Eelec + 1.00EDARS. Erep and Eatt represent repulsive and attractive contributions, respectively, to van der Waals interaction energy, Eelec denotes an electrostatic energy term and EDARS denotes pairwise structure-based potential and primarily represents desolvation contributions—that is, the free energy change due to removal of water molecules from the interface. To denote the potential contributions of charged residues in stabilization of the NKp46–CRT interaction, surface charges in the bound complexes were rendered using the Vacuum electrostatics mode of PyMol v.2.5, where surface charges are represented by a scale of red (negative) to blue (positive).
Generation of CALR−/− HEK293T
CALR−/− HEK293T were generated using the Guide-it CRISPR/Cas9 System (Takara) according to the manufacturer’s protocol. Briefly, two guides were designed targeting exon2 (sgRNA1: GCCGTCTACTTCAA GGAGCA, sgRNA2: TAATCCCCCACTTAGACGGG). The guides were chosen to minimize off-target effects using http://crispr.mit.edu/. Plasmids expressing individual guides were transfected into HEK293T by Amaxa nucleofector and Nucleofector Kit V (Lonza). After 48 h, green fluorescent cells were sorted using a BD Aria cell sorter. Two sequential rounds of transfection were carried out and single clones were sorted in 96-well plates. Two single clones, selected based on immunoblot analysis, were verified by sequencing.
Site-directed mutagenesis and complementation
Point or deletion mutations were prepared from human or mouse CRT expression clones in pCMV3-C-MYC (Sino Biological) using the Q5 Site-Directed Mutagenesis Kit (NEB) according to the manufacturer’s protocol, and primers were designed using the NEBaseChanger web tool. Plasmid sequences were validated by sequencing. Complementation of CALR−/− HEK293T was performed by transfection of mutated or WT plasmids using Lipofectamine 2000 (Invitrogen) in six-well plates. Wells with over 85% transfected cells were analysed by flow cytometry for cell surface CRT and NKp46–Ig binding and used for NK-killing assays.
Stable ecto-CRT-expressing B16
B16 cell lines expressing ecto-CRT or EV were generated as previously described18. Briefly, B16 melanoma cell lines were infected with retro-viruses generated with the pRetroX-IRES-DsRed vector containing FL mouse CRT in frame with either a decay-accelerating factor (GPI-CRT) or EV as control. Highly expressing GPI-CRT cells (polyclonal cell line) were sorted based on DsRed and CRT expression. Single-cell clones were obtained by limiting dilution, and individual clones were verified by surface CRT staining and flow cytometry. In vitro results obtained using the two GPI-CRT-overexpressing clones were comparable (data not shown), with one clone (clone 1) selected for in vivo experiments.
Imaging flow cytometry
B16 (EV or GPI-CRT or treated with cisplatin or OP) were stained with CellTracker Red CMTPX (CMTPX) (ThermoFisher Scientific) and cocultured with WT or Ncr1−/− splenic mouse NK cells at an E:T ratio of 1:5 for 30 min. Cells were fixed with 4% paraformaldehyde (Sigma) for 10 min and stained with rabbit polyclonal anti-CRT (MBL Bioscience), rat monoclonal anti-NKp46-PE-Cy7 (BioLegend) and rat monoclonal anti-CD49b-APC (BioLegend) before analysis on an ImageStream Amnis X MKII (Amnis) using Ideas software (Amnis). Cell doublets (conjugates) were selected based on aspect ratio versus cell area, gating on CMTPX+CD49b+ (tumour/NK) conjugates.
Mouse studies
C57BL/6 and B6–129-Ncr1tm1Oman/J (Ncr1−/−) female mice (6–8 weeks old) were purchased from The Jackson Laboratory. Animal use was approved by the Animal Care and Use Committees of Boston Children’s Hospital and Harvard Medical School. Mice were housed under a 12/12 h dark/light cycle, approximately 22 °C ambient temperature and about 50% humidity. Sample sizes were determined by the number of animals estimated for statistical significance based on pilot experiments. No randomization or blinding was used. Raw data from in vivo experiments are shown as Source Data. For tumour challenge experiments, B16-EV or GPI-CRT-expressing cells (2 × 10⁵) were injected subcutaneously into the right flank of WT (n = 7) and Ncr1−/− C57BL/6 (knockout) (n = 7) mice and tumour volumes measured every other day. For the DOX experiment, B16 (2 × 10⁵) were injected subcutaneously into the right flank of WT (n = 7) and Ncr1−/− C57BL/6 (n = 7) mice, and animals were injected intravenously 6 and 13 days later with 5 mg kg–1 DOX. Tumour growth was monitored by measuring tumour perpendicular diameters every other day. When control tumour volume had grown to around 1,000 mm3, all mice were euthanized and tumours collected for analysis. In the experimental metastasis assay, B16-EV or GPI-CRT-expressing cells (2.5 × 10⁵) were injected into the tail vein of WT or Ncr1−/− mice. After 21 or 28 days, mice were euthanized and numbers of tumour colonies on lung surfaces counted using a dissecting microscope (OLYMPUS).
In some experiments, WT mice were injected intraperitoneally daily for 2 days before tumour implantation with antibodies to CD8+ T cells (0.5 mg per mouse of rat anti-mouse CD8 mAb, clone no. 2.43, BioXCell), NK cells (0.2 mg per mouse of rabbit anti-mouse NK1.1, BioXCell), 300 μg per mouse anti-CSF1R (BioXCell) or a control antibody (LTF-2, BioXCell). Thereafter, for the duration of the experiment CD8 and NK1.1 antibodies were injected once per week and CSF1R every other day. Cell depletion was verified by flow cytometry analysis of blood cells at the time of tumour implantation and at the time of euthanization.
Mouse NK cells, isolated by negative selection from spleens of WT mice using the NK cell isolation kit (Miltenyi Biotec), were treated with 10 nM mouse IL-15 (BioLegend) for 7 days. Before adoptive transfer, CD3−NKp46+ cell selection was assessed by fluorescent activated cell sorting to be over 90%. B16-EV or B16-GPI-CRT tumour cells (2 × 10⁵) were implanted subcutaneously in the flank of 6–8-week-old female Ncr1−/− mice (n = 5). Beginning 4 days after tumour inoculation, tumour-bearing mice were intravenously injected with 1 × 10⁶ NK cells weekly for 3 weeks. Tumour growth was monitored by calipers every other day.
For the KP cancer model, 2 × 10⁵ KP cells in 100 μl of PBS were injected subcutaneously in the right flank of WT, Ncr1−/− or Klrk1−/− C57BL/6 mice (n = 5 per group). Mice were monitored for tumour growth by caliper measurement every other day. Mice, randomly assigned to study groups 14 days after implantation, were treated with vehicle or trametinib (1 mg kg–1) and palbociclib (100 mg kg–1) for 5 consecutive days. When control tumours grew to about 1,000 mm3, all mice were euthanized and tumours collected for analysis.
Whole tumours were collected, cut into small pieces and treated with 2 mg ml−1 collagenase D, 100 μg ml−1 DNase I (both Sigma) and 2% FBS in RPMI, with agitation for 30 min. Tumour fragments were homogenized and filtered through 70 μm strainers to obtain single-cell suspensions and then stained and analysed by flow cytometry gating on CD45+ cells. Isolated cells were stained with CD45-PerCPCy5.5 (clone no. 30-F11), CD8-PacBlue, -PerCPCy5.5, -Alexa 700, -fluorescein isothiocyanate (FITC) or -APC (clone no. 53–6.7), CD4-PE-Cy7, -APC or -PerCPCy5.5 (clone no. GK1.5), CD49b-FITC, -PacBlue or -PerCPCy5.5 (clone no. DX5), NKp46-APC (clone no. 29A1.4), CD11b-Alexa 700 (clone no. M1170), F4/80-PE-Cy7 (clone no. BM8) and CD44-PerCPCy5.5 (clone no. IM7) (BioLegend). Dead cells were excluded using the Zombie Yellow Fixable Viability dye (BioLegend). CD45+ lymphocyte populations were further defined as: CD8+ T cells (CD3+CD8+), CD4+ T cells (CD3+CD4+), NK cells (CD3−CD49b+), dendritic cells (F4/80−CD11c+) and tumour-associated macrophages (F4/80+CD11b+). For intracellular staining, cells were first stained with antibodies to cell surface markers for 30 min, fixed and permeabilized with fixation/permeabilization buffer (BD Pharmingen) and stained with GzmB-PacBlue (clone no. GB11, ThermoFisher Scientific) and perforin-PE (clone no. S16009B, BioLegend). For intracellular cytokine staining, 106 cells per sample were cultured in RPMI containing 2% FBS and stimulated with PMA (50 ng ml−1, Sigma), ionomycin (2 μg ml−1, Sigma) and Golgi-plug (1.5 μl ml−1, ThermoFisher Scientific) for 4 h. Cells were then stained with IFNγ-PacBlue (clone no. XMG1.2) and TNF-phycoerythrin-Cy7 (clone no. MP6-XT22) after fixation/permeabilization.
In vitro cancer cell line assays
Proliferation, colony formation, migration and invasion of B16-F10 (WT), B16-EV and B16-GPI-CRT were analysed by in vitro assays. Cell proliferation was assessed using CellTiter-Glo (103 cells per well). For colony formation assay, 100 cells were seeded per well and cells cultured until large colonies had formed (around 2 weeks), then stained with crystal violet. Migration and invasion assays were performed in TransWell plates: the upper chamber contained cells in medium without FBS and the lower chamber contained medium with 10% FBS. For the invasion assay, a Matrigel layer was added on top of the membrane before layering cells. At 24 h after incubation cells were fixed, stained with Giemsa and those on top of the membrane were removed. Migrated cells on the bottom of the membrane were then counted by microscopy.
Senescence induction
A549 or KP were treated or not for 6 days with trametinib (25 nM) and palbociclib (500 nM), 250 μM CuSO4 for 1 day or 500 μM 4-PBA for 6 days, and washed three times with PBS before use. Cells were stained for ICAM-1, MICA/B, CRT and RAE1 for flow cytometry. SA-βgal activity was measured using the CellEvent Senescence Green Flow Cytometry Assay Kit (ThermoFisher Scientific) following the manufacturer’s protocol. To assess killing, cells were cocultured with NK cells in the presence or absence of the indicated blocking antibody at an E:T ratio of 25:1 for 8 h.
Statistical analysis
Statistical analysis was performed using GraphPad Prism v.9.1.2. Before applying statistical methods, whether the data fit a normal distribution was evaluated by the D’Agostino–Pearson normality test; distribution was considered normal when P ≤ 0.05. Parametric or nonparametric (Mann–Whitney test) two-tailed unpaired t-tests were used to compare two groups. Column multiparametric comparisons were analysed by one-way ANOVA using the Kruskal–Wallis test and Sidak’s or Tukey’s multiple comparisons test. Two-tailed chi-square testing was used for the categorical column statistics shown in Fig. 3g,h. Multiple groups were compared by two-way ANOVA, with additional Tukey’s multiple comparisons testing. Tumour growth curves were analysed by first calculating the area under the curve, followed by a two-tailed nonparametric unpaired t-test. Killing assays employing different E:T ratios were analysed by area under the curve followed by non-parametric one-way ANOVA with Tukey’s multiple comparisons test. Nonparametric tests were used in experiments with animal samples because of the non-normal distribution of these data. Differences were considered statistically significant when P ≤ 0.05. Most experiments were not blinded as to group allocation, either when collecting data or assessing results.
Data reporting
No statistical methods were used to predetermine sample size. The experiments were not randomized and the investigators were not blinded to outcome assessment.
Reporting summary
Further information on research design is available in the Nature Portfolio Reporting Summary linked to this article.
Extended Data
Extended Data Fig. 1:

NKp46 as an ER stress sensor.
a, Effect of ER stress inhibitors on human peripheral blood NK cell killing of ZIKV-infected JEG-3 assessed by 8 h 51Cr release assay using an E:T ratio of 10:1 (n = 3 samples). UT, untreated. b,c Representative flow cytometry histograms of NKp46 (b) and NKp30 (c) surface expression on WT or NCR1 or NCR3 knockout clones of human YT. MFI is indicated. Iso, isotype control antibody. d, Gel filtration analysis of NKp46-Ig and protein standards separated on a Superdex 2000 Tricorn 10/600 column showing that NKp46-Ig migrates predominantly as a dimer and is not aggregated. Data in (a) are mean ± SEM of three technical replicates. Statistics by one-way ANOVA (a) P: *<0.05, **<0.01, ***<0.001.
Extended Data Fig. 2:
NKp46 binds to calreticulin.
a, Proteins identified by mass spectrometry analysis of the cross-linked high molecular band in the NKp46-Ig pulldown of the membrane fraction of ZIKV-infected JEG-3, listed in order of ion abundance. b, Binding of neuraminidase treated (red) or untreated (black) Alexa647-labeled NKp46-Ig to His-tagged CRT (left) or His-tagged hemagglutinin (HA) (right) analyzed by microscale thermophoresis (MST, dissociation constant (KD)). c, MST measurement of NKp46 (pretreated or not with neuraminidase (NA) as indicated) binding to CRT and other reported ligands13. Data are mean±s.d. of three technical replicates. d,e, Raman spectra of normalized intensities (arbitrary units, AU) for recombinant NKp46 and CRT in the amide I range (1600–1700 cm−1) recorded individually and then after mixing. The mixture shows a new spectral feature (peak at dotted line) potentially indicating NKp46-CRT binding (d). Change in the peak area at 1658 cm-1 plotted vs CRT concentration (e). The peak areas were obtained by deconvolution of the spectral read-outs and the plotted data were subjected to hyperbolic fitting to derive the NKp46-CRT KD. f, Representative flow cytometry histograms of Siglec-6, −7, and −8 expression on HEK293T (top) and JEG3 (bottom). Iso, isotype control antibody (n = 3 samples). g, Representative flow cytometry histograms of the effect of ZIKV on JEG-3 Siglec-6 expression (n = 3 samples). h, Specific killing of ZIKV-infected or uninfected JEG-3 by peripheral blood NK cells in the presence or absence of anti-Siglec-6 (8 h 51Cr release, n = 3 donors). Data are representative of independent experiments (a—e). Statistics were calculated by non-parametric one-way ANOVA followed by Tukey’s post-hoc test for area under curves (h). Graphs show mean ± SEM. ns, not significant.
Extended Data Fig. 3:

Modeling of the interaction of the calreticulin P-domain with NKp46.
a, Molecular surface representation of NKp46 (accession no. O76036) and CRT (accession no. P27797) based on sequence derived 3D structure generated by I-TASSER. b, Sequence alignment of human NKp46 (top) and CRT (middle) proteins (accession nos. O76036, P27797), and monkey (Q8MIZ9, Q4R6K8) and chimpanzee (Q08I01, H2QFH8) CRT, respectively. Conserved residues important in binding are labeled with a red box. Sequence alignment of the tip module of P domains of the CRT/CNX family (bottom). The Asp258 residue required for binding is labeled with a red box. c, Docked complex of NKp46 and CRT represented as a surface assembly; surface charge is shown for the entire complex (scale bar representing the charge gradient from negative (red) to positive surface charge (blue)). Circled regions represent the binding pocket, which are further magnified in (d). d, Magnified interaction of NKp46 (surface charge representation) and CRT P-domain (in stick and ribbon representation) showing specific P-domain Asp residues in the positively charged cleft of NKp46. NKp46 R160 is marked in the positively charged region of the NKp46 cleft. e, Magnification of the circled regions at the top and bottom of the binding cleft in (d) showing salt bridges and hydrogen bonds (dashed black lines) between NKp46 residues (blue sticks and black labels) and CRT (green sticks and red labels). f, Sequence alignment of the P domain of mouse and human CRT. The Asp and Glu residues implicated in binding are boxed in red. g, Representative flow cytometry histograms of mouse ecto-CRT and NKp46-Ig binding (left) and mean fluorescence intensity (MFI, right) of 2 samples of B16 stably transfected with empty vector (EV) or WT or mutated GPI-CRT. Untransfected B16 display little ecto-CRT. h, Killing by splenic NK cells from 3 WT mice of B16 stably transfected with EV or WT or mutated mouse GPI-CRT (8 h 51Cr release assay, E:T ratio 10:1). Data are representative of 3 experiments, mean ± SEM. Statistics by one-way ANOVA (g,h). P: **<0.01; ***<0.001.
Extended Data Fig. 4:

Knockout and knockdown of CALR and PDIA3.
a, CRT immunoblot in WT or CALR knockout HEK293T clones compared to tubulin loading control. b, Flow cytometry of externalized CRT (Ecto-CRT) or NKp46-Ig binding on untreated HEK293T CALR−/− cells reconstituted with CALR constructs (representative histograms (left), MFI of n = 3 samples (right)). c, qRT-PCR of CALR and PDI after knockdown of indicated genes in JEG-3, normalized to 18S rRNA (n = 3 samples). d, Representative flow cytometry histograms of MHC class I surface expression (W6/32 antibody) on JEG-3, knocked down for CALR, PDI3 or with nontargeting (Ctl) siRNAs (left); MFI of 3 samples (right). e, JEG-3, knocked down for CALR and/or PDIA3 or with nontargeting (Ctl) siRNAs, were infected or not with ZIKV and analyzed for ecto-CRT by flow cytometry. Representative histograms (left); MFI of 3 samples (right). f, JEG-3, knocked down for CALR and/or PDI3 or with nontargeting (Ctl) siRNAs were infected or not with ZIKV and analyzed for NKp46-Ig binding by flow cytometry; representative histograms of NKp46-Ig binding (left) and MFI of 3 samples (right). g, Peripheral blood NK killing (n = 6 donors) of knocked down JEG-3. h, Effect of anti-CRT and/or anti-PDI on NKp46-Ig binding to JEG-3 that were infected or not with ZIKV. Representative flow histograms (left) and MFI of 3 samples (right). i, Effect of anti-CRT, anti-PDI and anti-NKp46 on peripheral blood NK killing of uninfected or ZIKV-infected JEG-3. (g,i, 4 h 51Cr release assay, E:T ratio 10:1, n = 3 donors). Data are representative of three independent experiments (a). Graphs shown mean ± SEM. Statistics were performed using one-way ANOVA (b,d—i), or two-tailed non-parametric unpaired t-test (c). P: *<0.05; **<0.01; ****<0.0001.
Extended Data Fig. 5:

Ectopic expression of GPI-linked CRT in B16 does not alter in vitro cell proliferation but increases colony formation, invasivity and migration across a membrane.
Untransfected B16 cell line (UT) or clones of B16 stably transfected with empty vector (EV) or with an expression plasmid for GPI-CRT were analyzed for Ecto-CRT (a) and H-2Kb (b) by flow cytometry, cell proliferation (c), colony formation (d), invasion through a Transwell (e) and migration through a Transwell membrane in response to serum (f) (c—f, n = 4 samples). In a,b, representative flow cytometry histograms (left); MFI of 3 samples (right). Shown are mean ± SEM of at least 3 replicates. Statistics by two-tailed non-parametric unpaired t-test (a,b), area under the curve, followed by one-way ANOVA (c) and one-way ANOVA (d—f). P: *<0.05, **<0.01; ***<0.001, ****<0.0001.
Extended Data Fig. 6:

Ectopic expression of ecto-CRT in B16 does not significantly change numbers of tumour-infiltrating cells but suppresses tumour growth in an Ncr1-dependent manner.
a—c, Empty vector (EV) or GPI-CRT-expressing B16 tumour clones were implanted sc in WT (filled bars) and Ncr1−/− (unfilled bars) mice (n = 7/group) and mice were sacrificed 24 d later (Extended Data related to Fig. 4a). Shown are numbers of tumour-infiltrating cells (a) and functional markers (b,c) of NK (top) and CD8+ (bottom) TIL assessed at time of sacrifice 24 days after tumour implantation. b, GzmB (left) and PFN (right) expression. c, PMA + ionomycin stimulated IFNγ (left) and TNF (right) production. d, Schema (left) of experiment in Fig. 4b and representative flow cytometry plots (right) of mouse blood mononuclear cells, obtained on day 3 after tumour implantation, showing CD8+ T depletion with cell type-specific antibody compared to isotype control antibody. e, Schema of adoptive transfer experiment in Fig. 4c. f, Schema of metastasis experiment in Fig. 4d and representative flow cytometry of NK (αNK.1.1) and macrophage (αCSF1R) depletion compared to isotype control antibody. The integrin CD49b is a pan-NK marker. Graphs in (a—c) show mean ± SEM of 5 biological samples representative of 2 independent experiments; graphs are mean ± SEM. Statistics calculated by non-parametric one-way ANOVA followed by Tukey’s post-hoc test for areas under curves (a—c).
Extended Data Fig. 7:

Ncr1 enhances doxorubicin suppression of B16 tumours.
a, Representative flow cytometry histograms of ecto-CRT (left) and mean ± SEM ecto-CRT MFI (right) of B16 treated or not in vitro for 24 h with doxorubicin (DOX) (n = 3 samples). Iso, isotype control antibody staining; UT, untreated. b, Representative flow cytometry histograms of ecto-CRT expression on untreated (UT) and DOX-treated B16 that were pretreated or not with indicated ER stress inhibitors. c—g, B16 were injected sc into WT or Ncr1−/− mice (n = 7 group). and animals were treated with DOX iv 12 and 20 d after tumour implantation (red arrows). Tumour growth (c), numbers of tumour-infiltrating immune cells (d) and functional markers of NK (top) and CD8+ (bottom) TIL were assessed at time of sacrifice for cytotoxic granule protein expression (e), cytokine secretion (f) and degranulation (g) after PMA + ionomycin stimulation ex vivo. Graphs show mean ± SEM of at least 5 biological samples and are representative of 2 independent experiments. Statistics calculated by two-tailed non-parametric unpaired t-test (a), areas under curves followed by two-tailed parametric unpaired t-test (c), and non-parametric one-way ANOVA followed by Tukey’s post-hoc test (b,d—g). P: *<0.05; ***<0.001; ****<0.0001; ns, not significant.
Extended Data Fig. 8:

Trame3nib and palbociclib induces senescence in human A549 lung cancer cells and activates NK through NKp46 and NKG2D.
a, Representative flow cytometry histograms of β-galactosidase activity (SA-βgal) in A549 that were untreated (UT) or treated with trametinib and palbociclib (T+P) (left) and MFI (right) of 3 samples. b, ER stress, assessed by qRT-PCR assay of XBP1 splicing and BIP and CHOP mRNA, in untreated and T+P-treated A549 (n = 3 samples). c, Representative flow cytometry histograms of CRT, ICAM1 and MICA/B expression on untreated and T+P-treated A549 (left) and mean±SEM MFI (right) (n = 2 cell line samples). Iso, IgG1 isotype control antibody staining. d, Effect of NKR blocking antibodies (NKp46, NKG2D and NKp30) or anti-CRT compared to isotype control antibody (Iso) on YT killing of untreated or T+P-treated A549 (8 h 51Cr release, E:T ratio 25:1, n = 3 samples). The same isotype control IgG1 antibody was used in all panels. e, Specific killing of untreated or T+P-treated A549 by YT, knocked out or not for NCR1, in the presence or absence of CRT blocking Ab (8 h 51Cr release, E:T ratio 25:1; n = 3 samples). Graphs show mean ± SEM of at least 3 independent experiments. Statistics were calculated by two-tailed non-parametric unpaired t-test (a), unpaired two-way ANOVA (a—d) and non-parametric one-way ANOVA followed by Tukey’s post-hoc test for area under curves (e). P: *<0.05; ***<0.001; ****<0.0001.
Extended Data Fig. 9:

Trametinib and palbociclib treatment of WT and Ncr1 or Klrk1 deficient mice bearing subcutaneous KP tumours does not affect the numbers of tumour-infiltrating immune cells or the functional phenotype of tumour-infiltrating CD8+ T cells.
KP cells were injected sc into WT, Ncr1−/− or Klrk1−/− mice (n = 5–7/group) and animals were treated with trametinib and palbociclib (T+P) by oral gavage 13–18 d after tumour implantation (Extended data linked to Fig. 4i, k). Tumour-infiltrating cells were analyzed at the time of sacrifice (23 d post tumour implantation). a, Number of tumour-infiltrating immune cells. b,c, CD8+ TIL expression of cytotoxic granule proteins (b) and cytokine production (c). Bar graphs show mean ± SEM of at least 3 independent experiments and statistics by unpaired one-way ANOVA.
Extended Data Fig. 10.

Senescence inducer CuSO4, which causes ER stress, activates NKp46- and NKG2D-dependent NK killing, but 4-PBA, which induces senescence without ER stress, does not.
a, Representative flow cytometry histograms of β-galactosidase activity (SA-βgal) (left) and MFI of 3 samples (right) of KP that were untreated (UT) or treated with CuSO4 or 4-PBA. b, ER stress, assessed by qRT-PCR of Xbp1 splicing and Bip and Chop mRNA, in untreated and CuSO4 or 4-PBA treated KP (3 samples). c, Representative flow cytometry histograms of CRT and RAE1 expression on KP treated or not with CuSO4 or 4-PBA (left); MFI of 3 samples (right). d, Killing of KP that were UT or treated with CuSO4 or 4-PBA by splenic NK from WT, Ncr1−/− or Klrk1−/− mice (4 h 51Cr release, E:T ratio 20:1). Bar graphs show mean ± SEM of at least 3 independent experiments. Statistics by unpaired one-way ANOVA. P: *<0.05; **<0.01; ***<0.001, ****<0.0001.
Supplementary Material
Acknowledgements
This work was supported by US NIH grant no. AI150671 and AI145862 (J.L.), the Jeffrey Modell Foundation fellowship (S.S.), DFG fellowship no. LE 4174/1-1 (D.-J.L.), NIH no. T32AI007245 (M.L.) and a Concelho Nacional de Desenvolvimento Científico e Tecnológico research fellowship (C.J.). We thank O. Mandelboim (Hebrew University Faculty of Medicine) for NKp46–Ig, T. Jacks (Koch Institute, MIT) for the KP cell line, J. Kline (Department of Medicine, University of Chicago) for the pRetroX-IRES-GPI-CRT-DsRed plasmid and J. Strominger and T. Tilbergs (Harvard University) and members of the Lieberman laboratory for helpful discussions.
Footnotes
Online content
Any methods, additional references, Nature Portfolio reporting summaries, source data, extended data, supplementary information, acknowledgements, peer review information; details of author contributions and competing interests; and statements of data and code availability are available at https://doi.org/10.1038/s41586-023-05912-0.
Competing interests The authors declare no competing interests.
Supplementary information The online version contains supplementary material available at https://doi.org/10.1038/s41586-023-05912-0.
Data Availability
The data that support the findings of this study are available from the corresponding authors on request. Source data are provided with this paper.
References
- 1.Raulet DH & Guerra N Oncogenic stress sensed by the immune system: role of natural killer cell receptors. Nat. Rev. Immunol 9, 568–580 (2009). [DOI] [PMC free article] [PubMed] [Google Scholar]
- 2.Sivori S et al. p46, a novel natural killer cell-specific surface molecule that mediates cell activation. J. Exp. Med 186, 1129–1136 (1997). [DOI] [PMC free article] [PubMed] [Google Scholar]
- 3.Barrow AD, Martin CJ & Colonna M The natural cytotoxicity receptors in health and disease. Front. Immunol 10, 909 (2019). [DOI] [PMC free article] [PubMed] [Google Scholar]
- 4.Sivori S et al. NKp46 is the major triggering receptor involved in the natural cytotoxicity of fresh or cultured human NK cells. Correlation between surface density of NKp46 and natural cytotoxicity against autologous, allogeneic or xenogeneic target cells. Eur. J. Immunol 29, 1656–1666 (1999). [DOI] [PubMed] [Google Scholar]
- 5.Obeid M et al. Calreticulin exposure dictates the immunogenicity of cancer cell death. Nat. Med 13, 54–61 (2007). [DOI] [PubMed] [Google Scholar]
- 6.Bettigole SE & Glimcher LH Endoplasmic reticulum stress in immunity. Annu. Rev. Immunol 33, 107–138 (2015). [DOI] [PubMed] [Google Scholar]
- 7.Gladwyn-Ng I et al. Stress-induced unfolded protein response contributes to Zika virus-associated microcephaly. Nat. Neurosci 21, 63–71 (2018). [DOI] [PubMed] [Google Scholar]
- 8.Crespo AC, Strominger JL & Tilburgs T Expression of KIR2DS1 by decidual natural killer cells increases their ability to control placental HCMV infection. Proc. Natl Acad. Sci. USA 113, 15072–15077 (2016). [DOI] [PMC free article] [PubMed] [Google Scholar]
- 9.Qian Z, Xuan B, Gualberto N & Yu D The human cytomegalovirus protein pUL38 suppresses endoplasmic reticulum stress-mediated cell death independently of its ability to induce mTORC1 activation. J. Virol 85, 9103–9113 (2011). [DOI] [PMC free article] [PubMed] [Google Scholar]
- 10.Boyce M et al. A selective inhibitor of eIF2alpha dephosphorylation protects cells from ER stress. Science 307, 935–939 (2005). [DOI] [PubMed] [Google Scholar]
- 11.Kozlov G, Munoz-Escobar J, Castro K & Gehring K Mapping the ER Interactome: the P domains of calnexin and calreticulin as plurivalent adapters for foldases and chaperones. Structure 25, 1415–1422 (2017). [DOI] [PubMed] [Google Scholar]
- 12.Matsui K et al. Low affinity interaction of peptide-MHC complexes with T cell receptors. Science 254, 1788–1791 (1991). [DOI] [PubMed] [Google Scholar]
- 13.Verschueren E et al. The immunoglobulin superfamily receptome defines cancer-relevant networks associated with clinical outcome. Cell 182, 329–344 (2020). [DOI] [PubMed] [Google Scholar]
- 14.Crocker PR, Paulson JC & Varki A Siglecs and their roles in the immune system. Nat. Rev. Immunol 7, 255–266 (2007). [DOI] [PubMed] [Google Scholar]
- 15.Foster CE, Colonna M & Sun PD Crystal structure of the human natural killer (NK) cell activating receptor NKp46 reveals structural relationship to other leukocyte receptor complex immunoreceptors. J. Biol. Chem 278, 46081–46086 (2003). [DOI] [PubMed] [Google Scholar]
- 16.Baksh S, Burns K, Andrin C & Michalak M Interaction of calreticulin with protein disulfide isomerase. J. Biol. Chem 270, 31338–31344 (1995). [DOI] [PubMed] [Google Scholar]
- 17.Mehmood RK Review of cisplatin and oxaliplatin in current immunogenic and monoclonal antibody treatments. Oncol. Rev 8, 256 (2014). [DOI] [PMC free article] [PubMed] [Google Scholar]
- 18.Chen X, Fosco D, Kline DE & Kline J Calreticulin promotes immunity and type I interferon-dependent survival in mice with acute myeloid leukemia. Oncoimmunology 6, e1278332 (2017). [DOI] [PMC free article] [PubMed] [Google Scholar]
- 19.Diefenbach A, Jensen ER, Jamieson AM & Raulet DH Rae1 and H60 ligands of the NKG2D receptor stimulate tumour immunity. Nature 413, 165–171 (2001). [DOI] [PMC free article] [PubMed] [Google Scholar]
- 20.Krysko DV, Ravichandran KS & Vandenabeele P Macrophages regulate the clearance of living cells by calreticulin. Nat. Commun 9, 4644 (2018). [DOI] [PMC free article] [PubMed] [Google Scholar]
- 21.Yu KF et al. The antitumor activity of a doxorubicin loaded, iRGD-modified sterically-stabilized liposome on B16-F10 melanoma cells: in vitro and in vivo evaluation. Int. J. Nanomed 8, 2473–2485 (2013). [DOI] [PMC free article] [PubMed] [Google Scholar]
- 22.Ruscetti M et al. NK cell-mediated cytotoxicity contributes to tumor control by a cytostatic drug combination. Science 362, 1416–1422 (2018). [DOI] [PMC free article] [PubMed] [Google Scholar]
- 23.Blazanin N et al. ER stress and distinct outputs of the IRE1alpha RNase control proliferation and senescence in response to oncogenic Ras. Proc. Natl Acad. Sci. USA 114, 9900–9905 (2017). [DOI] [PMC free article] [PubMed] [Google Scholar]
- 24.Zuo J et al. A disease-linked ULBP6 polymorphism inhibits NKG2D-mediated target cell killing by enhancing the stability of NKG2D ligand binding. Sci. Signal 10, eaai8904 (2017). [DOI] [PubMed] [Google Scholar]
- 25.Meylan E et al. Requirement for NF-kappaB signalling in a mouse model of lung adenocarcinoma. Nature 462, 104–107 (2009). [DOI] [PMC free article] [PubMed] [Google Scholar]
- 26.Kim HD, Jang CY, Choe JM, Sohn J & Kim J Phenylbutyric acid induces the cellular senescence through an Akt/p21(WAF1) signaling pathway. Biochem. Biophys. Res. Commun 422, 213–218 (2012). [DOI] [PubMed] [Google Scholar]
- 27.Matos L, Gouveia AM & Almeida H ER stress response in human cellular models of senescence. J. Gerontol. A Biol. Sci. Med. Sci 70, 924–993 (2015). [DOI] [PubMed] [Google Scholar]
- 28.Long EO & Rajagopalan S Stress signals activate natural killer cells. J. Exp. Med 196, 1399–1402 (2002). [DOI] [PMC free article] [PubMed] [Google Scholar]
- 29.Gowen BG et al. A forward genetic screen reveals novel independent regulators of ULBP1, an activating ligand for natural killer cells. eLife 4, e08474 (2015). [DOI] [PMC free article] [PubMed] [Google Scholar]
- 30.Lin JH, Walter P & Yen TS Endoplasmic reticulum stress in disease pathogenesis. Annu. Rev. Pathol 3, 399–425 (2008). [DOI] [PMC free article] [PubMed] [Google Scholar]
- 31.Krämer B et al. Natural killer p46High expression defines a natural killer cell subset that is potentially involved in control of hepatitis C virus replication and modulation of liver fibrosis. Hepatology 56, 1201–1213 (2012). [DOI] [PubMed] [Google Scholar]
- 32.Ozcan U et al. Endoplasmic reticulum stress links obesity, insulin action, and type 2 diabetes. Science 306, 457–461 (2004). [DOI] [PubMed] [Google Scholar]
- 33.Kroemer G, Galluzzi L, Kepp O & Zitvogel L Immunogenic cell death in cancer therapy. Annu. Rev. Immunol 31, 51–72 (2013). [DOI] [PubMed] [Google Scholar]
- 34.Chiossone L, Dumas PY, Vienne M & Vivier E Natural killer cells and other innate lymphoid cells in cancer. Nat. Rev. Immunol 18, 671–688 (2018). [DOI] [PubMed] [Google Scholar]
- 35.Huntington ND, Cursons J & Rautela J The cancer-natural killer cell immunity cycle. Nat. Rev. Cancer 20, 437–454 (2020). [DOI] [PubMed] [Google Scholar]
- 36.Dotiwala F et al. Granzyme B disrupts central metabolism and protein synthesis in bacteria to promote an immune cell death program. Cell 171, 1125–1137 (2017). [DOI] [PMC free article] [PubMed] [Google Scholar]
- 37.Kozakov D, Brenke R, Comeau SR & Vajda S PIPER: an FFT-based protein docking program with pairwise potentials. Proteins 65, 392–406 (2006). [DOI] [PubMed] [Google Scholar]
Associated Data
This section collects any data citations, data availability statements, or supplementary materials included in this article.
Supplementary Materials
Data Availability Statement
The data that support the findings of this study are available from the corresponding authors on request. Source data are provided with this paper.