Abstract
Due to desirable optical properties, such as efficient luminescence and large Stokes shift, DNA-templated silver nanoclusters (DNA-AgNCs) have received significant attention over the past decade. Nevertheless, the excited-state dynamics of these systems are poorly understood, as studies of the processes ultimately leading to a fluorescent state are scarce. Here we investigate the early time relaxation dynamics of a 16-atom silver cluster (DNA-Ag16NC) featuring NIR emission in combination with an unusually large Stokes shift of over 5000 cm–1. We follow the photoinduced dynamics of DNA-Ag16NC on time ranges from tens of femtoseconds to nanoseconds using a combination of ultrafast optical spectroscopies, and extract a kinetic model to clarify the physical picture of the photoinduced dynamics. We expect the obtained model to contribute to guiding research efforts toward elucidating the electronic structure and dynamics of these novel objects and their potential applications in fluorescence-based labeling, imaging, and sensing.
The properties of atomically precise metal clusters in the nanometer to subnanometer size range, typically produced by in vacuo size-selection, have been studied in detail for several decades.1−4 Much more recently, a variety of templating strategies have opened wet-chemical synthesis avenues, which has significantly broadened perspectives in both upscaled production and applications. While, in particular, thio-alkane templated gold and silver clusters5 have achieved “workhorse” status, other interesting systems have emerged in parallel. Our interests lie in the properties and applications of DNA-templated silver nanoclusters (DNA-AgNCs) less than a few tens of Ag atoms in size. After their introduction two decades ago,6 these have received increasing attention due to their attractive and widely tunable optical properties: intense fluorescence, high photostability, and inherent biocompatibility. As such, they have found applications in a variety of labeling, microscopy, and sensing contexts.7 While the past decade has seen the library of DNA-AgNCs grow enormously,8,9 their electronic structure and excited-state dynamics remain poorly understood, with only a limited number of studies available.10−13 A particularly noteworthy and poorly understood curiosity in the spectroscopic properties of DNA-AgNCs is their unusually large Stokes shifts, which are observed to reach many hundred or even thousands of cm–1.14 While such large shifts are attractive in a number of potential applications, the underlying electronic structure and associated dynamics remain unclear.
In this study, we target the 16-atom silver cluster DNA-Ag16NC, which was recently found to contain also 2 chloride ligands.15 Similar to many other DNA-AgNCs,16 the absorption spectrum of DNA-Ag16NC, shown in Figure 1, is relatively sparse. The dominating feature is a broad absorption band centered at approximately 525 nm. A series of weaker transitions then follows in the near-UV, before nucleobase absorption becomes dominant in the mid- to deep-UV range (not shown). All bands appear broad and approximately Gaussian shaped: the lowest energy transition in particular being almost perfectly Gaussian with a full width at half-maximum of 2550 cm–1 (Supporting Figure S2).
Figure 1.
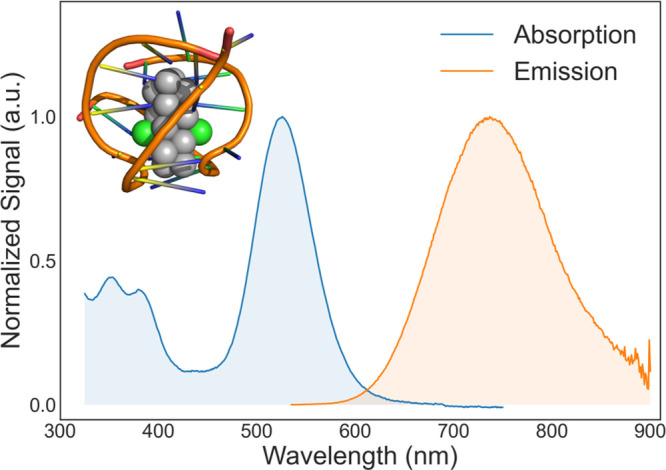
Normalized absorption (blue) and emission (orange) spectra of DNA-Ag16NC in a 10 mM ammonium acetate solution at room temperature. Inset shows the structure of DNA-Ag16NC (Protein Data Bank PDB-ID 6JR4, from Cerretani et al.19).
The near-infrared emission of DNA-Ag16NC has been the target of a number of earlier studies.17−20 While the efficiency of its fluorescence by itself makes the cluster of practical interest—its quantum yield of 26%17 is rather large for a NIR emitter—the unusually large Stokes shift of ≈5600 cm–1 is especially notable. Such large shifts are highly desirable in applications where scattered excitation light is a major concern. While the basis of this large Stokes shift remains an open question, some observations can be made directly from the steady-state spectra:
One hypothesis would be that the large Stokes shift is only apparent, and that the luminescence in fact occurs from a lower-energy excited state with negligible absorption due to, e.g., spectroscopic selection rules. This hypothesis is quickly found to be inconsistent, as the observed fluorescence quantum yield in combination of a fluorescence lifetime of ≈3.3 ns shows that the radiative rate constant has a relatively large value of ≈7.9 × 10⁷ s–1. The direct relation between radiative rate and oscillator strength21 implies that the transition is strongly allowed; hence, e.g., symmetry- and spin-constraints can be ruled out. As the transition is strongly allowed, it is implied that there is no detectable population present in ground states with a geometry and charge distribution that favors direct excitation to this nanosecond emissive state.
An alternative hypothesis is
to interpret the spectra in terms
of environment fluctuations around the cluster. We note that both
absorption and emission bands are Gaussian with good mirror-image
symmetry, which is often the case when the ensemble of chromophores
is best described in terms of a (quasi-) static ensemble with normal
distributed transition frequencies. In particular, Gaussian lineshapes
occur in the high temperature, slow fluctuation limit of the Brownian
oscillator model.22 While this simple model
is attractive, its implied relationship between Stokes shift and spectral
line width is also inconsistent with observation. In this limit, the
Stokes shift 2λ can be predicted from the standard deviation
σ of the absorption line with the expression  , which yields a value of only ≈800
cm–1—about one-seventh of the observed value.
This discrepancy demonstrates that the relaxation of DNA-Ag16NC after photoexcitation is well beyond simple environment reorganization
around a static distribution of chromophores. Instead, we must conclude
that relaxation involves fundamental structural and/or electronic
reorganization. In earlier work on similar clusters, the absorption
and emission were assigned to different distinct states: in one case,
based on multiple distinct spectral features in the ultrafast optical
spectra,10 and in a second, based on bimodal
ground-state recovery kinetics.11 These
assignments are in line with our observations here.
While steady-state optical spectra are informative, time-resolved experiments are required to elucidate the photoinduced dynamics in the cluster. The behavior of DNA-Ag16NC on nanosecond to microsecond time scales have been investigated elsewhere,17−20 but little is known about the relaxation from the initial Franck–Condon point. That is how does DNA-Ag16NC dissipate excess energy during relaxation?
Insight into this requires spectroscopic techniques with sufficient resolution to resolve the dynamics taking place as excited DNA-Ag16NCs cool to reach a relaxed emissive excited state. We base our analysis on optical “pump-probe” techniques: ultrafast transient absorption spectroscopy (TA) and two-dimensional electronic spectroscopy (2DES). These techniques allow us to follow spectral changes with time resolution down to a few tens of femtoseconds. By correlating spectral dynamics with relaxation processes we can, in principle, extract a fully time-resolved picture of the excited-state energy relaxation. Two-color 2DES is particularly valuable for very early time dynamics, as the compressed NOPA-generated pulses in combination with a background-free boxcars experimental geometry results in minimal signal distortion at early times. The spectral detection window in these experiments is limited, however, so we predominantly rely on TA at time scales longer than a few hundred femtoseconds.
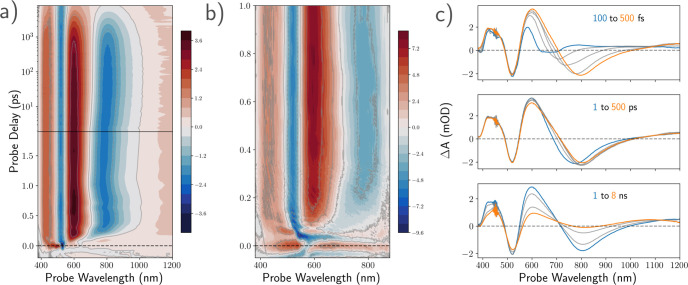
In Figure 2, we show the results of two separate TA experiments (selected 2DES spectra are shown in Supporting Figure S4), each aimed at different temporal ranges: in panel a, we show the spectral evolution in a TA experiment using sub-100 fs excitation pulses centered at 520 nm and CaF2-generated white-light supercontinuum probe (WL-TA). In this configuration, we have the broadest possible spectral detection window and time delays up to 8 ns. In order to better resolve dynamics during the first few hundred femtoseconds after excitation and to bridge the temporal gap to the 2DES data, we supplement this experiment with one based on the filtered and compressed output of an argon-filled hollow-core fiber to generate both excitation- and probe- pulses (HCF-TA). This configuration has narrower temporal windows of 50 ps and a probe spectral range of 350–950 nm–but the ≈14 fs pump pulses obtained after filtering of the HCF output at 580 nm center frequency offer significantly better time resolution (see Supporting Figure S1 for spectral and temporal characteristics). The data over the first picosecond in this TA experiment are shown in panel b of Figure 2 (data over the full time-range shown in Supporting Figure S3).
Figure 2.
Photoinduced dynamics of DNA-Ag16NC in 10 mM ammonium acetate solution. (a) Wavelength vs probe-delay map of the WL-TA experiment after excitation at 520 nm. The total time range is 8 ns. Note the change from linear to logarithmic scale at 1.8 ps (solid line). (b) HCF-TA experiment showing the spectral dynamics over the first picosecond after excitation centered at 580 nm. (c) Transient spectra extracted from panel a over several time ranges of interest. Spectra shown at probe delays: top panel, 100 (blue), 150, 200, 300, 500 (orange) fs; middle panel, 1 (blue), 5, 50, 100, 500 (orange) ps; bottom panel, 1 (blue), 2, 5, 8 (orange) ns.
In all experiments, we observe multitime scale relaxation dynamics over a broad spectral range after photoexcitation, in agreement with the reported behavior of similar systems.10,23,24 We note, however, that the dynamics predominantly occur into two time regimes: (1) the ultrafast relaxation following the initial excitation to and within a fluorescent state and (2) the transfer of population from this ns-lived fluorescent state into a long-lived state with lifetime in the tens of microseconds.19 We here focus our attention primarily on the rich early time relaxation behavior.
Immediately on excitation, a distinct negative feature corresponding to the ground-state bleach (GSB) forms around 525 nm. Although recognizable as the inverse of the absorption spectrum, it is strongly deformed due to overlap with excited-state absorption (ESA) covering most of the visible range. As expected, no GSB features are apparent near the NIR maximum of the fluorescence. Subsequently, a cascade of relaxation processes takes place–most obviously the population transfers away from the Franck–Condon point toward lower energy states. As seen in panels a and b of Figure 2, this initial energy relaxation is associated with clear changes of the transient spectra. A weak stimulated emission (SE) feature becomes visible in the 600–700 nm region and rapidly red-shifts to approximately 800 nm. Already within the first few hundred femtoseconds this shift is completed, leaving the excited-state population to reside in the fluorescent state. Concomitant with this SE shift, an ESA feature forms adjacent to the GSB in the 600–650 nm region. The overlap between this ESA and the SE appears to distort the latter spectral shape, leaving the SE maximum red-shifted relative to the steady-state fluorescence maximum. A more subtle spectral dynamic at these early times, most clearly seen in the top panel of Figure 2c, is the formation of a low-amplitude ESA at the NIR edge of our detection window concomitant with the SE red-shift. As such, it is clear that during this time interval, the excited-state population resides within an electronic manifold where a broad range of higher-energy states can be accessed with visible and NIR wavelengths. These changes to the ESA structure imply some significant differences in the electronic structure of the fluorescent state relative to that at the Franck–Condon point. Note that, in contrast to a previous study on a different DNA-AgNC, we do not observe this transfer to result in quantum beats in the signal.10
Following the ultrafast relaxation, we observe predominantly relaxation within the fluorescent state. This is illustrated in the middle panel of Figure 2c, where we observe minor changes to the spectral shape and a slight further red-shift of the SE on picosecond time scales. The assignment of these subtle spectral changes to the vibrational cooling of a “hot” excited state is in good agreement with the observation of picosecond line shape dynamics in transient infrared spectroscopy experiments on a green emitting DNA-AgNC.24
Interestingly, after the completion of the internal conversion processes leading to a relaxed fluorescent state detailed above, we do not simply observe ground state recovery on the time scale of the fluorescence lifetime as one might expect. Instead, a large fraction of the GSB remains well beyond the experimental window, as opposed to both SE and ESA which disappear within a few nanoseconds. This indicates that much of the relaxation must take place via a long-lived “dark” state rather than directly to the ground state via internal conversion.25−27 This is in agreement with earlier studies on DNA-Ag16NC in D2O, where even in the presence of oxygen at room temperature NIR luminescence with lifetimes in the order of 70 μs was observed.20,28,29 While the complex in aqueous solution does not luminesce appreciably on these time scales, cryogenic experiments reveal lifetimes of tens of μs also in the absence of deuterium.17,19 Relaxation from fluorescent states via long-lived states is in line with the observations from Petty et al. for DNA-AgNC having dual emission (green fluorescence and NIR luminescence).30 Interestingly, several reports proposed competing pathways from the Franck–Condon point toward the ground state or microsecond luminescent states, respectively, for other red and NIR emitting DNA-AgNCs.11,19,31,32 We do not find evidence for this type of competitive relaxation in DNA-Ag16NC, illustrating the qualitative differences in behavior among DNA-AgNCs and underlining the diverse nature of these systems.
Note that while the long lifetime, and thus small transition dipole moment, of the long-lived state could point to change of spin upon transfer from the fluorescent state, other processes might also be involved. For instance, charge transfer between the silver cluster and the DNA ligand or other delocalization effects involving the ligands might suppress the transition dipole moment magnitude. Thus, while state assignment cannot be made purely on the basis of optical properties, the large changes in transient spectra suggest substantial changes in electronic structure. In particular, the evolution of the ESA during the decay of the fluorescent state is noteworthy: the sharp band around 600 nm weakens significantly—concomitant with subtler changes in the NIR—approaching a weak and flat continuum-like absorption structure covering the red-to-NIR range. Therefore, it is clear that further detailed computational work is needed to elucidate the electronic and structural dynamics induced by photoexcitation in these systems—highlighting especially the need for a robust theoretical framework to describe the excited electronic states of these systems.
This qualitative data analysis directly reveals information about the excited state structure and dynamics in DNA-Ag16NC, but it does not provide a quantitative relaxation model. For this purpose, our strategy is the standard framework of singular-value decomposition (SVD) followed by a sum-of-exponential-decays model fit to the data. This corresponds to modeling the physical system as a set of coupled first-order differential equations—typically appropriate for intramolecular dynamics. The large observed range of time scales is challenging for most fitting algorithms—hence, it is again convenient to analyze the time domains individually. Here, we leverage the higher time resolution in the 2DES and HCF-TA data to characterize subpicosecond dynamics, while the time range 1 ps to 8 ns is characterized from the WL-TA data set.
In multiexponential decay dynamics, the spectra of the decay components greatly facilitate analysis. Here, in the absence of further external information, we get these spectra from the minimally complex representation of multiexponential decays: the so-called decay associated spectra (DAS) and the evolution-associated (or species associated) decay spectra (EADS),33 shown in Figure 3. The corresponding 2DES-DAS are shown in Supporting Figure S5. In the first of these models, the components are noninteracting and decay in parallel. Conversely, the EADS approach imposes a sequential and unidirectional relaxation model where the spectra are those of the individual “compartments” in the relaxation model. In the case where one-way state-to-state transfer is a good approximation to the actual processes, these spectra are those of the involved eigenstates.
Figure 3.
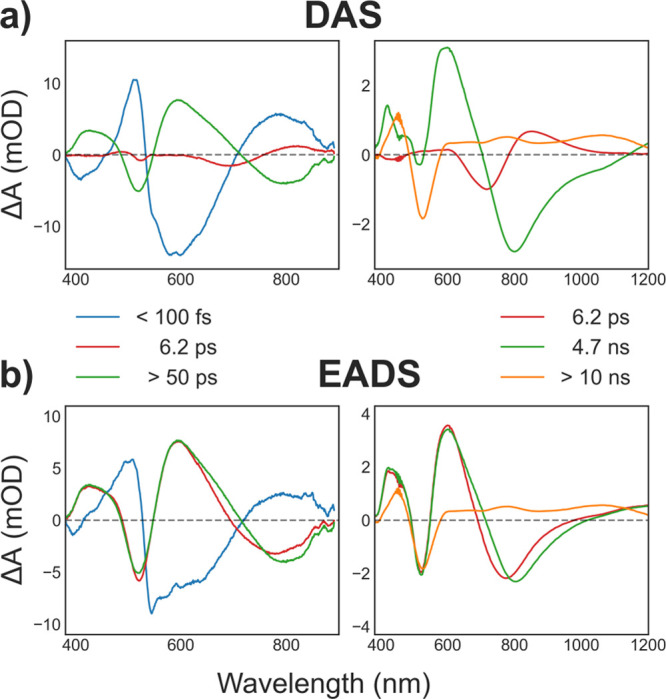
Spectra extracted from global kinetic analysis of the HCF-TA (left) and WL-TA (right) experiments: (a) decay associated spectra (DAS); (b) evolution associated decay spectra (EADS). The extracted time constants are by definition identical for both EADS and DAS. Each set of fits contains components corresponding to spectral dynamics taking place on time scales much longer than the range used for the respective fits (left panels, 50 ps; right panels, 8 ns). Note the different wavelength and ΔA ranges in short-time spectra (left panels) and the longer-time components extracted from the WL-TA experiment (right panels).
From both 2DES and HCF-TA, we find that the initial relaxation from the Franck–Condon point proceeds on a sub-100-fs time scale. The DAS and EADS in Figure 3 reveal this process is predominantly associated with a shift of the SE in the visible range from around 600 nm to the 800 nm region. These changes appear to be accompanied by substantial ESA changes across the wide spectral range. Overall, the spectral dynamics suggest that substantial changes in electronic structure takes place over this notably short time scale. In an earlier study of a DNA-AgNC system, distinct cross-peaks in the 2DES spectra revealed that absorption and fluorescence originated from distinct electronic states.10 Given the changes in spectral structure, such an assignment is plausible also here–although due to the broadness of the absorption and emission spectra and lack of obvious 2DES cross-peaks such an assignment cannot be made unambiguously. The EADS in Figure 3a show that this initial relaxation is followed by subtler spectral dynamics on picosecond time scale. These are primarily related to a small further red-shift of the NIR SE band. Both the time scale and the observed spectral changes are consistent with vibrational cooling of “hot” excited states, and consequently also corresponds well to subtle line shape-dynamics observed on the same time scales in earlier ultrafast vibrational experiments.24
In the WL-TA data set we, as expected, find an initial component associated with a SE red-shift and minor line shape changes on time scales consistent with the 6.2 ps found from HCF-TA. After completion of this cooling process, two decay components contribute to the spectral dynamics: first the SE disappears in conjunction with the alterations to the ESA outlined in the qualitative analysis above. This is followed by ground state recovery on time scales much longer than the experimental window. We here determine a time constant of 4.7 ns for the SE decay, but note that this component can be constrained to the 3.3 ns fluorescence lifetime without significant worsening of the fit statistics. On long time scales the GSB appears to change little. This is however at least partly due to the concomitant loss of the overlapping ESA, and we estimate that less than 50% of the ground state is recovered on nanosecond time scale. This is consistent with the 26% fluorescence quantum yield, and suggests that the major nonradiative relaxation pathway from the fluorescent state is via a μs-lived excited state19 as opposed to direct internal conversion to the ground state. The small apparent internal conversion from the fluorescent state might be a beneficial property of this class of emitters, allowing potential design of NIR emitters with high fluorescence quantum yield. That this is a reasonable assumption was demonstrated by a DNA-AgNC with an emission maximum of 721 nm that had a near unity fluorescence quantum yield in D2O at 5 °C.32
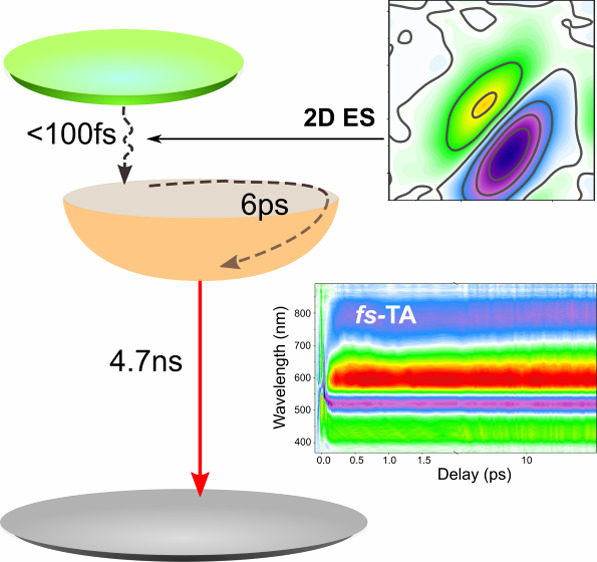
Ultimately, the global kinetic analysis has allowed construction of a quantitative model to support the earlier qualitative analysis. From both 2DES and HCF-TA, we find that the Stokes shift is largely complete on a sub-100-fs time scale. After completion of this ultrafast population transfer to form a fluorescent state, we observe first vibrational cooling followed by transfer into a μs-lived state on time scales consistent with the fluorescence lifetime.17 We collect all the parameters extracted by global kinetic fitting of the experimental data in the relaxation scheme shown in Figure 4.
Figure 4.
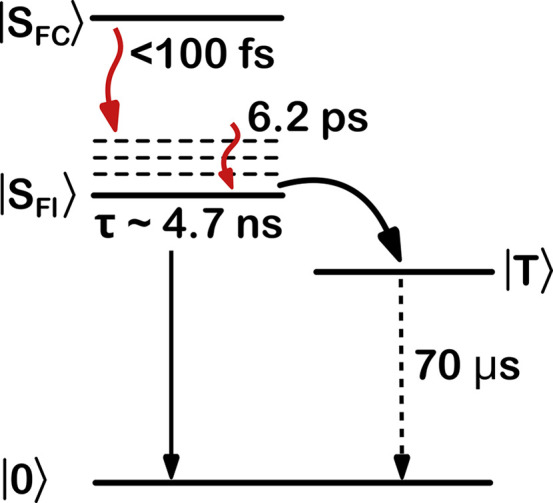
Schematic illustration of the photoinduced dynamics in DNA-Ag16NC. The initial population resides in a state at the Franck–Condon point, and populates vibrationally hot levels of the fluorescent state SFl within 100 fs. These hot vibrational levels thermalize with a time constant of 6.2 ps. Relaxation from SFl is a competitive process between transfer to the electronic ground state via fluorescence and transfer to a microsecond-lived state T. While the state spin multiplicity of T is not known, it has a decay time of ≈70 μs in D2O at room temperature.19
In summary, we have evaluated the electronic structure and photoinduced dynamics in the large Stokes shift cluster DNA-Ag16NC using steady-state and ultrafast time-resolved optical spectroscopy. The evolution of spectral shapes suggests that the Stokes shift is associated with a large change in electronic structure, which we propose originate from an ultrafast transition between distinct electronic excited states. The spectral changes associated with a subsequent nanosecond time scale transition to a microsecond lifetime state suggest that also this transition involves changes in the state character. Global kinetic analysis of the spectral dynamics allowed extraction of the time constants associated with spectral changes, which ultimately led to the construction of a relaxation model. A complete picture of the electronic structure within these silver clusters—and particularly the photoinduced dynamics—clearly requires much further work at the theoretical level. The presented experimental characterization provides clues to such information in these highly diverse and intriguing emissive compounds.
Acknowledgments
T.V. and C.C. acknowledge funding from the Villum Foundation (VKR023115) and the Independent Research Fund Denmark (0136-00024B). D.Z. and E.T. acknowledge support from the Swedish Research Council. J.C. acknowledges support from the Lundbeck Foundation (Grant No. R303-2018-3237).
Supporting Information Available
The Supporting Information is available free of charge at https://pubs.acs.org/doi/10.1021/acs.jpclett.3c00764.
Details on cluster synthesis, technical details of TA and 2DES experiments, fits to absorption and fluorescence lineshapes, full range probe-delay vs probe-wavelength HCF-TA data, selected 2DES spectra, 2DES decay associated spectra, comparison of kinetic traces, fits, and residuals., and comparison of WL-TA and HCF-TA spectra at early times (PDF)
Transparent Peer Review report available (PDF)
Author Contributions
⊥ J.C. and A.K. contributed equally
The authors declare no competing financial interest.
Supplementary Material
References
- Rabin I.; Schulze W.; Ertl G. Light Emission During the Agglomeration of Silver Clusters in Noble Gas Matrices. J. Chem. Phys. 1998, 108 (12), 5137–5142. 10.1063/1.475919. [DOI] [Google Scholar]
- Rabin I.; Schulze W.; Ertl G. Absorption Spectra of Small Silver Clusters Ag-n (n > = 3). Chem. Phys. Lett. 1999, 312 (5–6), 394–398. 10.1016/S0009-2614(99)00872-6. [DOI] [Google Scholar]
- Harb M.; Rabilloud F.; Simon D.; Rydlo A.; Lecoultre S.; Conus F.; Rodrigues V.; Felix C. Optical Absorption of Small Silver Clusters: Ag(n), (n = 4–22). J. Chem. Phys. 2008, 129 (19), 194108. 10.1063/1.3013557. [DOI] [PubMed] [Google Scholar]
- Harb M.; Rabilloud F.; Simon D. Optical Response of Silver Nanoclusters Complexed With Aromatic Thiol Molecules: a Time-Dependent Density Functional Study. J. Phys. B-at Mol. Opt. 2011, 44 (3), 035101. 10.1088/0953-4075/44/3/035101. [DOI] [Google Scholar]
- Jin R. C.; Zeng C. J.; Zhou M.; Chen Y. X. Atomically Precise Colloidal Metal Nanoclusters and Nanoparticles: Fundamentals and Opportunities. Chem. Rev. 2016, 116 (18), 10346–10413. 10.1021/acs.chemrev.5b00703. [DOI] [PubMed] [Google Scholar]
- Petty J. T.; Zheng J.; Hud N. V.; Dickson R. M. DNA-Templated Ag Nanocluster Formation. J. Am. Chem. Soc. 2004, 126 (16), 5207–5212. 10.1021/ja031931o. [DOI] [PubMed] [Google Scholar]
- Choi S.; Dickson R. M.; Yu J. H. Developing Luminescent Silver Nanodots for Biological Applications. Chem. Soc. Rev. 2012, 41 (5), 1867–1891. 10.1039/C1CS15226B. [DOI] [PubMed] [Google Scholar]
- Copp S. M.; Gorovits A.; Swasey S. M.; Gudibandi S.; Bogdanov P.; Gwinn E. G. Fluorescence Color by Data-Driven Design of Genomic Silver Clusters. ACS Nano 2018, 12 (8), 8240–8247. 10.1021/acsnano.8b03404. [DOI] [PubMed] [Google Scholar]
- Swasey S. M.; Copp S. M.; Nicholson H. C.; Gorovits A.; Bogdanov P.; Gwinn E. G. High Throughput Near Infrared Screening Discovers DNA-Templated Silver Clusters With Peak Fluorescence Beyond 950 nm. Nanoscale 2018, 10 (42), 19701–19705. 10.1039/C8NR05781H. [DOI] [PubMed] [Google Scholar]
- Thyrhaug E.; Bogh S. A.; Carro-Temboury M. R.; Madsen C. S.; Vosch T.; Zigmantas D. Ultrafast Coherence Transfer in DNA-Templated Silver Nanoclusters. Nat. Commun. 2017, 8, 15577. 10.1038/ncomms15577. [DOI] [PMC free article] [PubMed] [Google Scholar]
- Patel S. A.; Cozzuol M.; Hales J. M.; Richards C. I.; Sartin M.; Hsiang J. C.; Vosch T.; Perry J. W.; Dickson R. M. Electron Transfer-Induced Blinking in Ag Nanodot Fluorescence. J. Phys. Chem. C 2009, 113 (47), 20264–20270. 10.1021/jp9079537. [DOI] [PMC free article] [PubMed] [Google Scholar]
- Yau S. H.; Abeyasinghe N.; Orr M.; Upton L.; Varnavski O.; Werner J. H.; Yeh H. C.; Sharma J.; Shreve A. P.; Martinez J. S.; et al. Bright Two-Photon Emission and Ultra-Fast Relaxation Dynamics in a DNA-Templated Nanocluster Investigated by Ultra-Fast Spectroscopy. Nanoscale 2012, 4 (14), 4247–4254. 10.1039/c2nr30628j. [DOI] [PubMed] [Google Scholar]
- Volkov I. L.; Reveguk Z. V.; Serdobintsev P. Y.; Ramazanov R. R.; Kononov A. I. DNA as UV Light-Harvesting Antenna. Nucleic Acids Res. 2018, 46 (7), 3543–3551. 10.1093/nar/gkx1185. [DOI] [PMC free article] [PubMed] [Google Scholar]
- Copp S. M.; Gonzàlez-Rosell A. Large-scale Investigation of the Effects of Nucleobase Sequence on Fluorescence Excitation and Stokes Shifts of DNA-Stabilized Silver Clusters. Nanoscale 2021, 13 (8), 4602–4613. 10.1039/D0NR08300C. [DOI] [PMC free article] [PubMed] [Google Scholar]
- Gonzalez-Rosell A.; Malola S.; Guha R.; Arevalos N.; Matus M.; Goulet M.; Haapaniemi E.; Katz B.; Vosch T.; Kondo J.; et al. Chloride Ligands on DNA-Stabilized Silver Nanoclusters. ChemRxiv (Materials Chemistry) 2023, (accessed 2023-04-17) 10.26434/chemrxiv-2023-m9txt. [DOI] [PMC free article] [PubMed] [Google Scholar]
- Gonzàlez-Rosell A.; Cerretani C.; Mastracco P.; Vosch T.; Copp S. M. Structure and Luminescence of DNA-Templated Silver Clusters. Nanoscale Adv. 2021, 3, 1230–1260. 10.1039/D0NA01005G. [DOI] [PMC free article] [PubMed] [Google Scholar]
- Bogh S. A.; Carro-Temboury M. R.; Cerretani C.; Swasey S. M.; Copp S. M.; Gwinn E. G.; Vosch T. Unusually Large Stokes Shift for a Near-Infrared Emitting DNA-Stabilized Silver Nanocluster. Methods Appl. Fluoresc. 2018, 6 (2), 024004. 10.1088/2050-6120/aaa8bc. [DOI] [PubMed] [Google Scholar]
- Cerretani C.; Kanazawa H.; Vosch T.; Kondo J. Crystal Structure of a NIR-Emitting DNA-Stabilized Ag16 Nanocluster. Angew. Chem., Int. Ed. 2019, 58 (48), 17153–17157. 10.1002/anie.201906766. [DOI] [PubMed] [Google Scholar]
- Cerretani C.; Palm-Henriksen G.; Liisberg M. B.; Vosch T. The Effect of Deuterium on the Photophysical Properties of DNA-Stabilized Silver Nanoclusters. Chem. Sci. 2021, 12 (48), 16100–16105. 10.1039/D1SC05079F. [DOI] [PMC free article] [PubMed] [Google Scholar]
- Cerretani C.; Liisberg M.; Rück V.; Kondo J.; Vosch T. The Effect of Inosine on the Spectroscopic Properties and Crystal Structure of a NIR-Emitting DNA-Stabilized Silver Nanocluster. Nanoscale Adv. 2022, 4, 3212–3217. 10.1039/D2NA00325B. [DOI] [PMC free article] [PubMed] [Google Scholar]
- Strickler S. J.; Berg R. A. Relationship between Absorption Intensity and Fluorescence Lifetime of Molecules. J. Chem. Phys. 1962, 37 (4), 814–822. 10.1063/1.1733166. [DOI] [Google Scholar]
- Mukamel S.Principles of Nonlinear Optical Spectroscopy; Oxford University Press: New York, 1995. [Google Scholar]
- Zhang Y.; He C.; de La Harpe K.; Goodwin P. M.; Petty J. T.; Kohler B. A Single Nucleobase Tunes Nonradiative Decay in a DNA-Bound Silver Cluster. J. Chem. Phys. 2021, 155 (9), 094305. 10.1063/5.0056836. [DOI] [PubMed] [Google Scholar]
- Zhang Y.; He C.; Petty J. T.; Kohler B. Time-Resolved Vibrational Fingerprints for Two Silver Cluster-DNA Fluorophores. J. Phys. Chem. Lett. 2020, 11 (21), 8958–8963. 10.1021/acs.jpclett.0c02486. [DOI] [PubMed] [Google Scholar]
- Vosch T.; Antoku Y.; Hsiang J. C.; Richards C. I.; Gonzalez J. I.; Dickson R. M. Strongly Emissive Individual DNA-Encapsulated Ag Nanoclusters as Single-Molecule Fluorophores. Proc. Natl. Acad. Sci. U.S.A. 2007, 104 (31), 12616–12621. 10.1073/pnas.0610677104. [DOI] [PMC free article] [PubMed] [Google Scholar]
- Volkov I. L.; Serdobintsev P. Y.; Kononov A. I. DNA-Stabilized Silver Nanoclusters With High Yield of Dark State. J. Phys. Chem. C 2013, 117 (45), 24079–24083. 10.1021/jp410088h. [DOI] [Google Scholar]
- Petty J. T.; Fan C.; Story S. P.; Sengupta B.; St. John Iyer A.; Prudowsky Z.; Dickson R. M. DNA Encapsulation of 10 Silver Atoms Producing a Bright, Modulatable, Near-Infrared-Emitting Cluster. J. Phys. Chem. Lett. 2010, 1 (17), 2524–2529. 10.1021/jz100817z. [DOI] [PMC free article] [PubMed] [Google Scholar]
- Rück V.; Cerretani C.; Neacşu V. A.; Liisberg M. B.; Vosch T. Observation of Microsecond Luminescence While Studying Two DNA-Stabilized Silver Nanoclusters Emitting in the 800–900 nm Range. Phys. Chem. Chem. Phys. 2021, 23 (24), 13483–13489. 10.1039/D1CP01731D. [DOI] [PubMed] [Google Scholar]
- Liisberg M.; Krause S.; Cerretani C.; Vosch T. Probing Emission of a DNA-Stabilized Silver Nanocluster from the Sub-Nanosecond to Millisecond Timescale in a Single Measurement. Chem. Sci. 2022, 13, 5582–5587. 10.1039/D2SC01137A. [DOI] [PMC free article] [PubMed] [Google Scholar]
- Petty J. T.; Carnahan S.; Kim D.; Lewis D. Long-Lived Ag106+ Luminescence and a Split DNA Scaffold. J. Chem. Phys. 2021, 154 (24), 244302. 10.1063/5.0056214. [DOI] [PubMed] [Google Scholar]
- Krause S.; Carro-Temboury M. R.; Cerretani C.; Vosch T. Probing Heterogeneity of NIR Induced Secondary Fluorescence From DNA-Stabilized Silver Nanoclusters at the Single Molecule Level. Phys. Chem. Chem. Phys. 2018, 20 (24), 16316–16319. 10.1039/C8CP02584C. [DOI] [PubMed] [Google Scholar]
- Neacsu V. A.; Cerretani C.; Liisberg M. B.; Swasey S. M.; Gwinn E. G.; Copp S. M.; Vosch T. Unusually Large Fluorescence Quantum Yield for a Near-Infrared Emitting DNA-Stabilized Silver Nanocluster. Chem. Commun. 2020, 56 (47), 6384–6387. 10.1039/D0CC01849J. [DOI] [PubMed] [Google Scholar]
- van Stokkum I. H. M.; Larsen D. S.; van Grondelle R. Global and Target Analysis of Time-Resolved Spectra. BBA-Bioenergetics 2004, 1657 (2–3), 82–104. 10.1016/j.bbabio.2004.04.011. [DOI] [PubMed] [Google Scholar]
Associated Data
This section collects any data citations, data availability statements, or supplementary materials included in this article.


