Abstract
In recent years, an open search of tandem mass spectra has greatly promoted the detection of post-translational modifications (PTMs) in shotgun proteomics. However, post-processing of the results from open searches remains an unsatisfactorily resolved problem, which hinders the open search mode from wide practical use. PTMiner is a software tool based on dedicated statistical algorithms for reliable filtering, localization and annotation of the modifications (mass shifts) detected by open search. Furthermore, PTMiner also supports quality control and re-localization of modifications identified by the traditional closed search. In this protocol, we describe how to use PTMiner for the two search modes. Currently, the search engines supported by PTMiner include pFind, MSFragger, MaxQuant, Comet, MS-GF + and SEQUEST.
Keywords: Modification identification, Open search, False discovery rate, Modification localization, False localization rate
INTRODUCTION
Why PTMiner?
The presence of post-translational modifications (PTMs) is a major reason for the complexity of proteome and the existence of “proteoforms”, i.e., different proteins produced from the same gene. The PTM proteoforms have the same amino acid sequences but vary in a number of specific sites that are differentially modified. PTMs on these sites may cause huge changes in the physical and chemical properties of the proteins. As a consequence, the identification of these PTMs and their precise sites is crucial to the study of protein structure and function. Mass spectrometry (MS) instruments are developing rapidly, and have greatly promoted the development of proteomics (Aebersold and Mann 2016). The PTMs are reflected as specific mass shifts of the peaks in the tandem mass spectra of peptides. Therefore, matching the experimental mass spectra with the theoretical spectra predicted from the peptide sequences (possibly in modified forms) in a protein database enables the effective identification of proteins and their PTMs. The traditional way to do this is called Closed Database Search which uses a tight tolerance of precursor masses and can only consider a limited number of modification types (Yates et al. 1995). When there exist many unanticipated or unknown modifications in the sample, the closed search may fail to interpret a large proportion of mass spectra (Fu 2016). Open search can solve this problem by using a large precursor tolerance, e.g., 500 Da. The mass shifts between the experimental spectra and the theoretical spectra are explained as potential modifications. A number of open search engines have been developed since this idea was proposed in 2000 (Pevzner et al. 2000). In recent years, this strategy has been greatly promoted by several newly developed search engines, e.g., Open-pFind (Chi et al. 2018) and MSFragger (Kong et al. 2017), which can analyze large-scale MS data at speeds comparable to closed search.
However, open searches produce search results that are of higher complexity and error rate than closed searches. Effective post-processing of the open-search results remains an unsatisfactorily resolved problem, which hinders the open search mode from wide practical use. Most open search engines simply report the mass shifts without localizing them to the specific amino acids on the peptides. Although some engines try to localize the mass shifts, they do this in rather simplistic ways leading to a high false localization rate. In open search, the modifications (mass shifts) can in theory occur on any site of the peptides and are thus much more difficult to precisely localize than those in closed search. The widely used target-decoy search (TDS) approach to estimate the false discovery rate (FDR) essentially evaluates the quality of peptide-spectrum matches (PSMs) at the whole peptide sequence level and cannot measure the error rate of modification sites. Moreover, even when used to control the FDR of PSMs, the TDS approach often faces some problems in PTM identification. A global FDR as estimated by current search engines is usually inapplicable to the subset of modified peptides of interest. Separate FDR estimation is a better choice but may also fail when the search result contains a very small number of PSMs with target PTMs. This problem is very common in open search which generates various mass shifts, which are mostly in small numbers. Finally, the identities of the discovered mass shifts have to be properly annotated by either matching them to existing entries in the protein modification database or classifying them as novel ones. This is a simple task but also prone to annotation mistakes.
PTMiner is a software tool we developed to address the above issues faced by the open search strategy (An et al. 2019). It uses dedicated statistical algorithms to effectively control the quality of PSMs with various mass shifts and confidently localize the modification sites on the peptides. It annotates the identities of mass shifts by matching them to the existing entries in the Unimod database. Tested on both simulated and synthesized-peptide datasets, PTMiner successfully controlled the FDR of peptides carrying diverse modifications using the transfer FDR method (Fu and Qian 2014). It also localized the modification sites more accurately than open search engines or existing re-localization algorithms. We used PTMiner to characterize the protein modifications (both known and unknown) in a draft map of the human proteome which contains approximately 25 million MS/MS spectra. From the open-search results from pFind (v2.8), PTMiner reported over 1.7 million modified PSMs at 1% FDR and 1% FLR (false localization rate). In addition, PTMiner can also more accurately re-localize the modifications identified by the closed search (An et al. 2018).
Here we list five reasons to use PTMiner. (1) Transfer FDR in PTMiner is an effective and reliable FDR estimation method for different modifications. (2) For open search, PTMiner can localize mass shifts more precisely, and can annotate the mass shifts according to the Unimod database. (3) For closed search, PTMiner can also re-localize the modifications and control their FLR. (4) Several popular search engines are supported, with seamless support of pFind3 and MSFragger. (5) PTMiner is free, fast and friendly.
The focus of this protocol
In this protocol, we demonstrate how to post-process the modified PSMs using PTMiner. We first show the configuration and usage of PTMiner for the open search mode and then for the closed search mode. Finally, we show several parts of the result files and describe the meaning of each attribute.
The workflow of PTMiner
The PTMiner program contains three modules for post-processing the results of search engines. The first module is FDR filtering for both closed search and open search. The second module is mass-shift localization for open search or re-localization of modification sites for closed search. The last module is the annotation of mass shifts (only for open search). PTMiner matches the mass shifts and their specificities to the entries in Unimod. The following is the detailed process of PTMiner (see Fig. 1).
Figure 1.
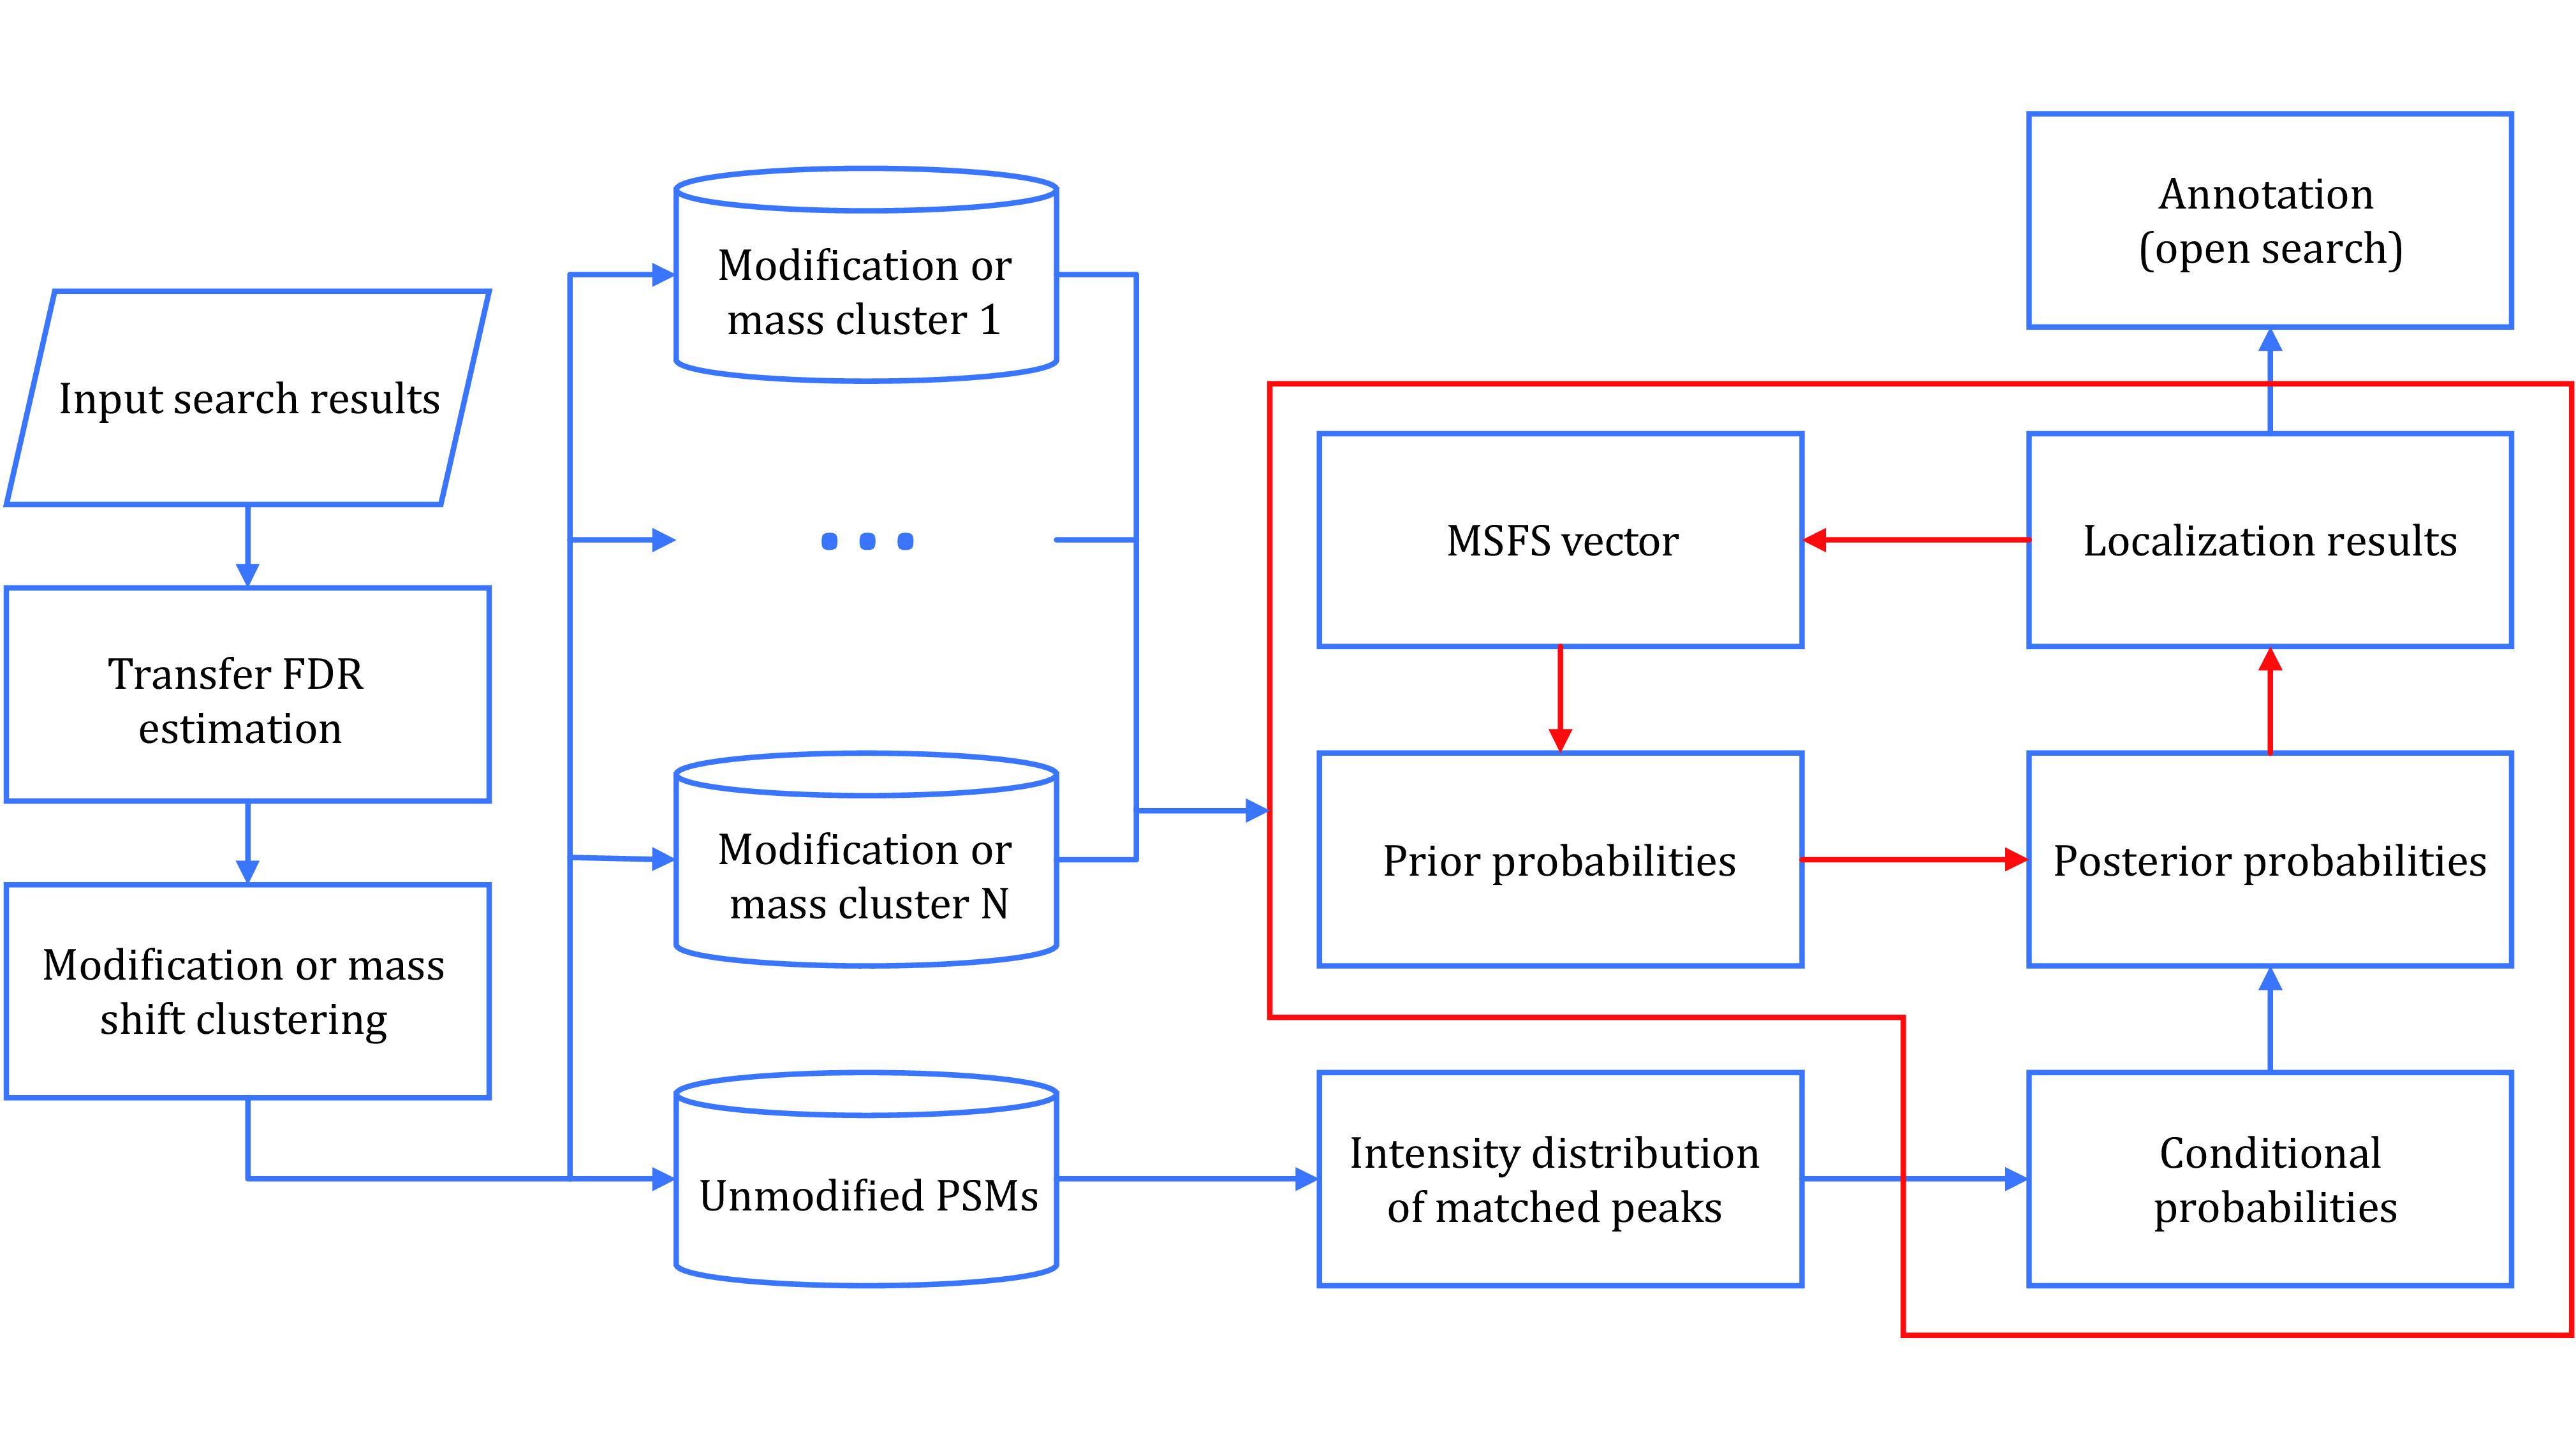
The workflow of PTMiner. The part in the red box shows the process of the localization algorithm, in which the red arrows represent iterative updating of prior probabilities
(1) For open search, PTMiner first groups PSMs by mass shifts into 1-Da-size bins centered on integers, e.g., [0.5, 1.5] Da. Then, transfer FDR (recommended) estimation is applied to each bin to yield modification-specific FDRs, and the PSMs are filtered to control the FDRs at a given level. For closed search, PTMiner groups PSMs by the target modifications specified by the user and filters PSMs using transfer FDR.
(2) For open search, PTMiner clusters the mass shifts within each bin using a Gaussian mixture model and treats each cluster as a target modification. For closed search, the target modifications are specified by the user. PTMiner then groups the PSMs (after filtration in the above step) by the target modifications. For unmodified PSMs or PSMs with non-target modifications, PTMiner groups them as one cluster to fit the distribution of matched-peak intensities for localization probability calculation.
(3) PTMiner calculates the localization probability in a Bayesian framework. It first sets uniform prior probabilities for all sites (open search) or user-specified sites (close search) and calculates a conditional probability for each candidate site on the peptide using the intensity distribution of matched peaks. From the prior probabilities and conditional probabilities, posterior probabilities are calculated, and the modification is localized to the site of the maximum posterior probability. Importantly, PTMiner uses an EM-like algorithm to iteratively update the prior probabilities to improve the localization accuracy.
(4) For open search, PTMiner compares the localized mass shifts with the modifications in the Unimod database to annotate the identities of mass shifts. The mass shifts may be fully annotated (both mass and site matched), partially annotated (only mass matched), or unannotated.
SETUP
Hardware and software requirements
• A personal computer (PC) with at least 2 GB of RAM
• 64-bit version of Microsoft Windows 7 or a newer operating system
• More than 740 pixels in the vertical direction of the computer display resolution.
• .NET framework 4.5 or a higher version. Available at: https://www.microsoft.com/en-us/download/details.aspx?id=30653
• PTMiner 1.2.6 or higher. Free download at http://fugroup.amss.ac.cn/software/PTMiner/PTMiner.html
Installation of PTMiner
No installation process is needed. Download PTMiner.zip and extract it to an appropriate directory. Then, double click PTMiner.exe to start PTMiner.
PROTOCOL
About the construction of this protocol
Since PTMiner performs differently on open-search results and closed-search results, we will describe the two procedures separately.
Procedures for open search
Step 1: Start the PTMiner software
Double click PTMiner.exe and start the PTMiner software.
[Note] A “Windows protected your PC” dialog may pop up when opening PTMiner for the first time because Microsoft Defender SmartScreen cannot recognize the publisher of the program. Just click “More info” and choose “Run anyway” to open the main interface of PTMiner.
Step 2: Set parameters in the “Search Parameters” tab
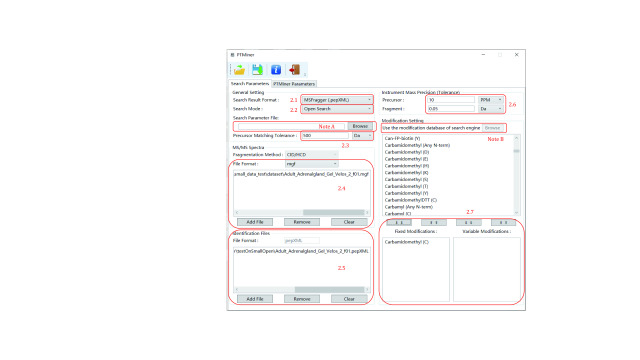
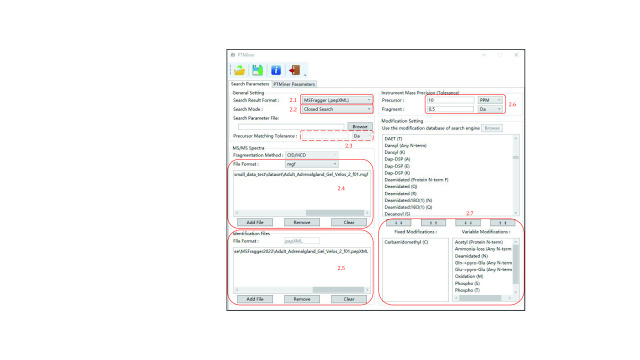
Set the same parameters as used by the search engine in the “Search Parameters” tab (Fig. 2).
Figure 2.
Setting the search parameters (open search)
Step 2.1: Select “Search Result Format” according to your search engine. PTMiner supports the result format of pFind 3, pFind 2.8, MSFragger, Comet, Sequest and PTMiner’s own format.
[Note] The search results of MS-GF+ or MaxQuant can be converted to PTMiner format using the tool PSMConvert.exe provided in the PTMiner directory. For MS-GF+ in particular, before converting to PTMiner format, the identification result file (.mzid) should be converted to a tab-separated file (.tsv) with tools described in the MS-GF+ usage information. When converting a .tsv file to PTMiner format using PSMConvert.exe, the specified modification file should follow the format of MSGFPlus_Mods1.txt provided in the MS-GF+ package.
Step 2.2: Select “Open Search”.
[Note] Open search is also called mass-tolerance search, in which a large precursor tolerance widow, e.g., 500 Da, is used. For pFind 3 in particular, Open Search contains two modes, i.e. “Open search (Open-pFind)” and “Open Search (large tolerance)”. The former was designed for Open-pFind (Chi et al. 2018), in which the “open search” checkbox of pFind 3 is checked and a small, normal tolerance is used. PTMiner performs similarly to the closed search mode (refer to section 3.3) when “Open search (Open-pFind)” is selected. The latter was designed for mass-tolerant search of pFind 3, which means that the “open search” checkbox of pFind 3 is not checked and a large precursor mass tolerance, e.g., 500 Da, is used. This is the open search mentioned in this section.
[Note] PTMiner can be seamlessly connected to the downstream analysis for results of pFind 3 and MSFragger since most search parameters can be imported by loading the configuration file of the search engine. Click “Browse” beside the “Search Parameter File” and choose the \param\pFind.cfg for pFind 3 or .params for MSFragger to automatically set the search parameters (“Note A” in Fig. 2). For pFind 3, loading the modification database used by pFind3 is also supported: click “Browse” to select the modification.ini file in the pFind 3 directory (“Note B” in Fig. 2).
Step 2.3: Specify the “Precursor Matching Tolerance”. The value of this parameter must be consistent with that used by the search engine.
Step 2.4: Select the corresponding MS/MS spectra file. Click the “Add File” button to add MS/MS Spectra. If incorrect files are selected, click the “Remove” button to delete the file(s) selected in the list, or click the “Clear” button to delete all files. As an example, a .mgf file (\demo\small_data_test\dataset\Adult_Adrenalgland_Gel_Velos_2_f01.mgf) is loaded.
[Note] PTMiner only supports centroid MS/MS spectra in .mgf format. If the search engine searched spectra that were already in .mgf format, then the same .mgf files should be used by PTMiner. Otherwise, the spectra must be converted to .mgf format properly. For example, using the MSConvert tool (Chambers et al. 2012) with default configuration can meet the requirements of format conversion. For MaxQuant, there must be the “SCAN=” value in the “TITLE” attribute in the .mgf files. For MSFragger version 3.4 or higher, if raw files are searched, .mgf files with the ‘_uncalibrated’ suffix in their file names will be generated by default in the raw directory. Either these .mgf files with the ‘_uncalibrated’ suffix removed or .mgf files converted from raw files using MSConvert can be specified as the spectra files for PTMiner. For pFind 3, if raw files are searched, .mgf files will be generated by default (saved in the same directory as raw files), and these .mgf files should be used by PTMiner. However, importantly, only one single integrated .mgf file is supported for pFind3 and thus multiple .mgf files should be combined into one using the FilesMerger.exe tool provided in the PTMiner directory.
Step 2.5: Select the search result of the search engine in the “Identification Files” region. PTMiner supports .spectra format for pFind 3, .txt format for pFind 2.8, .pepXML format for MSFragger, .pep.xml format for Comet, .txt format for SEQUEST, and PTMiner .txt format. For example, a .pepXML file (demo\small_data_test\open\MSFragger\Adult_Adrenalgland_Gel_Velos_2_f01.pepXML) is loaded here.
Step 2.6: Specify the precursor and fragment tolerances according to the instrument mass precision.
[Note] The fragment tolerance can be the same as that used by the search engine, but the precursor tolerance may be different. For open search, the precursor tolerance here is not the large tolerance used by the search engine but rather the normal tolerance, e.g., 20 ppm.
Step 2.7: Specify the same fixed and variable modifications as used by the search engine.
[Note] For pFind3, we recommend adding all modifications including fixed and variable modifications into the “variable modification” list of PTMiner.
Step 3: Set FDR filtering parameters
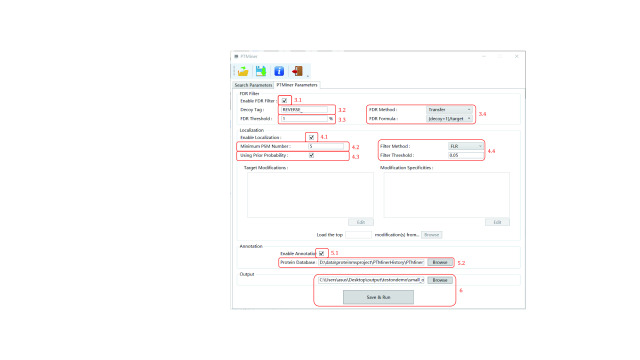
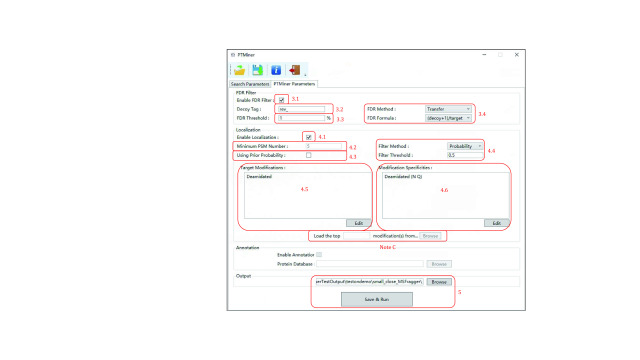
Set the FDR filtering parameters as shown in Fig. 3.
Figure 3.
Setting the PTMiner parameters (open search)
Step 3.1: Specify whether to do FDR estimation and PSM filtering.
[Note] By default, “Enable FDR Filter” is checked. Uncheck it if you want to skip the FDR filtering step, which means that all PSMs from the search result will undergo the localization step.
Step 3.2: Specify the “Decoy Tag” used by the search engine to indicate decoy sequences in protein names.
Step 3.3: Specify the “FDR Threshold”.
Step 3.4: Select the “FDR Method” and “Target Decoy Method”.
[Note] We recommend the transfer FDR estimation method, which performs robustly when the modification group is small, and the (decoy + 1)/target estimation formula, which strictly controls the FDR (He et al. 2015).
Step 4: Set localization parameters
Set the localization parameters as shown in Fig. 3, also.
Step 4.1: Specify whether to re-localize mass shifts.
[Note] By default, “Enable Localization” is checked. Uncheck it if you want to skip this step, in which case the search engine-determined locations (if available) will be used.
Step 4.2: Specify the “Min Modification Number” to filter out infrequent mass shifts.
[Note] The default value of 5 means that PTMiner will ignore mass shifts that occur in less than 5 PSMs
Step 4.3: Specify whether to use the prior probability during localization.
[Note] By default, “Using Prior Probability” is checked for open search, indicating that the prior probabilities will be iteratively updated and PTMiner makes use of both the spectral peak matching information and the site specificity preference learned from the data to localize the mass shifts. Unchecking the checkbox implies that PTMiner exclusively relies on the peak matching information for localization.
Step 4.4: Specify the “Filter Method” and “Filter Threshold”. The “Filter Method” contains two options, namely “Probability” and “FLR”. The former is the posterior probability of the localized site (which is shown in the result file), and the latter is the false localization rate. Localization results with probability or FLR less significant than the threshold will be filtered out.
Step 5: Set annotation parameters
Likewise, set the localization parameters as shown in Fig.3.
Step 5.1: Specify whether to annotate the mass shifts.
[Note] By default, “Enable Annotation” is checked. Uncheck it if you do not want to perform annotation.
Step 5.2: Click “Browse” and select the protein sequence database file (in .fasta format) that is used during the database search. For instance, a .fasta file (\demo\database\uniprot-sp-human.fasta) is loaded.
[Note]: In addition to matching the mass shifts to known modifications, PTMiner also tries to interpret the mass shifts as possible amino acid variations. This is why the sequence database is needed.
Step 6: Set output directory and run
After setting the output directory, a parameter file will be generated and saved before running (Fig. 3).
Step 7: View the running results
Open the output directory to view the running results.
[Note] If the “Enable FDR Filter” is checked, filtered_result.txt and filtered_summary.txt will appear in the directory. loc_result.txt and loc_summary.txt will appear in the directory if “Enable Localization” is checked. Furthermore, anno_result.txt and anno_summary.txt will appear when “Enable Annotation” is checked. These files are tab-delimited text files and can be properly opened and viewed with Microsoft Excel.
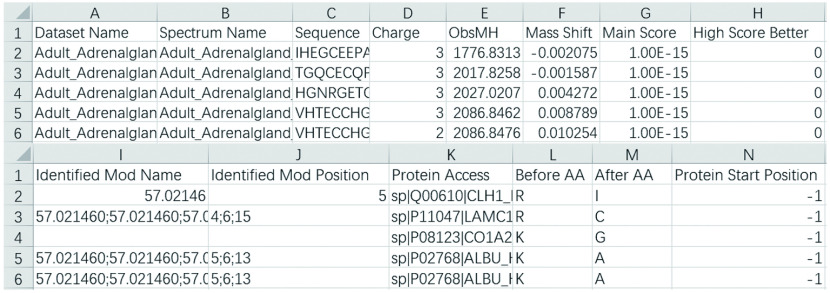
Step 7.1: Open the filtered_result.txt. An example is shown in Fig. 4. The meaning of each column is given in Table 1.
Figure 4.
An example of filtered_result.txt displayed by Excel. Since one line of the original result file is too wide to display, it is cut into two lines to show here
Table 1. The meanings of columns in filtered_result.txt.
|
Column |
Meaming |
| Dataset name | Spectrum file name without path, e.g., “test.mgf” |
| Spectrum name | Spectrum name or scan number |
|
Sequence |
Identified peptide sequence |
|
Charge |
Precursor charge |
|
ObsMH |
The experimentally observed peptide MH+ |
|
Mass shift |
Mass difference between observed and identified peptides |
|
Main score |
Final score for pFind 3, E-value for pFind 2.8, expect search score for MSFragger and Comet, XCorr for SEQUEST, SpecEValue for MS-GF+ , Score for MaxQuant |
|
High score better |
Whether higher main score is better. 1 for yes and 0 for no |
|
Identified Mod name |
Identified modification names including both fixed and variable modifications. If the PSM contains more than one modifications, they are separated by “;”, e.g., “Carbamidomethyl;Carbamidomethyl”. If the PSM contains no modifications, it is empty |
|
Identified Mod position |
Identified modification positions corresponding to the identified modifications. If the PSM contains more than one modifications, they are separated by “;”, e.g., “6;12”. If the PSM contains no modifications, it is empty. “0” represents the N-terminal of the peptide and “length of peptied + 1” represents the C-terminal of the peptide, 1 to “length of peptide” indicate the corresponding position of the peptide sequence |
|
Protein access |
The access of protein from which peptide comes. If the PSM contains more than one proteins, they are separated by “;”, e.g., “sp|P05141|ADT2_HUMAN;sp|P12236|ADT3_HUMAN” |
|
Before AA |
The adjacent amino acid before peptide in protein. If the PSM contains more than one proteins, they are separated by “;”, e.g., “K;K”. Otherwise it is set to “-” |
|
After AA |
The adjacent amino acid after peptide in protein. If the PSM contains more than one proteins, they are separated by “;”, e.g., “R;H”. Otherwise it is set to “-” |
|
Protein start position |
The starting position of the peptide in the protein sequence. It is only available when the search engine is pFind 3 or pFind 2.8. Otherwise, it is set to –1 |
Step 7.2: Open the loc_result.txt. An example is shown in Fig. 5. The meanings of the columns that appeared in filtered_result.txt are given in Table 1, and the meanings of additional columns are given in Table 2.
Figure 5.
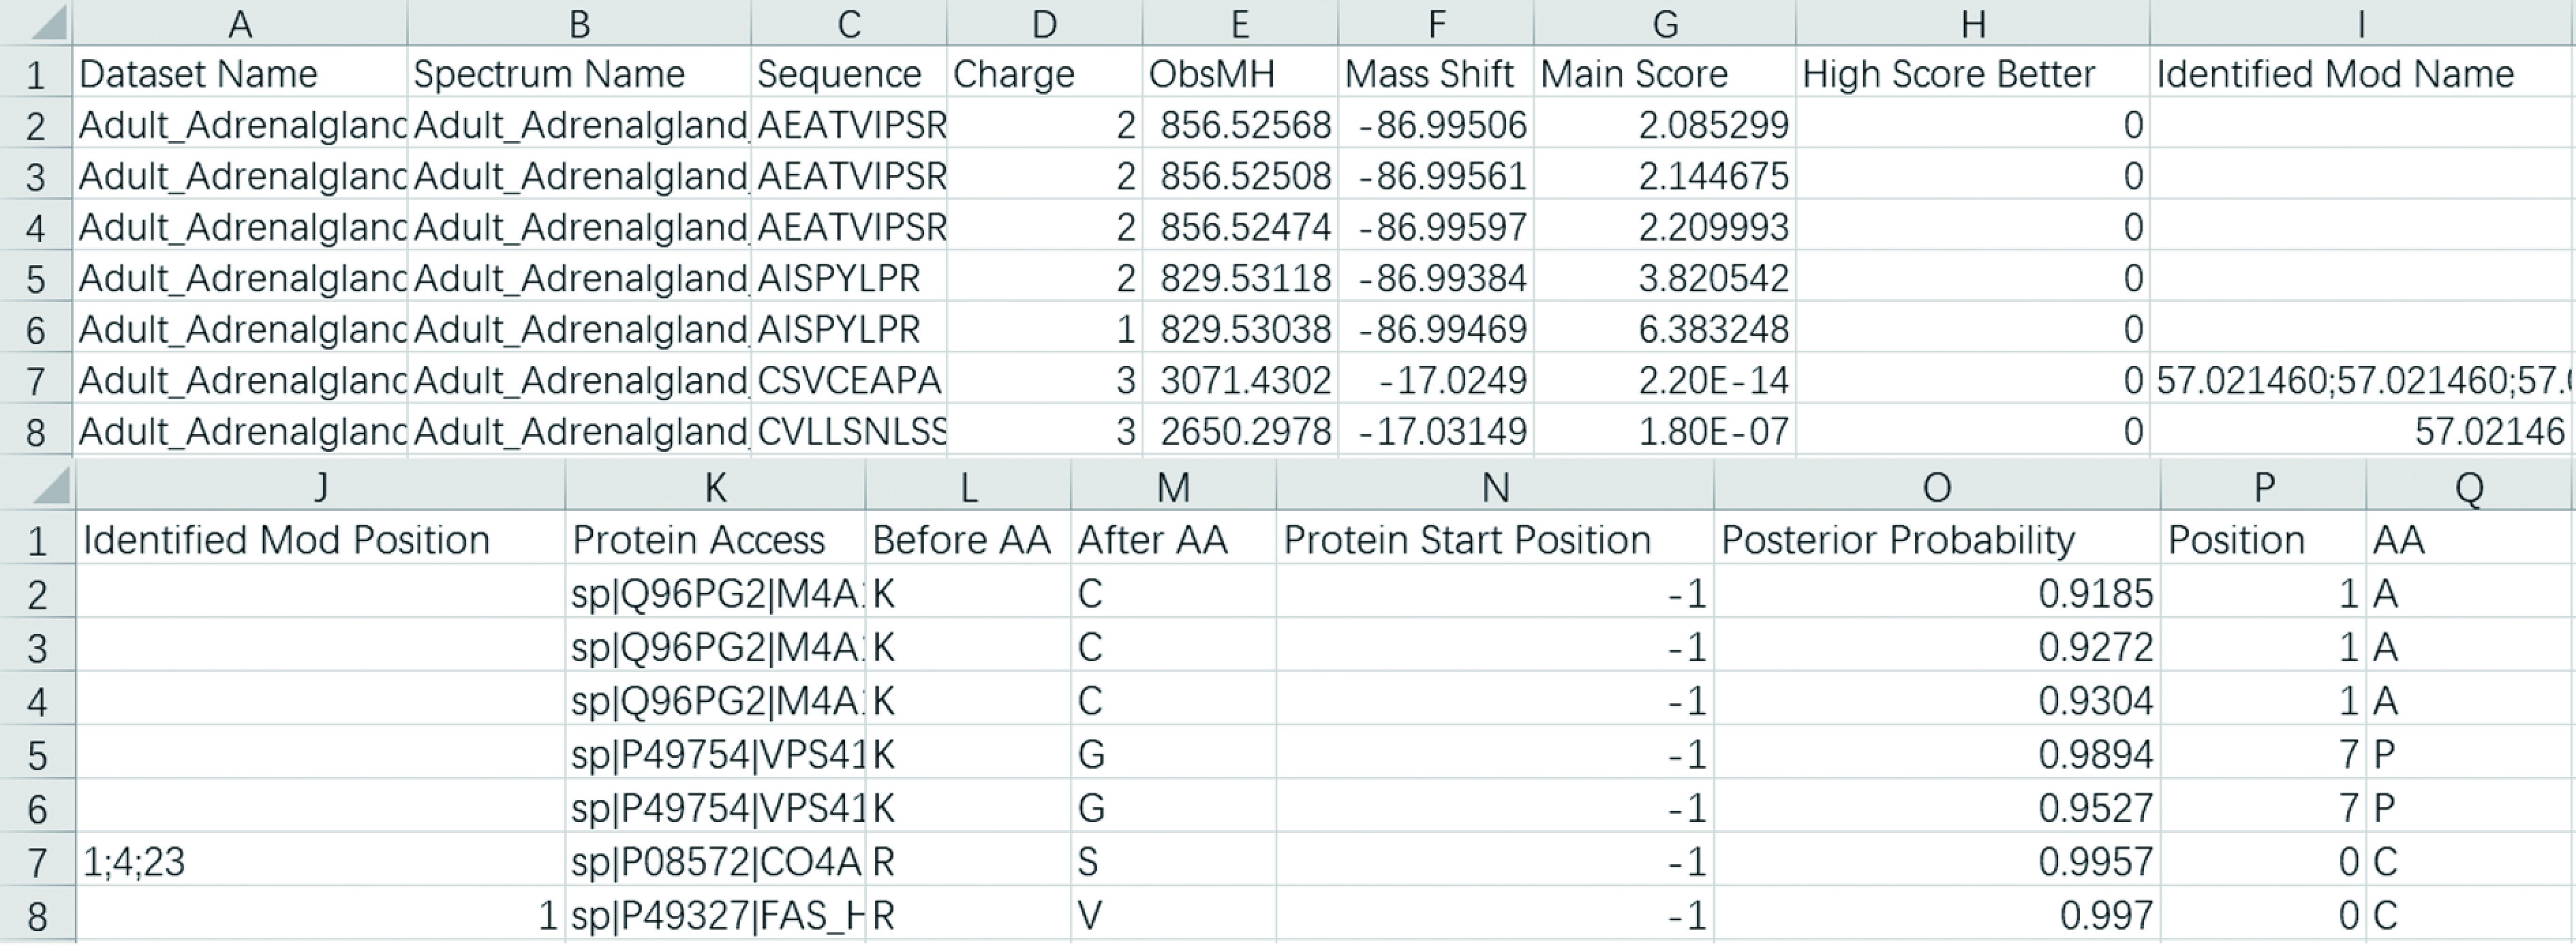
An example loc_result.txt displayed by Excel. Since one line of the original result file is too wide to display, it is cut into two lines to show here
Table 2. The meanings of additional columns in loc_result.txt.
| Column | Meaning |
| Posterior probability | The maximum posterior probability of the position localized in the peptide sequence |
| Position | The position with the maximum posterior probability |
| AA | The amino acid with the maximum posterior probability |
Step 7.3: Open the anno_result.txt. An example is shown in Fig. 6. Anno_result.txt contains two headers. The first header is for basic information on the localization result (the first line in Fig. 6). Lines starting with a number corresponding to it. The second header is for the annotation result (the second line in Fig. 6) which corresponds to lines starting with asterisks. The meanings of columns in the first header that appeared in loc_result.txt are given in Table 1 and Table 2, and the additional columns are given in Table 3 and Table 4.
Figure 6.

An example anno_result.txt displayed by Excel. Since one line of the original result file is too wide to display, the middle part of the lines are omitted here
Table 3. The meanings of additional columns in the first header in anno_result.txt.
|
Column |
Meaning |
| SDP score |
Similarity score between spectra of modified and corresponding unmodified peptides (with the same sequence and non-target modifications) |
| Annotation type |
Including three types, i.e. “Fully”, “Partially” and “None”. “Fully” indicates that both mass shift and site specificity are matched to existing modification(s) in Unimod. “Partially” indicates that only the mass is matched. “None” represents that the mass shift cannot be found in Unimod |
|
New sequence |
Updated new sequence after deleting or adding some amino acids on peptide termini. If a new peptide sequence (with or without modification) explains the mass shift better, this column will show the sequence. Otherwise, it is empty |
|
New Mod |
The possible explanation of the new mass shift given the new sequence above |
|
New Mod position |
The position of the new modification above |
Table 4. The meanings of columns in the second header in anno_result.txt.
| Column | Meaning |
| * | This sign indicates that this row is annotation result |
| # Mass, Mod | The order of the annotated mass (Mass) and the order of the annotated modification (Mod) |
| Annotated mass | Annotated mass |
| Annotated Mod | Annotated modification |
| Annotated Mod site | The same as the “Site” in the Unimod database |
| Annotated Mod term Spec | The same as the “Position” in the Unimod database |
| Annotated Mod classification | The same as the “Classification” in the Unimod database |
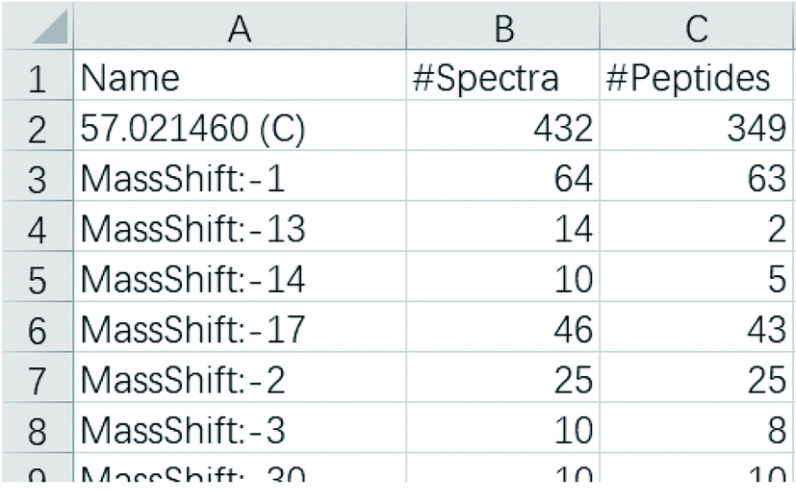
Step 7.4: Open the filtered_summary.txt. An example is shown in Fig. 7. The meanings of columns are given in Table 5. Open the loc_summary.txt and anno_summary.txt to view data in them. The columns in loc_summary.txt and anno_summary.txt have the same meaning as those in filtered_summary.txt. The former summarizes the modifications in loc_result.txt, while the latter summarizes the modifications in anno_result.txt.
Figure 7.
An example filtered_summary.txt displayed by Excel
Table 5. The meanings of columns in filtered_summary.txt.
|
Column |
Meaning |
| Name |
The names of all modifications that appear in the filtered_result.txt. For open search mode, a mass shift will also be treated as a modification for statistics, and will be displayed in the form of “MassShift:X”, where X is an integer obtained by rounding the mass shift |
| #Spectra |
The number of spectra with the above modification |
|
#Peptides |
The number of peptides with the above modification. Peptides are considered as the same when their peptide sequences and modification(s) (including site(s)) are the same |
|
#Sites |
The number of sites with the above modification. Sites are considered as the same, if their protein sets (protein accession and modification position on the protein sequence) given in the identification result are the same. This column will only appear when the search engine is pFind 3 or pFind 2.8. Since no location information can be acquired in the FDR filtering step, “MassShift:X” does not have a site-level count in the results of open search |
Procedures for closed search
Step 1: Start the PTMiner software
Double click PTMiner.exe and start the PTMiner software.
Step 2: Set parameters in the “Search Parameters” tab
Set the same parameters as used by the search engine in the “Search Parameters” tab (Fig. 8). Steps 2.1–2.7 are almost the same as described in Step 2 of the open search mode. The only difference is that the third substep, i.e., setting the “Precursor Matching Tolerance”, is not required. As an example, the same .mgf file as Step 2.4 in Section 3.2 and a .pepXML file (\demo\small_data_test\close\MSFragger\ Adult_Adrenalgland_Gel_Velos_2_f01.pepXML) are loaded.
Figure 8.
Setting the search parameters (closed search)
[Note] Automatically setting parameters by loading the configuration file of the search engine also works for the closed search mode. Click the “Browse” button beside the “Search Parameter File” label in the “Search Parameters” tab to load the configuration file. The instructions are the same as those for the open search mode (“Note A” in Fig. 2).
Step 3: Set FDR filtering parameters
Set the FDR filtering parameters (Fig. 9). Steps 3.1–3.4 are the same as described in Step 3 of the open search mode.
Figure 9.
Setting the PTMiner parameters (closed search)
Step 4: Set localization parameters
Set the localization parameters as shown in Fig. 9. Steps 4.1–4.4 are the same as described in Step 4 of the open search mode. We recommend unchecking “Using Prior Probability” for closed searches.
[Note]: For pFind 3, click “Browse” (“Note C” in Fig. 9) to select the \result\pFind.summary for automatically loading the modifications and specificities in 4.5 and 4.6, specify the “top N” blank indicate loading the N most abundant modifications.
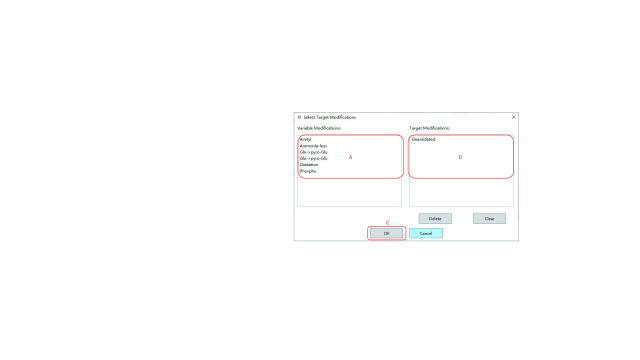
Step 4.5: Click “Edit” in the “Target modifications” region in Fig. 9 to specify the target modifications, and a “Select Target Modification” dialog box shown in Fig. 10 will pop up.
Figure 10.
Selecting the target modifications
(A) Specify the target modifications of interest in the “Variable Modification” list (candidate modification list). Once a modification is selected, it will move from the “Variable Modification” list to the “Target Modifications” list (selected modification list).
(B) Check if the “Target Modifications” list is exactly composed of all the modifications of interest. If the “Target Modifications” list contains unnecessary modifications, click “Delete” to remove the modifications selected in the list or click “Clear” to remove all modifications in it.
(C) Click “OK” to complete the specifying of the target modifications.
Step 4.6: Click “Edit” in the “Modification Specificities” region in Fig. 9 to specify at least one possible site specificity for each target modification, and PTMiner will only localize modification on sites that meet the site specificity condition. After clicking the “Edit” button, a “Select Modification Specificity” dialog box, as shown in Fig. 11, will pop up.
Figure 11.
Selecting the site specificities for each modification
(A) Select a modification in the “Target Modifications” list (left) to show the candidate and selected specificities list of this modification. The list of candidate specificities is shown in the “Modification Specificities” list (center), and the list of selected specificities is shown in the “Selected Modification Specificities” list (right).
(B) Click on all possible site specificities in the “Modification Specificities” list to move them to the “Selected Modification Specificities” list, or click “All” at the bottom to select all specificities, or click “All Amino Acid” at the bottom to select all amino acids as selected specificities.
(C) Check if the “Selected Modification Specificities” list is exactly composed of all the specificities of interest. If the list contains unnecessary specificities, click “Delete” to remove specificities selected in “Selected Modification Specificities” or click “Clear” to remove all specificities in it.
(D) Click “OK” to complete the specifying of the site specificities for all target modifications.
Annotation is not needed for closed search and is disabled.
Step 5: Set output directory and run
After setting the output directory, a parameter file will be generated and saved before running (Fig. 9).
Step 6: View the running results
Open the output directory to view the running results. The format of the files is almost the same as described in Step 7 of the open search. The only difference is that the two columns appended to the right of the loc_result.txt file in closed search mode (Fig. 12). These two columns are “Localized Modification” and “Original Site” respectively. “Localized Modification” represents the name of the target modification provided by the search engine, and “Original Site” indicates the original site of modification localized by the search engine.
Figure 12.

An example loc_result.txt displayed by Excel. Since one line of the original result file is too wide to display, the middle part of the lines are omitted here
Conflict of interest
Zhiyuan Cheng, Ge Song and Yan Fu declare that they have no conflict of interest.
Acknowledgements
This study was supported by the National Natural Science Foundation of China (32070668) and the National Key R&D Program of China (2022YFA1304603, 2022YFA1004801). We are grateful to Minjia Tan and Linhui Zhai from the Shanghai Institute of Materia Medica, Chinese Academy of Sciences, Mengqiu Dong, Adalet Memitimin and Zirui Zhao from the National Institute of Biological Sciences, Beijing, for their valuable suggestions in improving and testing PTMiner.
Compliance with Ethical Standards
Human and animal rights and informed consent
This article does not contain any studies with human or animal subjects performed by any of the authors.
Open Access
This article is licensed under a Creative Commons Attribution 4.0 International License, which permits use, sharing, adaptation, distribution and reproduction in any medium or format, as long as you give appropriate credit to the original author(s) and the source, provide a link to the Creative Commons licence, and indicate if changes were made. The images or other third party material in this article are included in the article’s Creative Commons licence, unless indicated otherwise in a credit line to the material. If material is not included in the article’s Creative Commons licence and your intended use is not permitted by statutory regulation or exceeds the permitted use, you will need to obtain permission directly from the copyright holder. To view a copy of this licence, visit http://creativecommons.org/licenses/by/4.0/.
References
- Aebersold R, Mann M Mass-spectrometric exploration of proteome structure and function. Nature. 2016;537(7620):347–355. doi: 10.1038/nature19949. [DOI] [PubMed] [Google Scholar]
- An Z, Gong F, Fu Y (2018) Unrestrictive protein modification localization and quality control for open search of mass spectra. ChemRxiv. 10.26434/chemrxiv. 5797995. v1
- An ZW, Zhai LH, Ying WT, Qian XH, Gong FZ, Tan MJ, Fu Y PTMiner: localization and quality control of protein modifications detected in an open search and its application to comprehensive post-translational modification characterization in human proteome. Mol Cell Proteomics. 2019;18(2):391–405. doi: 10.1074/mcp.RA118.000812. [DOI] [PMC free article] [PubMed] [Google Scholar]
- Chambers MC, Maclean B, Burke R, Amodei D, Ruderman DL, Neumann S, Gatto L, Fischer B, Pratt B, Egertson J, Hoff K, Kessner D, Tasman N, Shulman N, Frewen B, Baker TA, Brusniak MY, Paulse C, Creasy D, Flashner L, Kani K, Moulding C, Seymour SL, Nuwaysir LM, Lefebvre B, Kuhlmann F, Roark J, Rainer P, Detlev S, Hemenway T, Huhmer A, Langridge J, Connolly B, Chadick T, Holly K, Eckels J, Deutsch EW, Moritz RL, Katz JE, Agus DB, MacCoss M, Tabb DL, Mallick P A cross-platform toolkit for mass spectrometry and proteomics. Nat Biotechnol. 2012;30(10):918–920. doi: 10.1038/nbt.2377. [DOI] [PMC free article] [PubMed] [Google Scholar]
- Chi H, Liu C, Yang H, Zeng W-F, Wu L, Zhou W-J, Wang R-M, Niu X-N, Ding Y-H, Zhang Y Comprehensive identification of peptides in tandem mass spectra using an efficient open search engine. Nat Biotechnol. 2018;36(11):1059–1061. doi: 10.1038/nbt.4236. [DOI] [PubMed] [Google Scholar]
- Fu Y Data analysis strategies for protein modification identification. Methods Mol Biol. 2016;1362:265–275. doi: 10.1007/978-1-4939-3106-4_17. [DOI] [PubMed] [Google Scholar]
- Fu Y, Qian X Transferred subgroup false discovery rate for rare post-translational modifications detected by mass spectrometry. Mol Cell Proteomics. 2014;13(5):1359–1368. doi: 10.1074/mcp.O113.030189. [DOI] [PMC free article] [PubMed] [Google Scholar]
- He K, Fu Y, Zeng W-F, Luo L, Chi H, Liu C, Qing L-Y, Sun R-X, He S-M (2015) A theoretical foundation of the target-decoy search strategy for false discovery rate control in proteomics. arXiv. 10.48550/arXiv. 1501.00537
- Kong AT, Leprevost FV, Avtonomov DM, Mellacheruvu D, Nesvizhskii AI MSFragger: ultrafast and comprehensive peptide identification in mass spectrometry–based proteomics. Nat Methods. 2017;14(5):513–520. doi: 10.1038/nmeth.4256. [DOI] [PMC free article] [PubMed] [Google Scholar]
- Pevzner PA, Dancik V, Tang CL Mutation-tolerant protein identification by mass spectrometry. J Comput Biol. 2000;7(6):777–787. doi: 10.1089/10665270050514927. [DOI] [PubMed] [Google Scholar]
- Yates JR, Eng JK, Mccormack AL, Schieltz D Method to correlate tandem mass-spectra of modified peptides to amino-acid-sequences in the protein database. Anal Chem. 1995;67(8):1426–1436. doi: 10.1021/ac00104a020. [DOI] [PubMed] [Google Scholar]


