

Abstract
Objective:
Young adults (YA) are at high risk for weight gain and show high variability in treatment response. Life events and high perceived stress are common in YA and could drive less favorable outcomes. The goal was to examine whether life events and stress were related to program engagement and weight outcomes in a weight gain prevention trial for YA.
Methods:
Secondary data analysis from the Study of Novel Approaches to Weight Gain Prevention (SNAP), a randomized clinical trial in YA (N=599, 18-35 years, BMI 21-30 kg/m2). Both intervention arms received 10 in-person sessions over 4 months, with long-term contact via web and SMS. Participants completed the CARDIA life events survey and Cohen Perceived Stress Scale-4 at 0 and 4 months; weight was objectively measured at 0, 4 months, and 1, 2, 3 and 4 years.
Results:
Participants who experienced more life events prior to study entry had lower session attendance (p<0.01) and retention (p<0.01), although no differences in weight outcomes were observed (p=.39). Baseline perceived stress followed a similar pattern. Participants who experienced more life events and higher perceived stress during the initial in-person program (0-4 months) appeared to experience less favorable weight outcomes long-term (p=.05 for life events, p=.04 for stress). Very few associations differed by treatment arm.
Conclusions:
Experiencing more life events and stress was negatively associated with engagement in a weight gain prevention trial and may impair long-term weight outcomes for YA. Future work should consider identifying YA at highest risk and tailoring interventions to better meet their needs.
Keywords: life events, young adults, stress, life stressors, weight gain prevention
Introduction
The transition into early adulthood is a high-risk time for weight gain and the development of obesity (Dietz, 2017; Lewis et al., 2000; Mulye et al., 2009; Norman et al., 1990; Truesdale et al., 2006). It is well documented that a myriad of weight promoting behaviors peak during these years (Mulye et al., 2009; Nelson et al., 2008), and young adults (YAs) also experience the greatest rate of weight gain compared to other periods in the developmental life course (Dietz, 2017; Lewis et al., 2000; Norman et al., 1990; Truesdale et al., 2006). Moreover, data indicate that weight gained during these years is associated with increased cardiometabolic risks (Lewis et al., 2000; Norman et al., 1990; Truesdale et al., 2006), as well as increased morbidity and mortality (Zheng et al., 2017). Thus, effective intervention to prevent weight gain over time is critical to reduce overall health risks in this vulnerable population.
Despite the well-documented need for weight management interventions during this critical period (Dietz, 2017; Loria et al., 2010; Lytle et al., 2014), relatively few trials have targeted YAs for weight gain prevention, and the majority have not been successful in preventing weight gain in YAs over long-term (i.e., >12 months) follow up (Hebden et al., 2012; Laska et al., 2012; Partridge et al., 2015). Moreover, even in those few trials with positive long-term outcomes (Wing et al., 2016), there is tremendous variability in treatment response (Wing et al., 2020). Identifying predictors of treatment response could not only assist with treatment matching efforts, but also identify novel intervention targets to improve long-term weight outcomes among this high-risk population.
One factor that could contribute to the elevated risk observed among YAs, as well as predispose some YAs to poorer treatment response, are the landmark transitions and life events which are the hallmark of this developmental period. These life events occur across multiple domains, including changes in physical environment and living situation, changes in interpersonal relationships and social environment, transitions in work and school status, financial strain, as well as pregnancy and childbirth (Arnett, 2004; Loria et al., 2010). Extant data from longitudinal cohorts demonstrate that these life events are associated with unhealthy weight-related behaviors and weight gain over time. For example, declines in physical activity and fruit and vegetable intake as well as weight gain have been reported during the transition from high school to college (Winpenny et al., 2020). In another study, leaving home, having a first child, and getting married were all associated with less moderate-to-vigorous physical activity, whereas getting married combined with having a child was most predictive of weight gain (Miller et al., 2019). Additionally, pregnancy, motherhood, marriage and cohabitation, and attending university have all been linked with weight gain (Pegington et al., 2020).
Despite a wealth of evidence documenting the link between life events and weight gain in YAs, little evidence exists as to the impact of these life events within the context of weight management trials. One recent study in adults found that experiencing ≥1 life event during the previous 12 months was associated with an increase of 2.31kg at 24 months (Gavin et al., 2019). To our knowledge, no previous studies have examined this question in YAs specifically. Given that the majority of these major life events are common in young adulthood, both in type and dose, this represents a critical gap. Indeed, it is plausible that exposure to these life events sets the stage for suboptimal treatment response among YAs–it is also possible that perceived stress associated with these life transitions is associated with poorer weight outcomes over time. Data indicate that this population has the highest rates of perceived stress (American Psychological Association, 2012), which could be in part due to the myriad life events experienced during these years. Importantly, it is possible that the specific intervention YAs receive could be more or less effective in helping them to navigate these transitions and maintain their weight during these years.
The Study of Novel Approaches to Weight Gain Prevention (SNAP) Trial offers a unique opportunity to examine the effects of these life events on weight outcomes in YAs given it involved two distinct self-regulation approaches, both of which demonstrated efficacy relative to control at 2 years (Wing et al., 2016). The self-regulation plus large changes (LC) arm taught participants how to create a weight loss buffer–promoting a 5-10lb weight loss through energy intake and expenditure goals consistent during the initial phase of treatment. In contrast, the self-regulation plus small changes (SC) arm taught YAs to make small, discrete changes to their eating and activity daily and to maintain this approach forever. The primary aim of this secondary analysis was to examine whether life events and perceived stress were related to program engagement and weight outcomes in the SNAP trial, and whether these associations differed by treatment arm. In addition, an exploratory aim was to examine the types of life events that were associated with engagement and weight outcomes. Hypotheses were: 1) Within LC and SC, greater total life events at baseline will predict worse attendance in the initial treatment program, and greater life events during initial treatment program will predict worse engagement over time. 2) Greater life events reported at baseline and 4 months will be associated with worse weight outcomes over time. 3) Greater perceived stress scores at baseline and during the initial treatment will be associated with worse engagement and less favorable weight change over time.
Methods
The parent trial was pre-registered on clinicaltrials.gov (NCT#011836864). Data from the parent trial are publicly available here: https://biolincc.nhlbi.nih.gov/studies/snap. This secondary analysis was not pre-registered; analytic code used to conduct the analyses in this paper are available from author KG. Analyses were performed using SAS version 9.4 (SAS Institute Inc., Cary, NC).
Participants and Procedures
A total of 599 participants were enrolled in the SNAP Trial. Eligible participants were 18-35 years of age with a body mass index (BMI) of 21-30 kg/m2. Exclusion criteria have been described in detail previously (Wing et al., 2013); major exclusions included: major medical comorbidities that made unsupervised exercise or weight loss medically unsafe; ≥10lb weight loss within 6 months; medications that might impact weight; current pregnancy, pregnant within the last 6 months, or planned pregnancy during the initial intervention; psychiatric hospitalization within 12 months; eating disorder or substance dependence; inability to speak English; lack of reliable internet access. Participants were recruited across two clinical sites using a multi-method strategy (see Tate et al., 2014); written consent was obtained. Eligible participants were randomly assigned within strata (clinical site, gender, race / ethnicity) using 1:1:1 ratio to one of the conditions using a variable-block length randomization scheme. Enrollment and data collection occurred between August 2010 and February 2015. All procedures were approved by the Institutional Review Boards at The Miriam Hospital, UNC Chapel Hill, and Wake Forest University.
Intervention Description
Participants were randomized to one of three conditions: self-regulation with large changes (LC), self-regulation with small changes (SC), or control (C). Intervention descriptions have been published previously (Wing et al., 2013). LC and SC participants received 8 weekly sessions and 2 monthly sessions. Both interventions were grounded in self-regulation (Kanfer, 1975; Wing et al., 2006). Participants were taught to self-weigh daily and based on the data observed, either reinforce themselves or adjust their behaviors. After the initial 4 months, participants were taught to continue using self-weighing to inform behaviors; they reported their weight via a study website, text message or email, and received monthly feedback. Optional 4-week online refresher campaigns were offered twice per year.
During the initial program, participants in LC were given calorie and fat targets and encouraged to gradually increase minutes spent in structured, moderate-to-vigorous physical activity with the goal of creating a weight loss buffer (5-10lbs). If participants’ weight exceeded their baseline weight during follow-up, they were advised to return to their calorie goal to reverse these gains. In contrast, participants assigned to SC were taught to make small changes to both diet and exercise behaviors daily. Small dietary changes were designed to equal approximately 100kcal per day and could include changes in service of diet quality or portion control. Participants were encouraged to track their steps and to add 2000 steps per day over their baseline level. If SC participants experienced weight gains over baseline, they were taught to make additional small changes each day to reverse these gains. Participants in the control arm attended one in-person group, which included psychoeducation and an overview of both the SC and LC approaches. They also received publicly available websites where additional information could be obtained and were encouraged to choose the approach best suited to their needs. All participants received quarterly newsletters and personalized feedback on assessment measures.
Measures
Weight, height, and BMI:
Weight and height were assessed at baseline, 4 months, and annually through 4 years by trained research staff masked to treatment assignment. Weight was measured following a 12-hour fast in light street clothes and without shoes, on a calibrated scale. Height was measured using a wall-mounted stadiometer. Two measures of each were obtained and the average was used. BMI was calculated: weight in kilograms / height in meters squared.
Engagement:
During the initial in-person phase, attendance at group treatment sessions was coded yes / no weekly and summed for a total attendance score. Additionally, engagement was defined as at least monthly reporting of weight (yes / no) throughout the study.
Retention:
Retention was defined as attendance at follow up data collection visit (yes / no).
Life Events:
Life events were assessed at baseline and 4 months using the life events questionnaire from the Coronary Artery Risk Development in Young Adults (CARDIA) study, which lists 67 life events that occur commonly during young adulthood (Scherwitz et al., 1991). Events spanned a variety of domains, including work and school (e.g., started first full time job, changed school or training program), financial and legal (e.g., went on welfare, took out a mortgage, convicted of a crime), interpersonal and social (e.g., ended a romantic relationship, became engaged), health (e.g., major physical illness), pregnancy / child related (e.g., birth of a child, loss of a child), as well as deaths (e.g., of a parent, close friend). The full measure is included in supplemental materials. At baseline, participants were asked to report on the last year and at 4 months they were asked to report on the last 4 months.
Perceived Stress:
Perceived stress was assessed at baseline and 4 months using the Cohen Perceived Stress Scale-4, which is a 4-item (Cohen et al., 1983) self-report instrument that captures the participant’s perception of stress in their lives over the past month. The PSS poses general questions about current stress levels (e.g., In the past month, how often have you felt difficulties were piling up so high that you could not overcome them?). Scores range from 0 to 16 with higher scores reflecting greater perceived stress. Chronbach’s alpha was 0.79 in the current sample.
Statistical Analyses
Descriptive statistics were computed overall and by life events category at baseline (0-1, 2-4, 5+) and 4-months (0, 1-2, 3+). Life events were categorized due to zero-inflation of the variable (zeros >15% at baseline and >30% at 4-months). Categories were selected based on the distribution of the data to include approximately equal numbers of participants in each of the 3 groups. Categorical variables were described using frequencies and percentages while continuous variables were described using means and standard deviation for normally distributed variables and medians and interquartile ranges for non-normally distributed variables. Normality was assessed using plots and skewness. Differences in demographics by life event categories were assessed using ANOVA and chi-square tests for continuous and categorical variables, respectively. Associations between life events and engagement were evaluated in LC and SC treatment groups only, while retention and change in weight were evaluated in all conditions (LC, SC, and C). General linear models were fit to evaluate the associations between life events and session attendance in the initial 4-month intervention. Estimated mean differences for each pairwise comparison from the linear contrasts of life event categories were assessed using Wald statistics. Linear mixed-effects models were used to compare longitudinal changes in engagement (reporting weight ≥1 / month), retention, and weight post baseline due to baseline life event groups and 4-month life event groups. Types of life events were analyzed using the same methods; however, analyses for individual event types were based on having an event of that type or not (0 or >0). General linear models were used to evaluate the associations between continuous baseline perceived stress scores and changes in engagement and weight change during the initial intervention (4 months), and linear mixed-effects models were used to assess the longitudinal changes in engagement and weight change due to perceived stress scores at 4-months. Analyses were completed using two models; model 1 was minimally adjusted for clinic and treatment arm and model 2 also adjusted for age, gender, race, and baseline weight. All analyses were evaluated for possible differences by treatment arm and all longitudinal analyses were assessed for differences over time. Pearson correlation coefficients were used to examine association between baseline and 4-month life events, and association between life events and perceived stress.
Results
Participant Characteristics
Participants were 78% (469/599) female, 73% (438/599) non-Hispanic white, and at study entry had a mean age of 28.2 years (SD: 4.4 years), with a mean BMI of 25.4 kg/m2 (SD:2.6 kg/m2) and the majority worked full time (63%, 377/599). Sample characteristics overall and by life event category are displayed in Table 1. At baseline, participants differed in frequency of life events based on site, race/ethnicity, income, and work status; at 4-months, differences were only observed by site and income. At baseline, the mean number of life events reported over the past year was 3.3 (SD: 2.9); 31% (185/599) of participants reported 0-1 life events, 43% (258/599) reported 2-4 life events, and 26% (156/599) reported 5 or more life events at baseline.
Table 1.
Demographics by Life Event Categories at Baseline and 4 Months
| Baseline | 4 Months | ||||||||
|---|---|---|---|---|---|---|---|---|---|
| Overall N=599 |
0-1 N=185 |
2-4 N=258 |
5+ N=156 |
p-value | 0 N=193 |
1-2 N=259 |
3+ N=147 |
p-value | |
| Age (years) | 28.2±4.4 | 28.2±4.9 | 28.6±4.2 | 27.3±4.0 | 0.99 | 28.6±4.8 | 28.2±4.3 | 27.5±3.9 | 0.99 |
| Gender | 0.24 | . | . | . | 0.32 | ||||
| Male | 130 (21.7%) | 48 (26.0%) | 51 (19.8%) | 31 (19.9%) | 49 (25.4%) | 52 (20.1%) | 29 (19.7%) | ||
| Female | 469 (78.3%) | 137 (74.1%) | 207 (80.2%) | 125 (80.1%) | 144 (74.6%) | 207 (79.9%) | 118 (80.3%) | ||
| Clinic | 0.02 | . | . | . | <0.01 | ||||
| Chapel Hill | 307 (51.3%) | 109 (58.9%) | 129 (50.0%) | 69 (44.2%) | 83 (43.0%) | 151 (58.3%) | 73 (49.7%) | ||
| Brown | 292 (48.8%) | 76 (41.1%) | 129 (50.0%) | 87 (55.8%) | 110 (57.0%) | 108 (41.7%) | 74 (50.3%) | ||
| Race | . | . | . | . | 0.01 | . | . | . | 0.92 |
| African American | 66 (11.0%) | 23 (12.4%) | 24 (9.3%) | 19 (12.2%) | 19 (9.8%) | 32 (12.4%) | 15 (10.2%) | ||
| White | 438 (73.1%) | 146 (78.9%) | 188 (72.9%) | 104 (66.7%) | 144 (74.6%) | 186 (71.8%) | 108 (73.5%) | ||
| Other | 95 (15.9%) | 16 (8.7%) | 46 (17.8%) | 33 (21.2%) | 30 (15.5%) | 41 (15.8%) | 24 (16.3%) | ||
| Education | . | . | . | . | 0.46 | . | . | . | 0.15 |
| <HS | 24 (4.0%) | 11 (6.0%) | 9 (3.5%) | 4 (2.6%) | 12 (6.2%) | 8 (3.1%) | 4 (2.72%) | ||
| Some College | 96 (16.0%) | 35 (18.9%) | 35 (13.6%) | 26 (16.7%) | 38 (19.7%) | 34 (13.1%) | 24 (16.3%) | ||
| College Grad | 278 (46.4%) | 79 (42.7%) | 125 (48.5%) | 74 (47.4%) | 79 (40.9%) | 124 (47.9%) | 75 (51.0%) | ||
| Post Grad | 201 (33.6%) | 60 (32.4%) | 89 (34.5%) | 52 (33.3%) | 64 (33.2%) | 93 (35.9%) | 44 (29.9%) | ||
| Marital Status | . | . | . | . | 0.37 | . | . | . | 0.60 |
| Single | 178 (29.7%) | 57 (30.8%) | 67 (26.0%) | 54 (34.6%) | 53 (27.5%) | 83 (32.1%) | 42 (28.6%) | ||
| Married/Committed | 413 (69.0%) | 125 (67.6%) | 187 (72.5%) | 101 (64.7%) | 138 (71.5%) | 171 (66.0%) | 104 (70.8%) | ||
| Income (N = 573) | . | . | . | . | <0.01 | . | . | . | <0.01 |
| Less than $16,000 | 112 (19.6%) | 33 (19.3%) | 50 (19.9%) | 29 (19.2%) | 30 (17.1%) | 44 (17.5%) | 38 (26.21%) | ||
| $16,000-$34,999 | 173 (30.2%) | 48 (28.1%) | 64 (25.5%) | 61 (40.4%) | 42 (23.9%) | 88 (34.9%) | 43 (29.7%) | ||
| $35,000-$74,999 | 227 (39.6%) | 75 (43.9%) | 99 (39.4%) | 53 (35.1%) | 73 (41.5%) | 102 (40.5%) | 52 (35.9%) | ||
| $75,000 or more | 61 (10.7%) | 15 (8.8%) | 38 (15.1%) | 8 (5.3%) | 31 (17.6%) | 18 (7.1%) | 12 (8.3%) | ||
| Employment Status | . | . | . | . | . | . | . | ||
| Work Full Time | 377 (62.9%) | 111 (60%) | 172 (66.7%) | 94 (60.3%) | 0.26 | 124 (64.3%) | 161 (62.2%) | 92 (62.6%) | 0.90 |
| Work Part Time | 108 (18.0%) | 31 (16.8%) | 48 (18.6%) | 29 (18.6%) | 0.86 | 32 (16.6%) | 42 (16.2%) | 34 (23.1%) | 0.18 |
| Student Full Time | 165 (27.6%) | 61 (33.0%) | 70 (27.1%) | 34 (21.8%) | 0.07 | 46 (23.8%) | 81 (31.3%) | 38 (25.9%) | 0.19 |
| Student Part Time | 44 (7.4%) | 8 (4.3%) | 13 (5.0%) | 23 (14.7%) | <0.01 | 14 (7.3%) | 18 (7.0%) | 12 (8.2%) | 0.90 |
| **Weight (kg) | 69.9 (63.5, 78.7) | 70.2 (63.5, 79.4) | 69.2 (63.4, 78.1) | 70.8 (064.0, 77.3 | 0.63 | 70.8 (63.8, 79.8) | 69.0 (63.3, 76.8) | 70.2 (63.6, 78.6) | 0.63 |
| BMI (kg/m2) | 25.4±2.6 | 25.5±2.6 | 25.3±2.5 | 25.6±2.7 | 0.14 | 25.6±2.7 | 25.2±2.5 | 25.6±2.6 | 0.14 |
Categorical data is presented as n (%), continuous data was presented as mean ± SD
Due to moderate skewness in weight (kg) (skewness=0.66) we have presented the data as median (IQR).
Association between Baseline Life Events and Attendance, Engagement, Retention, and Weight Change
Associations between baseline life events and session attendance in the initial phase of the program are presented in Table 2. At baseline, 31% (124/397) of LC and SC participants reported 0-1 life events, 42% (166/397) reported 2-4 life events, and 27% (107/397) reported 5 or more life events at baseline. Greater number of life events reported at baseline predicted lower session attendance (model 1: p<0.01). Participants who reported 5 or more life events over the past year at baseline attended significantly fewer sessions than those reporting 0-1 or 2-4 life events at baseline (p<0.01 and p<0. 01, respectively). There was no significant difference between the number of sessions attended between participants reporting 0-1 vs 2-4 life events. The negative association between baseline life events and initial intervention session attendance continued to be significant in the fully adjusted model (model 2: p<0.01).
Table 2.
Association between Categorical Life Events and Session Attendance among Young Adults in the Large or Small Changes Treatment Group of the SNAP Trial (N = 397)
| Baseline Life Events | Pairwise Comparisons | |||||||
|---|---|---|---|---|---|---|---|---|
| 0 – 1 | 2 – 4 | 5 or more | p-Value | 0 – 1 vs 2 – 4 | 0 – 1 vs 5+ | 2 – 4 vs 5+ | ||
| Number of Observations | 124 | 166 | 107 | |||||
| Model 1 | 8.86 (0.17) | 8.9 (0.14) | 7.97 (0.18) | < 0.01 | Difference in Mean (SE) | −0.04 (0.22) | 0.9 (0.25) | 0.94 (0.23) |
| Model 1 | 95% CI of Difference | (−0.47, 0.4) | (0.41, 1.38) | (0.49, 1.39) | ||||
| Model 1 | p-Value | 0.86 | <0.01 | < 0. 01 | ||||
| Model 2 | 8.84 (0.17) | 8.89 (0.14) | 8.01 (0.18) | <0.01 | Difference in Mean (SE) | −0.05 (0.22) | 0.83 (0.25) | 0.88 (0.23) |
| Model 2 | 95% CI of Difference | (−0.49, 0.39) | (0.34, 1.32) | (0.42, 1.33) | ||||
| Model 2 | p-Value | 0.82 | <0.01 | <0.01 | ||||
| 4 Month Life Events | Pairwise Comparisons | |||||||
| 0 | 1 – 2 | 3 or more | p-Value | 0 vs 1 – 2 | 0 vs 3+ | 1 – 2 vs 3+ | ||
| Number of Observations | 134 | 168 | 95 | |||||
| Model 1 | 8.28 (0.16) | 8.97 (0.15) | 8.56 (0.19) | <0.01 | Difference in Mean (SE) | −0.68 (0.22) | −0.28 (0.25) | 0.41 (0.24) |
| Model 1 | 95% CI of Difference | (−1.12, −0.25) | (−0.77, 0.22) | (−0.07, 0.88) | ||||
| Model 1 | p-Value | <0.01 | 0.27 | 0.09 | ||||
| Model 2 | 8.27 (0.16) | 8.96 (0.15) | 8.59 (0.19) | <0.01 | Difference in Mean (SE) | −0.69 (0.22) | −0.32 (0.25) | 0.37 (0.24) |
| Model 2 | 95% CI of Difference | (−1.12, −0.26) | (−0.82, 0.18) | (−0.1, 0.85) | ||||
| Model 2 | p-Value | <0.01 | 0.21 | 0.12 | ||||
Model 1: Adjusted for clinic and treatment group (LC, SC, Control)
Model 2: Model 1 + age (years), gender, race, and baseline weight (kg)
Associations between baseline life events and engagement, retention and weight change are presented in Table 3. After the initial intervention period, engagement was monitored using the number of monthly weigh-ins for a participant. Baseline number of life events was significantly associated with engagement over time in the minimally adjusted model (p=0.02); as well as in the fully adjusted model (p=0.03). Participants reporting 2-4 life events at baseline consistently had the highest engagement over the study, while participants reporting 0-1 life events at baseline had the lowest, with the exception 4-months where participants reporting 5 or more baseline life events had the lowest engagement.
Table 3.
Association between Categorical Life Events at Baseline and Treatment Outcomes among Young Adults in the SNAP Trial
| Life Events at Baseline | p-Value | ||||||||
|---|---|---|---|---|---|---|---|---|---|
| <2 Events | 2-4 Events | >4 Events | Life Event within Year |
Life Event by Year Interaction |
Overall Life Event |
||||
| Outcome | Model | Year | # of Observations |
LSMEAN (SE) |
LSMEAN (SE) |
LSMEAN (SE) |
p-Value | p-Value | p-Value |
| *Weight Change (kg) | Model 1 | 4 Months | 575 | −2.00 (0.369) | −1.95(0.313) | −1.48(0.411) | 0.59 | 0.93 | 0.39 |
| 1 Year | 540 | −1.45(0.375) | −1.58(0.320) | −0.82(0.418) | 0.34 | ||||
| 2 Years | 523 | −0.43(0.379) | −0.63(0.322) | −0.32(0.425) | 0.84 | ||||
| 3 Years | 503 | 0.70(0.380) | 0.49(0.325) | 0.93(0.435) | 0.71 | ||||
| 4 Years | 484 | 1.64(0.383) | 1.11(0.330) | 2.03(0.438) | 0.22 | ||||
| Model 2 | 4 Months | 575 | −1.89(0.431) | −1.76(0.390) | −1.42(0.461) | 0.68 | 0.92 | 0.55 | |
| 1 Year | 540 | −1.33(0.436) | −1.39(0.395) | −0.75(0.467) | 0.45 | ||||
| 2 Years | 523 | −0.31(0.440) | −0.44(0.396) | −0.26(0.473) | 0.93 | ||||
| 3 Years | 503 | 0.82(0.439) | 0.67(0.400) | 1.00(0.483) | 0.83 | ||||
| 4 Years | 484 | 1.76(0.442) | 1.30(0.403) | 2.10(0.486) | 0.32 | ||||
| **Engagement (yes/no, ≥1 monthly reporting of weight) | Model 1 | 4 Months | 379 | 2.98(0.324) | 3.30(0.278) | 2.96(0.357) | 0.67 | 0.23 | 0.02 |
| 1 Year | 355 | 5.20(0.330) | 6.18(0.287) | 5.52(0.365) | 0.07 | ||||
| 2 Years | 346 | 7.27(0.333) | 8.20(0.289) | 7.76(0.371) | 0.11 | ||||
| 3 Years | 330 | 6.02(0.333) | 7.60(0.295) | 6.15(0.382) | <0.01 | ||||
| 4 Years | 324 | 4.22(0.335) | 4.88(0.295) | 4.45(0.389) | 0.32 | ||||
| Model 2 | 4 Months | 379 | 2.53(0.365) | 2.78(0.337) | 2.57(0.393) | 0.82 | 0.23 | 0.03 | |
| 1 Year | 355 | 4.74(0.371) | 5.66(0.343) | 5.14(0.398) | 0.10 | ||||
| 2 Years | 346 | 6.82(0.374) | 7.69(0.345) | 7.38(0.405) | 0.14 | ||||
| 3 Years | 330 | 5.57(0.372) | 7.09(0.351) | 5.77(0.415) | <0.01 | ||||
| 4 Years | 324 | 3.77(0.374) | 4.38(0.350) | 4.06(0.423) | 0.40 | ||||
| *Retention (yes/no, attended follow-up visit) | Model 1 | 4 Months | 599 | 0.98(0.024) | 0.97(0.020) | 0.93(0.026) | 0.31 | 0.61 | <0.01 |
| 1 Year | 599 | 0.92(0.024) | 0.90(0.020) | 0.87(0.026) | 0.41 | ||||
| 2 Years | 599 | 0.89(0.024) | 0.89( 0.020) | 0.83(0.026) | 0.16 | ||||
| 3 Years | 599 | 0.88(0.024) | 0.85(0.020) | 0.77(0.026) | <0.01 | ||||
| 4 Years | 599 | 0.85(0.024) | 0.81(0.020) | 0.75(0.026) | 0.01 | ||||
| Model 2 | 4 Months | 599 | 0.97(0.027) | 0.96(0.024) | 0.92(0.029) | 0.38 | 0.61 | 0.01 | |
| 1 Year | 599 | 0.91(0.027) | 0.90(0.024) | 0.87(0.029) | 0.49 | ||||
| 2 Years | 599 | 0.88(0.027) | 0.88(0.024) | 0.83(0.029) | 0.20 | ||||
| 3 Years | 599 | 0.88(0.027) | 0.85(0.024) | 0.76(0.029) | <0.01 | ||||
| 4 Years | 599 | 0.84(0.027) | 0.81(0.024) | 0.74(0.029) | 0.02 | ||||
Weight Change and Retention have a maximum N of 599 (all SNAP trial participants)
Engagement has a maximum N of 397 (all SNAP trial participants in the Large or Small Changes Treatment Group)
Model 1: Adjusted for clinic and treatment group (LC, SC, Control)
Model 2: Model 1 + age, gender, race, and baseline weight (kg)
Greater number of life events at baseline was significantly and negatively associated with retention in the minimally adjusted model (p=<0.01) and fully adjusted model (p=0.01). Participants experiencing 5 or more life events at baseline were most likely to be lost to follow-up, while participants experiencing 0-1 life events at baseline were the least likely to be lost to follow-up. There was no significant association between life events at baseline and change in weight over the study in either the minimally adjusted model (p=0.39) or fully adjusted model (p=0.55). None of the models assessing the impact of baseline life events on attendance, engagement, retention, and weight change_showed effects of time (p’s>0.23) or treatment arm (p’s>0.31).
Association between 4 Month Life Events and Engagement, Retention and Weight Change
At the 4-month visit, the mean number of life events reported over the 4 months since baseline was 1.69 (SD:1.87); 34% (134/397) of LC and SC participants reported having 0 life events, 42% (168/397) reported 1-2 life events, and 24% (95/397) reported 3 or more life events since their baseline visit. As depicted in Table 2, there was a significant association between life events reported at 4-months and session attendance in both the minimally adjusted model (p<0.01) and the fully adjusted model (p<0.01). Participants reporting 1-2 life events during the first four months of the study attended more sessions on average (Mean: 8.96, SD: 0.15) during that same time frame than participants reporting 0 life events (Mean: 8.27, SD: 0.16; model 1: p<0.01, model 2: p<0.01). Individuals with 3 or more life events did not differ in attendance from those with 0 life events (Mean=8.59, SD: 0.19; model 1: p=0.27, model 2: p=0.21) or 1-2 life events (model 1: p=0.09, model 2: p=0.12).
The longitudinal association between 4-month life events and engagement, retention, and weight change is presented in Table 4. Engagement (i.e., at least monthly weigh-ins throughout the study) in LC and SC participants was not significantly associated with the number of life events reported at the 4-month visit (model 1: p=0.14, model 2: p=0.09). This lack of association was not significantly different over time (p=0.82) or by treatment arm (p=0.54). Participant retention had a significant association with life events reported at 4 months in both the minimally adjusted model (p<0.01) and the fully adjusted model (p<0.01). This association was significantly different across treatment group (p=0.03) and over time (p=0.03). Participants in the control group who reported 1-2 life events at 4 months had significantly higher retention than participants in the control group who reported either 0 life events or 3 or more life events (model 1: p<0.01, model 2: p<0.01). This association did not differ over time (p=0.20). Participants in LC who had 0 life events had the lowest retention and participants with 3 or more life events had the highest retention (model 1: p<0.01, model 2: p<0.01). This association was not significantly different over time (p=0.13). Participants in SC had no significant association between life events at 4-months and retention (model 1: p=0.29, model 2: p=0.26).
Table 4.
Association between Categorical Life Events during Initial Treatment Program and Treatment Outcomes among Young Adults in the SNAP Trial
| Life Events at 4 Months | p-Value | |||||||||
|---|---|---|---|---|---|---|---|---|---|---|
| 0 Events | 1-2 Events | ≥3 Events | Life Event within Year |
Life Event by Year Interaction |
Overall Life Event |
|||||
| Outcome | Treatment Group |
Model | Year | # of Observations |
LSMEAN (SE) |
LSMEAN (SE) |
LSMEAN (SE) |
p-Value | p-Value | p-Value |
| *Weight Change (kg) | Overall | Model 1 | 4 Months | 575 | −1.90(0.375) | −2.01(0.309) | −1.50(0.409) | 0.61 | 0.78 | 0.05 |
| 1 Year | 540 | −1.43(0.385) | −1.69(0.314) | −0.63(0.416) | 0.12 | |||||
| 2 Years | 523 | −0.56(0.380) | −0.95(0.321) | 0.42(0.424) | 0.04 | |||||
| 3 Years | 503 | 0.37(0.387) | 0.34(0.325) | 1.59(0.424) | 0.04 | |||||
| 4 Years | 484 | 1.28(0.391) | 1.29(0.325) | 2.16(0.435) | 0.22 | |||||
| Model 2 | 4 Months | 575 | −1.66(0.434) | −1.88(0.379) | −1.38(0.469) | 0.62 | 0.79 | 0.06 | ||
| 1 Year | 540 | −1.20(0.443) | −1.56(0.382) | −0.51(0.474) | 0.13 | |||||
| 2 Years | 523 | −0.33(0.438) | −0.81(0.388) | 0.53(0.481) | 0.04 | |||||
| 3 Years | 503 | 0.60(0.444) | 0.48(0.391) | 1.71(0.481) | 0.05 | |||||
| 4 Years | 484 | 1.51(0.447) | 1.43(0.391) | 2.28(0.492) | 0.26 | |||||
| **Engagement (yes/no, ≥1 monthly reporting of weight) | Overall | Model 1 | 4 Months | 379 | 2.89(0.327) | 3.33(0.276) | 3.04(0.366) | 0.58 | 0.81 | 0.14 |
| 1 Year | 355 | 5.28(0.336) | 6.11(0.284) | 5.50(0.371) | 0.14 | |||||
| 2 Years | 346 | 7.36(0.331) | 8.01(0.292) | 7.96(0.376) | 0.29 | |||||
| 3 Years | 330 | 6.16(0.340) | 6.95(0.298) | 7.01(0.374) | 0.15 | |||||
| 4 Years | 324 | 4.20(0.340) | 4.65(0.298) | 4.86(0.385) | 0.40 | |||||
| Model 2 | 4 Months | 379 | 2.34(0.372) | 2.81(0.324) | 2.59(0.407) | 0.54 | 0.82 | 0.09 | ||
| 1 Year | 355 | 4.74(0.380) | 5.60(0.331) | 5.06(0.412) | 0.13 | |||||
| 2 Years | 346 | 6.82(0.375) | 7.51(0.337) | 7.52(0.416) | 0.23 | |||||
| 3 Years | 330 | 5.62(0.383) | 6.44(0.343) | 6.56(0.414) | 0.10 | |||||
| 4 Years | 324 | 3.66(0.383) | 4.15(0.342) | 4.41(0.424) | 0.31 | |||||
| *Retention (yes/no, attended follow-up visit) | Overall | Model 1 | 4 Months | 599 | 0.88(0.023) | 1.00(0.020) | 0.99(0.027) | <0.01 | 0.03 | <0.01 |
| 1 Year | 599 | 0.81(0.023) | 0.95(0.020) | 0.94(0.027) | <0.01 | |||||
| 2 Years | 599 | 0.85(0.023) | 0.88(0.020) | 0.88(0.027) | 0.44 | |||||
| 3 Years | 599 | 0.80(0.023) | 0.84(0.020) | 0.88(0.027) | 0.06 | |||||
| 4 Years | 599 | 0.77(0.023) | 0.84(0.020) | 0.80(0.027) | 0.09 | |||||
| Model 2 | 4 Months | 599 | 0.88(0.026) | 0.99(0.023) | 0.99(0.030) | <0.01 | 0.03 | <0.01 | ||
| 1 Year | 599 | 0.80(0.026) | 0.94(0.023) | 0.94(0.030) | <0.01 | |||||
| 2 Years | 599 | 0.84(0.026) | 0.88(0.023) | 0.88(0.030) | 0.38 | |||||
| 3 Years | 599 | 0.79(0.026) | 0.84(0.023) | 0.88(0.030) | 0.05 | |||||
| 4 Years | 599 | 0.76(0.026) | 0.83(0.023) | 0.80(0.030) | 0.07 | |||||
Weight Change and Retention have a maximum N of 599 (all SNAP trial participants)
Engagement has a maximum N of 397 (all SNAP trial participants in the Large or Small Changes Treatment Group)
Model 1: Adjusted for clinic and treatment group (LC, SC, Control)
Model 2: Model 1 + age, gender, race, and baseline weight (kg)
Participant weight change throughout the study showed trends toward an association with life events at 4-months; however, they were not statistically significant (model 1: p=0.05, model 2: p=0.06) [Figure 1]. The trend appeared to show participants who experienced 3 or more life events to have the least favorable weight trajectories throughout the course of the trial; while those participants who experienced 1-2 life events had the most favorable weight change. This association was not significantly different over time (p=0.79) or by treatment arm (p=0.12).
Figure 1.
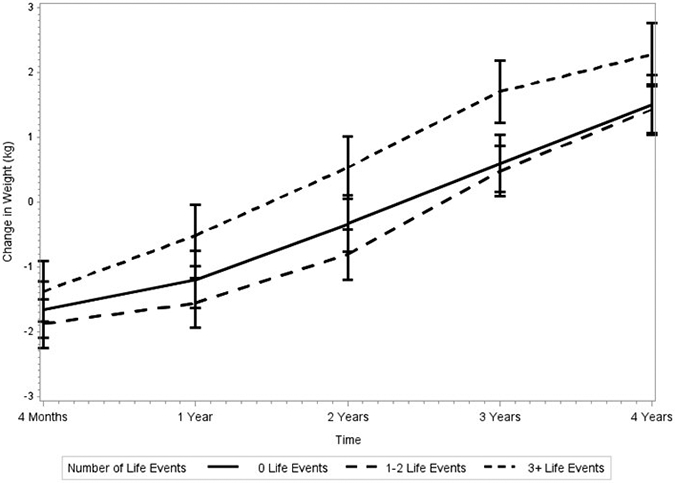
Association between Life Events during the Initial Treatment Program and Weight Change Over Time in the SNAP Trial
Specific Type of Life Events and Association with Engagement, Retention, and Weight Change
See supplementary tables for results. At both baseline and 4-months, work-related events were most common, followed by financial-related events then school-related events. Childbirths and marriages were relatively uncommon. Type of life events were not related to weight outcomes.
Association between Perceived Stress and Engagement and Weight Change
At baseline, mean perceived stress score was 4.62 (SD: 2.74). Greater perceived stress at baseline was significantly associated with lower session attendance during the initial intervention program in the minimally adjusted model (p<0.01) and the fully adjusted model (p=0.01). Baseline perceived stress was not significantly associated with change in weight between baseline and 4-months (p=0.63). Mean perceived stress score at 4 months was 4.91 (SD:3.05). Perceived stress scores in the LC and SC groups were not significantly associated with engagement over time in either the minimally or fully adjusted models (p=0.52 and p=0.45, respectively). As shown in Figure 2, perceived stress at 4 months was significantly and negatively associated with weight change regardless of time in the minimally adjusted model (p=0.04) and fully adjusted model (p=0.05), such that participants with higher perceived stress scores at 4 months had less favorable weight changes over time. This association did not differ over time (p=0.64) or by treatment group (p=0.11).
Figure 2.
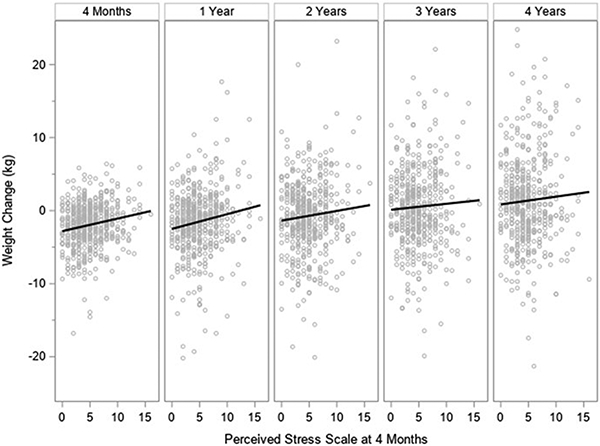
Association between Perceived Stress during the Initial Treatment Program and Weight Change Over Time in the SNAP Trial
Association between Life Events and Perceived Stress
There was a positive association between life events and perceived stress scores at both baseline (r=0.12, p<0.01) and 4-months (r=0.15, p=<0.01); participants with more life events reported higher stress.
Discussion
Young adulthood is a period marked by life transitions (Arnett, 2004; Loria et al., 2010) and high perceived stress (American Psychological Association, 2012). It was posited that these factors would be associated with lower program engagement and less favorable weight change over long-term follow up; hypotheses were partially supported. Entering the SNAP study having experienced more life events in the previous year was associated with decreased session attendance, lower engagement, and increased attrition, but not with weight. At 4 months, following in-person treatment, experiencing a smaller number of life events was generally related to better attendance and retention and experiencing a greater number of life events during the initial treatment program was marginally associated with worse weight outcomes over 4 years. Perceived stress was positively associated with the number of life events reported and experiencing higher stress at study entry was associated with lower session attendance, while greater perceived stress at 4-months was associated with less favorable weight trajectories over time.
Young adults who reported experiencing 5 or more life events at baseline were at risk for worse attendance, engagement, and retention. Experiencing a large number of recent life events may lead to unanticipated schedule or routine changes that could impair an individual’s ability to fully participate in intervention. Flexibility in the delivery of the intervention, such as offering remote sessions or including asynchronous support and online content, may be beneficial for engagement. Young adults prefer interventions that include technology (Corsino et al., 2013; LaRose et al., 2016), and evidence underscores the promise of a hybrid intervention consisting of both face-to-face and virtual components (LaRose et al., 2019; Svetkey et al., 2015; Wing et al.; 2016). Another option may be to have a detailed discussion of expectations and barriers prior to initiating treatment for individuals experiencing numerous life changes, which has been shown to improve attendance and retention (Northrup et al., 2017). Long-term weight outcomes were not associated with baseline life events, suggesting that events prior to intervention are not a prohibitive barrier to successful weight gain prevention.
A large number of life events between baseline and 4 months trended toward a negative association with weight outcomes at 4 years–and similarly, higher perceived stress during the program, which was positively correlated with life events, was associated with less favorable weight trajectories over time. There are multiple pathways by which perceived stress and life events could be operating. Qualitative evidence with young adults highlighted that stress is perceived as a barrier to weight management and contributes to the unraveling of efforts to engage in healthy lifestyle behaviors (LaRose et al., 2016). Experiencing major life events or periods of high stress may result in a re-prioritizing of time away from weight management activities toward concerns that are perceived to be more pressing. Indeed, both outside and inside the context of treatment, experiencing life events have been associated with poorer weight-related behaviors (Gavin et al., 2019; Miller et al., 2019; Pegington et al., 2020; Winpenny et al., 2020; Gropper et al., 2020). It is also possible that individuals experiencing greater stress or more life events are less able to cultivate the self-regulation skills taught in initial treatment sessions due to poorer engagement, making it more challenging to enact eating and exercise goals over time.
Another plausible explanation may be eating in response to stressors–extant data demonstrate a link between experiencing life events, stress, and emotional eating (Pickett et al., 2020; Tan & Chow, 2014; Turk et al., 2012) and emotional eating is associated with weight management success (Braden et al., 2016; Novelli et al., 2018). Recent evidence suggests that young Black women, in particular, may engage in overeating or loss of control eating after experiencing stress related to racial discrimination (Brown et al., 2022). Of note, exposure to life events and stressors could also be associated with physiological states (e.g., increased cortisol and insulin) that could predispose young adults to poorer long-term weight outcomes (Pyykkönen et al., 2010; Roos et al., 2018). Most likely, there is not one independent pathway, but a complex interplay among multiple pathways, that contribute to the link between experiencing stress and life events and treatment outcomes. Elucidating these mechanisms of action would be a valuable aim in future trials.
While a large number of events at 4 months was detrimental to long-term weight control, individuals experiencing a small number of events (i.e., 1-2) had the best weight outcomes and attendance. Life events and transitions are relatively common in this age group (Arnett, 2004; Svetkey et al., 2015); thus, individuals may be accustomed to adapting healthy behaviors following a small number of events. Further, many life events may be perceived as positive and perhaps even aligned with weight management goals (e.g., marriage, new job). Novel, interesting, and challenging experiences also foster personal growth and self-expansion, which has been shown to promote engagement and outcomes in behavioral interventions, including weight loss interventions (Xu et al., 2017). The results showing that having at least one work, school, or financial event was beneficial for retention supports the notion that a small number of events may be advantageous.
Generally, the associations between life events and perceived stress with program outcomes did not show any differences by treatment arm. Thus, for young adults experiencing numerous life events or high perceived stress, both the LC and SC treatment may be equally suitable. Interestingly, the LC treatment showed the best retention for individuals who experienced 3 or more events during intervention. This association may warrant further investigation, but there are several possibilities worth noting. First, it is possible that participation in the intensive intervention and weight loss phase of LC while experiencing more life events reflects a level of commitment that is then maintained and reflected in better retention. Alternatively, for those participants experiencing numerous life events, perhaps the more structured self-regulation approach taught in the LC arm was perceived as helpful and applicable to other domains of their life, which could be associated with better retention over time.
There are some important limitations that should be considered. First, the CARDIA questionnaire is a checklist–as such, it only assessed whether participants experienced an event, not their perception of the event. Future studies should assess whether the exposure to the event itself or the reaction to the event is the most important in predicting less favorable treatment response. Indeed, it is possible that individuals who experience a high number of life events but report lower perceived stress may have different engagement and weight trajectories compared with individuals who experience similar life events but report higher perceived stress. Additionally, longer-term engagement after the initial 4-month program, which showed few associations with life events or stress, was quantified by the submission of weights once a month–a relatively basic definition. Assessment of dietary self-monitoring or other types of engagement more directly related to weight in the extended follow up period may be better measures, as they may be more affected by life events and could relate more closely to weight outcomes. Future studies should take a more nuanced look at how life events impact behavioral adherence and subsequent outcomes. Furthermore, given the design, causality cannot be determined–it is possible that other unmeasured factors could be contributing to the observed associations between life events, perceived stress, and trial outcomes. Additional limitations worth noting include the relatively homogeneous sample. Results may not generalize to socio-demographically diverse young adults or to young men. Future studies should examine these questions in a more diverse sample and seek to explicate the mechanisms by which perceived stress and life events might interfere with weight change over time. It would also be of interest to examine whether these associations might vary by weight status.
Major strengths of this work include a high-risk population of young adults recruited across two clinical sites, a generalizable sample with respect to age, work / school status, and geographical region. Additional strengths of note include a randomized controlled design with two distinct intervention approaches, and long-term follow up with excellent retention. Taken together, findings suggest life events and perceived stress might be a barrier to both program participation and long-term weight gain prevention for young adults. Future studies should examine ways to optimize outcomes in young adults, particularly those who experience high stress and frequent life events–this could include assessing how experiencing life events and stress unfold in real-time within the daily lives of young adults enrolled in lifestyle intervention using ecological momentary assessment or other novel approaches; assessing these factors and using data to drive tailored coaching and support that is responsive to individuals’ context and needs in lifestyle interventions; and / or designing integrated lifestyle interventions to target psychological coping and management of these stressors for vulnerable young adults.
Supplementary Material
Disclosures and Acknowledgements:
The parent study was pre-registered at clinicaltrials.gov as Study of Novel Approaches for Prevention (NCT#011836864). Data from the trial are publicly available: https://biolincc.nhlbi.nih.gov/studies/snap/. This secondary analysis was not pre-registered and analytic code used to conduct the analyses presented in this study are not available in a public archive; they are available by emailing the co-author responsible for the analyses in this study, krgarcia@wakehealth.edu. Funding for the parent trial was provided by National Heart, Lung, and Blood Institute (U01HL090864). RRW declares membership on the Scientific Advisory Board for Noom and DFT declares membership on the Scientific Advisory Board for WW International and Wondr Health. No other authors have disclosures potentially related to this work.
References
- American Psychological Association. (2012, January). 2012 Stress by Generations. Https://Www.Apa.Org. https://www.apa.org/news/press/releases/stress/2012/generations [Google Scholar]
- Arnett JJ (2004). Emerging Adulthood: The Winding Road from the Late Teens Through the Twenties. Oxford University Press. [Google Scholar]
- Braden A, Flatt S, Boutelle K, Strong D, Sherwood N, & Rock C (2016). Emotional eating is associated with weight loss success among adults enrolled in a weight loss program. Journal of Behavioral Medicine, 39(4), pp. 727–732). 10.1007/s10865-016-9728-8 [DOI] [PMC free article] [PubMed] [Google Scholar]
- Brown KL, Graham AK, Perera RA, & LaRose JG (2022). Eating to cope: Advancing our understanding of the effects of exposure to racial discrimination on maladaptive eating behaviors. The International journal of eating disorders, 10.1002/eat.23820. Advance online publication. https://doi-org.proxy.library.vcu.edu/10.1002/eat.23820. [DOI] [PMC free article] [PubMed] [Google Scholar]
- Cohen S, Kamarck T, & Mermelstein R (1983). A Global Measure of Perceived Stress. Journal of Health and Social Behavior, 24(4), 385–396. 10.2307/2136404 [DOI] [PubMed] [Google Scholar]
- Conklin AI, Forouhi NG, Brunner EJ, & Monsivais P (2014). Persistent financial hardship, 11-year weight gain, and health behaviors in the Whitehall II study. Obesity, 22(12), 2606–2612. 10.1002/oby.20875 [DOI] [PMC free article] [PubMed] [Google Scholar]
- Corsino L, Lin P-H, Batch BC, Intille S, Grambow SC, Bosworth HB, Bennett GG, Tyson C, Svetkey LP, & Voils CI (2013). Recruiting young adults into a weight loss trial: Report of protocol development and recruitment results. Contemporary Clinical Trials, 35(2), 1–7. 10.1016/j.cct.2013.04.002 [DOI] [PMC free article] [PubMed] [Google Scholar]
- Dietz WH (2017). Obesity and Excessive Weight Gain in Young Adults: New Targets for Prevention. JAMA, 318(3), 241–242. 10.1001/jama.2017.6119 [DOI] [PubMed] [Google Scholar]
- Gavin KL, Wolfson J, Pereira M, Sherwood N, & Linde JA (2019). Life Events, Physical Activity, and Weight Loss Maintenance: Decomposing Mediating and Moderating Effects of Health Behavior. Journal of Physical Activity & Health, 16(4), 267–273. [DOI] [PMC free article] [PubMed] [Google Scholar]
- Gropper H, John JM, Sudeck G, & Thiel A (2020). The impact of life events and transitions on physical activity: A scoping review. PLoS ONE, 15(6), e0234794. 10.1371/journal.pone.0234794 [DOI] [PMC free article] [PubMed] [Google Scholar]
- Hebden L, Chey T, & Allman-Farinelli M (2012). Lifestyle intervention for preventing weight gain in young adults: A systematic review and meta-analysis of RCTs: Weight gain prevention in young adults. Obesity Reviews, 13(8), 692–710. 10.1111/j.1467-789X.2012.00990.x [DOI] [PubMed] [Google Scholar]
- Kanfer FH (1975). Helping people change: A textbook of methods. Pergamon Press. [Google Scholar]
- LaRose JG, Guthrie KM, Lanoye A, Tate DF, Robichaud E, Caccavale LJ, & Wing RR (2016). A mixed methods approach to improving recruitment and engagement of emerging adults in behavioural weight loss programs. Obesity Science & Practice, 2(4), 341–354. 10.1002/osp4.71 [DOI] [PMC free article] [PubMed] [Google Scholar]
- LaRose JG, Tate DF, Lanoye A, Fava JL, Jelalian E, Blumenthal M, Caccavale LJ, & Wing RR (2019). Adapting evidence-based behavioral weight loss programs for emerging adults: A pilot randomized controlled trial. Journal of Health Psychology, 24(7), 870–887. 10.1177/1359105316688951 [DOI] [PMC free article] [PubMed] [Google Scholar]
- Laska MN, Pelletier JE, Larson NI, & Story M (2012). Interventions for Weight Gain Prevention During the Transition to Young Adulthood: A Review of the Literature. Journal of Adolescent Health, 50(4), 324–333. 10.1016/j.jadohealth.2012.01.016 [DOI] [PMC free article] [PubMed] [Google Scholar]
- Lewis CE, Jacobs DR Jr., McCreath H, Kiefe CI, Schreiner PJ, Smith DE, & Williams OD (2000). Weight Gain Continues in the 1990s: 10-year Trends in Weight and Overweight from the CARDIA Study. American Journal of Epidemiology, 151(12), 1172–1181. [DOI] [PubMed] [Google Scholar]
- Loria CM, Signore C, & Arteaga SS (2010). The Need for Targeted Weight-Control Approaches in Young Women and Men. American Journal of Preventive Medicine, 38(2), 233–235. 10.1016/j.amepre.2009.11.001 [DOI] [PMC free article] [PubMed] [Google Scholar]
- Lytle LA, Svetkey LP, Patrick K, Belle SH, Fernandez ID, Jakicic JM, Johnson KC, Olson CM, Tate DF, Wing R, & Loria CM (2014). The EARLY trials: A consortium of studies targeting weight control in young adults. Translational Behavioral Medicine, 4(3), 304–313. 10.1007/s13142-014-0252-5 [DOI] [PMC free article] [PubMed] [Google Scholar]
- Miller J, Nelson T, Barr-Anderson DJ, Christoph MJ, Winkler M, & Neumark-Sztainer D (2019). Life Events and Longitudinal Effects on Physical Activity: Adolescence to Adulthood. Medicine & Science in Sports & Exercise, 51(4), 663–670. 10.1249/MSS.0000000000001839 [DOI] [PMC free article] [PubMed] [Google Scholar]
- Mulye TP, Park MJ, Nelson CD, Adams SH, Irwin CE, & Brindis CD (2009). Trends in Adolescent and Young Adult Health in the United States. Journal of Adolescent Health, 45(1), 8–24. 10.1016/j.jadohealth.2009.03.013 [DOI] [PubMed] [Google Scholar]
- Nelson MC, Story M, Larson NI, Neumark-Sztainer D, & Lytle LA (2008). Emerging Adulthood and College-aged Youth: An Overlooked Age for Weight-related Behavior Change. Obesity, 16(10), 2205–2211. 10.1038/oby.2008.365 [DOI] [PubMed] [Google Scholar]
- Norman SA, Greenberg R, Marconi K, Novelli W, Felix M, Schechter C, Stolley P, & Stunkard A (1990). A process evaluation of a two-year community cardiovascular risk reduction program: What was done and who knew about it? Health Education Research, 5(1), 87–97. 10.1093/her/5.1.87 [DOI] [Google Scholar]
- Northrup TF, Greer TL, Walker R, Rethorst CD, Warden D, Stotts AL, & Trivedi MH (2017). An ounce of prevention: A pre-randomization protocol to improve retention in substance use disorder clinical trials. Addictive Behaviors, 64, 137–142. 10.1016/j.addbeh.2016.08.040 [DOI] [PMC free article] [PubMed] [Google Scholar]
- Novelli IR, Fonseca LG, Gomes DL, Dutra ES, & Baiocchi de Carvalho KM (2018). Emotional eating behavior hinders body weight loss in women after Roux-en-Y gastric bypass surgery. Nutrition, 49, 13–16. 10.1016/j.nut.2017.11.017 [DOI] [PubMed] [Google Scholar]
- Partridge SR, Juan SJ-H, McGeechan K, Bauman A, & Allman-Farinelli M (2015). Poor quality of external validity reporting limits generalizability of overweight and/or obesity lifestyle prevention interventions in young adults: A systematic review. Obesity Reviews, 16(1), 13–31. 10.1111/obr.12233 [DOI] [PubMed] [Google Scholar]
- Pegington M, French DP, & Harvie MN (2020). Why young women gain weight: A narrative review of influencing factors and possible solutions. Obesity Reviews, 21(5), e13002. 10.1111/obr.13002 [DOI] [PubMed] [Google Scholar]
- Pickett S, Burchenal CA, Haber L, Batten K, & Phillips E (2020). Understanding and effectively addressing disparities in obesity: A systematic review of the psychological determinants of emotional eating behaviours among Black women. Obesity Reviews, 21(6), e13010. 10.1111/obr.13010 [DOI] [PubMed] [Google Scholar]
- Pyykkönen A-J, Räikkönen K, Tuomi T, Eriksson JG, Groop L, & Isomaa B (2010). Stressful life events and the metabolic syndrome: The prevalence, prediction and prevention of diabetes (PPP)-Botnia Study. Diabetes Care, 33(2), 378–384. 10.2337/dc09-1027 [DOI] [PMC free article] [PubMed] [Google Scholar]
- Roos LG, Levens SM, & Bennett JM (2018). Stressful life events, relationship stressors, and cortisol reactivity: The moderating role of suppression. Psychoneuroendocrinology, 89, 69–77. 10.1016/j.psyneuen.2017.12.026 [DOI] [PMC free article] [PubMed] [Google Scholar]
- Scherwitz L, Perkins L, Chesney M, & Hughes G (1991). Cook-Medley Hostility scale and subsets: Relationship to demographic and psychosocial characteristics in young adults in the CARDIA study. Psychosomatic Medicine, 53(1), 36–49. [DOI] [PubMed] [Google Scholar]
- Svetkey LP, Batch BC, Lin P-H, Intille SS, Corsino L, Tyson CC, Bosworth HB, Grambow SC, Voils C, Loria C, Gallis JA, Schwager J, & Bennett GB (2015). Cell phone intervention for you (CITY): A randomized, controlled trial of behavioral weight loss intervention for young adults using mobile technology. Obesity, 23(11), 2133–2141. 10.1002/oby.21226 [DOI] [PMC free article] [PubMed] [Google Scholar]
- Tan CC, & Chow CM (2014). Stress and emotional eating: The mediating role of eating dysregulation Personality and Individual Differences, 66, 1–4. 10.1016/j.paid.2014.02.033 [DOI] [Google Scholar]
- Tate DF, LaRose JG, Griffin LP, Erickson KE, Robichaud EF, Perdue L, Espeland MA, & Wing RR (2014). Recruitment of young adults into a randomized controlled trial of weight gain prevention: message development, methods, and cost. Trials, 15, 326. 10.1186/1745-6215-15-326 [DOI] [PMC free article] [PubMed] [Google Scholar]
- Truesdale KP, Stevens J, Lewis CE, Schreiner PJ, Loria CM, & Cai J (2006). Changes in risk factors for cardiovascular disease by baseline weight status in young adults who maintain or gain weight over 15 years: The CARDIA study. International Journal of Obesity, 30(9), 1397–1407. 10.1038/sj.ijo.0803307 [DOI] [PMC free article] [PubMed] [Google Scholar]
- Turk MW, Sereika SM, Yang K, Ewing LJ, Hravnak M, & Burke LE (2012). Psychosocial Correlates of Weight Maintenance Among Black & White Adults. American Journal of Health Behavior, 36(3), 397–407. 10.5993/AJHB.36.3.10 [DOI] [PMC free article] [PubMed] [Google Scholar]
- Werneck AO, Winpenny EM, Foubister C, Guagliano JM, Monnickendam AG, van Sluijs EMF, & Corder K (2020). Cohabitation and marriage during the transition between adolescence and emerging adulthood: A systematic review of changes in weight-related outcomes, diet and physical activity. Preventive Medicine Reports, 20. 10.1016/j.pmedr.2020.101261 [DOI] [PMC free article] [PubMed] [Google Scholar]
- Wing RR, Russell GB, Tate DF, Espeland MA, LaRose JG, Gorin AA, Lewis CE, Jelalian E, Perdue LH, Bahnson J, Polzien K, Ferguson Robichaud E (2020). Examining Heterogeneity of Outcomes in a Weight Gain Prevention Program for Young Adults. Obesity, 28(3), 521–528. 10.1002/oby.22720 [DOI] [PMC free article] [PubMed] [Google Scholar]
- Wing RR, Tate DF, Gorin AA, Raynor HA, & Fava JL (2006). A Self-Regulation Program for Maintenance of Weight Loss. New England Journal of Medicine, 355(15), 1563–1571. 10.1056/NEJMoa061883 [DOI] [PubMed] [Google Scholar]
- Winpenny EM, Smith M, Penney T, Foubister C, Guagliano JM, Love R, Clifford Astbury C, van Sluijs EMF, & Corder K (2020). Changes in physical activity, diet, and body weight across the education and employment transitions of early adulthood: A systematic review and meta-analysis. Obesity Reviews, 21(4), e12962. 10.1111/obr.12962 [DOI] [PMC free article] [PubMed] [Google Scholar]
- Wing RR, Tate D, Espeland M, Gorin A, LaRose JG, Robichaud EF, Erickson K, Perdue L, Bahnson J, & Lewis CE (2013). Weight gain prevention in young adults: design of the study of novel approaches to weight gain prevention (SNAP) randomized controlled trial. BMC public health, 13, 300. https:// 10.1186/1471-2458-13-300 [DOI] [PMC free article] [PubMed] [Google Scholar]
- Wing RR, Tate DF, Espeland MA, Lewis CE, LaRose JG, Gorin AA, et al. , & Study of Novel Approaches to Weight Gain Prevention (SNAP) Research Group (2016). Innovative Self-Regulation Strategies to Reduce Weight Gain in Young Adults: The Study of Novel Approaches to Weight Gain Prevention (SNAP) Randomized Clinical Trial. JAMA internal medicine, 176(6), 755–762. https://doi-/ 10.1001/jamainternmed.2016.1236 [DOI] [PMC free article] [PubMed] [Google Scholar]
- Xu X, Leahey TM, Boguszewski K, Krupel K, Mailloux KA, & Wing RR (2017). Self-Expansion is Associated with Better Adherence and Obesity Treatment Outcomes in Adults. Annals of Behavioral Medicine, 51(1), 13–17. 10.1007/s12160-016-9823-7 [DOI] [PMC free article] [PubMed] [Google Scholar]
- Zheng Y, Manson JE, Yuan C, Liang MH, Grodstein F, Stampfer MJ, Willett WC, & Hu FB (2017). Associations of Weight Gain from Early to Middle Adulthood With Major Health Outcomes Later in Life. JAMA, 318(3), 255–269. 10.1001/jama.2017.7092 [DOI] [PMC free article] [PubMed] [Google Scholar]
Associated Data
This section collects any data citations, data availability statements, or supplementary materials included in this article.