

Abstract
Mechanical signals stimulate mitochondrial function but the molecular mechanisms are not clear. Here, we show that the mechanically sensitive ion channel Piezo1 plays a critical role in mitochondrial adaptation to mechanical stimulation. Activation of Piezo1 induced mitochondrial calcium uptake, and oxidative phosphorylation (OXPHOS). In contrast, loss of Piezo1 reduced the mitochondrial oxygen consumption rate (OCR) and ATP production in calvarial cells and these changes were associated with increased expression of the phosphodiesterases Pde4a and lower cyclic AMP (cAMP) levels. In addition, Piezo1 increased cAMP production and activation of a cAMP-responsive transcriptional reporter. Consistent with this, cAMP was sufficient to increase mitochondrial OCR and inhibition of phosphodiesterases augmented the increase in OCR induced by Piezo1. Moreover, inhibition of cAMP production or activity of protein kinase A, a kinase activated by cAMP, prevented the increase in OCR induced by Piezo1. These results demonstrate that cAMP signaling contributes to the increase in mitochondrial OXPHOS induced by activation of Piezo1.
1. INTRODUCTION
Cells perceive mechanical signals from a variety of sources, ranging from the stretch forces on vascular cells caused by blood pressure to the forces that occur on bone cells because of gravity or exercise. These mechanical signals can promote cell proliferation, function, and differentiation1–3. Multiple mechanisms have been attributed to the cell anabolic effects of mechanical stimulation, including increased energy metabolism and mitochondrial function4. As major sources of ATP synthesis and essential regulators of energy metabolism, mitochondria play critical roles in a variety of cellular activities including proliferation, differentiation, and apoptosis5,6. Mechanical stimulation is sufficient to promote mitochondrial biogenesis and function in various cell types in vitro and in vivo7–9. For example, exercise training in mice stimulates mitochondrial biogenesis in skeletal muscle10. Mechanical cues that cells perceive from their microenvironment also govern mitochondrial shape and function11. However, the molecular mechanisms by which mechanical stimulation increases mitochondrial function are not fully understood.
Piezo1 is a mechanosensitive ion channel present in cell membrane and has been shown to play critical roles in the development and homeostasis of multiple organs, including bone and components of the cardiovascular system12–15. Because Piezo1 can be activated by physical perturbation of cell membranes, and because this activation initiates signaling cascades, this calcium permeable ion channel acts as both a mechanosensor and a mechanotransducer13,16. Recently, we and others have shown that deletion of Piezo1 in osteoblast lineage cells leads to low bone mass associated with decreased osteoblast number and bone formation in mice12,17,18. More importantly, the anabolic response of the skeleton to mechanical loading is blunted in mice lacking Piezo1 in cells of the osteoblast lineage12, demonstrating the importance of Piezo1 in bone mechanotransduction. Piezo1 also mediates the mechano-responsiveness of cardiomyocytes, vascular endothelial cells, smooth muscle cells, red blood cells, and lymphocytes14,19–22. Although Piezo1 has been recognized as a mechanosensor in a variety of cell types, a role for Piezo1 in the mitochondrial changes that occur in response to mechanical stimulation has not been established.
Calcium accumulation in mitochondrial matrix regulates mitochondrial functions including ATP production through oxidative phosphorylation (OXPHOS)23. Mitochondrial calcium uniporter (MCU) complex is considered the primary pathway for calcium entry into mitochondrial matrix and plays a critical role in maintaining mitochondrial calcium homoeostasis24. MCU mediated mitochondrial calcium uptake is critical for mitochondrial ATP production in cardiomyocytes25. In addition, recent studies show that calcium oscillation drives the cyclic adenosine monophosphate (cAMP)/protein kinase A (PKA) signaling in β cells of the pancreas, constituting a tightly coordinated system controlling cell metabolism11. Previous studies have demonstrated that the cAMP/PKA pathway is an important regulator of mitochondrial function26,27. Elevated cAMP increases PKA activity and this is sufficient to promote mitochondrial OXPHOS28. More specifically, the activities of mitochondrial complex I, IV, and V are regulated by PKA phosphorylation of electron transport chain components26,27. Given the important role of the cAMP/PKA pathway in mitochondria and its integration with calcium signaling, we hypothesized that Piezo1 contributes to the effects of mechanical stimulation on mitochondrial function. We utilized calvarial osteoblastic cells as a model in current study since our previous studies demonstrated the important role of Piezo1 in bone hemostasis and mechanotransduction. Our results indicate that cAMP signaling induced by Piezo1 mediates the positive effects of mechanical stimulation on mitochondrial OXPHOS.
2. MATERIALS AND METHODS
2.1. Mice and tibia anabolic loading.
The mice harboring Piezo1 conditional allele, termed Piezo1f/f mice, were described previously21 and purchased from the Jackson laboratory. C57BL/6J female mice were purchased from the Jackson laboratory. A 10N axial load was applied to left tibia of 4-month-old female C57BL/6J mice at the tibial midshaft using an Electroforce TA 5500 (TA Instruments, New Castle, DE). Each mouse was loaded with one bout (less than 10 minutes) of compressive loading applied in 1200 cycles with 4-Hz triangle waveform and 0.1s rest time between each cycle, a protocol shown to be anabolic previously12. The unloaded contralateral tibiae were used as controls. Mice were then returned to housing cage and were harvested 4 hours later for gene expression analysis. We housed all mice in the animal facility of the University of Arkansas for Medical Sciences. Animal studies were performed in strict accordance with the recommendations in the Guide for the Care and Use of Laboratory Animals of the National Institutes of Health. Animal use protocol was approved by the Institutional Animal Care and Use Committee (IACUC) of the University of Arkansas for Medical Sciences. All of the animals were handled according to approved protocols.
2.2. Cell culture.
Calvarial cells were isolated from newborn mice as described previously29 and were cultured in α-MEM supplemented with 10% FBS and 1% penicillin/streptomycin/ glutamine. Cardiomyocytes were isolated from newborn mice using Pierce primary cardiomyocyte isolation kit (ThermoFisher Scientific) and cultured in differentiation medium for 7 days following the manufacturer’s protocol. Primary human umbilical vein endothelial cells (HUVEC) were purchased from ThermoFisher Scientific. Fifteen dynes/cm2 oscillatory fluid shear stress was applied on calvarial cells at 1Hz for 2 hours using an IBDI pump system (IBIDI, German). For Yoda1 treatment, cells were cultured in the presence of 10 μM Yoda1 (Sigma, St. Louis, MO) or DMSO for 2 hours. Immediately after the treatments, we isolated RNA from cells using RNeasy mini kit (Qiagen, German) for qPCR and lysis cells for ATP measurement using bioluminescent assay. For cAMP measurements, cells were treated with 10 μM Yoda1 for 4 hours and cell lysates were then harvested. Cellular cAMP were measured using a mouse cAMP enzyme immunoassay kit (R&D Systems) according to the manual provided by the manufacturer. All in vitro cell culture experiments were performed three times with three technical replicates.
For proliferation assay, calvarial cells were cultured in 96-well culture plate at the density of 2,000 cells/well. After 48 hours of 100nM Yoda1 treatment, BrdU was added into cultures and incubated overnight. Cell proliferation was then determined using Cell Proliferation ELISA, BrdU kit (11647229001, Roche) following manufacturer’s instruction and normalized by total protein.
For apoptosis assay, calvarial cells were cultured in 24-well culture plate with 1 × 10⁵ cells/well. Cells were serum starved for 4 hours to induce apoptosis. Yoda1 (10 μM) or DMSO were added to cultures at the beginning of the starvation. Regular culture medium with 10% FBS supplemented with 10 μM Yoda1 or Veh were also included as controls. Caspase 3 activity was measured using fluorogenic substrate Ac-DEVD-AFC (ALX-260–032, Enzo) for caspase-3 following manufacturer’s instruction. Caspase 3 activity was normalized by total protein.
2.3. Generation of DNA constructs and viruses.
To silence Piezo1, we used the Piezo1 shRNA expression plasmid generated previously12. To silence Mcu, we generated Mcu shRNA expression plasmid using the following oligonucleotides in the pLKO.1-TRC cloning vector (Addgene Plasmid #10878, a gift from David Root): forward oligo: 5’-CCGGTAGGGAATAAAGGGATCTTAACTCGAGTTAAGATCCCTTTATTCCCTATTTT-TG-3’; reverse oligo: 5’-AATTCAAAAATAGGGAATAAAGGGATCTTAACTCGAGTTAAGATC-CCTTTATTCCCTA-3’. A shRNA against firefly luciferase was used as a control (Sigma, St. Louis, MO). For virus production, HEK293T cells were cultured in a 6-well culture plate and co-transfected with a total 3μg of lentiviral shRNA vector, pMD2G (Addgene plasmid #12259, a gift from Didier Trono), and psPAX2 (Addgene plasmid # 12260, a gift from Didier Trono) at the ratio of 2:0.9:0.4 using TransIT-LT1 transfection reagent (Mirus, Madison, WI). Culture media was changed 12 hours after transfection and viral supernatants were collected 48 hours after media change. Viral supernatants were filtered through a 0.45 μm filter and used immediately to transduce cells cultured in a 10 cm dish. Cells were then subjected to selection with puromycin (25 μg/ml) for 5 days before treatment. All in vitro cell culture experiments were performed three times with three technical replicates.
2.4. RNA-seq analysis.
MLO-Y4 cells were cultured in α-MEM supplemented with 5% FBS, 5% BCS, and 1% penicillin/streptomycin/glutamine. Piezo1 shRNA expression plasmid was used to knockdown Piezo1 in MLO-Y4 cells as described previously12. Purified RNA was used as input for sequencing library preparation and indexing using the TruSeq stranded mRNA kit (Illumina, CA), following the manufacturer’s protocol. The libraries were then pooled and sequenced using a NextSeq sequencer with 75 cycles of sequencing reaction. Data handling and processing were performed on the basis of a previous bioinformatics pipeline30. The high-quality reads (phred quality score, >25; length after trimming, >20 bases) were obtained with the dynamic trimming algorithm in the SolexaQA++ toolkits31, and aligned with the mouse genome version GRCm38 using BWA software32. Then the alignment files (.bam) were used to generate read counts for statistical analysis. The differential gene expression analysis was performed using negative binomial based statistic33. The adjusted p-values were used for gene enrichment analysis based on Gene Ontology using the piano package34.
2.5. Seahorse measurement.
Oxygen consumption rate and ATP production were measured using seahorse XFe96 analyzer (Agilent). The assay plates were coated with poly-L-lysine, and 80,000 calvarial cells were plated on each well overnight before the analysis. The analysis was carried out in seahorse cell culture medium with 10% FBS at room temperature. IBMX was added into cultures immediate before seahorse analysis at the final concentration of 0.1mM. Both KH7 and H89 were added into cultures 1 hour prior to seahorse analysis at the final concentration of 10uM. Oxygen consumption was then measured every 6 min and the following injections were performed after every four measurements: (1) 1 mM oligomycin, (2) 1 mM FCCP, and (3) 2 mM rotenone and 2 mM antimycin A. For each replicate the four oxygen consumption measurements between each injection were averaged, after which the respiratory parameters were calculated. The results were normalized to cell number quantified by DNA content. The seahorse analysis was performed 2 to 3 times with 6–8 technical replicates.
2.6. Quantitative PCR.
Tibias were harvested from mice, removed of soft tissues, and stored immediately in liquid nitrogen. We prepared osteocyte-enriched bone by removing the ends of tibias and then flushing the bone marrow with PBS. We then scraped the bone surface with a scalpel and froze them in liquid nitrogen for later RNA isolation. We isolated total RNA using TRIzol (Life technologies, NY), according to the manufacturer’s instructions and prepared cDNA using High Capacity first strand cDNA synthesis kit (Life Technologies, NY). We performed quantitative RT-PCR using the following Taqman assays from Applied Biosystems: Piezo1 (Mm01241549_m1); Mt-Cox1 (Mm04225243_g1); Mt-Cox2 (Mm03294838_g1); Mt-Cox3 (Mm04225261_g1); Mt-Cyb (Mm04225271_g1); Atp5b (Mm01160389_g1); Mcu (Mm01168773_m1); Micu1 (Mm00522783_m1); Mrps2 (Mm00475529_m1); Actb (Mm02619580_g1); human Piezo1 (Hs01018989_g1); human Mt-Cox1 (Hs02596864_g1); human Mt-Cox2 (Hs02596865_g1); human Mt-Cox3 (Hs02596866_g1); human Mt-Cyb (Hs02596867_s1); human Mrps2 (Hs00211334_m1); and human Actb (Hs03023943_g1). We calculated relative mRNA amounts using the ΔCt method35. Mitochondrial DNA were quantified as described previously36. Specifically, the following custom TaqMan assay for the mitochondrial gene ND2 was utilized: forward, 5’-CATGACAAAAAATTGCTCCCCTATCAA-3’, reverse, 5’-ATGCCCCTATGAAAATAG-AAGTAATTGCT-3’, probe, 5’-FAM-CCCGCTACTCAACTCT-NFQ-3’. The amount of mitochondrial DNA was calculated using results from the ND2 and TaqMan Tfrc copy number reference assays (4458366) and the ΔCt method35.
2.7. Mitochondria staining.
Cells grew on glass-bottom dish were treated with Yoda1 for 24 hours. Cells were then removed of culture medium and were stained with mitochondria staining solution containing mitoTracker Green FM (9074S, Cell Signaling Technology) at 37°C for 30 minutes. After staining, we replaced the staining solution with fresh culture medium and observed fluorescence under confocal microscopy (LSM 880, Zeiss, German). Mitochondrial analysis was carried out using the ImageJ (Fiji) software (NIH, MD) and mitochondria analyzer plugin37.
2.8. Mitochondrial calcium quantification.
For mitochondrial calcium concentration measurement, we transfected calvarial cells with mitochondria targeted fluorescent calcium reporter pCMV CEPIA3mt (addgene plasmid #58219, a gift from Masamitsu Iino)38. Cells were cultured in 6mm glass bottom dish (ThermoFisher Scientific, MA) overnight and the fluorescence were observed under an inverted fluorescent microscopy (Zeiss, German). Images were taken before and after Yoda1 (10 μM) treatment for 3 minutes at an interval of 5 seconds. The fluorescence was quantified using the ImageJ software (NIH, MD).
2.9. Mitochondrial membrane potential quantification.
Mitochondrial membrane potential was measured using non-quenching/redistribution mode. Calvarial cells were grew on glass-bottom dish overnight. For acute dynamic measurements, TMRM was added to the culture at a final concentration of 40nM and incubated at 37°C for 30 minutes. Cells were then observed under confocal microscopy (LSM 880, Zeiss, German). Fluorescent images were taken before and after treatment (10 μM Yoda1 or 1mM FCCP) for 5 minutes for analysis. For static measurement, cells were treated with Veh or Yoda1 for 2 hours and then were stained with 40nM TMRM for 30 minutes before imaging. Fluorescent images were taken using confocal microscopy (LSM 880, Zeiss, German) with x60 oil-immersion objective at 1 Airy Unit. ImageJ (Fiji) and TMRM membrane potential assay plugin from the Stuart lab were used to quantify mitochondrial membrane potential.
2.10. Western blot.
Total proteins were isolated from calvarial cells treated with Veh or 10 μM Yoda1 for 6 hours using Ripa buffer (Sigma, MO) supplemented with proteinase inhibitor (Sigma, MO). Thirty μg of total protein from each sample was incubated in SDS-PAGE loading buffer (50 mM Tris-HCl, pH 6.8, 2% SDS, 6% glycerol, 1% β-mercaptolethanol, and 0.004% bromophenol blue) for 5 min at 95°C. Proteins were then resolved in 10% SDS-polyacrylamide gels and electroblotted onto polyvinylidene difluoride membrane. Membrane was subsequently blocked with 5% nonfat dry milk in TBS and were then incubated with primary antibodies and an appropriate horseradish peroxidase-linked secondary antibody. The following antibodies were used: β-actin (#MA1–140; Invitrogen), mt-Cox1 (#55159S, Cell Signaling Technology), mt-Cox2 (PA5–75199, ThermoFisher), mt-Cox3 (PA5–75202, ThermoFisher), and mt-Cyb (PA5–100740, ThermoFisher). Membrane was stripped between antibodies by incubating in 15 ml stripping buffer for 10 minutes at room temperature. The immunoblot was quantified using ImageJ (NIH).
2.11. Statistical analysis.
GraphPad Prism 8 software (GraphPad, CA) was used for statistical analysis. Two-way analysis of variance (ANOVA) or Student’s t-test were used to detect statistically significant treatment effects, after determining that the data were normally distributed and exhibited equivalent variances. All t-tests were two-sided. P-values less than 0.05 were considered as significant. Error bars in all figures represent s.d..
3. RESULTS
3.1. Loss of Piezo1 results in decreased mitochondrial OXPHOS.
In order to better understand the downstream signaling pathways of Piezo1, we performed RNA-seq analysis in MLO-Y4 cells, an osteocyte cell line, after suppression of Piezo1 using shRNA to identify the overall gene expression changes in absence of Piezo1. GO enrichment analysis indicated that several mitochondria-related categories were down-regulated in Piezo1 knock-down MLO-Y4 cells (Figure 1A). Differential gene expression analysis showed that a group of genes related to mitochondrial transcription, translation, oxidative phosphorylation, and calcium transport were significantly down regulated in these cells (Figure 1B) indicating compromised mitochondrial function in cells lacking Piezo1. To determine whether Piezo1 contributes to mitochondrial function, we deleted Piezo1 in primary calvarial osteoblastic cells isolated from newborn Piezo1f/f mice that harbor a conditional allele for the Piezo1 gene using Adeno-Cre virus and measured expression of selected mitochondrial related genes as markers for Mitochondria. Consistent with our RNAseq data, we found that expressions of Tfam, mt-Cox1, and mt-Cyb were reduced in Piezo1 knockout calvarial cells (Figure 1C). To measure the mitochondrial OXPHOS in these cells, we quantified mitochondrial oxygen consumption rate (OCR) and ATP production. Consistent with decreased expression of mitochondria related genes, loss of Piezo1 decreased mitochondrial OCR (Figure 1D) and ATP production (Figure 1E) in calvarial cells. These results demonstrate that Piezo1 contributes to the regulation of mitochondrial OXPHOS.
FIGURE 1. Loss of Piezo1 results in decreased mitochondrial OXPHOS.
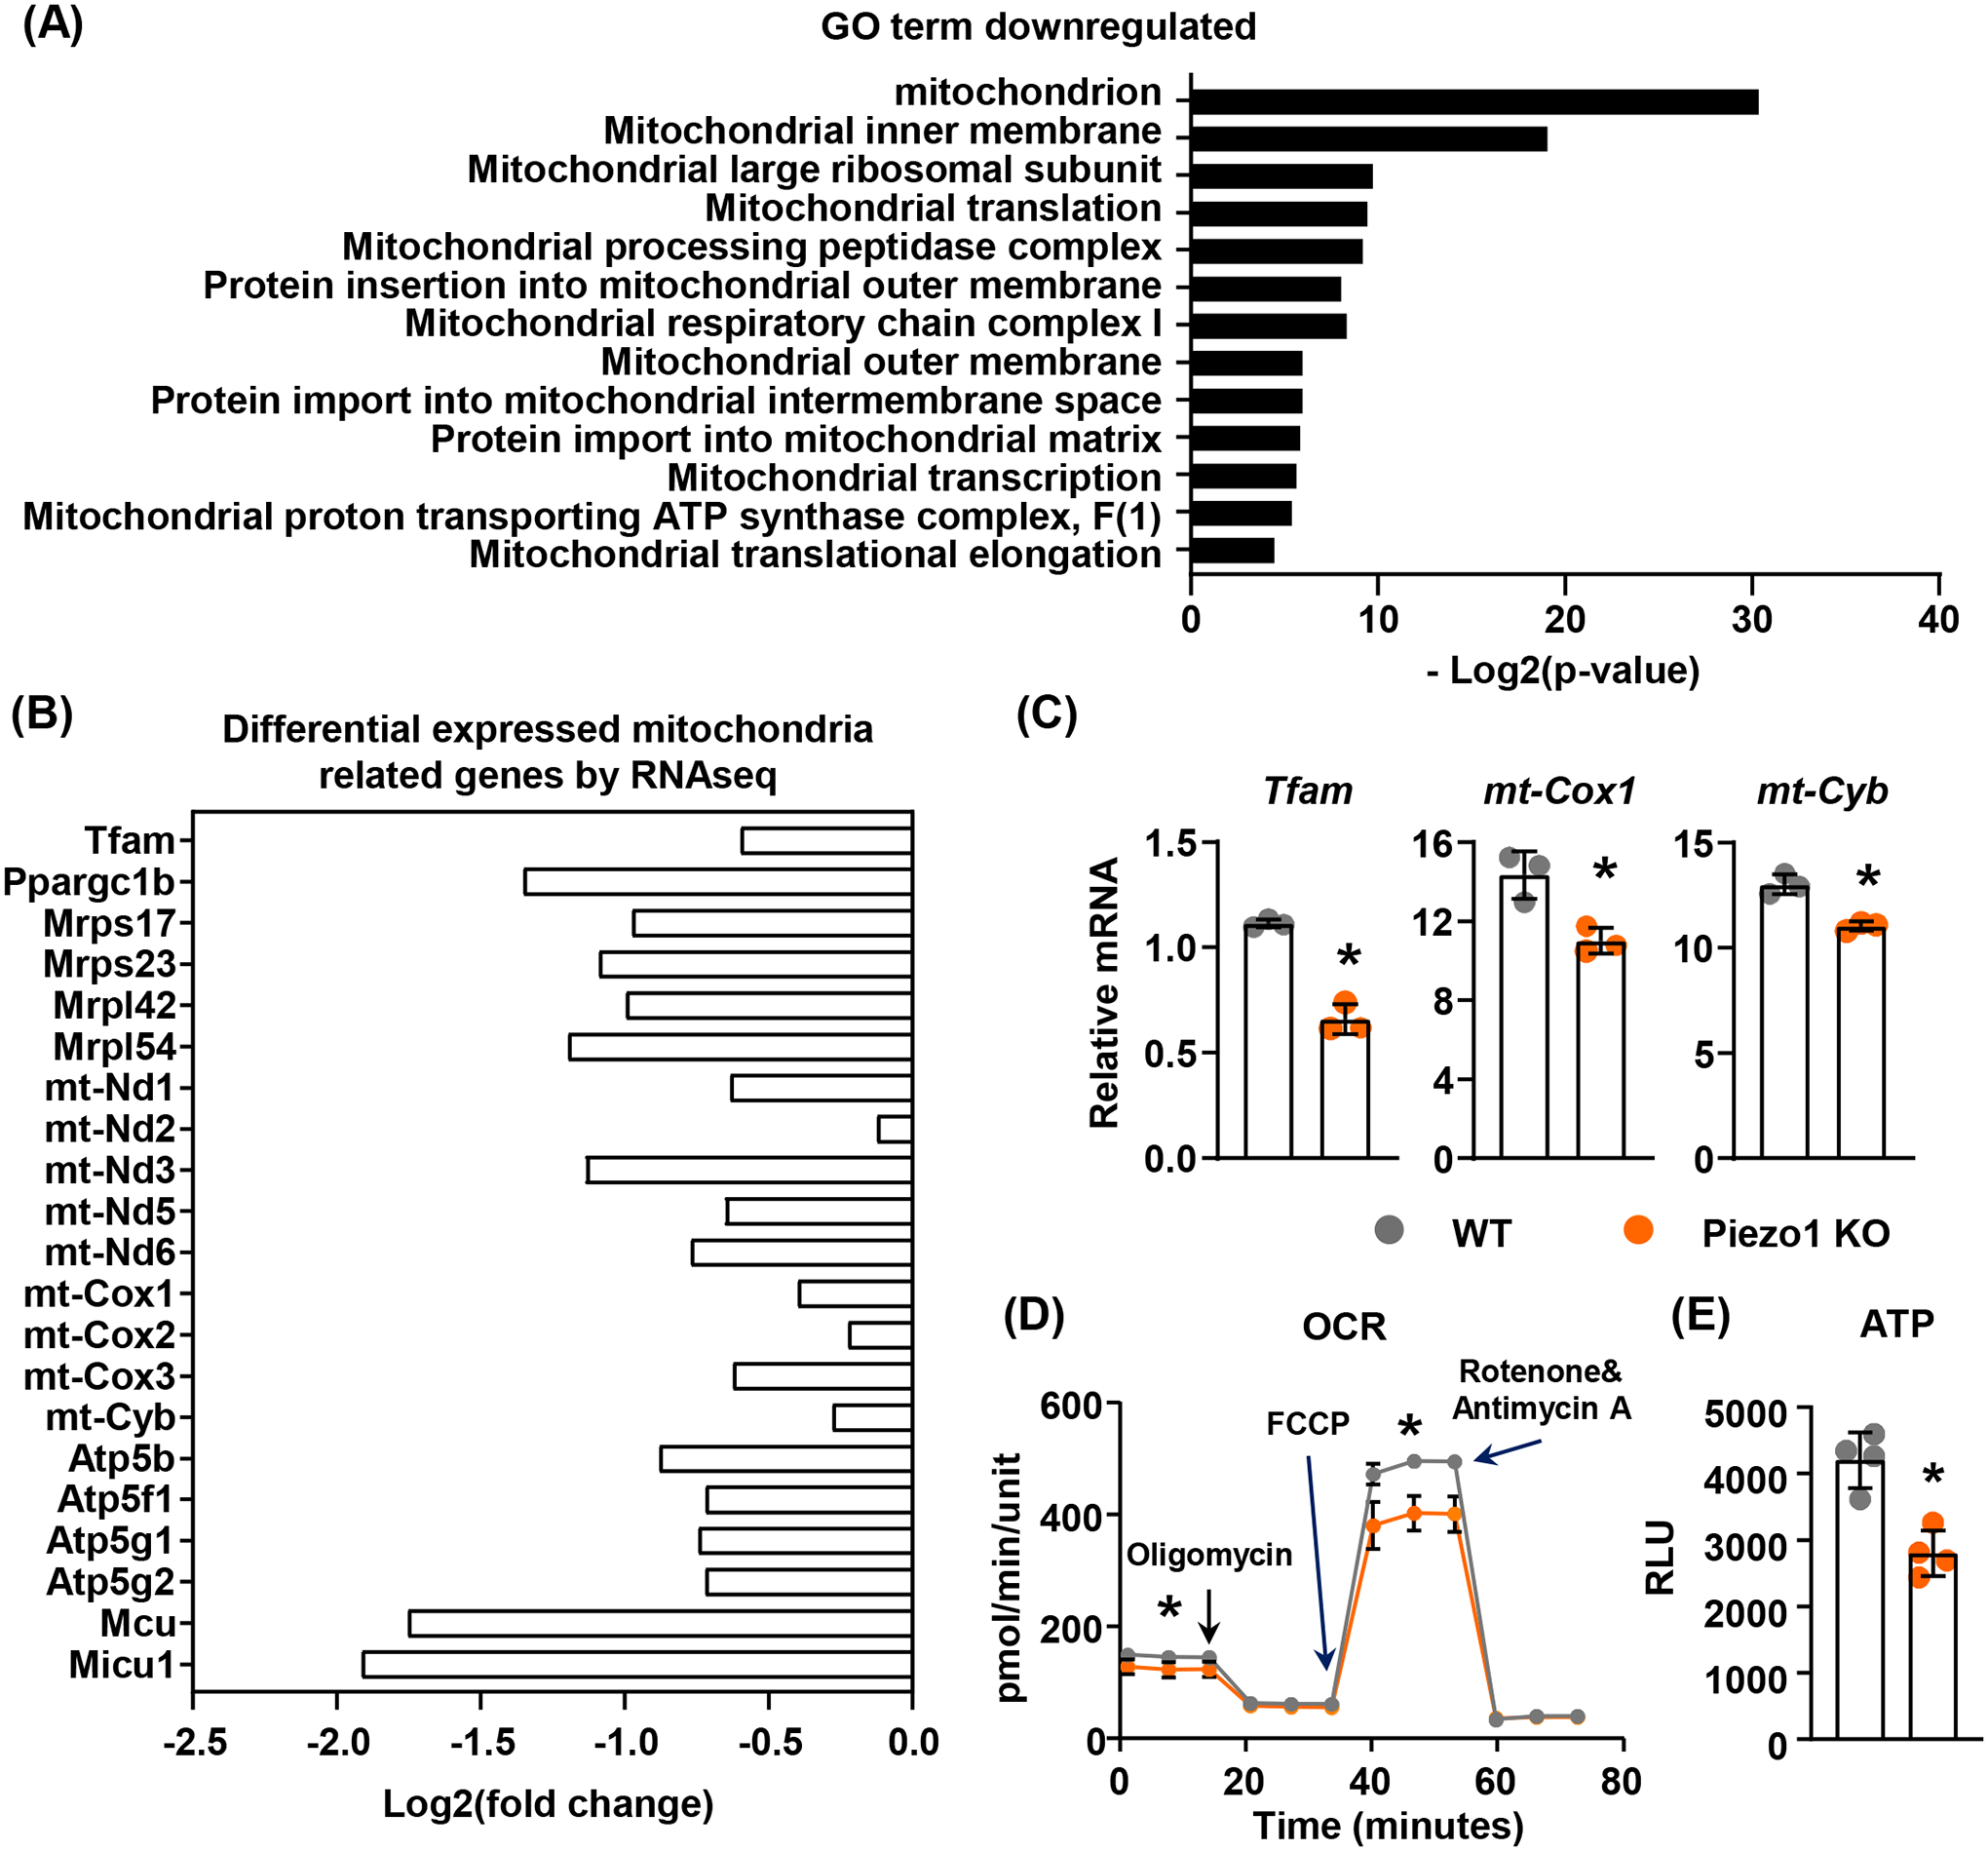
(A) GO enrichment analysis of RNA sequencing data from Piezo1 knock-down MLO-Y4 cells.
(B) Differential expressed mitochondrial related genes in Piezo1 knock-down MLO-Y4 cells.
(C) qPCR of mitochondrial related genes in wild type (WT) or Piezo1 knock out (KO) murine calvarial cells. *p < 0.05 using Student’s t-test.
(D and E) Mitochondrial OCR (D) and ATP production (E) measured in WT or Piezo1 KO calvarial cells treated with DMSO or 10μM Yoda1 for 2 hours. *p < 0.05 using Student’s t-test.
3.2. Activation of Piezo1 increases mitochondrial OXPHOS.
To determine whether mechanical stimulation increases mitochondrial OXPHOS in bone, we loaded the tibiae of 4-month-old female mice with 10N at 4Hz for 1200 cycles and measured mitochondrial gene expression in tibial cortical bone 4 hours later. We found that one bout of mechanical stimulation increased expression of Piezo1 as well as the mitochondrial genes mt-Cox1, mt-Cox2, mt-Cox3, mt-Cyb, and Atp5b which encode critical components of mitochondrial respiratory complexes (Figure 2A). Consistent with this, fluid shear stress also increased expression of these genes in calvarial osteoblastic cells (Figure 2B). In previous studies, we showed that activation of Piezo1 by Yoda1, a specific small molecule agonist of Piezo139, mimics the effects of fluid flow on MLO-Y4 cells12. Therefore, Yoda1 was used in this study to mimic fluid shear stress to activate Piezo1. Treatment of calvarial cells with Yoda1 increased expression of Piezo1 and mitochondrial genes (Figure 2C). Mitochondrial complex proteins including mt-Cox1, mt-Cox2, mt-Cox3, and mt-Cyb were also elevated in Yoda1 treated calvarial cells (Figure 2D and 2E). More importantly, Yoda1 increased the mitochondrial OCR and ATP production in calvarial cells (Figure 2F). However, these increases were blunted in Piezo1 knockout cells (Figure 2F). Since mitochondria are energy producing organelles regulating cell proliferation and survival, we next examined whether Piezo1 plays important roles in calvarial cell proliferation and starvation-induced cell death. We measured cell proliferation and serum starvation-induced apoptosis in wild type and Piezo1 knockout calvarial cells and found no significant changes (Figure 2G), indicating that loss of Piezo1 does not affect cell proliferation and survival which is consistent with our previous observation12. We then treated calvarial cells with Yoda1 and found that activation of Piezo1 significantly increased proliferation of calvarial cells (Figure 2H). In addition, Yoda1 blunted serum starvation-induced apoptosis in calvarial cells (Figure 2I). These results demonstrate that activation of Piezo1 by mechanical forces or chemical agonists promotes mitochondrial function.
FIGURE 2. Activation of Piezo1 increases mitochondrial function.
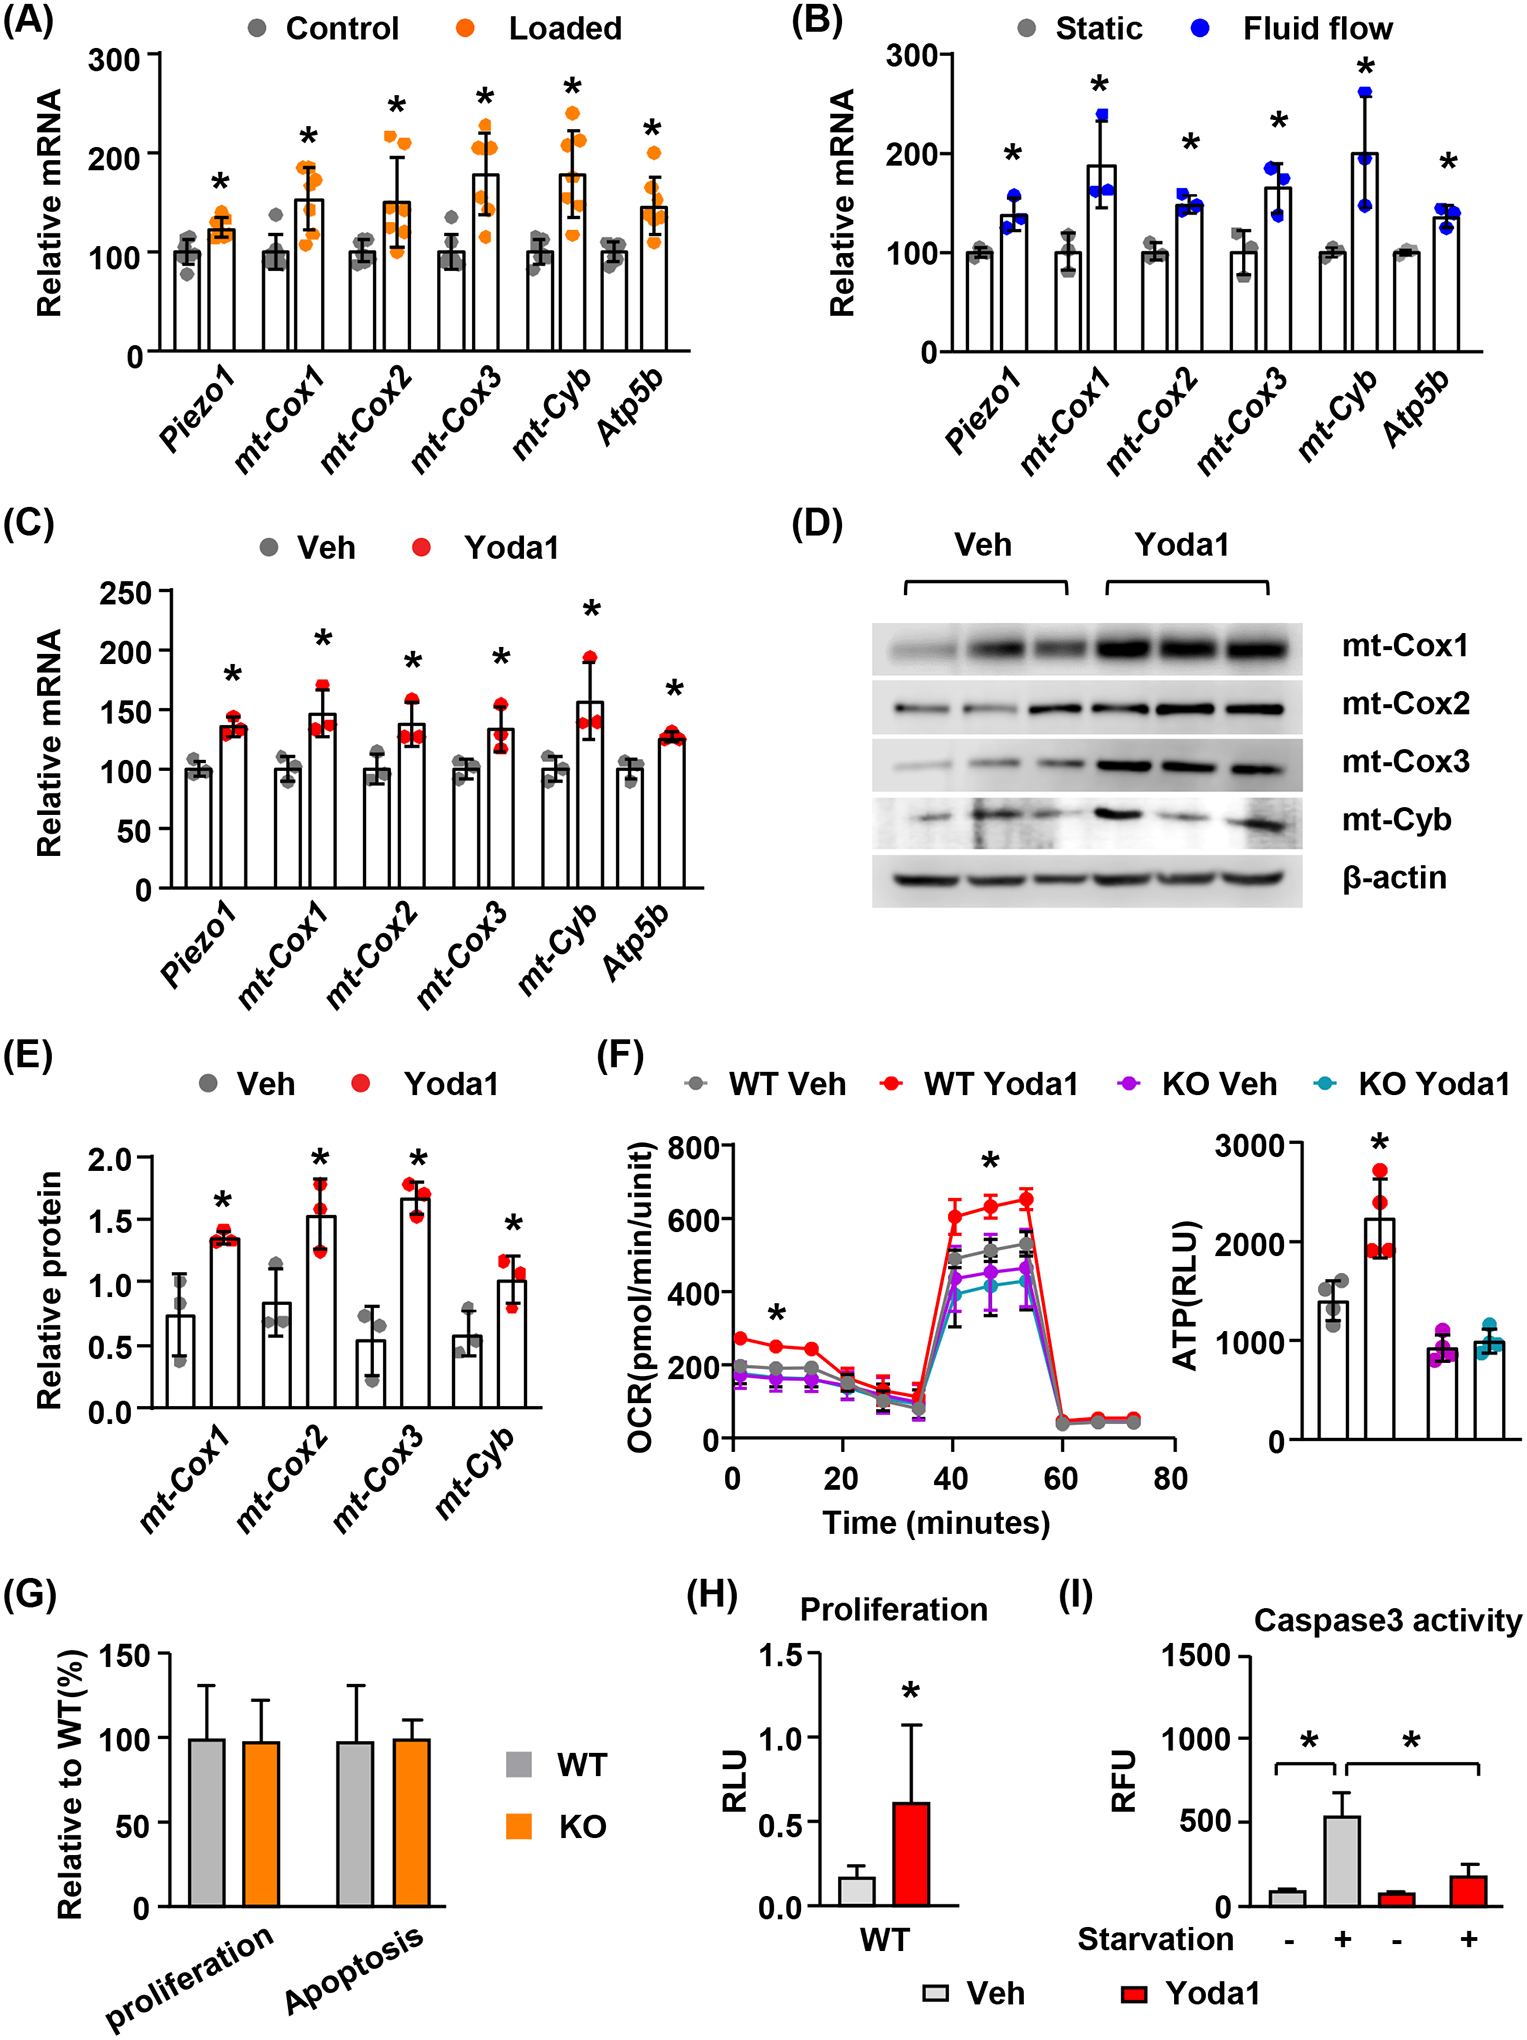
(A) mRNA levels of mitochondrial related genes in cortical bone from 4-month-old female mice loaded with one bout of compressive force (10N) and harvested 4 hours later (n = 7). Here and throughout, values are the mean ± s.d., *p < 0.05 versus control using Student’s t-test.
(B) qPCR of mitochondrial related genes in murine calvarial cells cultured under static or fluid shear stress conditions for 2 hours (n = 3). *p < 0.05 versus static using Student’s t-test.
(C) qPCR of mitochondrial related genes in murine calvarial cells treated with DMSO or 10μM Yoda1 for 2 hours (n = 3). *p < 0.05 versus Veh using Student’s t-test.
(D and E) Western blot of mitochondrial complex proteins mt-Cox1, mt-Cox2, mt-Cox3, and mt-Cyb (D) and their quantification (E) in calvarial cells treated with DMSO or 10μM Yoda1 for 6 hours. * p < 0.05 using Student’s t-test.
(F) Mitochondrial oxygen consumption rate (OCR) (left) and ATP production (right) measured in in WT or Piezo1 KO calvarial cells treated with DMSO or 10μM Yoda1 for 2 hours. * p < 0.05 using 2-way ANOVA.
(G) Proliferation and apoptosis measured in WT or Piezo1 KO calvarial cells.
(H) Proliferation measured in calvarial cells treated with DMSO or 100nM Yoda1 for 48 hours. * p < 0.05 using Student’s t-test.
(I) Caspase 3 activity measured in calvarial cells that were serum starved and treated with DMSO or 10μM Yoda1 for 4 hours. Cells cultured in complete culture medium were used as controls. * p < 0.05 using 2-way ANOVA.
3.3. Activation of Piezo1 increases mitochondrial mass.
To determine whether activation of Piezo1 by Yoda1 increases mitochondrial biogenesis, we treated calvarial cells with 10μM Yoda1 for 24 hours. We then measured mitochondrial number by mitochondrial staining using MitoGreen and quantified mitochondrial DNA content in treated cells. Quantification of mitochondrial staining showed that mitochondrial number as well as total mitochondrial area per cell was increased in Yoda1 treated calvarial cells (Figure 3A and B). In contrast, mitochondrial morphology was not affected in Yoda1 treated cells indicated by unaltered mean mitochondrial area, branch per mitochondria, branch end point per mitochondria, mean branch length, and branch junction per mitochondria (Figure 3B). Consistent with mitochondrial number, Yoda1 also increased the amount of mitochondrial DNA in calvarial cells (Fig. 3C). Importantly, gene expression analysis showed that Yoda1 promoted the expression of Tfam, a mitochondrial transcription factor that is essential for mtDNA transcription and mitochondrial biogenesis (Figure 3D). Taken together, these results demonstrate that activation of Piezo1 promotes mitochondrial biogenesis.
Figure 3. Activation of Piezo1 increases mitochondrial mass.
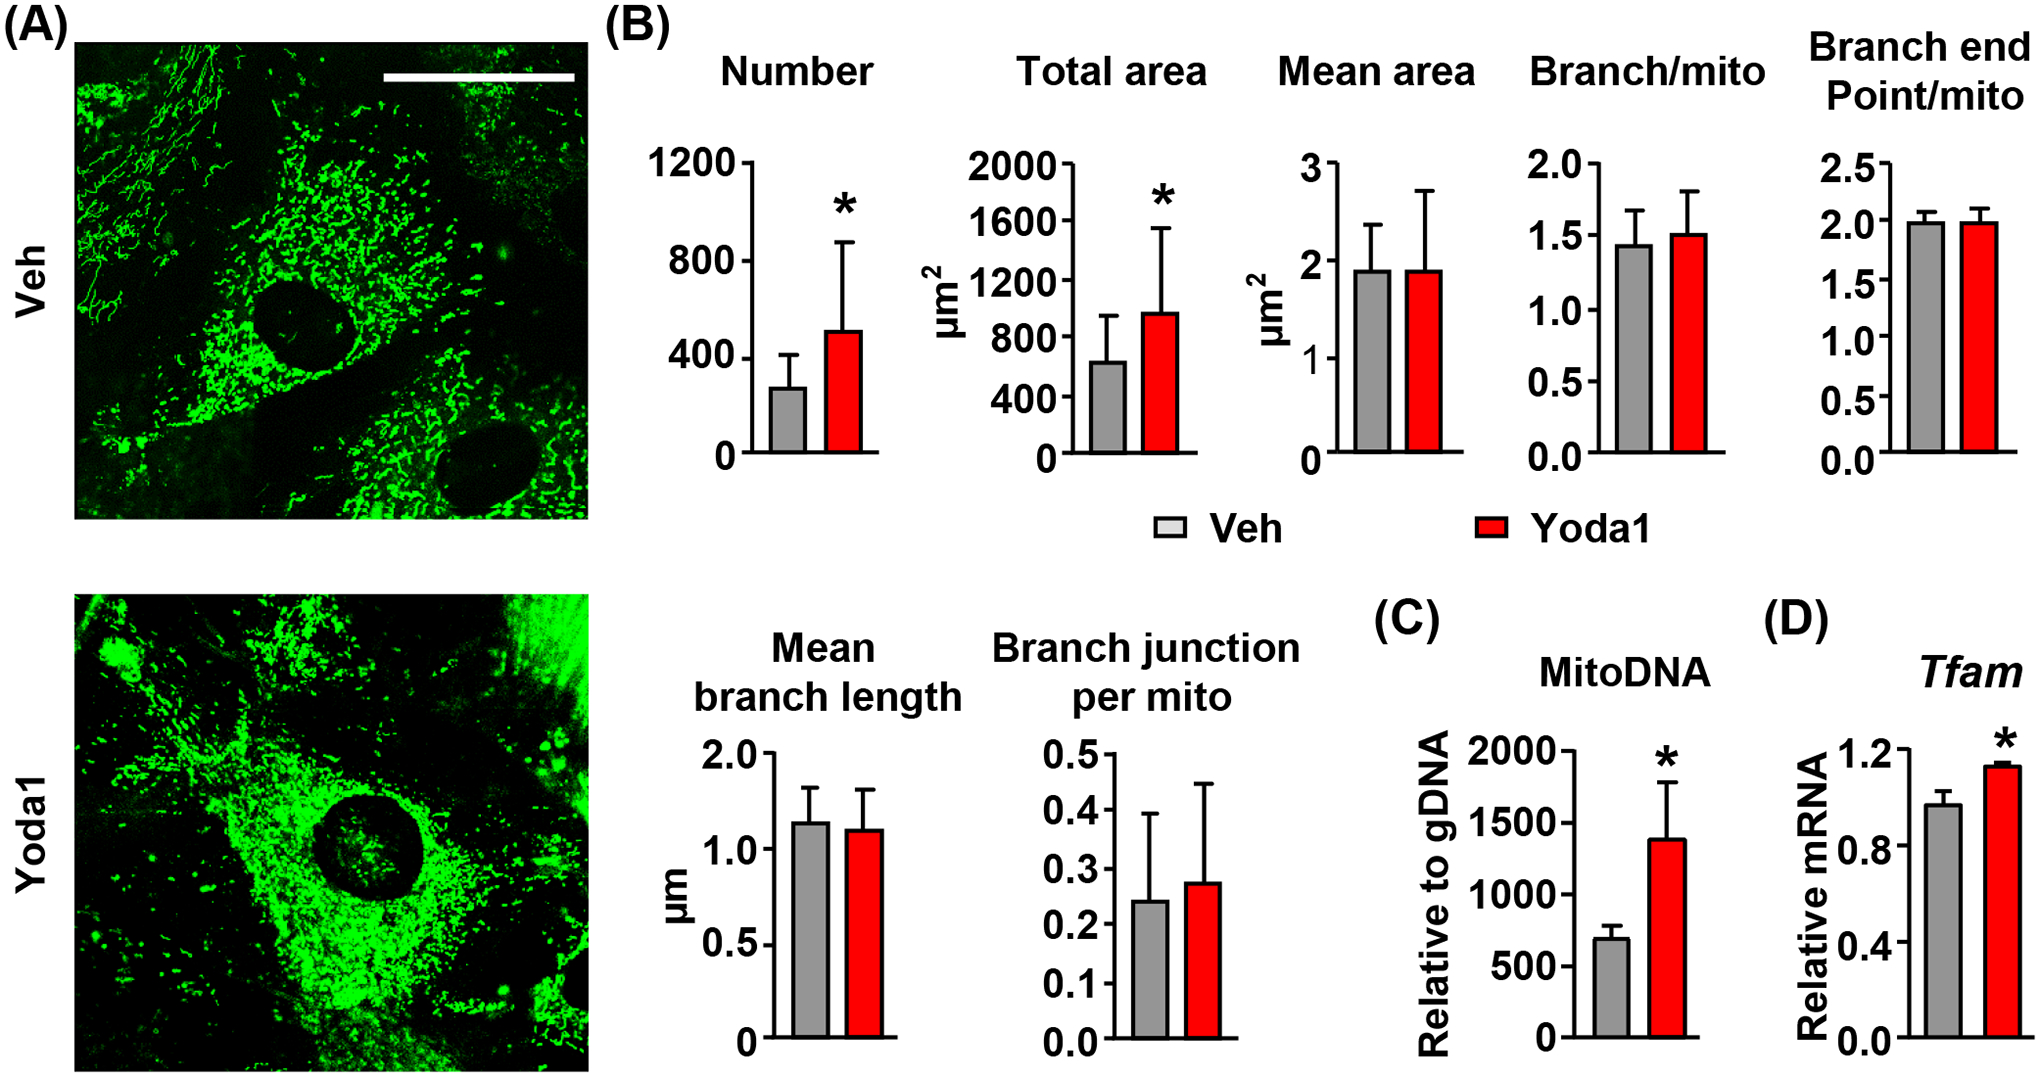
(A and B) Representative images of mitochondrial staining (A) and their quantifications (B) in calvarial cells treated with DMSO or 10μM Yoda1 for 24 hours. Scale bar = 50 μm. *p < 0.05 using Student’s t-test.
(C) qPCR quantification of mitochondrial DNA copies in calvarial cells treated with DMSO or 10μM Yoda1 for 24 hours. *p < 0.05 using Student’s t-test.
(D) qPCR of Tfam mRNA in calvarial cells treated with DMSO or 10μM Yoda1 for 2 hours. *p < 0.05 using Student’s t-test.
3.4. Mitochondrial calcium signaling is critical for mitochondrial OXPHOS induced by Piezo1 activation.
In our previous studies, we showed that activation of Piezo1 leads to a dramatic increase in cytoplasmic calcium12. Therefore, to investigate the mechanisms by which Piezo1 controls mitochondrial function, we examined whether Piezo1 activation leads to increased mitochondrial calcium concentration. We transfected calvarial cells with the mitochondrial targeted fluorescent calcium reporter CEPIA3mt and treated these cells with 10μM Yoda1. Direct measurement of calcium concentration in mitochondria by quantifying fluorescence intensity indicated that Yoda1 increased mitochondrial calcium concentration in wild type cells and this effect was blunted in cells lacking Piezo1 (Figure 4A and B). Interestingly, gene expression analysis showed that Yoda1 increased expression of Mcu and Micu1 (Figure 4C), two critical components of the mitochondrial calcium uniporter (MCU) complex, indicating a positive feedback loop. Moreover, Piezo1 knockout decreased the basal expression of these two genes and blunted their increases induced by Yoda1 (Figure 4C). To determine whether mitochondrial calcium uptake is required for the increased mitochondrial OXPHOS induced by Yoda1, we knocked down Mcu in calvarial cells using shRNA (Figure 4D) and then treated these cells with Yoda1 to measure mitochondrial OXPHOS. We found that knockdown of Mcu blunted the increase of basal OCR induced by Yoda1 in calvarial cells (Figure 4E). These results indicate that MCU-mediated calcium uptake by mitochondria matrix is essential for increased mitochondrial OXPHOS induced by Piezo1 activation. Since accumulation of calcium in mitochondrial matrix may lead to depolarization of mitochondrial membrane, we measured mitochondrial membrane potential in calvarial cells immediately after Yoda1 treatment using TMRM (Tetramethylrhodamine, Methyl Ester). FCCP, a potent uncoupler of mitochondrial OXPHOS, was used as a positive control and disrupted mitochondrial membrane potential rapidly in calvarial cells (Figure 4F). In contrast, Yoda1 increased mitochondrial membrane potential shortly after the treatment (Figure 4F). The increase was also observed in calvarial cells treated with 10μM Yoda1 for 2 hours (Figure 4G), which is consistent with our finding that Yoda1 promotes mitochondrial OCR.
FIGURE 4. Mitochondrial calcium signaling is critical for mitochondrial function induced by Piezo1 activation.
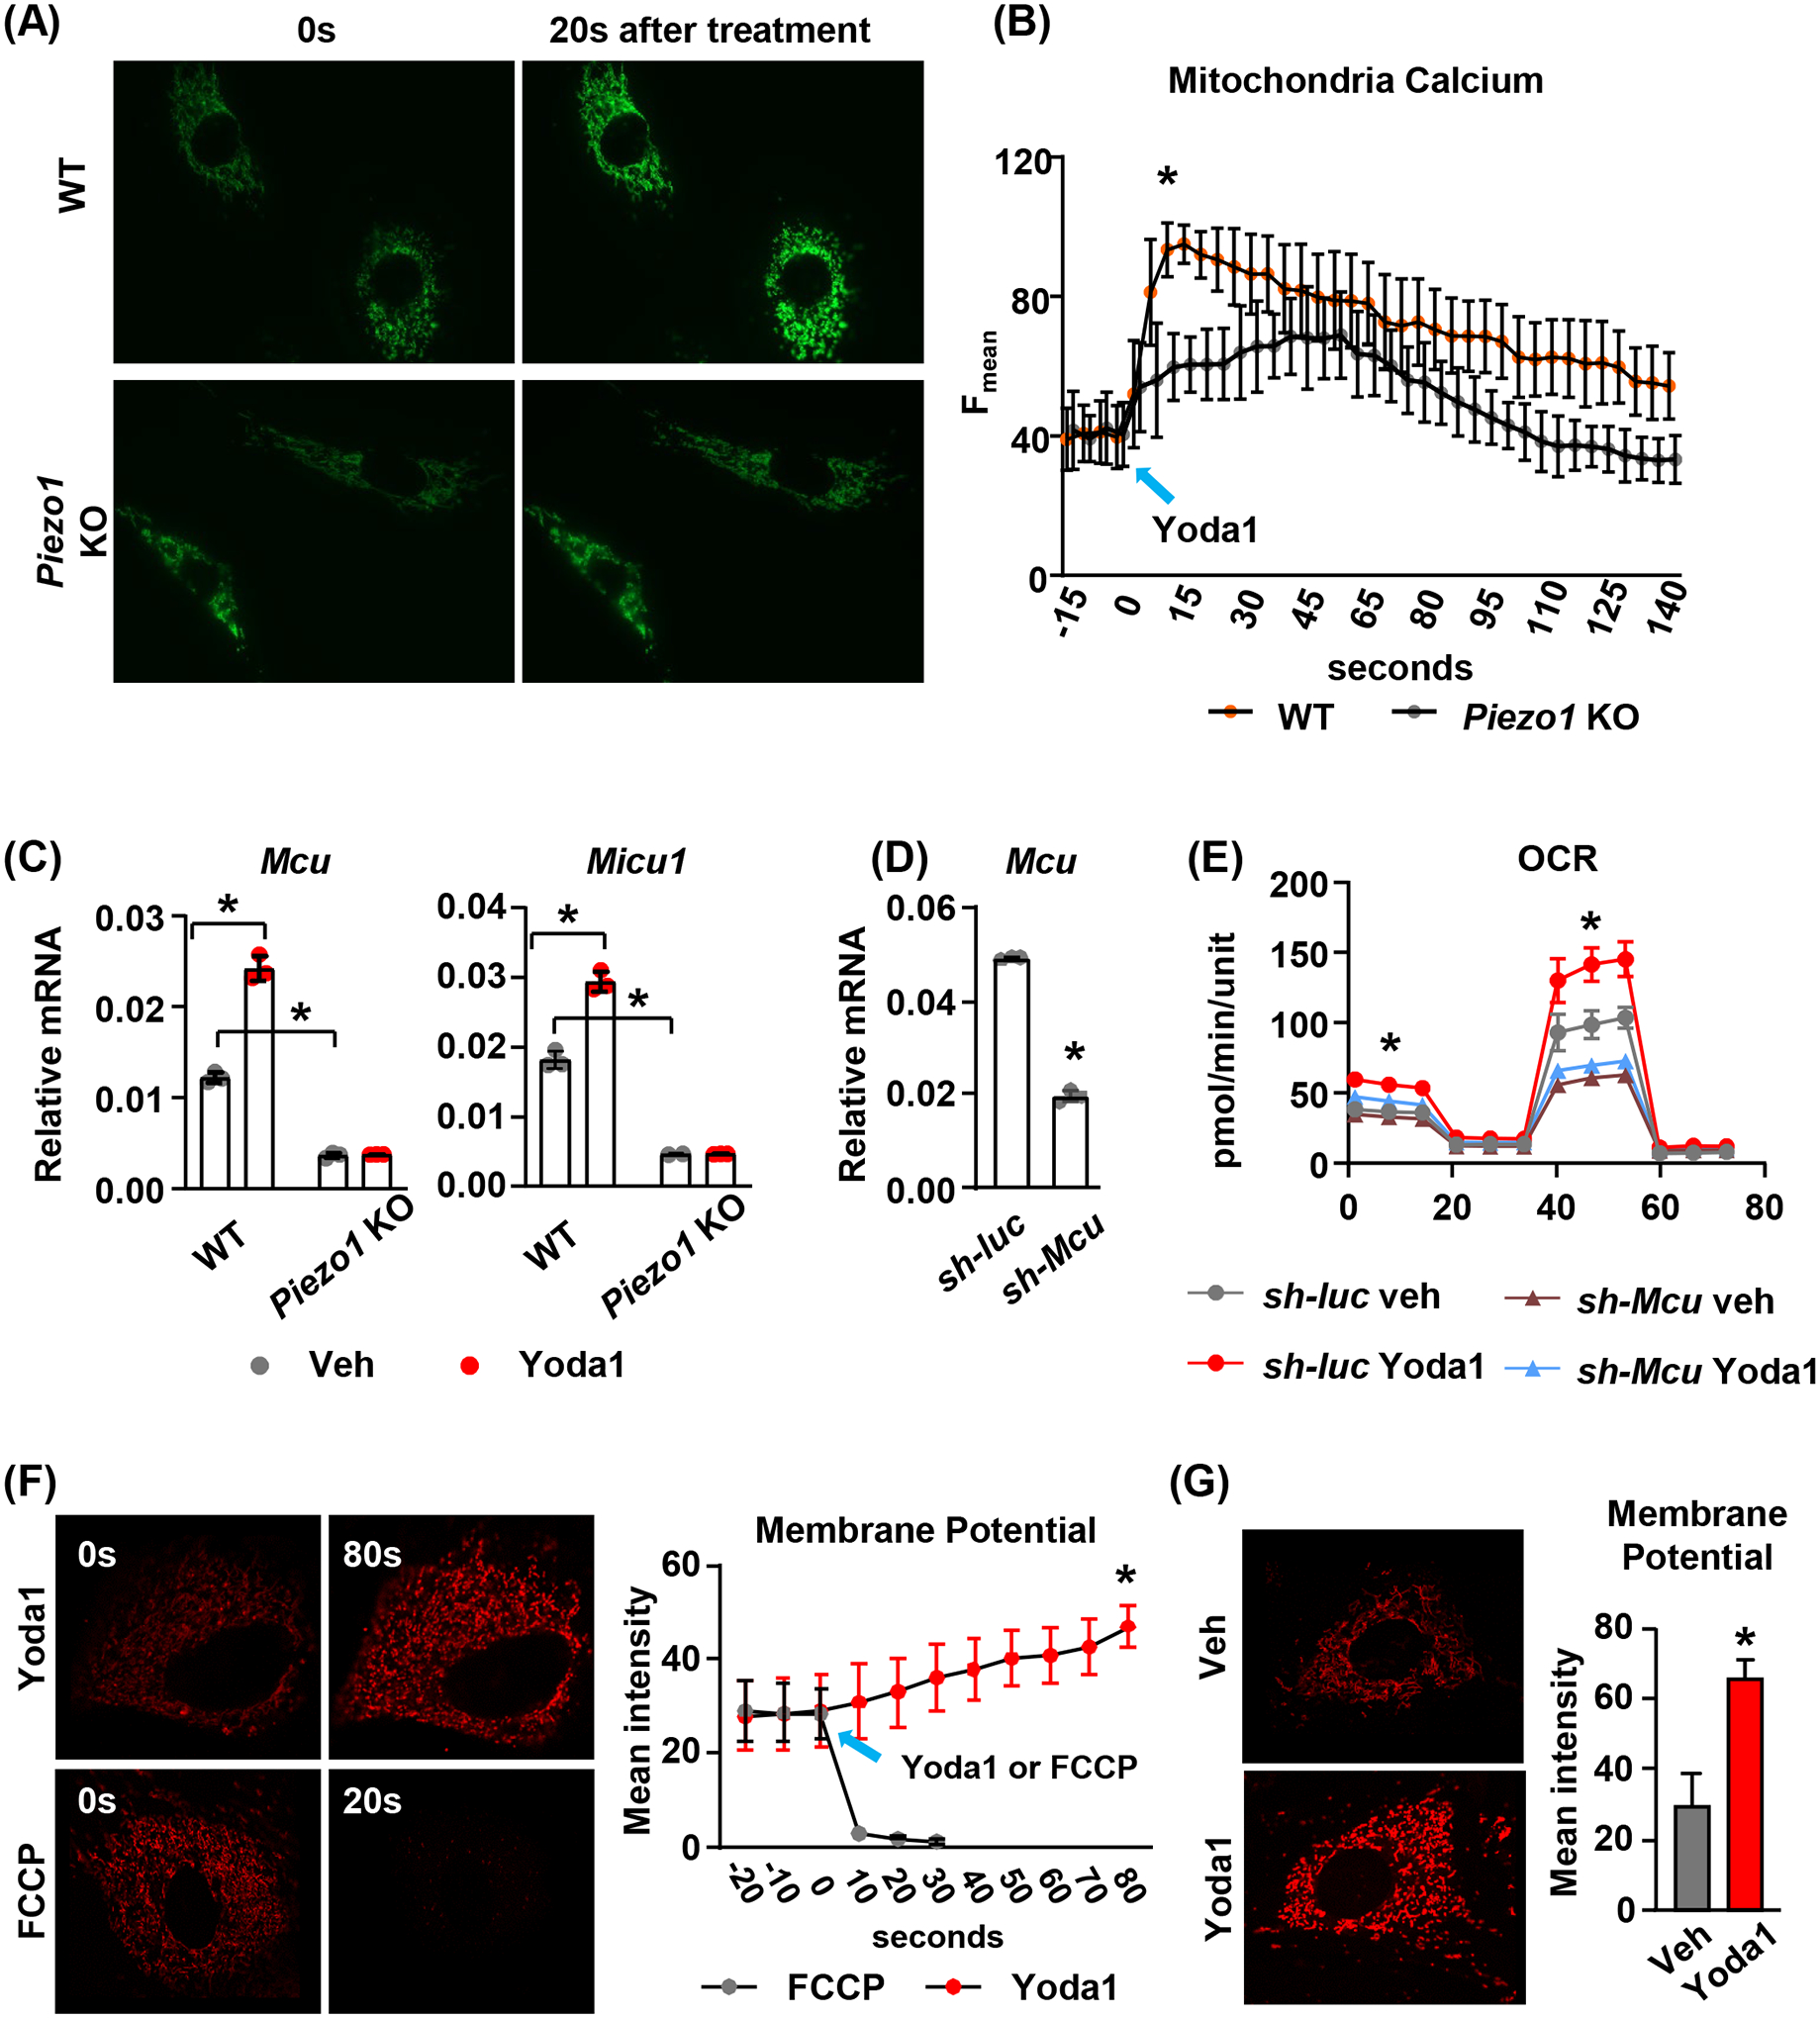
(A) Representative fluorescence images of mitochondrial calcium signals induced by Yoda1 in WT or Piezo1 KO calvarial cells expressing mitochondrial targeted fluorescent calcium reporter. Images were taken every 5 seconds after treatment for 90 seconds under 60× magnification.
(B) Quantification of mean fluorescence intensity in WT or Piezo1 KO calvarial cells described in (A).
(C) qPCR of Mcu and Micu1 mRNA in WT or Piezo1 KO calvarial cells treated with DMSO or 10μM Yoda1 for 2 hours. *p < 0.05 with the comparisons indicated by the brackets using 2-way ANOVA.
(D) qPCR of Mcu mRNA in Mcu knock-down calvarial cells. *p < 0.05 using Student’s t-test.
(E) Mitochondrial OCR measured in control or Mcu knock-down calvarial cells treated with DMSO or 10μM Yoda1 for 2 hours. *p < 0.05 using 2-way ANOVA.
(F) Representative fluorescence images of TMRM staining and the quantification of mean fluorescence intensity in mitochondria immediately before and after Yoda1 or FCCP treatment. *p < 0.05 using Student’s t-test.
(G) Representative fluorescence images of TMRM staining and their quantification in calvarial cells treated with Yoda1 or DMSO for 2 hours. *p < 0.05 using Student’s t-test.
3.5. Piezo1 induced mitochondrial OXPHOS is mediated by cAMP signaling.
To determine whether Piezo1 controls cAMP signaling, we measured expression of the genes encoding phosphodiesterase (PDE), which hydrolyzes cAMP, including Pde2a, Pde4a, Pde4b, and Pde8a. We found that deletion of Piezo1 in calvarial cells increased expression of Pde4a in Piezo1 knockout cells (Figure 5A). In addition, the intracellular cAMP concentration was reduced in Piezo1 knockout cells (Figure 5B), indicating downregulated cAMP signaling in these cells. In contrast, activation of Piezo1 by Yoda1 decreased Pde4a expression (Figure 5C) and increased cAMP production in calvarial cells (Figure 5D). Consistent with this, Yoda1 also promoted cAMP responsive element (CRE) dependent transcriptional activity indicated by a luciferase reporter assay (Figure 5E), demonstrating upregulated cAMP signaling by Piezo1 activation. Moreover, fluid shear stress also suppressed Pde4a expression in calvarial cells (Figure 5F). To determine whether cAMP is sufficient to increase mitochondrial OXPHOS, we treated calvarial cells with 1.5μM 8-Br-cAMP, a membrane-permeable cAMP derivative, and found that cAMP increased expression of mitochondrial genes including mt-cox1, mt-cox2, mt-cox3, mt-Cyb, and Atp5b (Figure 5G). Cyclic AMP was also sufficient to increase mitochondrial OCR in calvarial cells, similar to 10μM Yoda1 (Figure 5H). In addition, inhibition of PDEs by their competitive non-selective inhibitor IBMX (0.1mM) augmented the increase in OCR induced by Piezo1 activation (Figure 5H). In contrast, inhibition of cAMP production using the soluble adenylyl cyclase (sAC) inhibitor KH7 (10μM) prevented the increase in OCR induced by Piezo1 activation (Figure 5I). We next examined whether PKA, a major downstream target of cAMP, is required for stimulation of mitochondrial OXPHOS. We found that the PKA inhibitor H89 (10μM) blocked the increase in OCR induced by Piezo1 activation (Figure 5I). Taken together, these results indicate that the cAMP/PKA signaling plays a critical role in mediating Piezo1 induced mitochondrial OXPHOS.
FIGURE 5. Increased mitochondrial function is mediated by cAMP signaling.
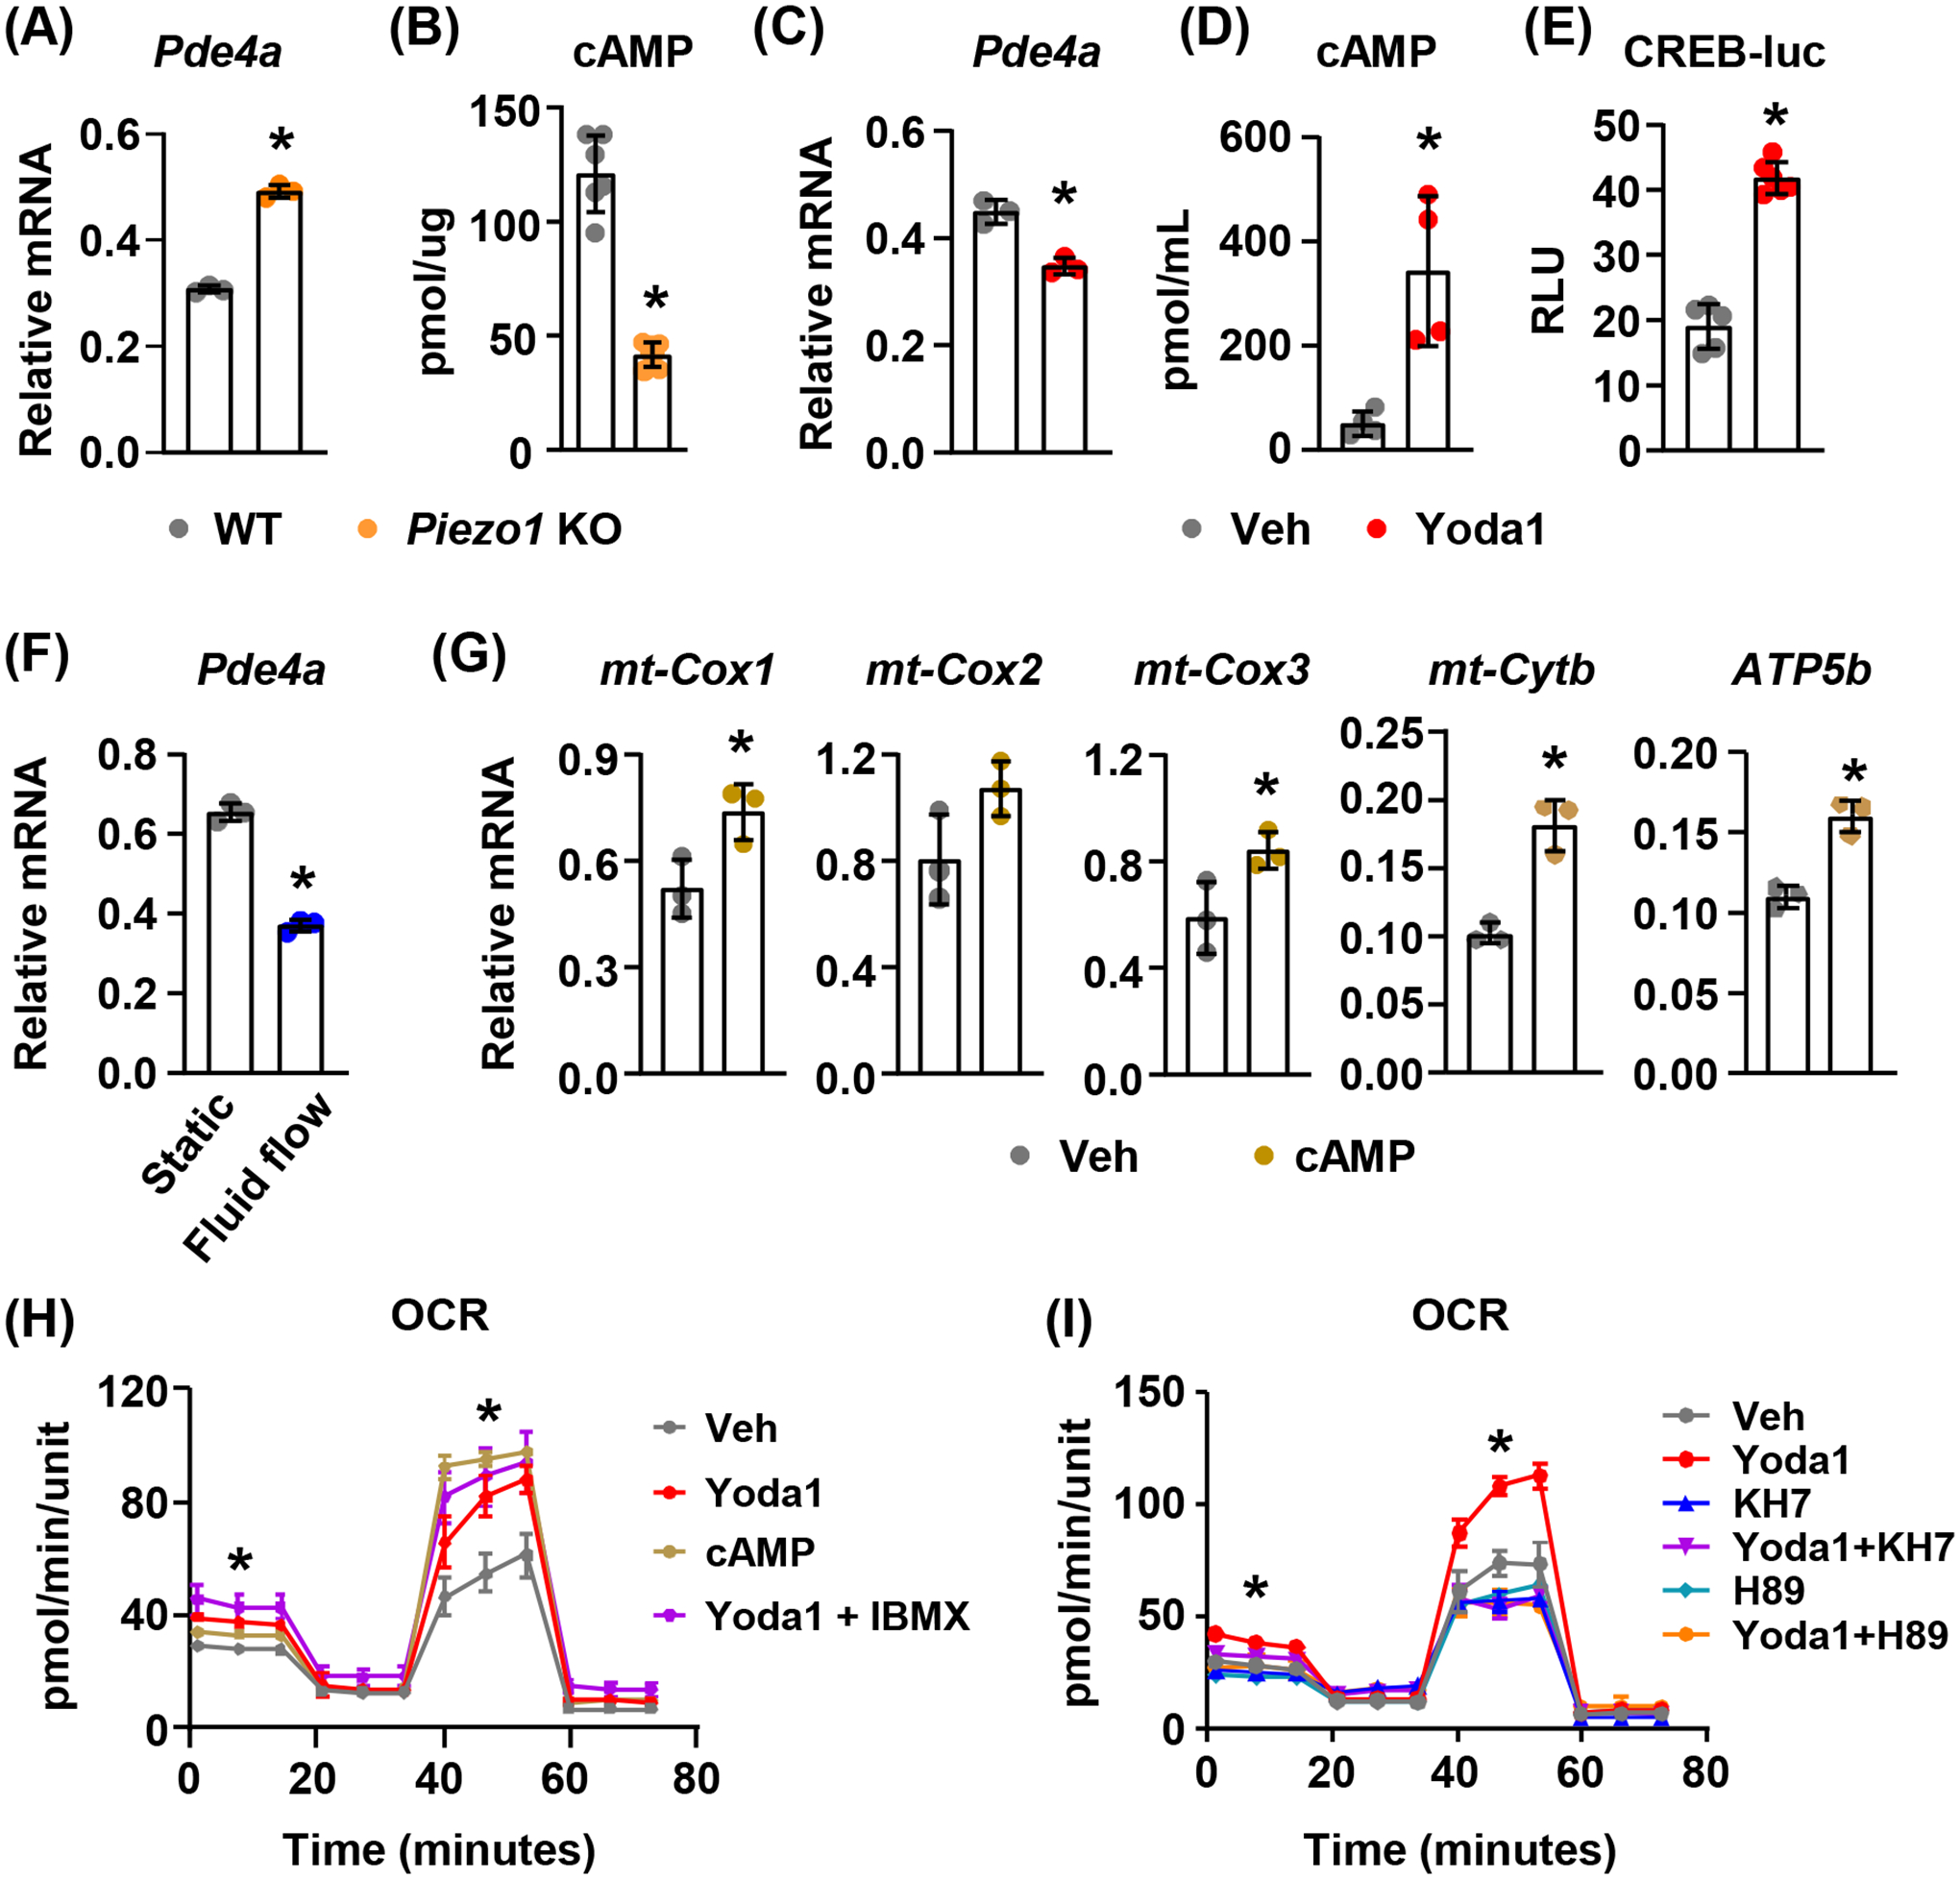
(A) qPCR of Pde4a mRNA in WT or Piezo1 KO calvarial cells. *p < 0.05 using Student’s t-test.
(B) cAMP levels in WT or Piezo1 KO calvarial cells. *p < 0.05 using Student’s t-test.
(C) qPCR of Pde4a mRNA in calvarial cells treated with DMSO or 10μM Yoda1 for 2 hours. *p < 0.05 using Student’s t-test.
(D) Cellular cAMP levels in calvarial cells treated with DMSO or 10μM Yoda1 for 6 hours. *p < 0.05 using Student’s t-test.
(E) cAMP responsive element transcriptional activity measured using dual luciferase reporter assay in MLO-Y4 cells transfected with CREB-luc. Cells were treated with DMSO or 10μM Yoda1 for 6 hours. *p < 0.05 using Student’s t-test.
(F) qPCR of Pde4a mRNA in calvarial cells cultured under 15 dynes/cm2 oscillatory fluid shear stress at 1Hz for 2 hours. *p < 0.05 using Student’s t-test.
(G) mt-Cox1, mt-Cox2, mt-Cox3, mt-Cyb, and Atp5b mRNA levels in calvarial cells treated with 1.5μM 8-Br-cAMP for 2 hours. *p < 0.05 using Student’s t-test.
(H) Mitochondrial OCR measured in calvarial cells treated with DMSO, 10μM Yoda1, 1.5μM 8-Br-cAMP, and 10μM Yoda1 in the presence of phosphodiesterase inhibitor IBMX (0.1mM) for 2 hours. *p < 0.05 using one way ANOVA.
(I) Mitochondrial OCR measured in calvarial cells treated with DMSO, 10μM Yoda1, 10μM KH7 (soluble adenylyl cyclase inhibitor), 10μM H89 (PKA inhibitor), and 10μM Yoda1 in the presence of KH7 (10μM) or H89 (10μM) for 2 hours. *p < 0.05 using 2-way ANOVA.
3.6. Activation of Piezo1 increases mitochondrial OXPHOS in other murine and human cells.
Given the broad expression pattern of the Piezo1 gene in other tissues, we examined whether Piezo1 activation in other cell types also leads to an increase in mitochondrial function. We isolated cardiomyocytes from newborn mice and treated the cells with 10μm Yoda1. Similar to what we observed in calvarial cells, activation of Yoda1 increased mitochondrial OCR and ATP production (Figure 6A). Similarly, Yoda1 stimulated the mitochondrial OCR and ATP production in human umbilical vein endothelial cells (HUVECs) (Figure 6B) and increased mitochondrial related gene expression in these cells (Figure 6C).
FIGURE 6. Activation of Piezo1 stimulates mitochondrial function in other cell types.
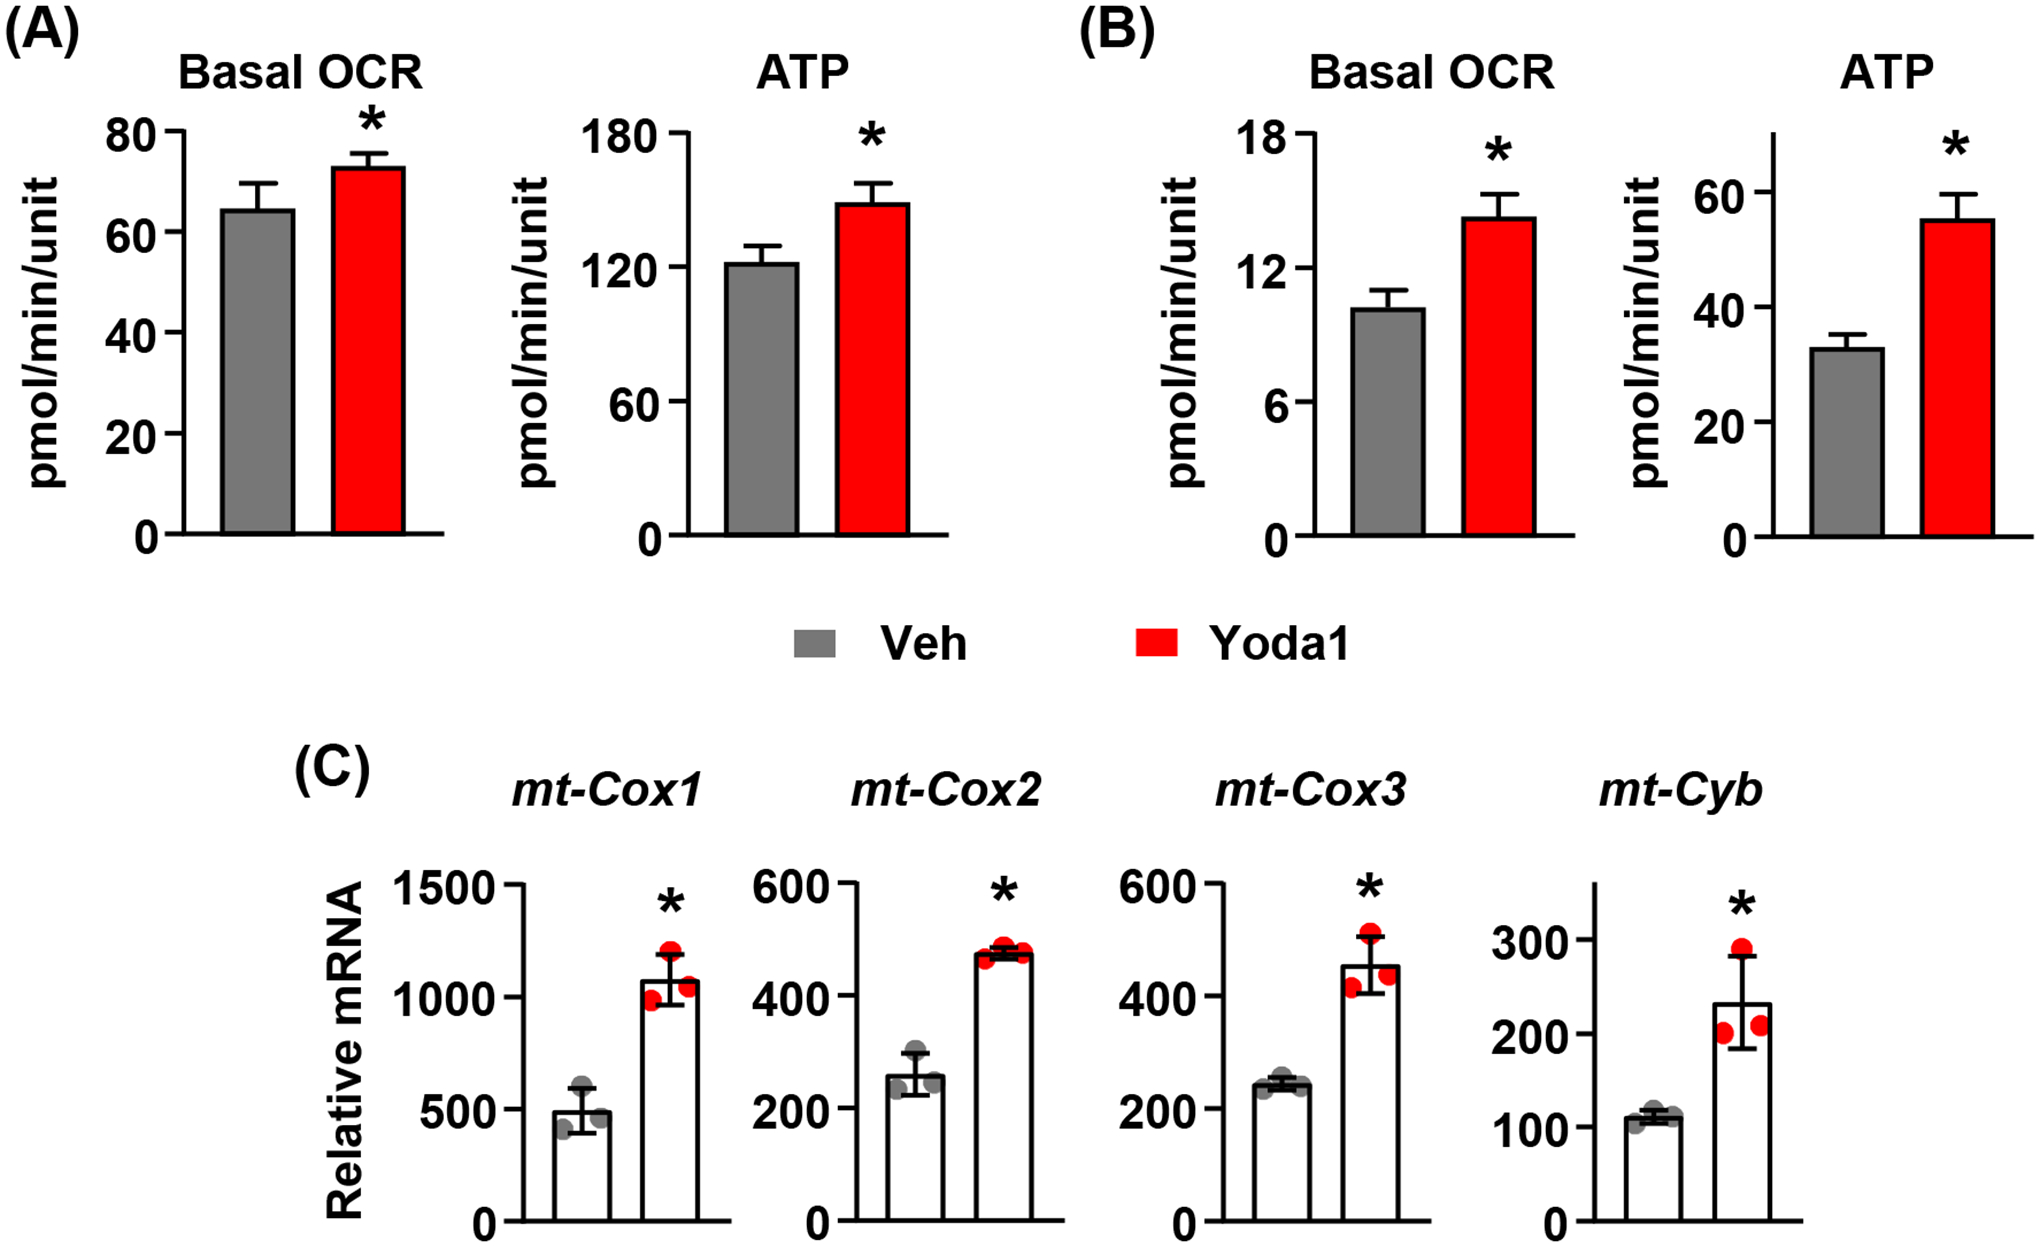
(A) Mitochondrial OCR measured under basal condition in murine cardiomyocytes treated with DMSO or 10μM Yoda1 for 2 hours. *p < 0.05 using Student’s t-test.
(B) Mitochondrial OCR measured under basal condition in HUVECs treated with DMSO or 10μM Yoda1 for 2 hours. *p < 0.05 using Student’s t-test.
(C) mt-cox1, mt-cox2, mt-cox3, and mt-Cyb mRNA levels in HUVECs treated with DMSO or 10μM Yoda1 for 2 hours. *p < 0.05 using Student’s t-test.
4. DISCUSSION
The ability of mechanical signals to regulate mitochondrial structure and promote mitochondrial function has been observed in a variety of cell types40,41. However, the molecular mechanisms underlying this process are not clear. Our results suggest that Piezo1 mediates the effects of mechanical stimulation on mitochondria. By inhibiting the production of PDEs, activation of Piezo1 increases cAMP signaling in cells and subsequently promotes mitochondrial function via its major downstream kinase PKA. In line with these, previous studies demonstrated that sAC-dependent increases in cAMP/PKA signaling in the mitochondrial matrix promotes enzyme activities in mitochondrial complexes and increases oxidative phosphorylation26. In addition, Piezo1 induced mitochondrial function requires MCU mediated calcium uptake in mitochondrial matrix. The integration of calcium signaling and cAMP/PKA pathway has been reported previously42–44. Calcium stimulates the activity of sAC to produce cAMP45. Moreover, increased calcium uptake in mitochondrial matrix raises cAMP within mitochondria and thereby promotes ATP production in rat cardiomyocytes44. This is consistent with our observation that both Mcu knock-down and sAC inhibition blunted the increase of OCR induced by Piezo1 activation. Therefore, our results suggest that Piezo1 controls calcium uptake in mitochondrial matrix via MCU and promotes mitochondrial function through cAMP signaling.
Adhesion receptors such as integrins mediate cell extracellular matrix interactions and function as mechanosensors, transducing mechanical signals to the cytoskeleton46. Recent studies show that integrins perceive matrix rigidity and stimulate mitochondrial function via the cytoskeleton in β cells11. Piezo1 has been reported to regulate focal adhesion assembly and the activation of integrin signaling in Drosophila gliomas47. Therefore, both Piezo1 and integrins contribute to mitochondrial adaptation induced by mechanical stimulation and the interaction between Piezo1 and integrin may be involved in the process. Moreover, Piezo1, as a mechanosensor, responds not only to matrix stiffness but also to membrane stretch, fluid shear stress, and static pressure48–51. Our finding that Piezo1 promotes mitochondrial function provides new insight into mechanisms that link various forms of mechanical stimuli to mitochondria.
It is well known that mechanical stimulation promotes bone formation in part by stimulating the activity of existing osteoblasts52,53. This increase in activity likely requires increased energy and protein production by osteoblasts. Consistent with this idea, deletion of Rictor, an mTOR complex 2 subunit, in mature osteoblasts blunts the anabolic response to mechanical stimuli in adult mice54, suggesting that cell metabolism is critical for the anabolic response. In previous studies, we and others showed that deletion of Piezo1 in osteoblast lineage cells decreases the bone formation rate and blunts the skeletal response to mechanical loading12,55. Multiple mechanisms have been proposed to mediate the effect of Piezo1 on bone formation, including increased Wnt signaling and Runx2 activation12,17,18. Here we demonstrated that mitochondria are also a downstream target of Piezo1 signaling. Although recent studies suggested that mitochondrial derived energy production only account for approximately 20% of total ATP in differentiated osteoblasts56, dysfunction of mitochondria has been associated with impaired osteoblast differentiation and bone formation and has been implicated in the bone loss associated with aging57–59. Given the importance of mitochondria in cell metabolism, our results suggest another potential mechanism by which Piezo1 controls osteoblast activity and further support the idea that energy production in osteoblasts is essential for the increase in bone formation stimulated by mechanical loading.
In summary, our studies demonstrate a critical role for Piezo1 in mitochondrial function in various cell types in both mice and humans. Our results suggest that Piezo1 regulates mitochondrial function via controlling calcium uptake and cAMP/PKA signaling in the mitochondrial matrix. Due to the critical role of Piezo1 and mechanical cues in development and tissue homeostasis, our findings may have a broad relevance regarding the changes in cellular energy metabolism in response to mechanical stimuli.
ACKNOWLEDGEMENTS
We thank C.A. O’Brien and Maria Almeida for valuable discussions and advice, the UAMS Digital Microscopy Core, and the staff of the UAMS Department of Laboratory Animal Medicine. This work was supported by the National Institute of Arthritis and Musculoskeletal and Skin Diseases grant R01AR076979; the National Institute of General Medical Sciences grant P20GM125503; and the UAMS Bone and Joint Initiative.
Footnotes
DISCLOSURES
The authors declare no conflicts of interest.
DATA AVAILABILITY STATEMENT
The data that support the findings of this study are available in the methods and results and are available upon request to the corresponding author.
References
- 1.Luu YK et al. Mechanical stimulation of mesenchymal stem cell proliferation and differentiation promotes osteogenesis while preventing dietary-induced obesity. J Bone Miner Res 24, 50–61, doi: 10.1359/jbmr.080817 (2009). [DOI] [PMC free article] [PubMed] [Google Scholar]
- 2.Esteves de Lima J, Bonnin MA, Birchmeier C & Duprez D Muscle contraction is required to maintain the pool of muscle progenitors via YAP and NOTCH during fetal myogenesis. Elife 5, doi: 10.7554/eLife.15593 (2016). [DOI] [PMC free article] [PubMed] [Google Scholar]
- 3.Boerckel JD, Uhrig BA, Willett NJ, Huebsch N & Guldberg RE Mechanical regulation of vascular growth and tissue regeneration in vivo. Proc Natl Acad Sci U S A 108, E674–680, doi: 10.1073/pnas.1107019108 (2011). [DOI] [PMC free article] [PubMed] [Google Scholar]
- 4.Chakraborty M et al. Mechanical Stiffness Controls Dendritic Cell Metabolism and Function. Cell Rep 34, 108609, doi: 10.1016/j.celrep.2020.108609 (2021). [DOI] [PubMed] [Google Scholar]
- 5.Martínez-Reyes I & Chandel NS Mitochondrial TCA cycle metabolites control physiology and disease. Nature Communications 11, 102, doi: 10.1038/s41467-019-13668-3 (2020). [DOI] [PMC free article] [PubMed] [Google Scholar]
- 6.van Loo G et al. The role of mitochondrial factors in apoptosis: a Russian roulette with more than one bullet. Cell Death & Differentiation 9, 1031–1042, doi: 10.1038/sj.cdd.4401088 (2002). [DOI] [PubMed] [Google Scholar]
- 7.Trevellin E et al. Exercise training induces mitochondrial biogenesis and glucose uptake in subcutaneous adipose tissue through eNOS-dependent mechanisms. Diabetes 63, 2800–2811, doi: 10.2337/db13-1234 (2014). [DOI] [PubMed] [Google Scholar]
- 8.Hawley JA, Lundby C, Cotter JD & Burke LM Maximizing Cellular Adaptation to Endurance Exercise in Skeletal Muscle. Cell Metab 27, 962–976, doi: 10.1016/j.cmet.2018.04.014 (2018). [DOI] [PubMed] [Google Scholar]
- 9.Kim B, Lee H, Kawata K & Park JY Exercise-mediated wall shear stress increases mitochondrial biogenesis in vascular endothelium. PLoS One 9, e111409, doi: 10.1371/journal.pone.0111409 (2014). [DOI] [PMC free article] [PubMed] [Google Scholar]
- 10.Hwang JH et al. TAZ links exercise to mitochondrial biogenesis via mitochondrial transcription factor A. Nat Commun 13, 653, doi: 10.1038/s41467-022-28247-2 (2022). [DOI] [PMC free article] [PubMed] [Google Scholar]
- 11.Tharp KM et al. Adhesion-mediated mechanosignaling forces mitohormesis. Cell Metab 33, 1322–1341 e1313, doi: 10.1016/j.cmet.2021.04.017 (2021). [DOI] [PMC free article] [PubMed] [Google Scholar]
- 12.Li X et al. Stimulation of Piezo1 by mechanical signals promotes bone anabolism. Elife 8, doi: 10.7554/eLife.49631 (2019). [DOI] [PMC free article] [PubMed] [Google Scholar]
- 13.Ranade SS et al. Piezo1, a mechanically activated ion channel, is required for vascular development in mice. Proc Natl Acad Sci U S A 111, 10347–10352, doi: 10.1073/pnas.1409233111 (2014). [DOI] [PMC free article] [PubMed] [Google Scholar]
- 14.Jiang F et al. The mechanosensitive Piezo1 channel mediates heart mechano-chemo transduction. Nature Communications 12, 869, doi: 10.1038/s41467-021-21178-4 (2021). [DOI] [PMC free article] [PubMed] [Google Scholar]
- 15.Li X, Kordsmeier J & Xiong J New Advances in Osteocyte Mechanotransduction. Curr Osteoporos Rep 19, 101–106, doi: 10.1007/s11914-020-00650-y (2021). [DOI] [PMC free article] [PubMed] [Google Scholar]
- 16.Coste B et al. Piezo1 and Piezo2 are essential components of distinct mechanically activated cation channels. Science 330, 55–60, doi: 10.1126/science.1193270 (2010). [DOI] [PMC free article] [PubMed] [Google Scholar]
- 17.Sun W et al. The mechanosensitive Piezo1 channel is required for bone formation. Elife 8, doi: 10.7554/eLife.47454 (2019). [DOI] [PMC free article] [PubMed] [Google Scholar]
- 18.Zhou T et al. Piezo1/2 mediate mechanotransduction essential for bone formation through concerted activation of NFAT-YAP1-ss-catenin. Elife 9, doi: 10.7554/eLife.52779 (2020). [DOI] [PMC free article] [PubMed] [Google Scholar]
- 19.Li J et al. Piezo1 integration of vascular architecture with physiological force. Nature 515, 279–282, doi: 10.1038/nature13701 (2014). [DOI] [PMC free article] [PubMed] [Google Scholar]
- 20.Retailleau K et al. Piezo1 in Smooth Muscle Cells Is Involved in Hypertension-Dependent Arterial Remodeling. Cell Rep 13, 1161–1171, doi: 10.1016/j.celrep.2015.09.072 (2015). [DOI] [PubMed] [Google Scholar]
- 21.Cahalan SM et al. Piezo1 links mechanical forces to red blood cell volume. Elife 4, doi: 10.7554/eLife.07370 [doi] (2015). [DOI] [PMC free article] [PubMed] [Google Scholar]
- 22.Liu CSC et al. Cutting Edge: Piezo1 Mechanosensors Optimize Human T Cell Activation. J Immunol 200, 1255–1260, doi: 10.4049/jimmunol.1701118 (2018). [DOI] [PubMed] [Google Scholar]
- 23.Rizzuto R, De Stefani D, Raffaello A & Mammucari C Mitochondria as sensors and regulators of calcium signalling. Nature Reviews Molecular Cell Biology 13, 566–578, doi: 10.1038/nrm3412 (2012). [DOI] [PubMed] [Google Scholar]
- 24.Giorgi C, Marchi S & Pinton P The machineries, regulation and cellular functions of mitochondrial calcium. Nature Reviews Molecular Cell Biology 19, 713–730, doi: 10.1038/s41580-018-0052-8 (2018). [DOI] [PubMed] [Google Scholar]
- 25.Wescott AP, Kao JPY, Lederer WJ & Boyman L Voltage-energized calcium-sensitive ATP production by mitochondria. Nature Metabolism 1, 975–984, doi: 10.1038/s42255-019-0126-8 (2019). [DOI] [PMC free article] [PubMed] [Google Scholar]
- 26.Acin-Perez R et al. Cyclic AMP produced inside mitochondria regulates oxidative phosphorylation. Cell Metab 9, 265–276, doi: 10.1016/j.cmet.2009.01.012 (2009). [DOI] [PMC free article] [PubMed] [Google Scholar]
- 27.De Rasmo D et al. Intramitochondrial adenylyl cyclase controls the turnover of nuclear-encoded subunits and activity of mammalian complex I of the respiratory chain. Biochim Biophys Acta 1853, 183–191, doi: 10.1016/j.bbamcr.2014.10.016 (2015). [DOI] [PubMed] [Google Scholar]
- 28.De Rasmo D et al. cAMP regulates the functional activity, coupling efficiency and structural organization of mammalian FOF1 ATP synthase. Biochim Biophys Acta 1857, 350–358, doi: 10.1016/j.bbabio.2016.01.006 (2016). [DOI] [PubMed] [Google Scholar]
- 29.Kim HN et al. Osteocyte RANKL is required for cortical bone loss with age and is induced by senescence. JCI Insight 5, doi: 10.1172/jci.insight.138815 (2020). [DOI] [PMC free article] [PubMed] [Google Scholar]
- 30.Nookaew I et al. A comprehensive comparison of RNA-Seq-based transcriptome analysis from reads to differential gene expression and cross-comparison with microarrays: a case study in Saccharomyces cerevisiae. Nucleic Acids Res 40, 10084–10097, doi:gks804 [pii]; 10.1093/nar/gks804 [doi] (2012). [DOI] [PMC free article] [PubMed] [Google Scholar]
- 31.Cox MP, Peterson DA & Biggs PJ SolexaQA: At-a-glance quality assessment of Illumina second-generation sequencing data. BMC. Bioinformatics 11, 485, doi:1471–2105-11–485 [pii]; 10.1186/1471-2105-11-485 [doi] (2010). [DOI] [PMC free article] [PubMed] [Google Scholar]
- 32.Li H & Durbin R Fast and accurate short read alignment with Burrows-Wheeler transform. Bioinformatics 25, 1754–1760, doi:btp324 [pii]; 10.1093/bioinformatics/btp324 [doi] (2009). [DOI] [PMC free article] [PubMed] [Google Scholar]
- 33.Love MI, Huber W & Anders S Moderated estimation of fold change and dispersion forRNA-seq data with DESeq2. Genome Biol 15, 550, doi:s13059–014-0550–8 [pii]; 10.1186/s13059-014-0550-8 [doi] (2014). [DOI] [PMC free article] [PubMed] [Google Scholar]
- 34.Varemo L, Nielsen J & Nookaew I Enriching the gene set analysis of genome-wide data by incorporating directionality of gene expression and combining statistical hypotheses and methods. Nucleic Acids Res 41, 4378–4391, doi:gkt111 [pii]; 10.1093/nar/gkt111 [doi] (2013). [DOI] [PMC free article] [PubMed] [Google Scholar]
- 35.Livak KJ & Schmittgen TD Analysis of relative gene expression data using real-time quantitative PCR and the 2(-Delta Delta C(T)) Method. methods 25, 402–408 (2001). [DOI] [PubMed] [Google Scholar]
- 36.Onal M et al. Suppression of autophagy in osteocytes mimics skeletal aging. J Biol Chem 288, 17432–17440, doi: 10.1074/jbc.M112.444190 (2013). [DOI] [PMC free article] [PubMed] [Google Scholar]
- 37.Chaudhry A, Shi R & Luciani DS A pipeline for multidimensional confocal analysis of mitochondrial morphology, function, and dynamics in pancreatic beta-cells. Am J Physiol Endocrinol Metab 318, E87–E101, doi: 10.1152/ajpendo.00457.2019 (2020). [DOI] [PMC free article] [PubMed] [Google Scholar]
- 38.Suzuki J et al. Imaging intraorganellar Ca2+ at subcellular resolution using CEPIA. Nat Commun 5, 4153, doi: 10.1038/ncomms5153 (2014). [DOI] [PMC free article] [PubMed] [Google Scholar]
- 39.Syeda R et al. Chemical activation of the mechanotransduction channel Piezo1. Elife 4, doi: 10.7554/eLife.07369 [doi] (2015). [DOI] [PMC free article] [PubMed] [Google Scholar]
- 40.Bartolak-Suki E et al. Fluctuation-driven mechanotransduction regulates mitochondrial-network structure and function. Nat Mater 14, 1049–1057, doi: 10.1038/nmat4358 (2015). [DOI] [PubMed] [Google Scholar]
- 41.Helle SCJ et al. Mechanical force induces mitochondrial fission. Elife 6, doi: 10.7554/eLife.30292 (2017). [DOI] [PMC free article] [PubMed] [Google Scholar]
- 42.Halls ML & Cooper DM Regulation by Ca2+-signaling pathways of adenylyl cyclases. Cold Spring Harb Perspect Biol 3, a004143, doi: 10.1101/cshperspect.a004143 (2011). [DOI] [PMC free article] [PubMed] [Google Scholar]
- 43.Forbes EM, Thompson AW, Yuan J & Goodhill GJ Calcium and cAMP levels interact to determine attraction versus repulsion in axon guidance. Neuron 74, 490–503, doi: 10.1016/j.neuron.2012.02.035 (2012). [DOI] [PubMed] [Google Scholar]
- 44.Di Benedetto G, Scalzotto E, Mongillo M & Pozzan T Mitochondrial Ca(2)(+) uptake induces cyclic AMP generation in the matrix and modulates organelle ATP levels. Cell Metab 17, 965–975, doi: 10.1016/j.cmet.2013.05.003 (2013). [DOI] [PubMed] [Google Scholar]
- 45.Jaiswal BS & Conti M Calcium regulation of the soluble adenylyl cyclase expressed inmammalian spermatozoa. Proc Natl Acad Sci U S A 100, 10676–10681, doi: 10.1073/pnas.1831008100 (2003). [DOI] [PMC free article] [PubMed] [Google Scholar]
- 46.Sun Z, Guo SS & Fassler R Integrin-mediated mechanotransduction. J Cell Biol 215, 445–456, doi: 10.1083/jcb.201609037 (2016). [DOI] [PMC free article] [PubMed] [Google Scholar]
- 47.Chen X et al. A Feedforward Mechanism Mediated by Mechanosensitive Ion Channel PIEZO1 and Tissue Mechanics Promotes Glioma Aggression. Neuron 100, 799–815 e797, doi: 10.1016/j.neuron.2018.09.046 (2018). [DOI] [PubMed] [Google Scholar]
- 48.Atcha H et al. Mechanically activated ion channel Piezo1 modulates macrophage polarization and stiffness sensing. Nature Communications 12, 3256, doi: 10.1038/s41467-021-23482-5 (2021). [DOI] [PMC free article] [PubMed] [Google Scholar]
- 49.Li J et al. Piezo1 integration of vascular architecture with physiological force. Nature 515, 279–282, doi: 10.1038/nature13701 [doi] (2014). [DOI] [PMC free article] [PubMed] [Google Scholar]
- 50.Gudipaty SA et al. Mechanical stretch triggers rapid epithelial cell division through Piezo1. Nature 543, 118–121, doi:nature21407 [pii]; 10.1038/nature21407 [doi] (2017). [DOI] [PMC free article] [PubMed] [Google Scholar]
- 51.Miyamoto T et al. Functional role for Piezo1 in stretch-evoked Ca(2)(+) influx and ATP release in urothelial cell cultures. J. Biol. Chem 289, 16565–16575, doi:M113.528638 [pii]; 10.1074/jbc.M113.528638 [doi] (2014). [DOI] [PMC free article] [PubMed] [Google Scholar]
- 52.Boppart MD, Kimmel DB, Yee JA & Cullen DM Time course of osteoblast appearance after in vivo mechanical loading. Bone 23, 409–415, doi: 10.1016/s8756-3282(98)00119-7 (1998). [DOI] [PubMed] [Google Scholar]
- 53.Zannit HM & Silva MJ Proliferation and Activation of Osterix-Lineage Cells Contribute to Loading-Induced Periosteal Bone Formation in Mice. JBMR Plus 3, e10227, doi: 10.1002/jbm4.10227 (2019). [DOI] [PMC free article] [PubMed] [Google Scholar]
- 54.Lewis KJ et al. The mTORC2 component Rictor is required for load-induced bone formation in late-stage skeletal cells. JBMR Plus 10.1002/jbm4.10366 (2020). [DOI] [PMC free article] [PubMed] [Google Scholar]
- 55.Hendrickx G et al. Piezo1 Inactivation in Chondrocytes Impairs Trabecular Bone Formation. J Bone Miner Res 36, 369–384, doi: 10.1002/jbmr.4198 (2021). [DOI] [PubMed] [Google Scholar]
- 56.Lee W-C, Ji X, Nissim I & Long F Malic Enzyme Couples Mitochondria with Aerobic Glycolysis in Osteoblasts. Cell Reports 32, 108108, doi: 10.1016/j.celrep.2020.108108 (2020). [DOI] [PMC free article] [PubMed] [Google Scholar]
- 57.Gao J et al. SIRT3/SOD2 maintains osteoblast differentiation and bone formation by regulating mitochondrial stress. Cell Death Differ 25, 229–240, doi: 10.1038/cdd.2017.144 (2018). [DOI] [PMC free article] [PubMed] [Google Scholar]
- 58.Dobson PF et al. Mitochondrial dysfunction impairs osteogenesis, increases osteoclast activity, and accelerates age related bone loss. Scientific Reports 10, 11643, doi: 10.1038/s41598-020-68566-2 (2020). [DOI] [PMC free article] [PubMed] [Google Scholar]
- 59.Almeida M et al. Skeletal involution by age-associated oxidative stress and its acceleration by loss of sex steroids. J Biol Chem 282, 27285–27297, doi: 10.1074/jbc.M702810200 (2007). [DOI] [PMC free article] [PubMed] [Google Scholar]
Associated Data
This section collects any data citations, data availability statements, or supplementary materials included in this article.
Data Availability Statement
The data that support the findings of this study are available in the methods and results and are available upon request to the corresponding author.