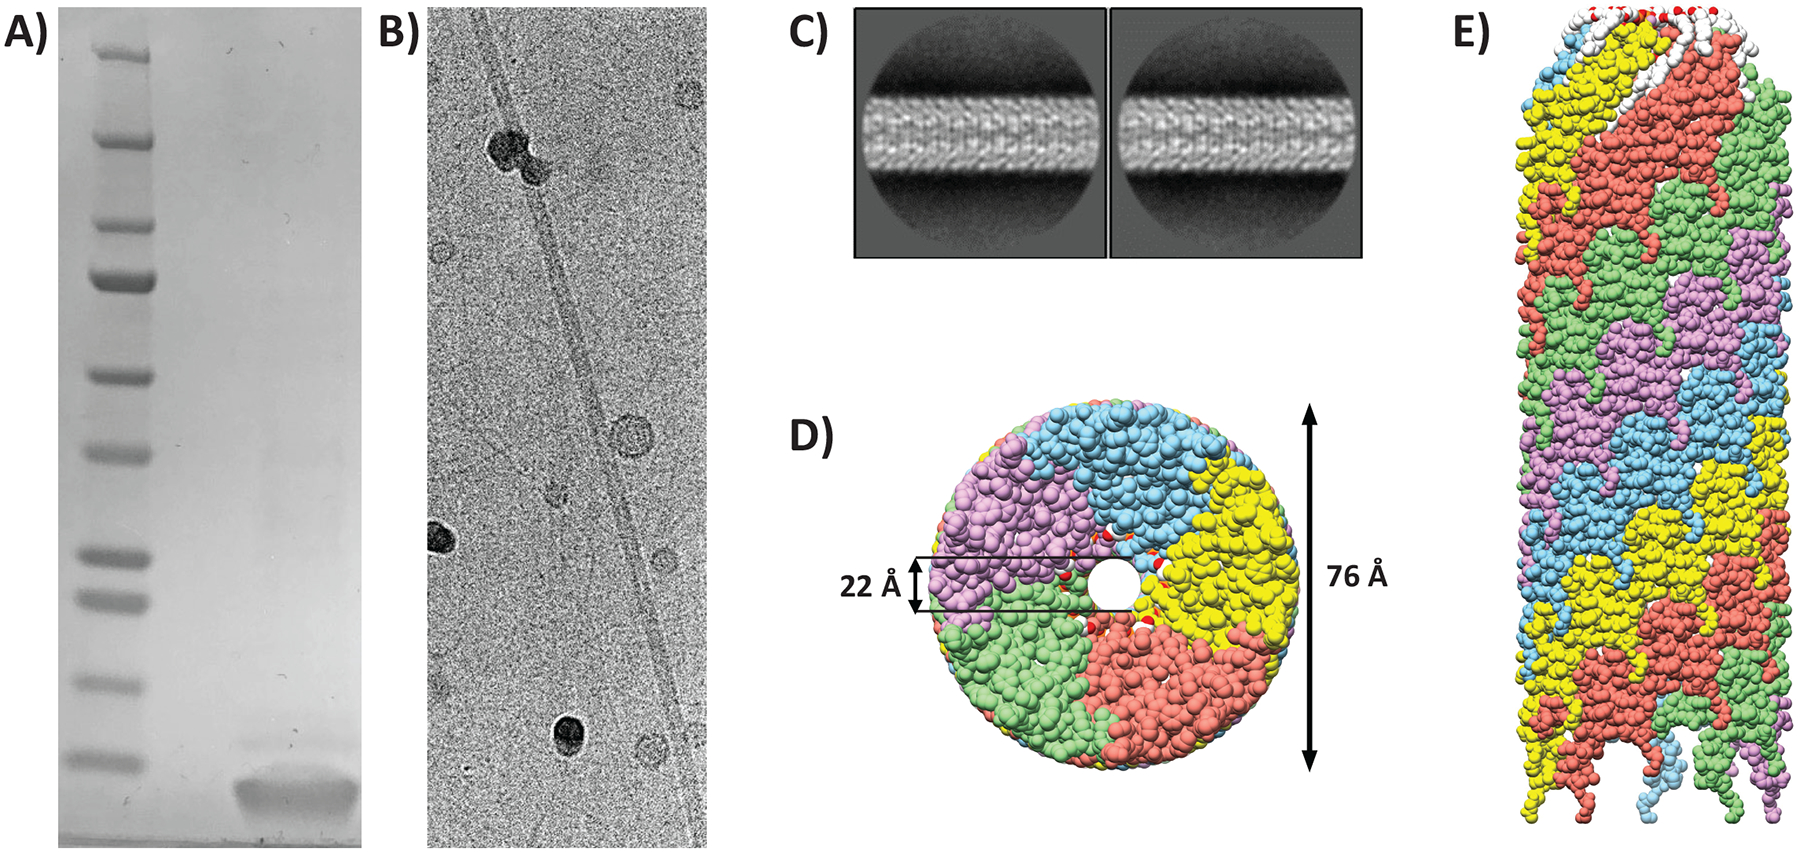
Figure 1. Structure determination of the T-pilus.

(A) SDS-PAGE of purified VirB2 protein stained with Coomassie (lane 2). Mature VirB2 has a predicted MW of 7.2 kDa. Precision plus molecular weight marker was used (lane 1). (B) Cryo-electron micrograph of intact purified T-pilus (C) Representative 2D-class averages from Relion with a 300 pixel box size. (D) Bottom view of the filament model; coloured by individual VirB2 molecules. (E) Side-view of the filament. The filament is built up by five parallel helices, each of these have a unique colour. The top of the represented filament is towards the tip (as determined before52).
