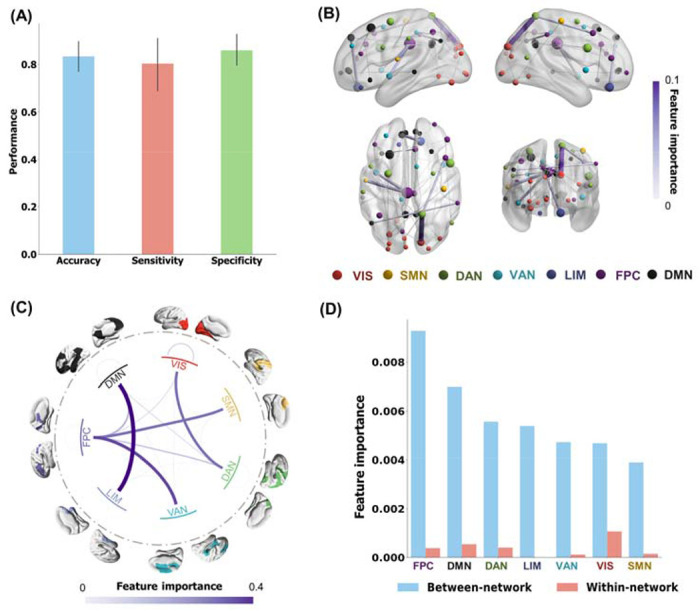
Figure 1. FC phenotype of CUD patients versus healthy controls.

(A) Classification performance across 10-fold cross-validations: the accuracy, sensitivity, and specificity of the FC-based XGBoost model are 0.83 ± 0.10, 0.80 ± 0.18, and 0.85 ± 0.10, respectively. (B) Visualization of the 40 most discriminative FC features as identified by the XGBoost model, by calculating frequency of the features appearing in all the trees of the model. Node size indicated the node strength calculated from the sum of the linked FC importance. (C) Network-level discriminative pattern obtained by grouping FC importance based on Yeo’s 7 networks. (D) Averaged between-network and within-network FC strengths. The between-network FC strength was calculated by averaging the importance of discriminative connections across each network and all other networks. VIS, visual network; SMN, somatomotor network; DAN, dorsal attention network; VAN, ventral attention network; LIM, limbic network; FPC, frontoparietal control network; DMN, default mode network.
