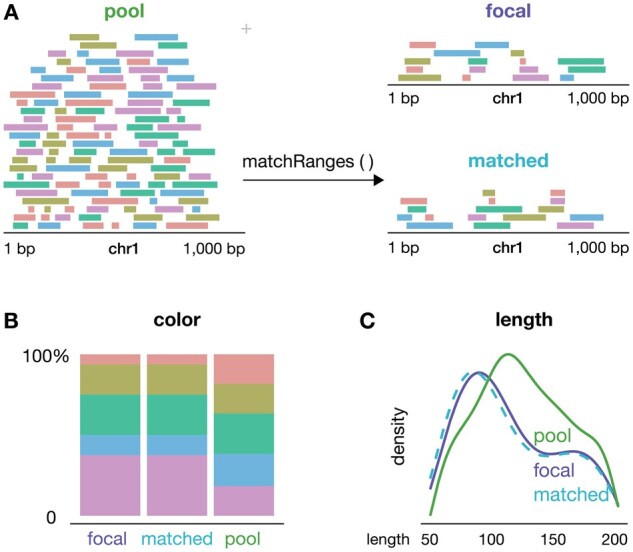
Figure 1.

matchRanges workflow. (A) A schematic demonstrating how the matchRanges function can be used to select a set of GRanges matched for covariate features of color and length. (B and C) Example visualization of covariate distributions for assessing matching quality and covariate balance. Figure generated with the plotgardener R/Bioconductor package (Kramer et al. 2022).
