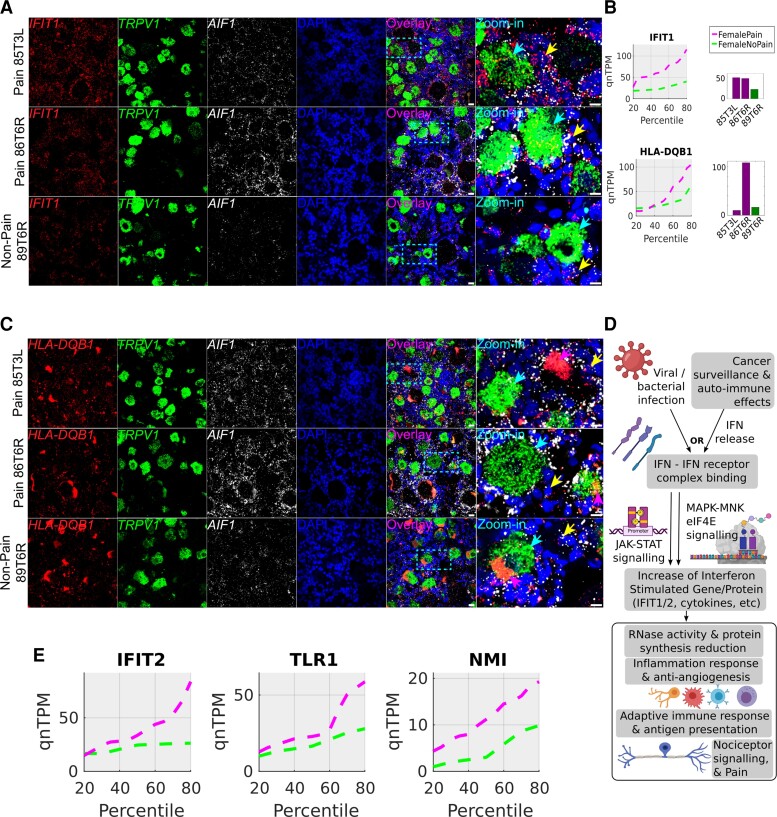
Figure 7.
RNAscope for female pain-associated genes IFIT1 and HLA-DQB1. (A) RNAscope IFIT1 expression (red) overlaid with TRPV1 expression (green), AIF1 (white) and DAPI (blue) in pseudocolour. (B) IFIT1 and HLA-DQB1 quantile plots show the shift in abundance between female pain and non-pain subcohorts, while the bar plots show the RNA-seq abundance for the patient DRGs that were queried by RNAscope assay. (C) RNAscope HLA-DQB1 expression (red) overlaid with TRPV1 expression (green), AIF1 (white) and DAPI (blue) in pseudocolour. (D) Schema showing how interferons are typically activated and drive a signalling programme, based on existing literature (icons from BioRender). (E) Quantile plots in the female cohort for other IFIT1-correlated interferon signalling pathway genes—IFIT2, TLR1, NMI—show increase in gene abundance in pain. Scale bar = 20 μm, large globular structures are considered to be lipofuscin. Yellow arrows point out cells with overlap of expression between the gene of interest (red) and AIF1 (white), cyan arrows point out overlap of expression between the gene of interest (red) and TRPV1 (green), respectively, in the zoomed in images, and pink arrows point to lipofuscin (A and C). In all micrographs, wide field views and zoomed-in views on single neurons and surrounding cells are shown to display overall signal distribution, and colocalization of signal with specific neuronal and macrophage cell markers for each RNAscope probe.

