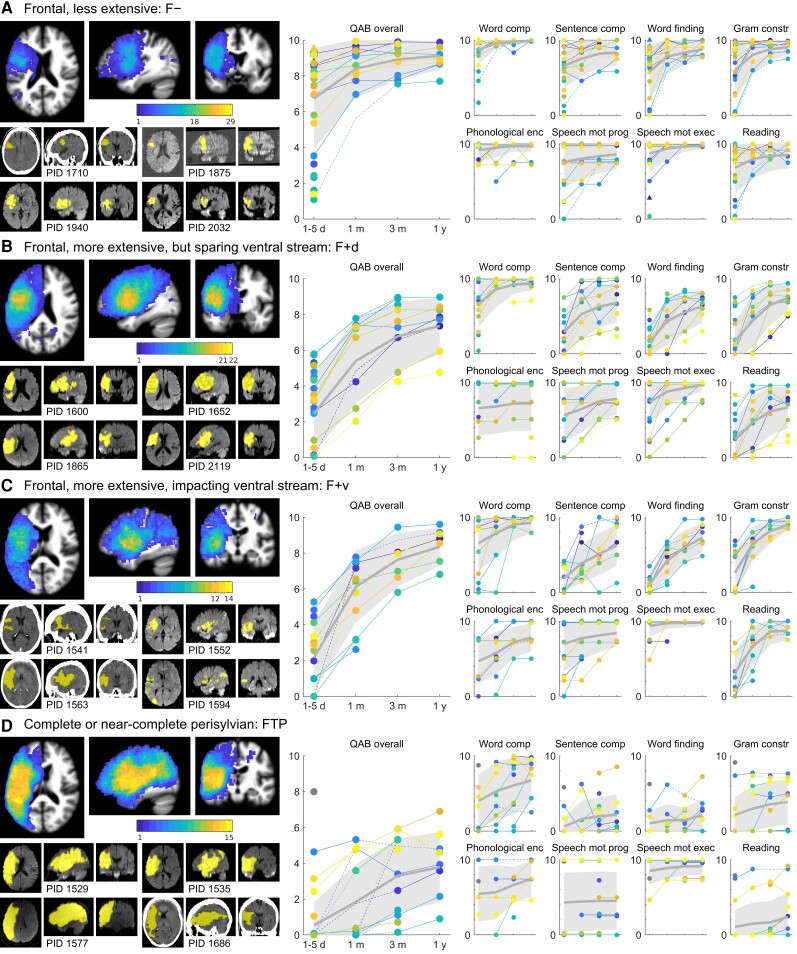
Figure 2.
Trajectories of recovery for patients with frontal lobe damage. (A) F− group patients (n = 29). Left: A lesion overlay is shown; the maximum of the colour scale corresponds to the number of patients in the group. Below this, four representative individual clinical scans are shown, with manually delineated lesions indicated in yellow. These four individuals are objectively representative of the group as described in the text. Right: Observed QAB scores are presented: first the overall scores, and then subscores for word comprehension (‘word comp’), sentence comprehension (‘sentence comp’), word finding, grammatical construction (‘gram constr’), phonological encoding (‘phonological enc’), speech motor programming (‘speech mot prog’, i.e. the absence of AoS), speech motor execution (‘speech mot exec’, i.e. the absence of dysarthria), and reading. Circles indicate patients with aphasia at the initial time point, and triangles indicate patients without aphasia at the initial time point, per clinical judgment. Colours are arbitrary. Solid lines are plotted between temporally adjacent observations, and dotted lines between observations where intervening data were imputed. Thick grey lines indicate the group mean, and shaded grey areas indicate one standard deviation each side of the mean, i.e. ∼68% of patients in this group would be expected to lie in the shaded area. To enhance readability, scores are randomly slightly jittered for phonological encoding, speech motor programming, and speech motor execution, since these measures were scored on five-point scales. (B) F+d group patients (n = 22). (C) F+v group patients (n = 14). (D) FTP group patients (n = 15). One patient with presumptive right hemisphere dominance for language is shown with a grey marker and does not contribute to the mean or variance estimates.

